Compressive Sensing Approach to Harmonics Detection in the Ship Electrical Network †


Abstract
1. Introduction
- parameters describing the risk of loss of power supply continuity, and
- parameters of voltage and currents at all the points of the analyzed system.
2. Compressive Sensing Framework
2.1. Sparse Representation
2.2. Sensing Process
2.3. Reconstruction Condition
3. Reconstruction Algorithm
3.1. Relationship between Matrix Operations and the Radon Transform
3.2. Radon’s Inversion Formula
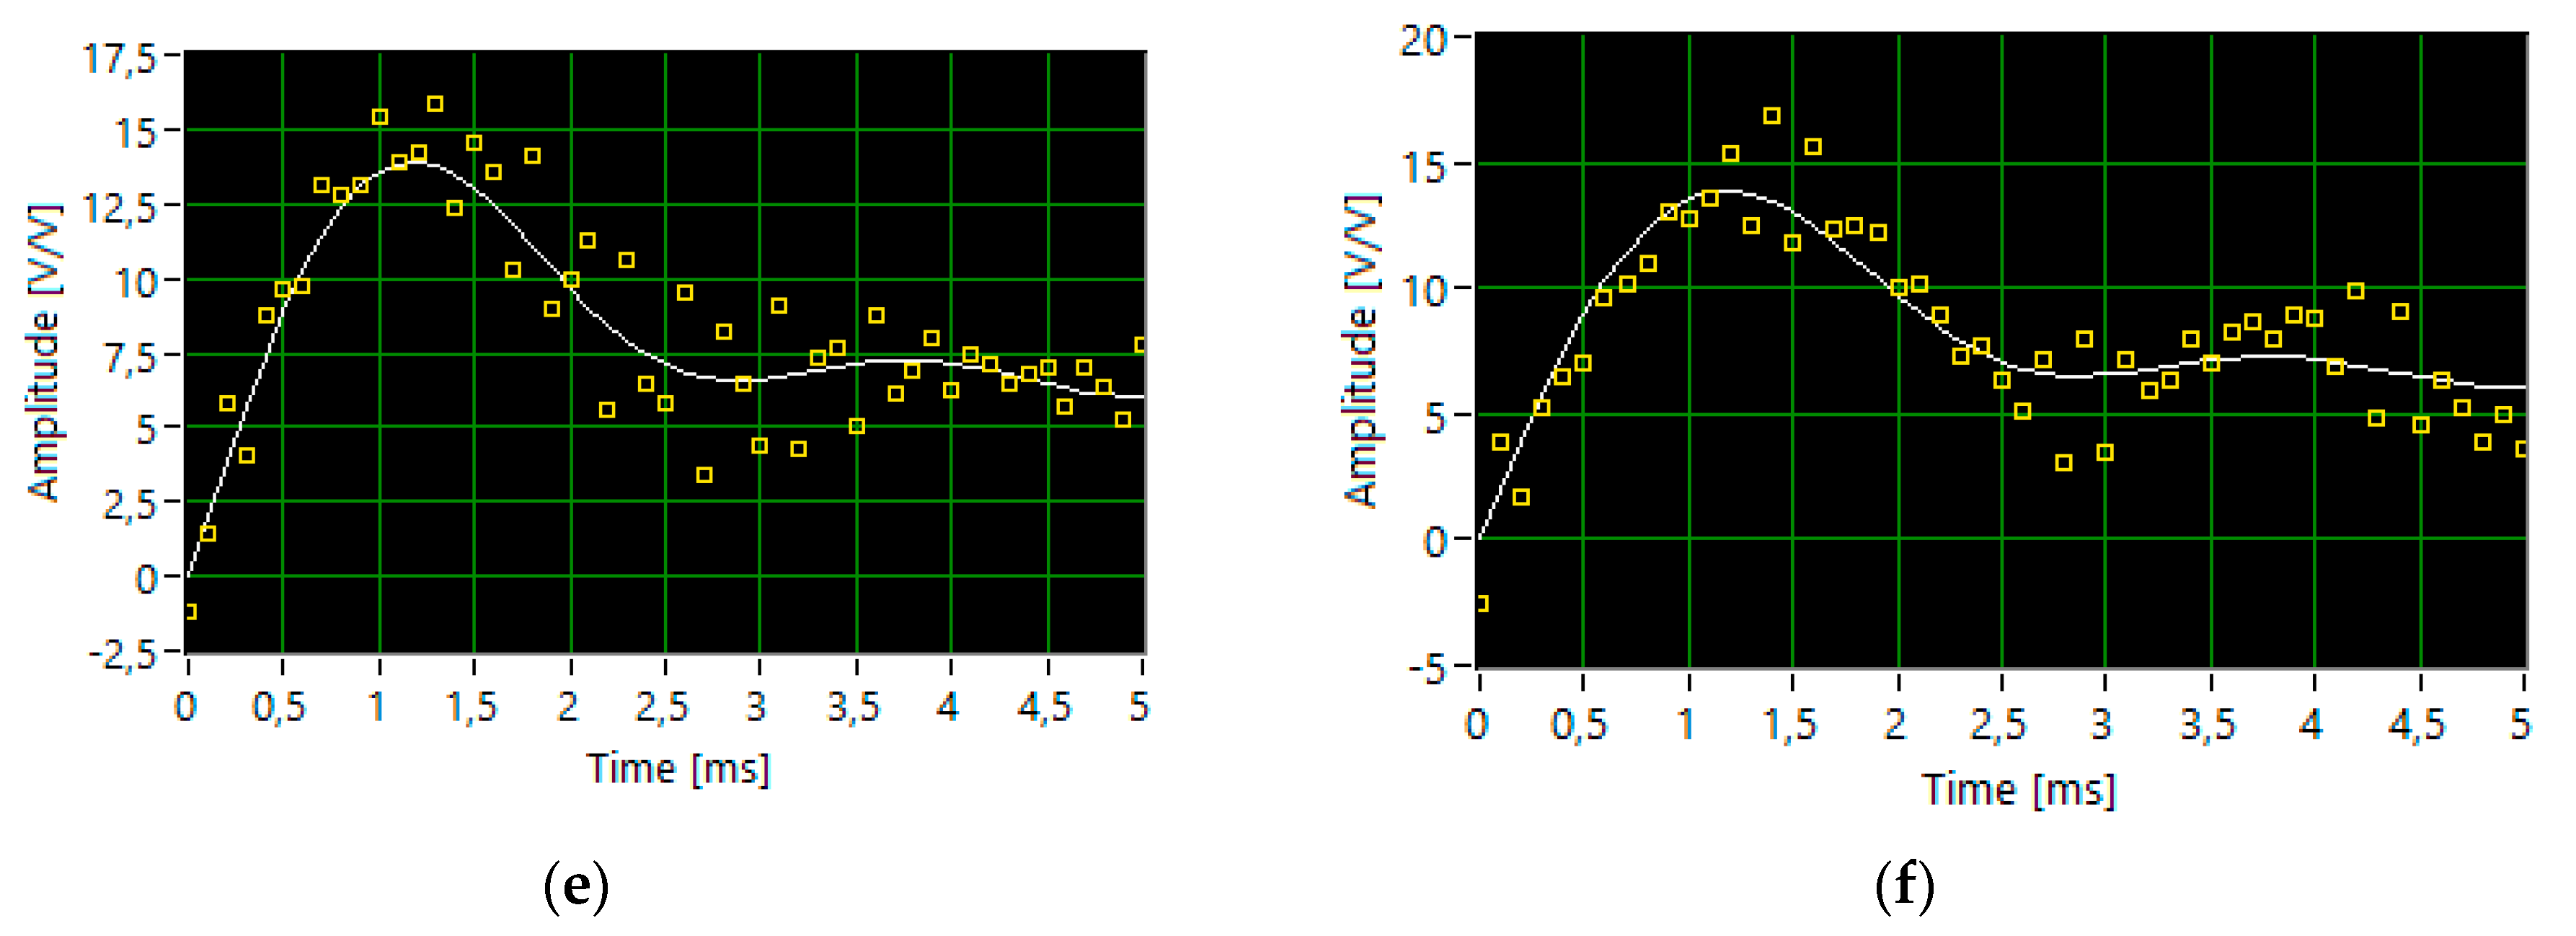
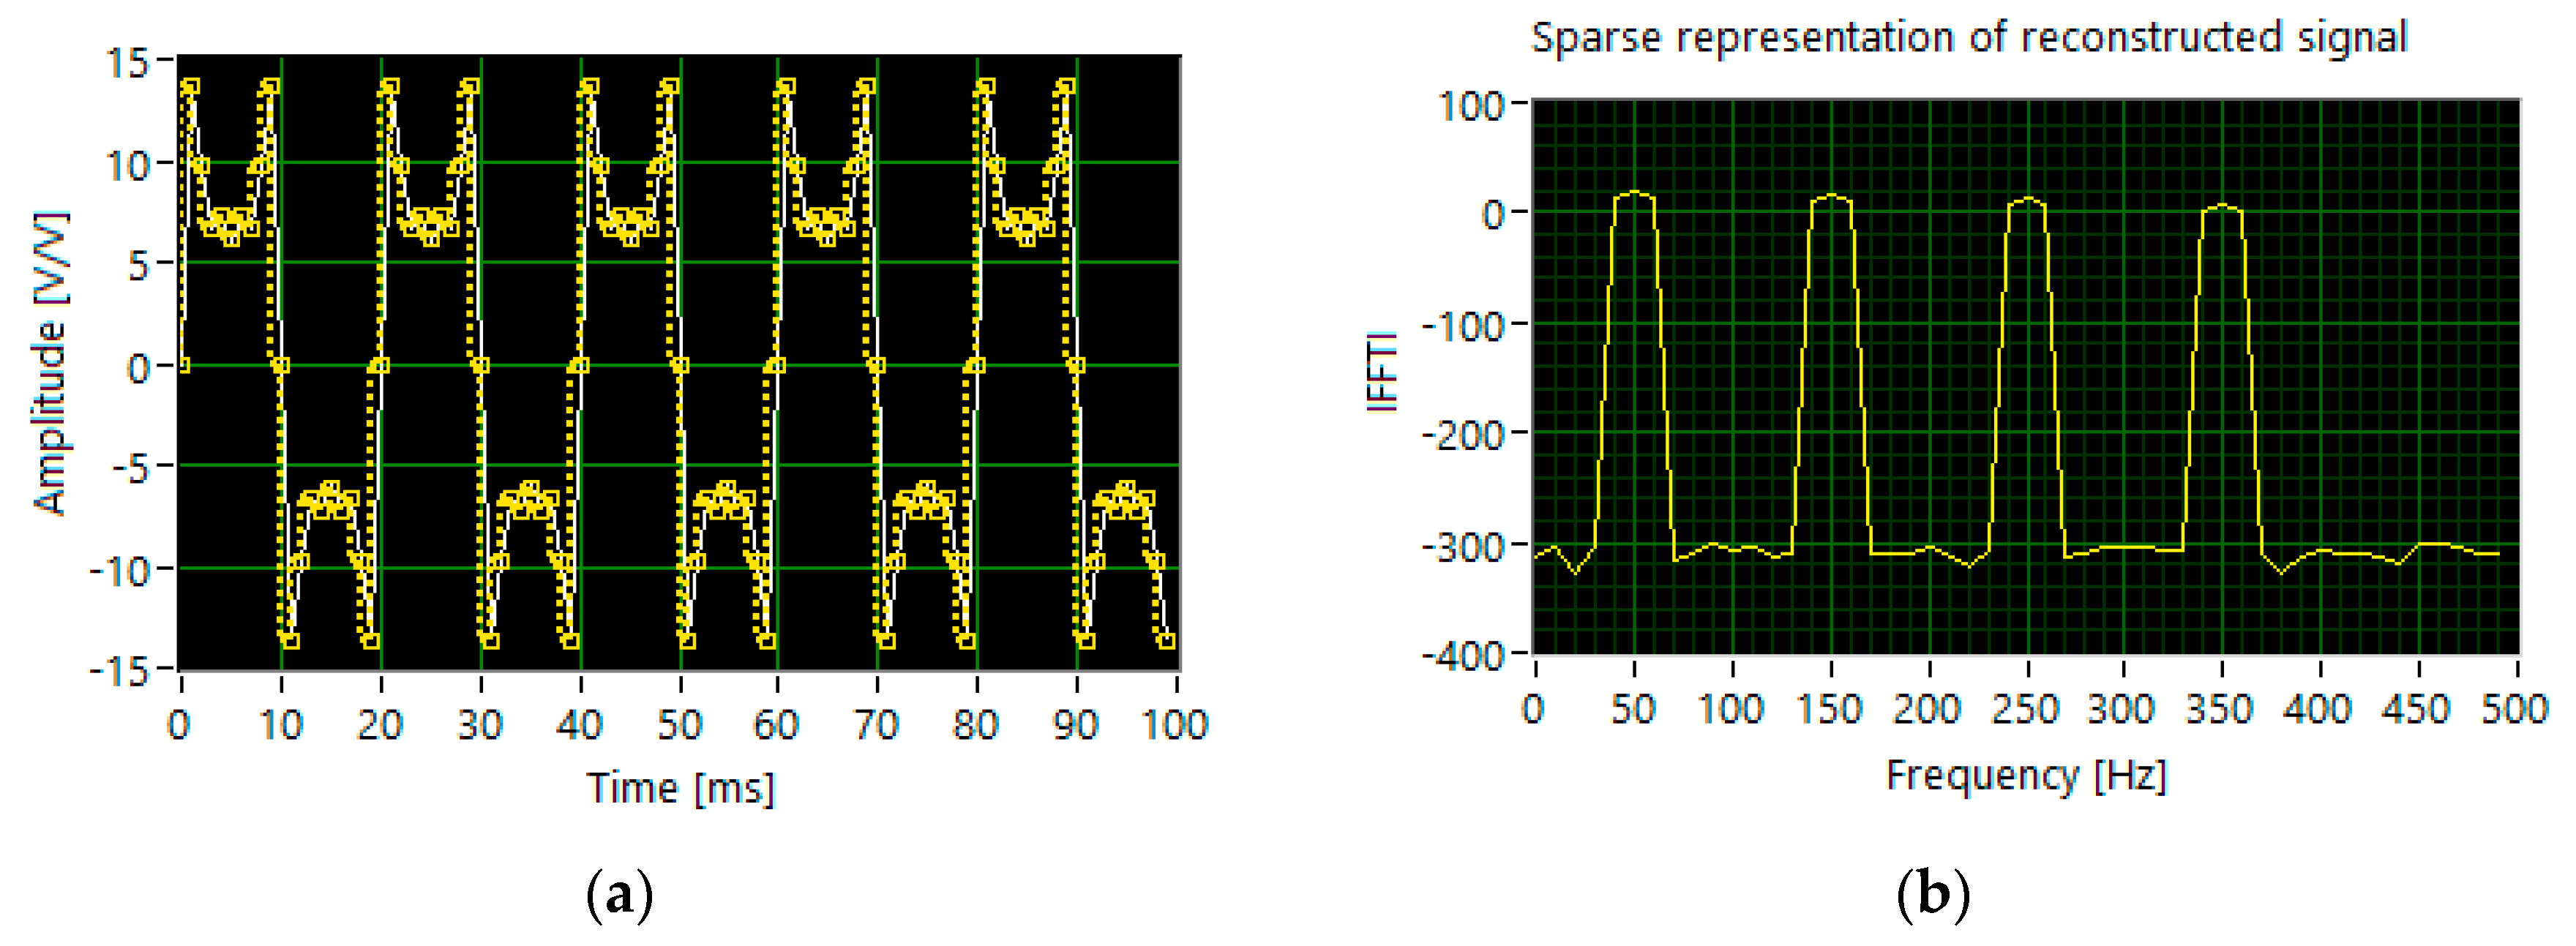
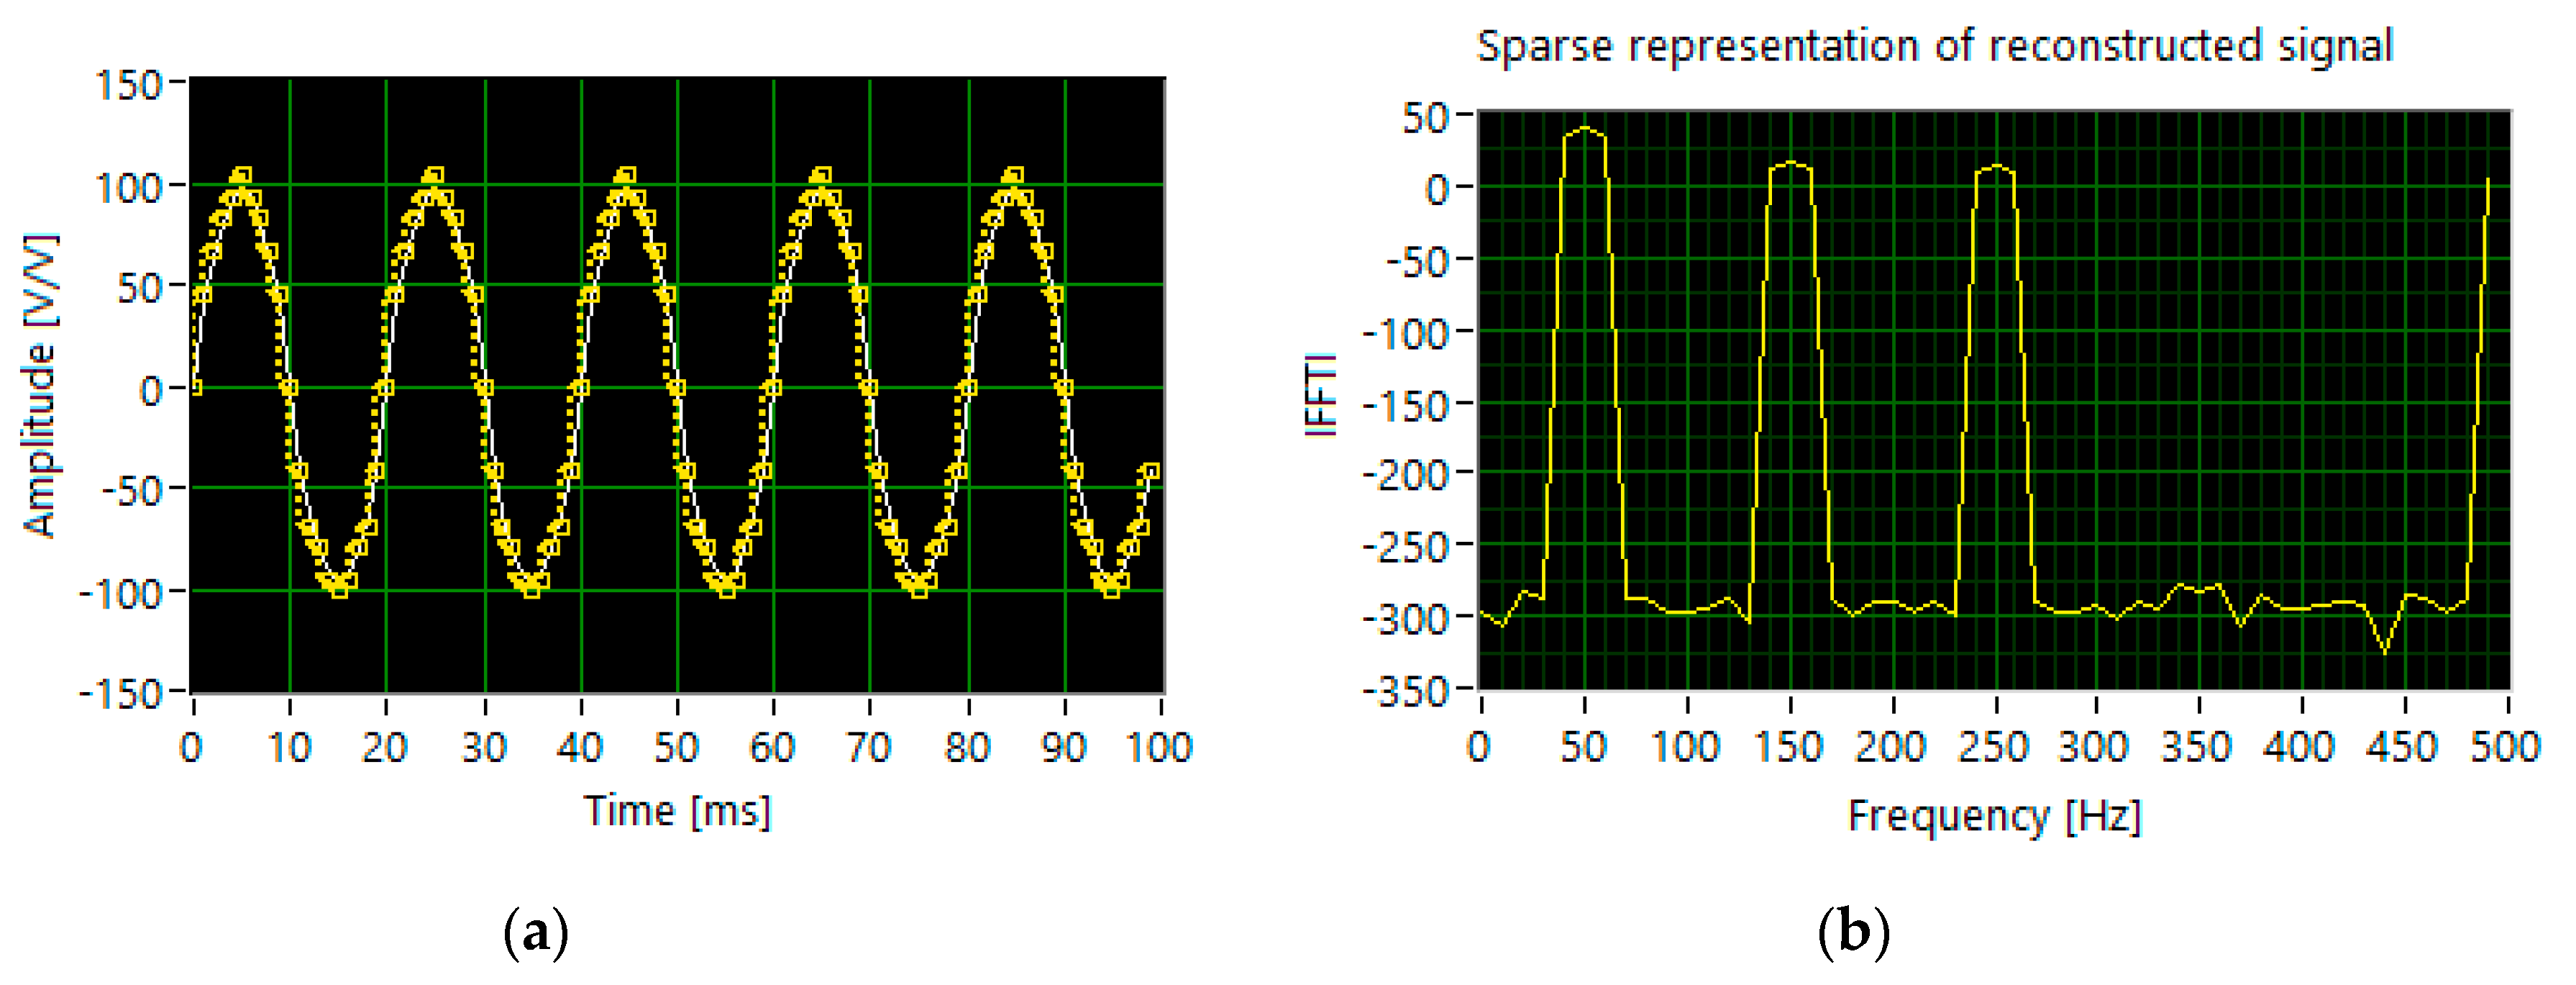
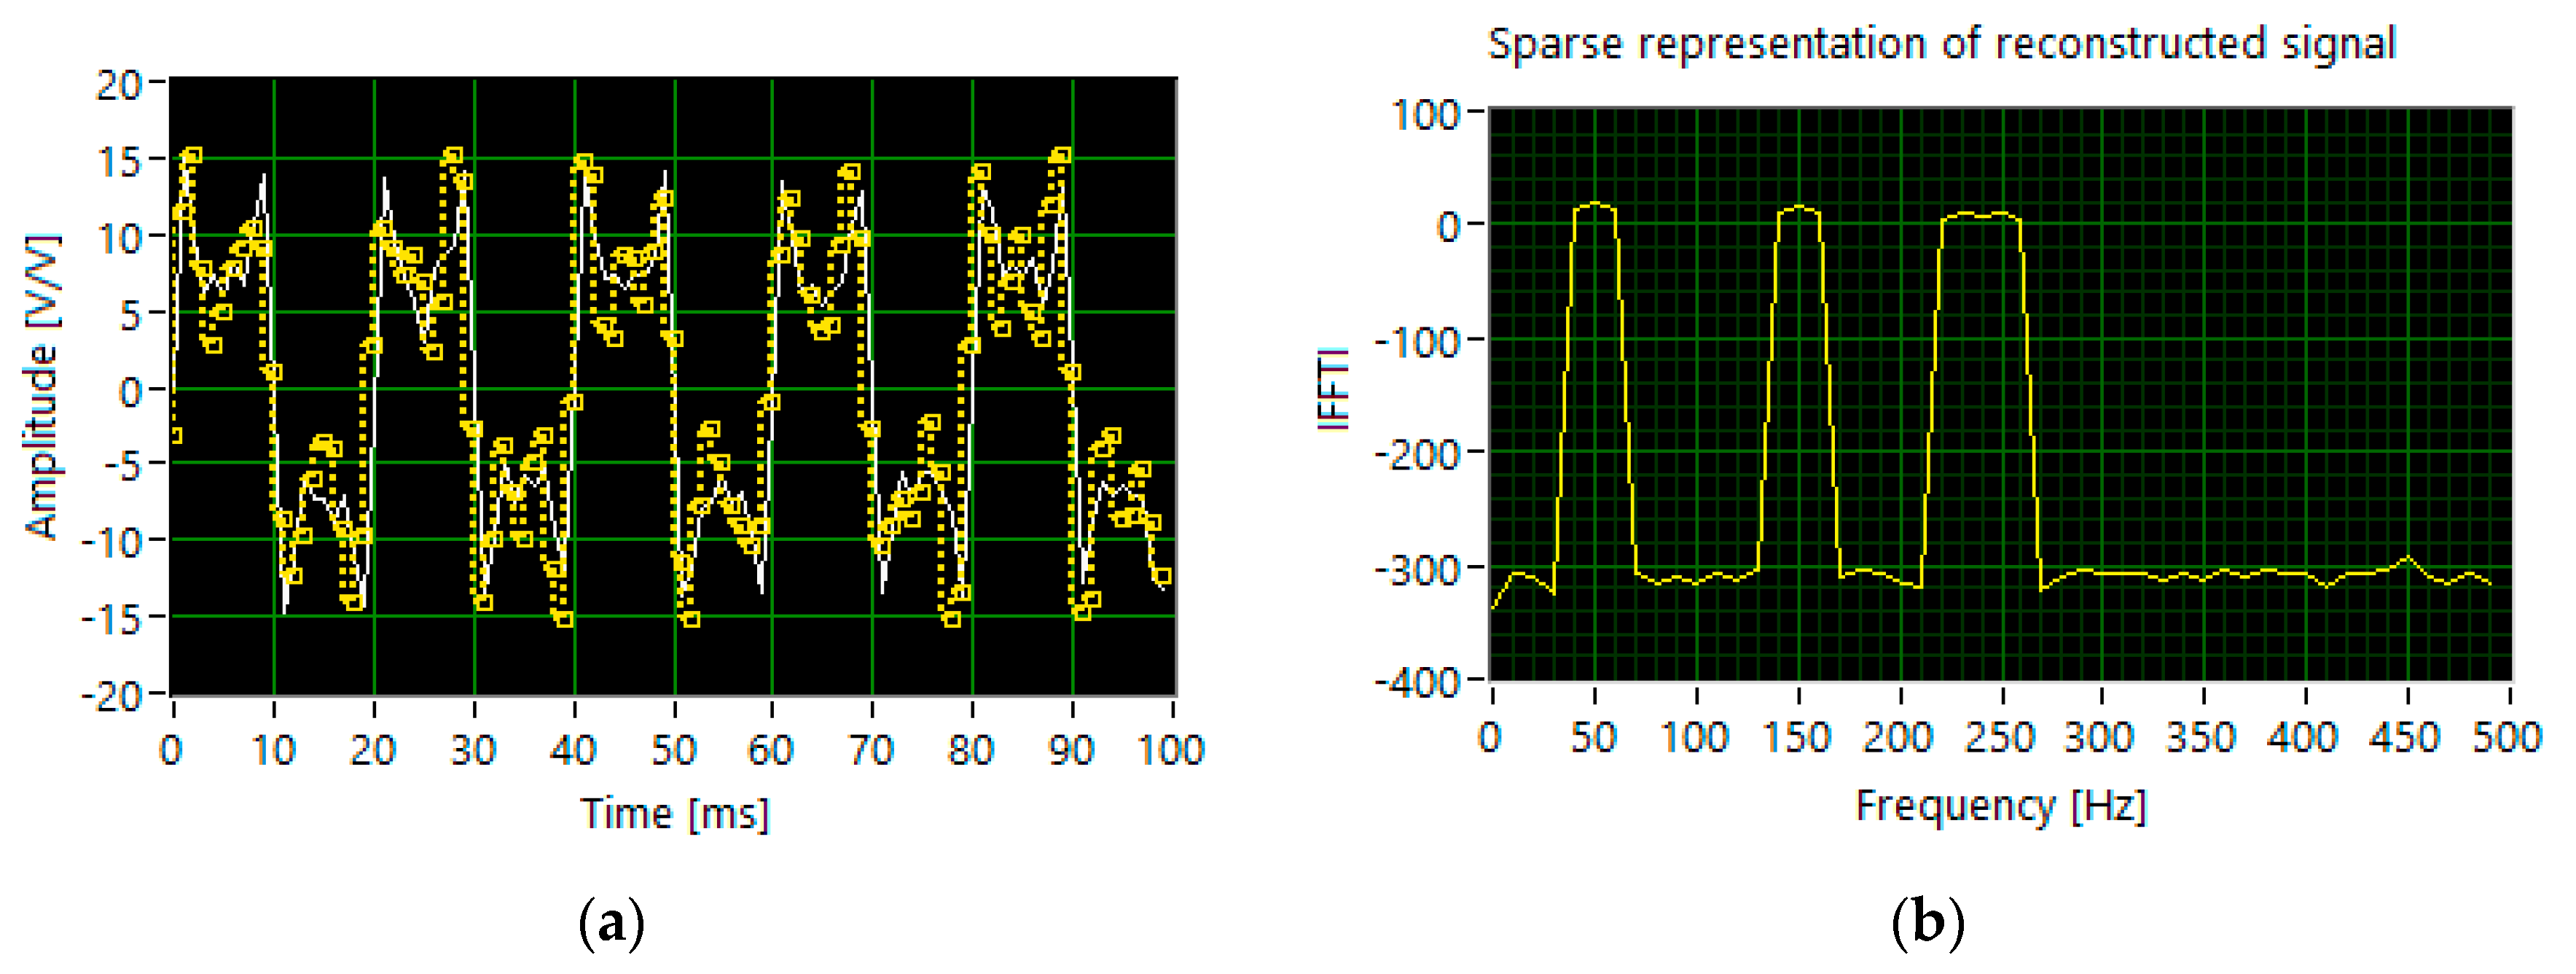
4. Numerical Simulations
5. Discussion
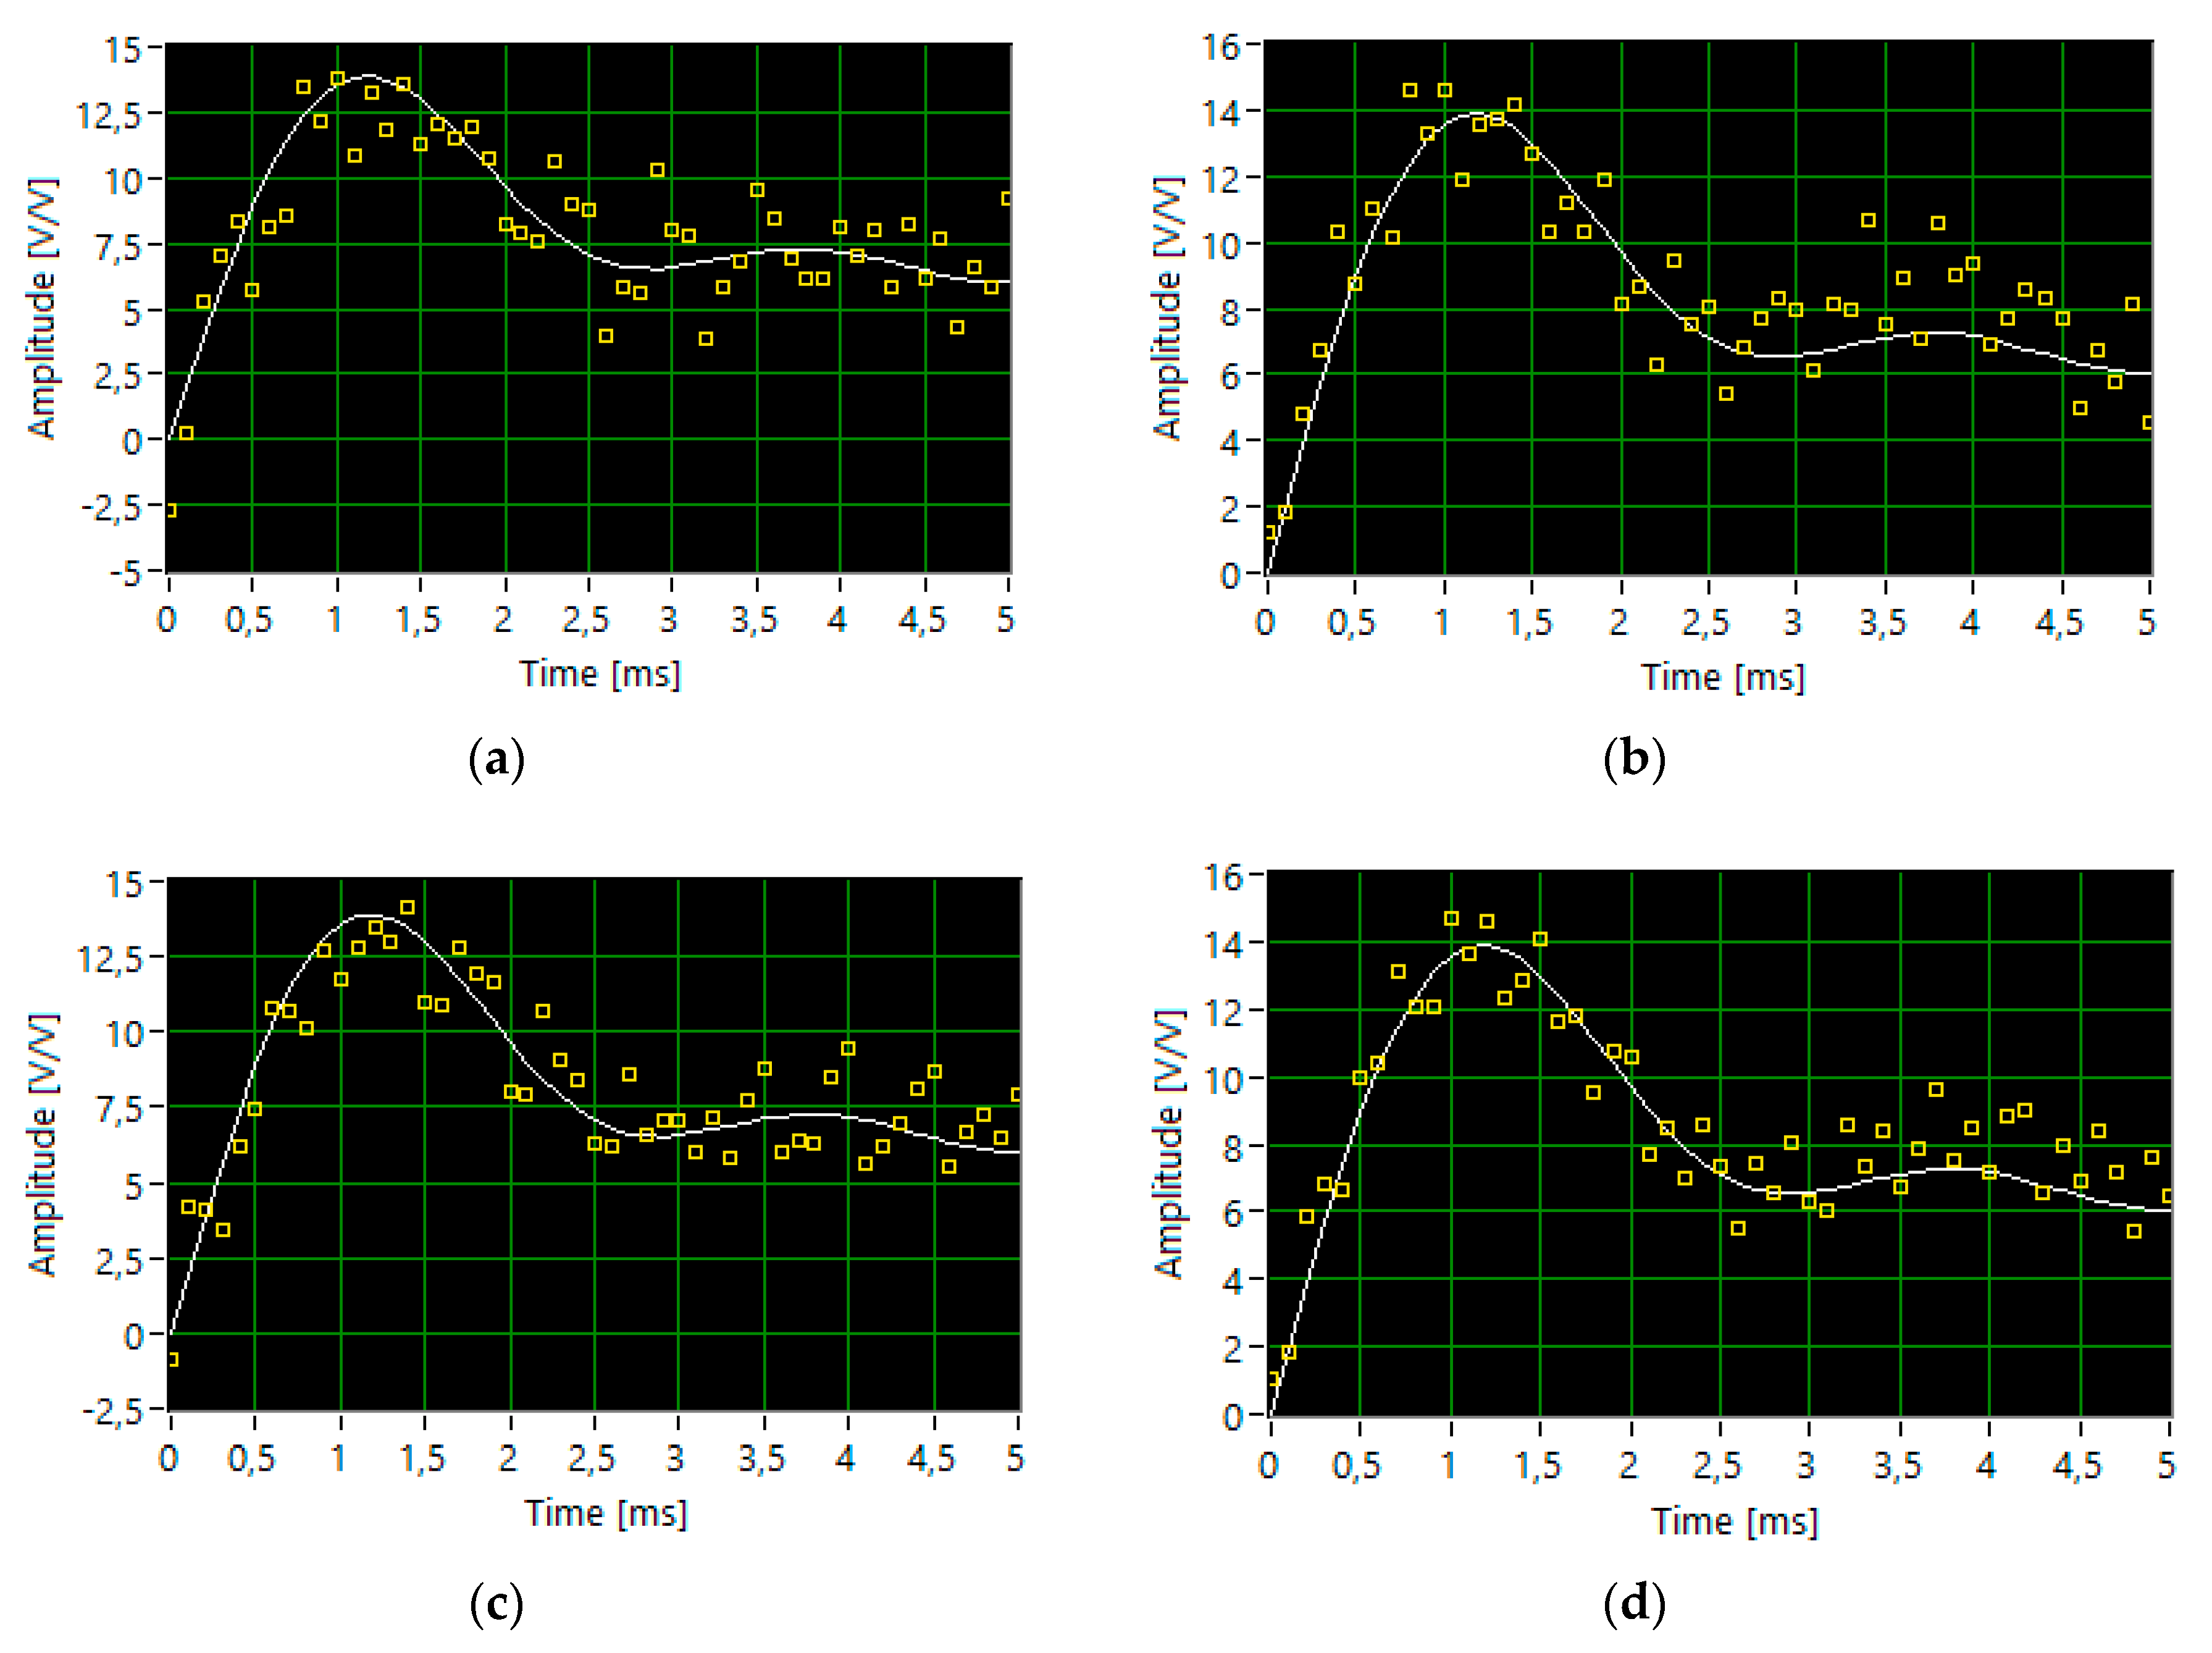
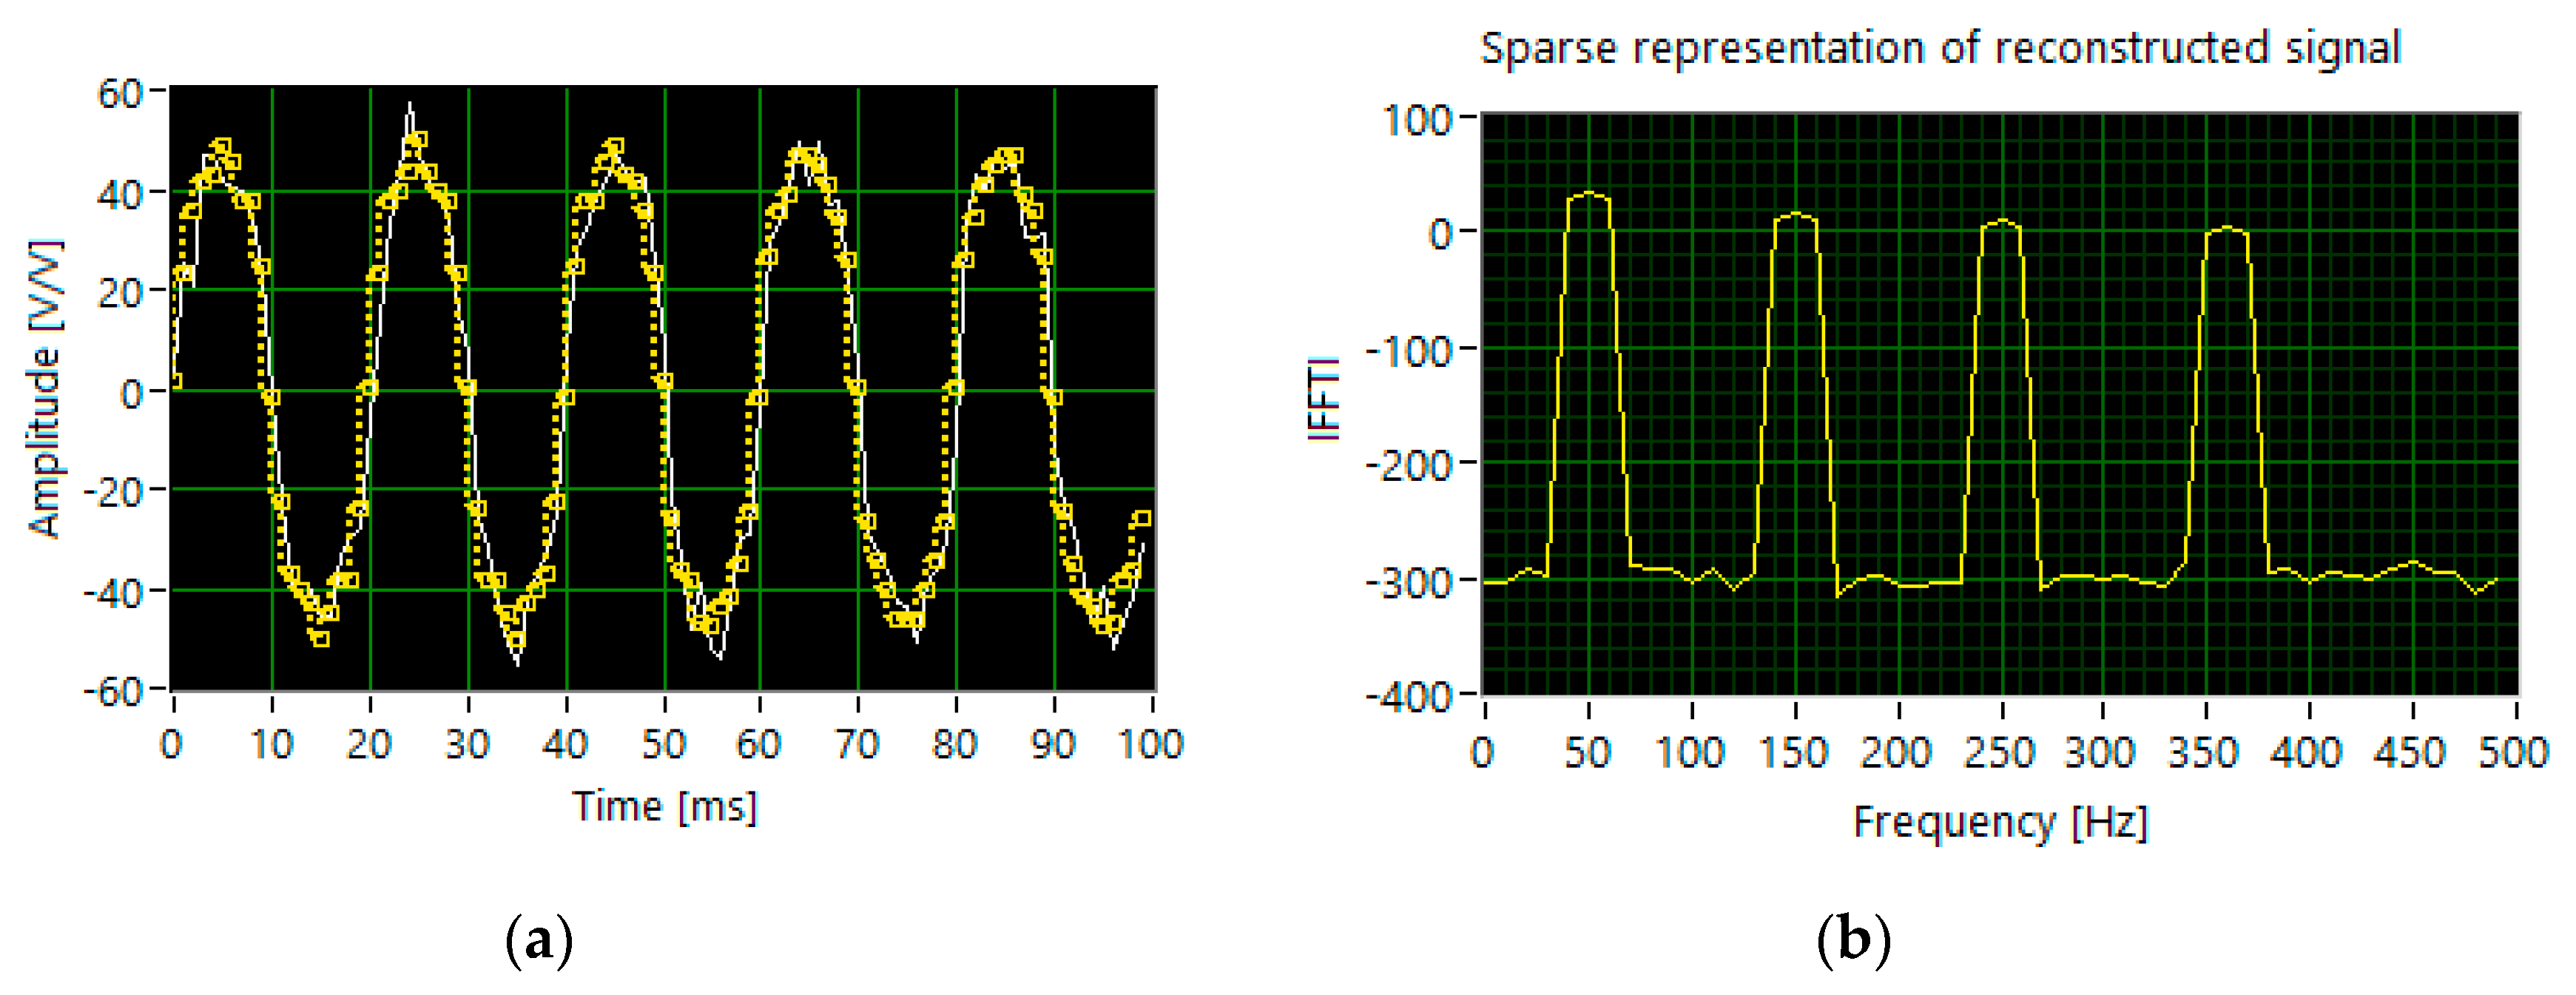
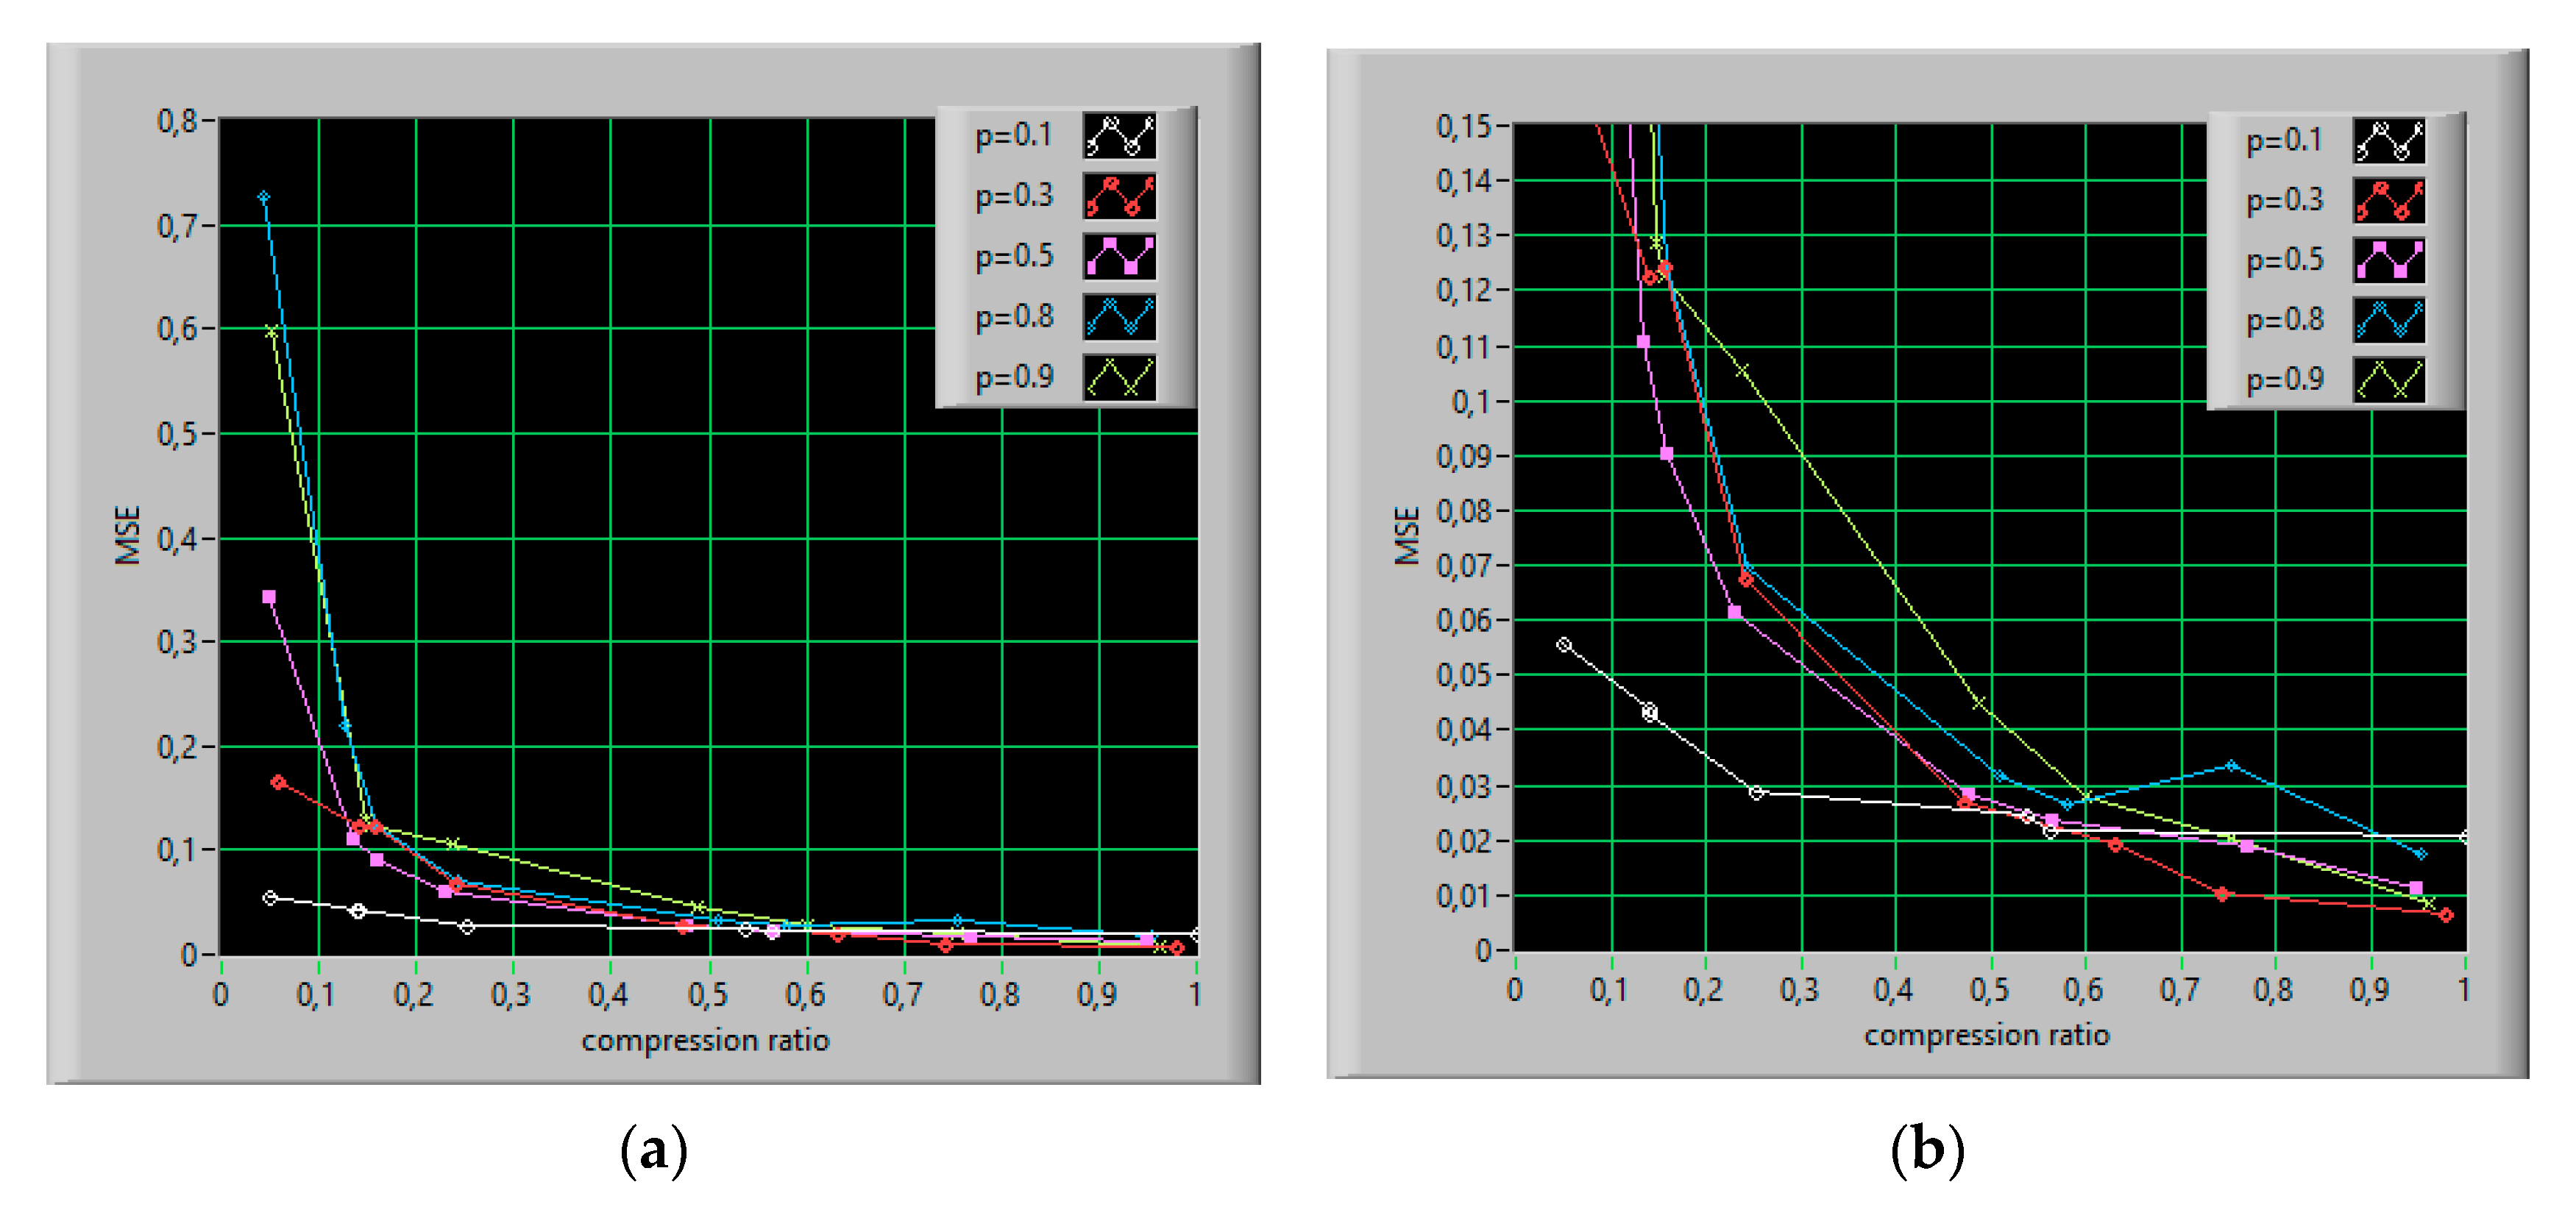
5.1. Reconstruction Accuracy
5.2. Frequency Detection Accuracy
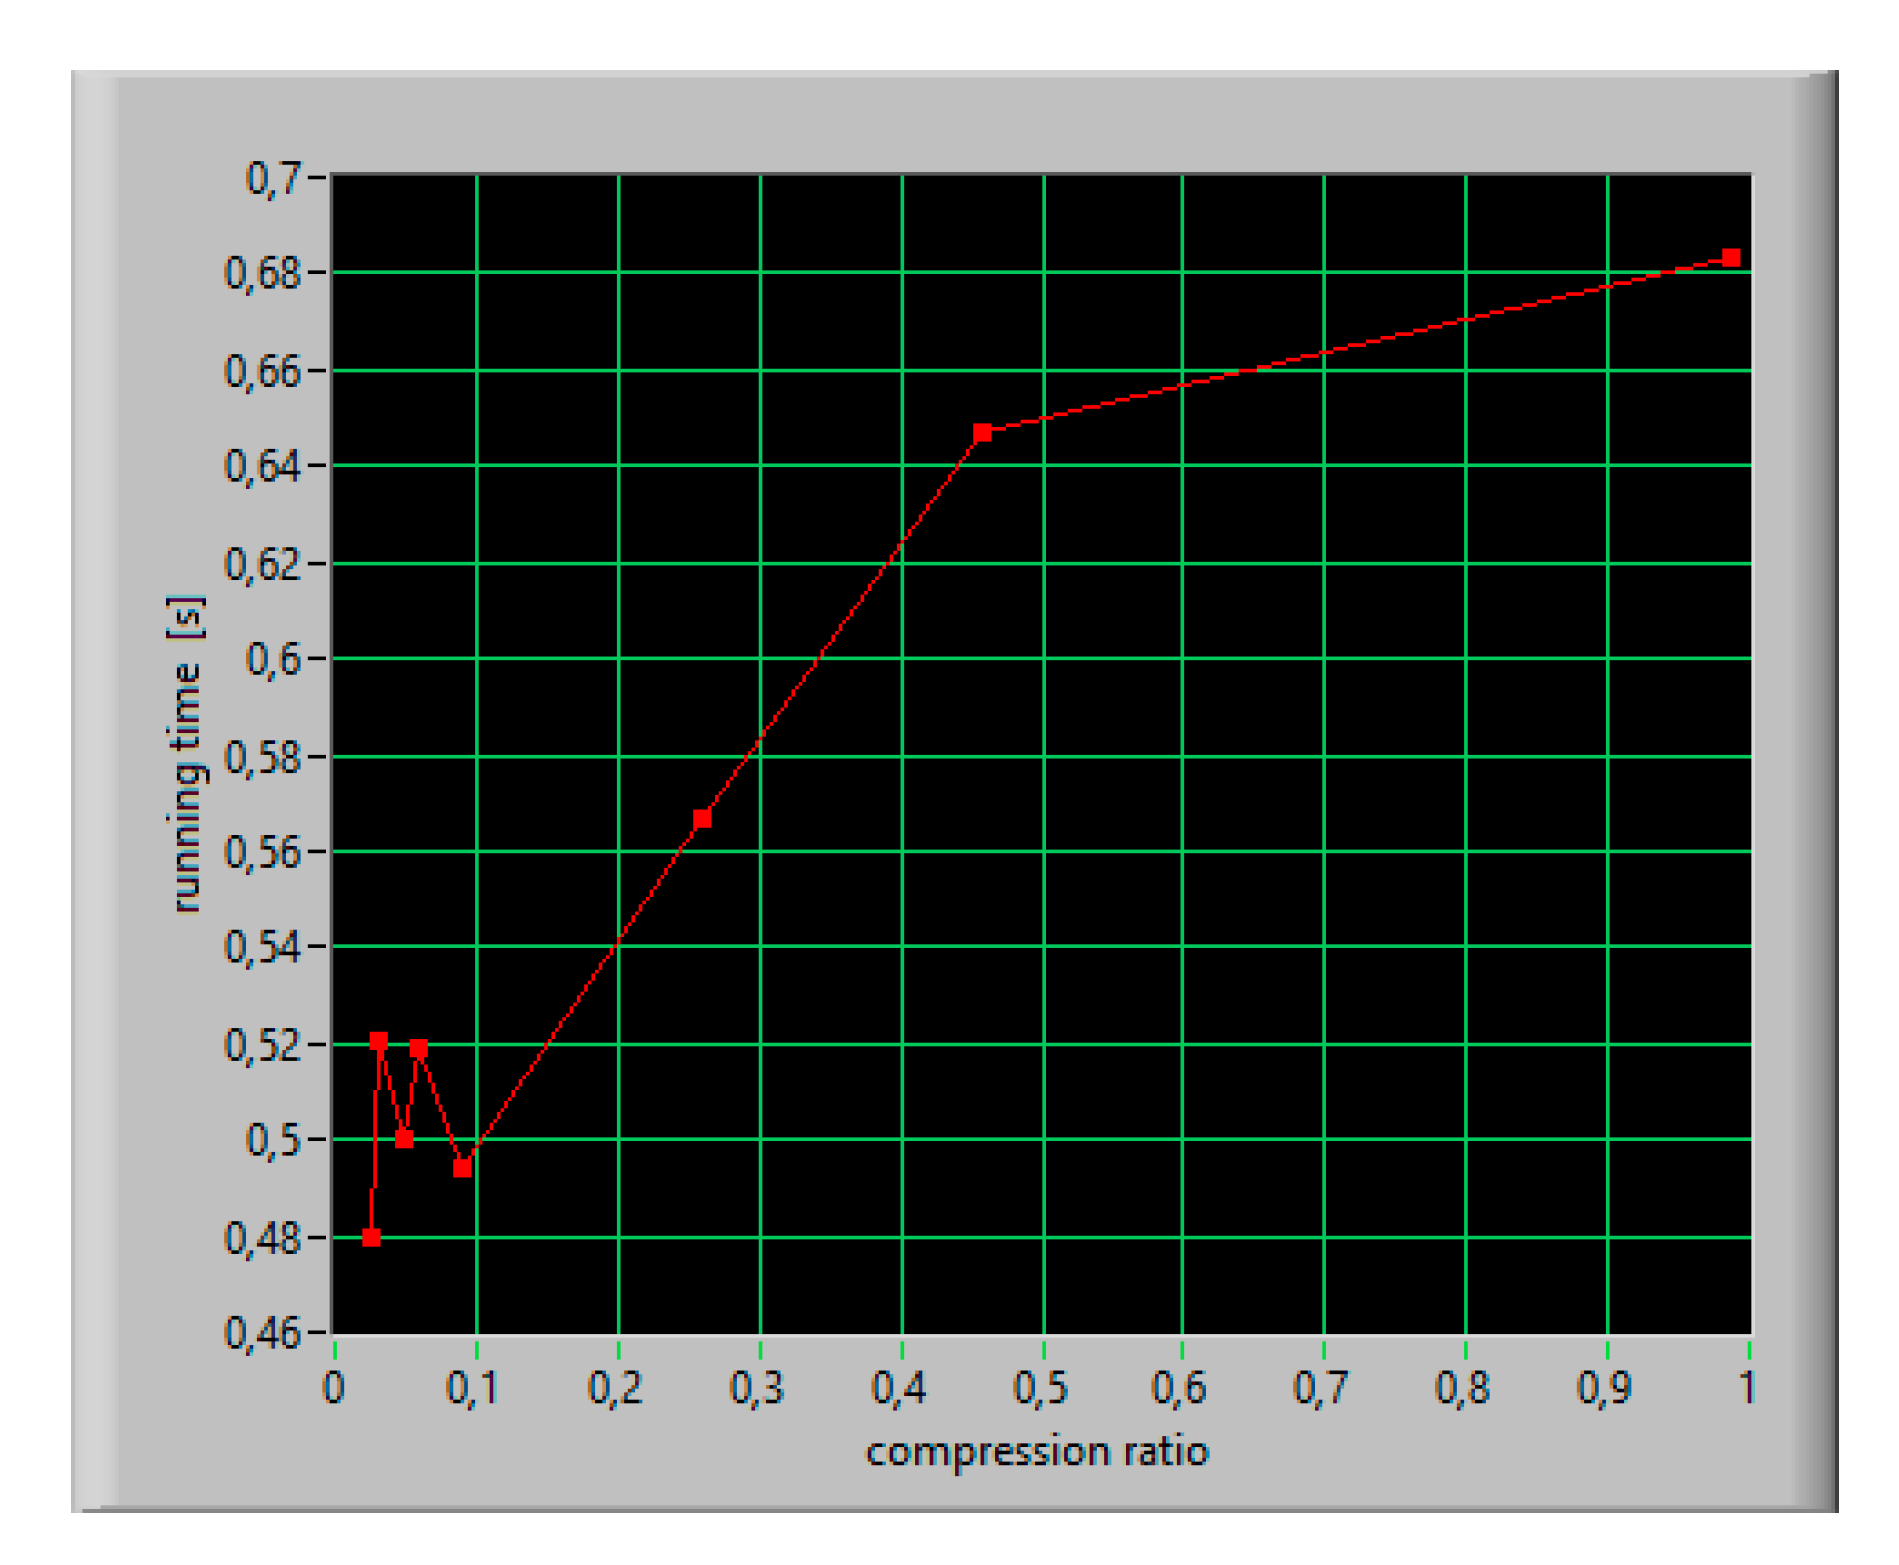
5.3. The Computation Burden
6. Conclusions
Author Contributions
Funding
Conflicts of Interest
Abbreviations
| CS | Compressive Sensing |
| PQ | Power Quality |
| IACS | International Association of Classification Societies |
| DFT | Discrete Fourier transform |
| FFT | Fast Fourier Transform |
| DRT | Discrete Radon Transform |
| IDRT | Inversion of the Discrete Radon Transform |
Nomenclature
| real signal | |
| N | length of signal |
| M | number of compressive measurements |
| K | size of sparsity |
| transformation matrix | |
| sparse transform domain coefficients | |
| Xk | vector of DFT coefficients |
| measurement matrix | |
| vector of acquired samples | |
| coherence | |
| reconstruction (sensing) matrix | |
| estimate of | |
| ℓ1 norm of | |
| p | the ones probability of the Bernoulli distribution |
References
- Mindykowski, J. Contemporary challenges to power quality in ship. In Proceedings of the 22nd IMEKO TC4 International Symposium & 20th International Workshop on ADC Modelling and Testing, Iasi, Romania, 14–15 September 2017. [Google Scholar]
- International Association of Classification Societies. Requirements Concerning Electrical and Electronic Installations, Harmonic Distortion for Ship Electrical Distribution System including Harmonic Filters. Available online: http://www.iacs.org.uk/publications/unified-requirements/ur-e/ur-e24-rev1-cln/ (accessed on 10 May 2020).
- Palczynska, B.; Tarasiuk, T. Method of measurement of voltage properties on bus bars of ship’s main switchboard—tools and preliminary results. Polish Marit. Res. 2000, 2, 8–11. [Google Scholar]
- Palczynska, B.; Spiralski, L.; Turczynski, J. The new method of interference assessment in low-voltage power supply lines. In Proceedings of the 11th IMEKO TC-4 Symposium—Trends in Electrical Measurement and Instrumentation, Lisbon, Portugal, 13–14 September 2001. [Google Scholar]
- Candes, E.; Wakin, M. An Introduction to compressive sampling. IEEE Signal Process. Mag. 2008, 25, 21–30. [Google Scholar] [CrossRef]
- Baraniuk, R.G. Compressive sensing. IEEE Signal Process. Mag. 2007, 24, 118–124. [Google Scholar] [CrossRef]
- Davenport, M.A.; Boufounos, P.; Wakin, M.; Baraniuk, R. Signal Processing With Compressive Measurements. IEEE J. Sel. Top. Sig. Proces. 2010, 4, 445–460. [Google Scholar] [CrossRef]
- Donoho, D. Compressed Sensing. IEEE Trans. Inf. Theory 2006, 52, 1289–1306. [Google Scholar] [CrossRef]
- Duartea, M.F.; Baraniuk, R.G. Spectral compressive sensing sparse signal. Appl. Comput. Harmon. Anal. 2013, 35, 111–129. [Google Scholar] [CrossRef]
- Palczynska, B.; Masnicki, R.; Mindykowski, J. Harmonics detection in frequency sparse signal. In Proceedings of the 2019 IMEKO International Workshop on Metrology for the Sea (MetroSea 2019), Genova, Italy, 3–5 October 2019. [Google Scholar]
- Palczynska, B. Signal Reconstruction from Sparse Measurements Using Compressive Sensing Technique. In Lecture Notes in Electrical Engineering; Springer: Berlin/Heidelberg, Germany, 2019. [Google Scholar]
- Andráš, I.; Dolinský, P.; Michaeli, L.; Saliga, J. A time domain reconstruction method of randomly sampled frequency sparse signal. Measurement 2018, 127, 68–77. [Google Scholar] [CrossRef]
- Rani, M.; Dhok, S.B.; Deshmukh, R.B. A Systematic Review of Compressive Sensing: Concepts, Implementations and Applications. IEEE Access 2018, 6, 4875–4894. [Google Scholar] [CrossRef]
- Palczynska, B.; Swisulski, D. Sparse representation of a non-stationary signal in compressive sensing technique. Przegląd Elektrotechniczny 2019, 11, 66–68. [Google Scholar]
- Tang, G.; Hou, W.; Wang, H.; Luo, G.; Ma, J. Compressive Sensing of Roller Bearing Faults via Harmonic Detection from Under-Sampled Vibration Signals. Sensors 2015, 15, 25648–25662. [Google Scholar] [CrossRef]
- Palczynska, B. Identification of Non-Stationary Magnetic Field Sources Using the Matching Pursuit Method. Energies 2017, 10, 655. [Google Scholar] [CrossRef]
- Kustanovich, Z.; Levron, Y. Applications of compressed sensing for locating harmonic distortions in power systems. In Proceedings of the 2015 IEEE International Conference on Microwaves, Communications, Antennas and Electronic Systems (COMCAS), Tel Aviv, Israel, 2–4 November 2015. [Google Scholar]
- Bonavolontà, F.; D’Apuzzo, M.; Liccardo, A.; Miele, G. Harmonic and interharmonic measurements through a compressed sampling approach. Measurement 2016, 1–15. [Google Scholar] [CrossRef]
- Bonavolonta, F.; D’Arco, M.; Ianniello, G.; Liccardo, A.; Schiano, R.; Moriello, L.o.; Ferrigno, L.; Laracca, M.; Miele, G. On the suitability of compressive sampling for the measurement of electrical power quality. In Proceedings of the 2013 IEEE International Instrumentation and Measurement Technology Conference (I2MTC), Minneapolis, MN, USA, 6–9 May 2013. [Google Scholar]
- Carta, D.; Muscas, C.; Pegoraro, P.A.; Sulis, S. Harmonics detector in distribution systems based on compressive sensing. In Proceedings of the 2017 IEEE International Workshop on Applied Measurements for Power Systems (AMPS), Liverpool, UK, 20–22 September 2017. [Google Scholar]
- Carta, D.; Muscas, C.; Pegoraro, P.A.; Sulis, S. Identification and Estimation of Harmonic Sources Based on Compressive Sensing. IEEE Trans. Instrum. Meas. 2019, 68, 95–104. [Google Scholar] [CrossRef]
- Yang, L.; Fang, J.; Duan, H.; Li, H. Fast Compressed Power Spectrum Estimation: Toward a Practical Solution for Wideband Spectrum Sensing. IEEE Trans. Wirel. Commun. 2020, 19, 520–532. [Google Scholar] [CrossRef]
- Angrisani, L.; Bonavolonta, F.; D’Apuzzo, M.; Schiano, R.; Moriello, L.; Vadursi, M. A compressive sampling based method for power measurement of band-pass signals. In Proceedings of the IEEE International Instrumentation and Measurement Technology Conference (I2MTC), Minneapolis, MN, USA, 6–9 May 2013. [Google Scholar]
- Manikandan, M.S.; Samantaray, S.R.; Kamwa, I. Detection and Classification of Power Quality Disturbances Using Sparse Signal Decomposition on Hybrid Dictionaries. IEEE Trans. Instrum. Meas. 2015, 64, 27–38. [Google Scholar] [CrossRef]
- Zhao, H.; Irshad, M.J.; Shi, H.; Xu, W. Passive Source Localization Using Compressive Sensing. Sensors 2019, 19, 4522. [Google Scholar] [CrossRef]
- Palczynska, B. Fast harmonics identification based on a compressive sensing approach. Przeglad Elektrotechniczny 2019, 11, 69–71. [Google Scholar]
- Wang, X.; Tian, L.; Gao, Y.; Hou, Y. Analysis of power quality disturbance signal based on improved compressed sensing reconstruction algorithm. In Proceedings of the 2017 IEEE Transportation Electrification Conference and Expo, Asia-Pacific (ITEC Asia-Pacific), Harbin, China, 7–10 August 2017. [Google Scholar]
- Huang, S.; Sun, H.; Yu, L. A Class of Deterministic Sensing Matrices and Their Application in Harmonic Detection. Circuits Syst. Signal. Process 2016, 35, 4183–4194. [Google Scholar] [CrossRef]
- Xue, S.; Ji, Y.; Carin, L. Bayesian Compressive Sensing. IEEE Trans. Signal Process. 2008, 56, 2346–2356. [Google Scholar] [CrossRef]
- Liu, S.; Zhang, Y.D.; Shan, T.; Tao, R. Structure-Aware Bayesian Compressive Sensing for Frequency-Hopping Spectrum Estimation with Missing Observations. IEEE Trans. Signal Process. 2018, 66, 2153–2166. [Google Scholar] [CrossRef]
- Kyriakide, I.; Pribić, R. Bayesian compressive sensing using Monte Carlo methods. In Proceedings of the 21st European Signal Processing Conference (EUSIPCO 2013), Marrakech, Morocco, 9–13 September 2013. [Google Scholar]
- Lohit, S.; Kulkarni, K.; Turaga, P. Direct inference on compressive measurements using convolutional neural networks. In Proceedings of the 2016 IEEE International Conference on Image Processing (ICIP), Phoenix, AZ, USA, 25–28 September 2016. [Google Scholar]
- Kulkarni, K.; Turaga, P. Reconstruction-Free Action Inference from Compressive Imagers. IEEE Trans. Pattern Anal. Mach. Intell. 2016, 38, 772–784. [Google Scholar] [CrossRef] [PubMed]
- Kwan, C.; Chou, B.; Yang, J.; Tran, T. Deep Learning Based Target Tracking and Classification for Infrared Videos Using Compressive Measurements. J. Signal Inf. Process. 2019, 10, 167–199. [Google Scholar] [CrossRef][Green Version]
- Kwan, C.; Chou, B.; Yang, J.; Rangamani, A.; Tran, T.; Zhang, J.; Etienne-Cummings, R. Deep Learning-Based Target Tracking and Classification for Low Quality Videos Using Coded Aperture Cameras. Sensors 2019, 19, 3702. [Google Scholar] [CrossRef] [PubMed]
- Nouasria, H.; Ettolba, H. New constructions of Bernoulli and Gaussian sensing matrices for compressive sensing. In Proceedings of the 2017 International Conference on Wireless Networks and Mobile Communications (WINCOM), Rabat, Morocco, 1–4 November 2017. [Google Scholar]
- Zhang, G.; Jiao, S.; Xu, X.; Wang, L. Compressed sensing and reconstruction with Bernoulli matrices. In Proceedings of the 2010 IEEE International Conference on Information and Automation, Harbin, China, 20–24 June 2010. [Google Scholar]
- Toft, P.A. The Radon Transform—Theory and Implementation. Ph.D. Thesis, Technical University of Denmark, Kgs. Lyngby, Denmark, 1996. [Google Scholar]
- Aharchaou, M.; Levander, A. A compressive sensing approach to the high-resolution linear Radon transform: Application on teleseismic wavefields. Geophys. J. Int. 2016, 207, 811–822. [Google Scholar] [CrossRef]
- Ou, G.; Lun, D.; Ling, B. Compressive sensing of images based on discrete periodic Radon transform. Electron. Lett. 2014, 50, 591–593. [Google Scholar] [CrossRef]
- Perez, L. Compressive Data Acquisition with LabVIEW. Available online: https://forums.ni.com/t5/Example-Programs/Compressive-Data-Acquisition-with-LabVIEW/ (accessed on 2 April 2020).
- Process Lasso. Real-Time CPU Optimization and Automation. Available online: https://bitsum.com/ (accessed on 30 April 2020).
- Mishra, A.K.; Verster, R.S. Compressive Sensing Based Algorithms for Electronic Defence; Springer: Berlin/Heidelberg, Germany, 2017. [Google Scholar]


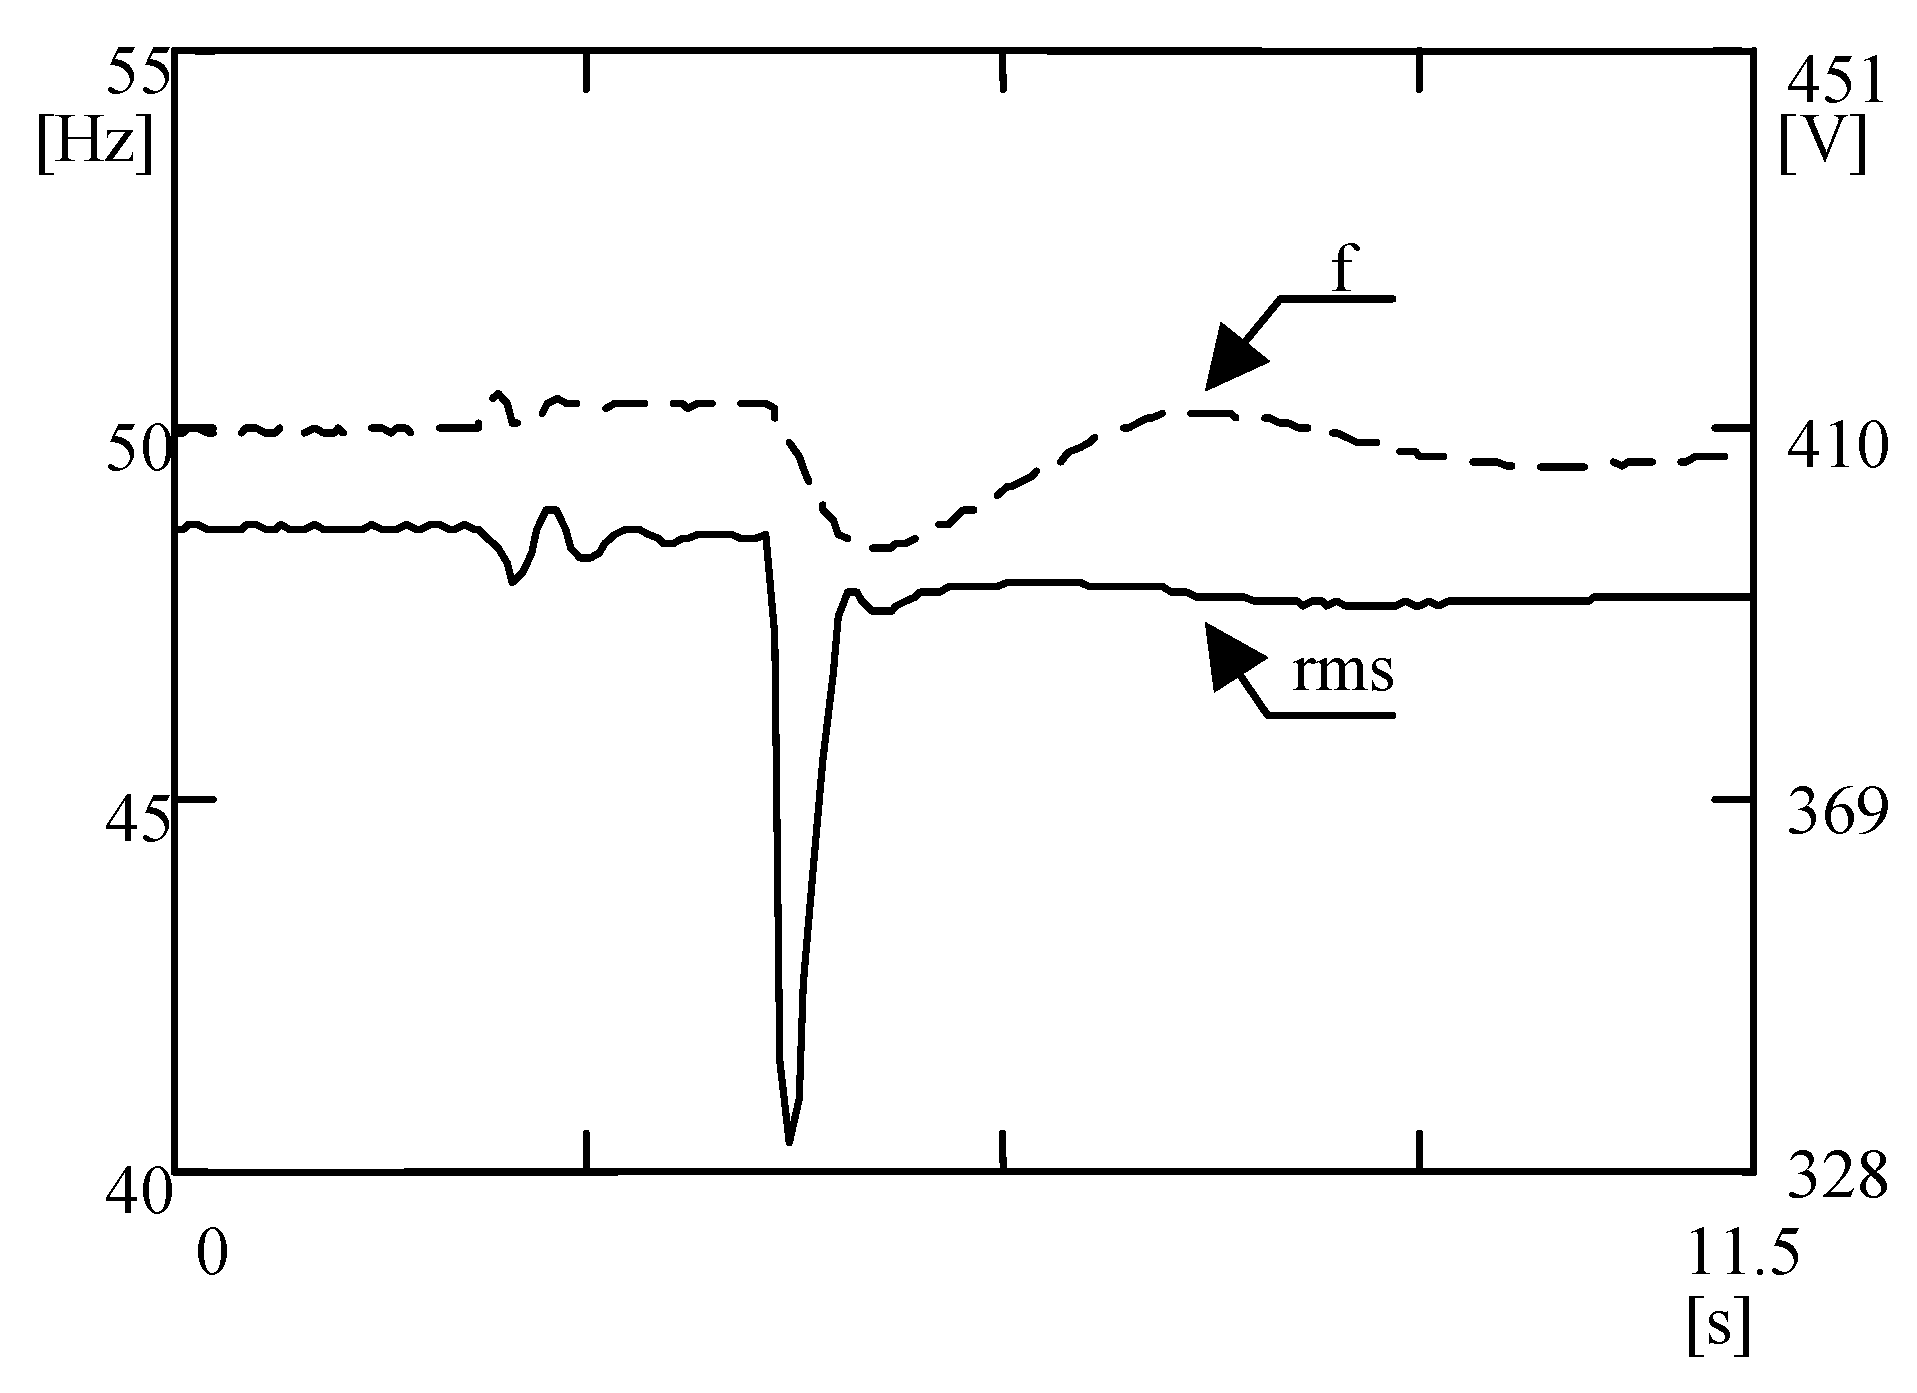
| Statistics | RMS Voltage (V) | Frequency (Hz) |
|---|---|---|
| mean | 389.097 | 49.778 |
| standard deviation | 2.337 | 0.044 |
| mode | 382.39 | 49.78 |
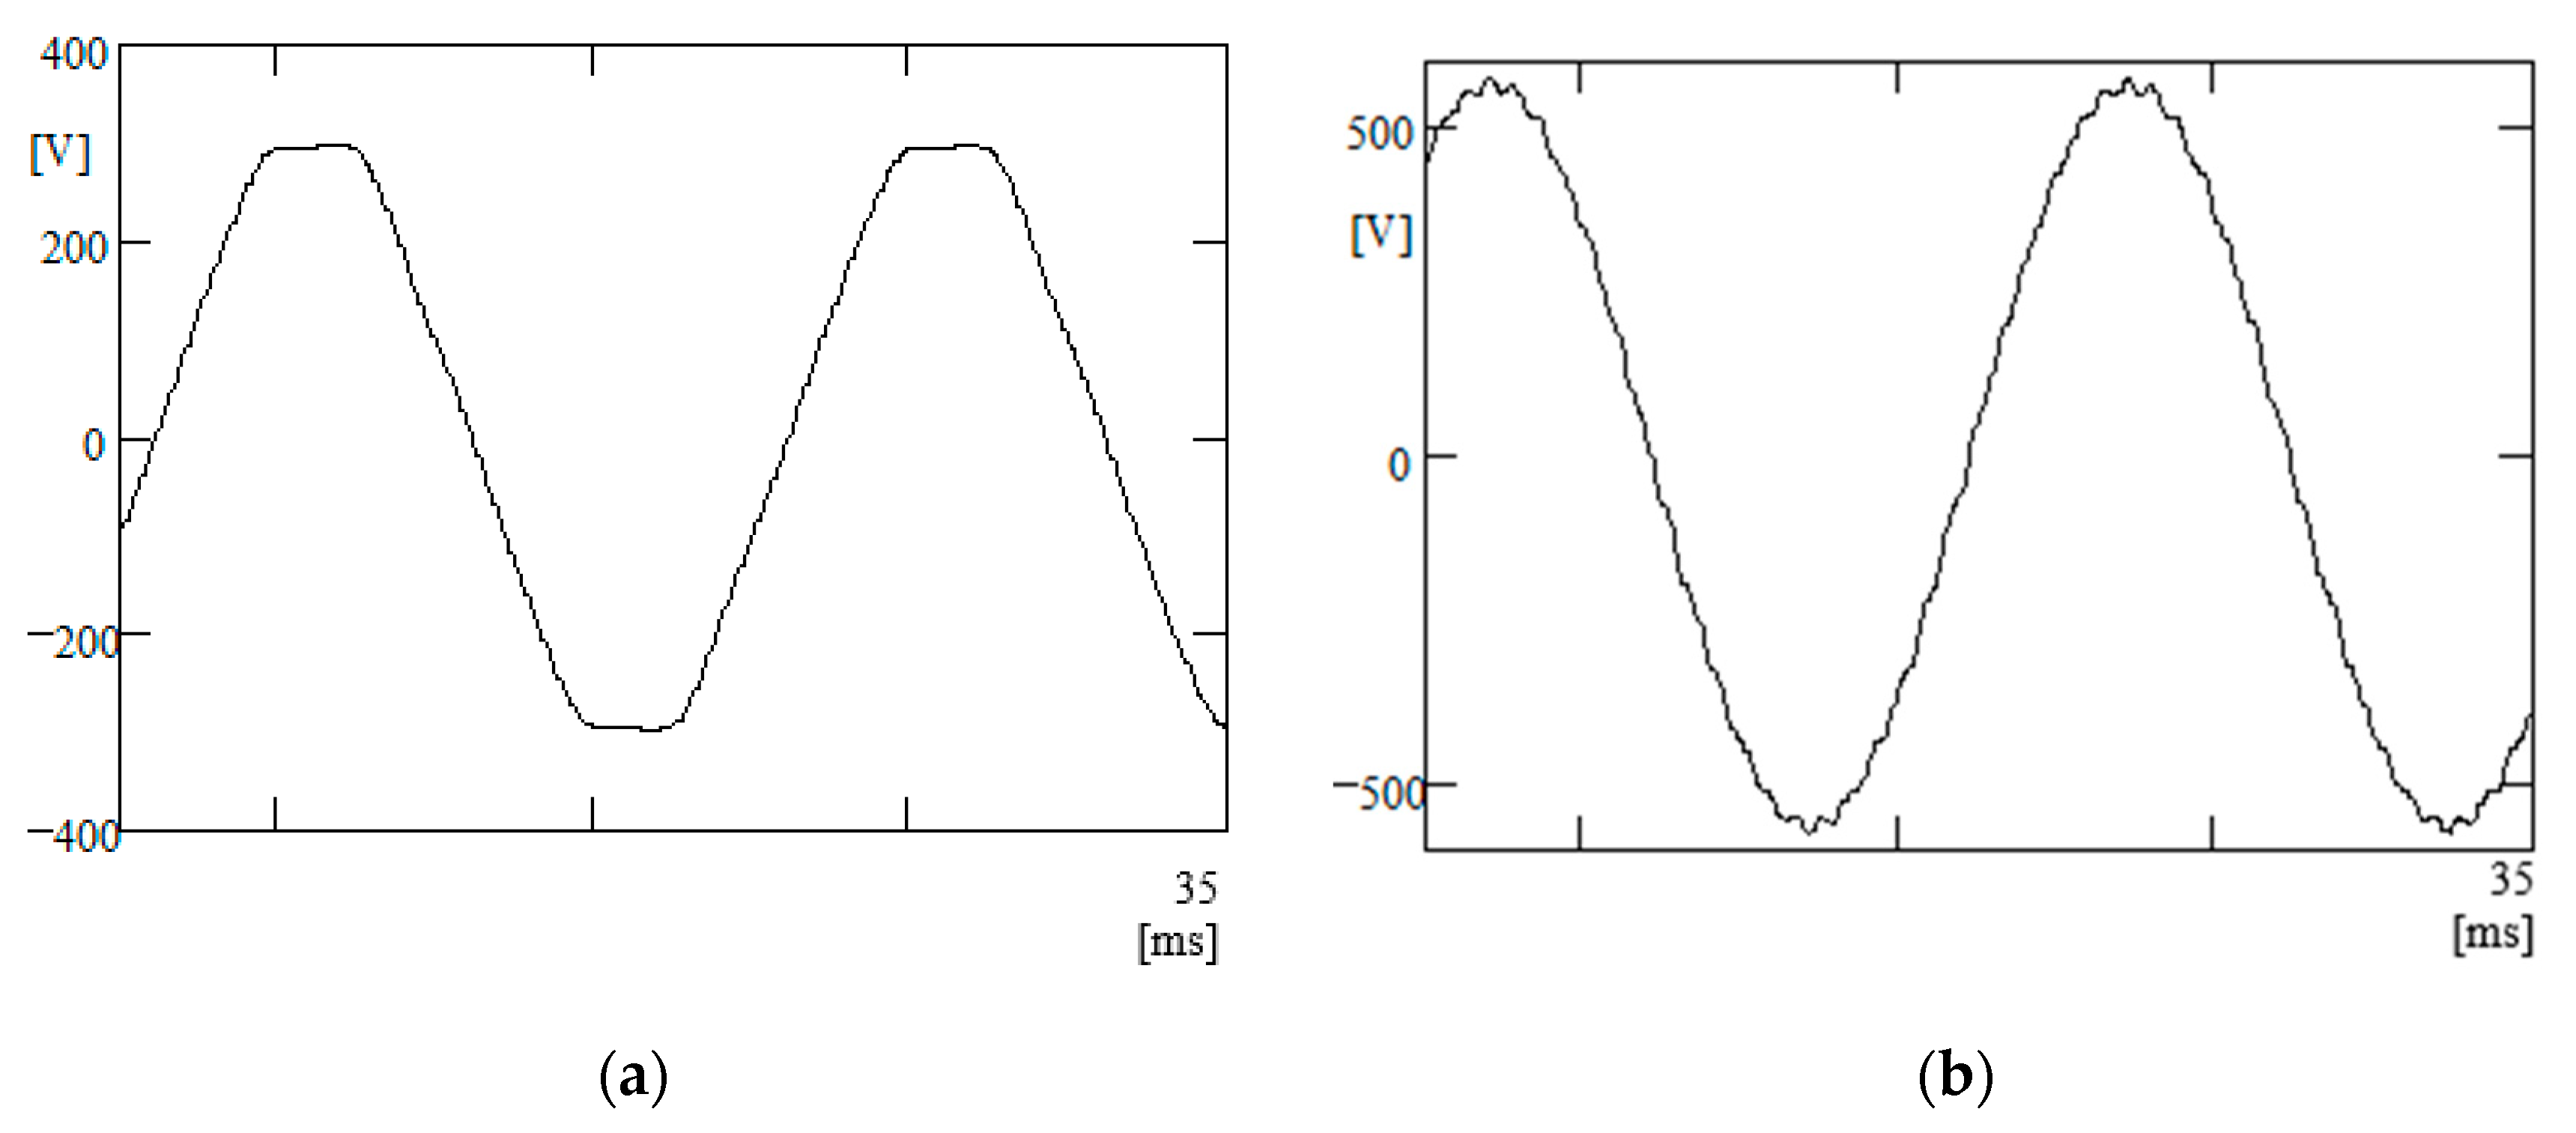
| Harmonic Order | Harmonic Contents in Signal from Figure 3a (%) | Harmonic Contents in Signal from Figure 3b (%) |
|---|---|---|
| 2 | 0.2 | 0.0 |
| 3 | 0.1 | 0.0 |
| 5 | 2.9 | 0.1 |
| 7 | 1.7 | 0.3 |
| 11 | 0.2 | 0.1 |
| 13 | 0.1 | 0.2 |
| 23 | 0.0 | 0.5 |
| 25 | 0.0 | 1.6 |
| THD | 3.4 | 1.8 |
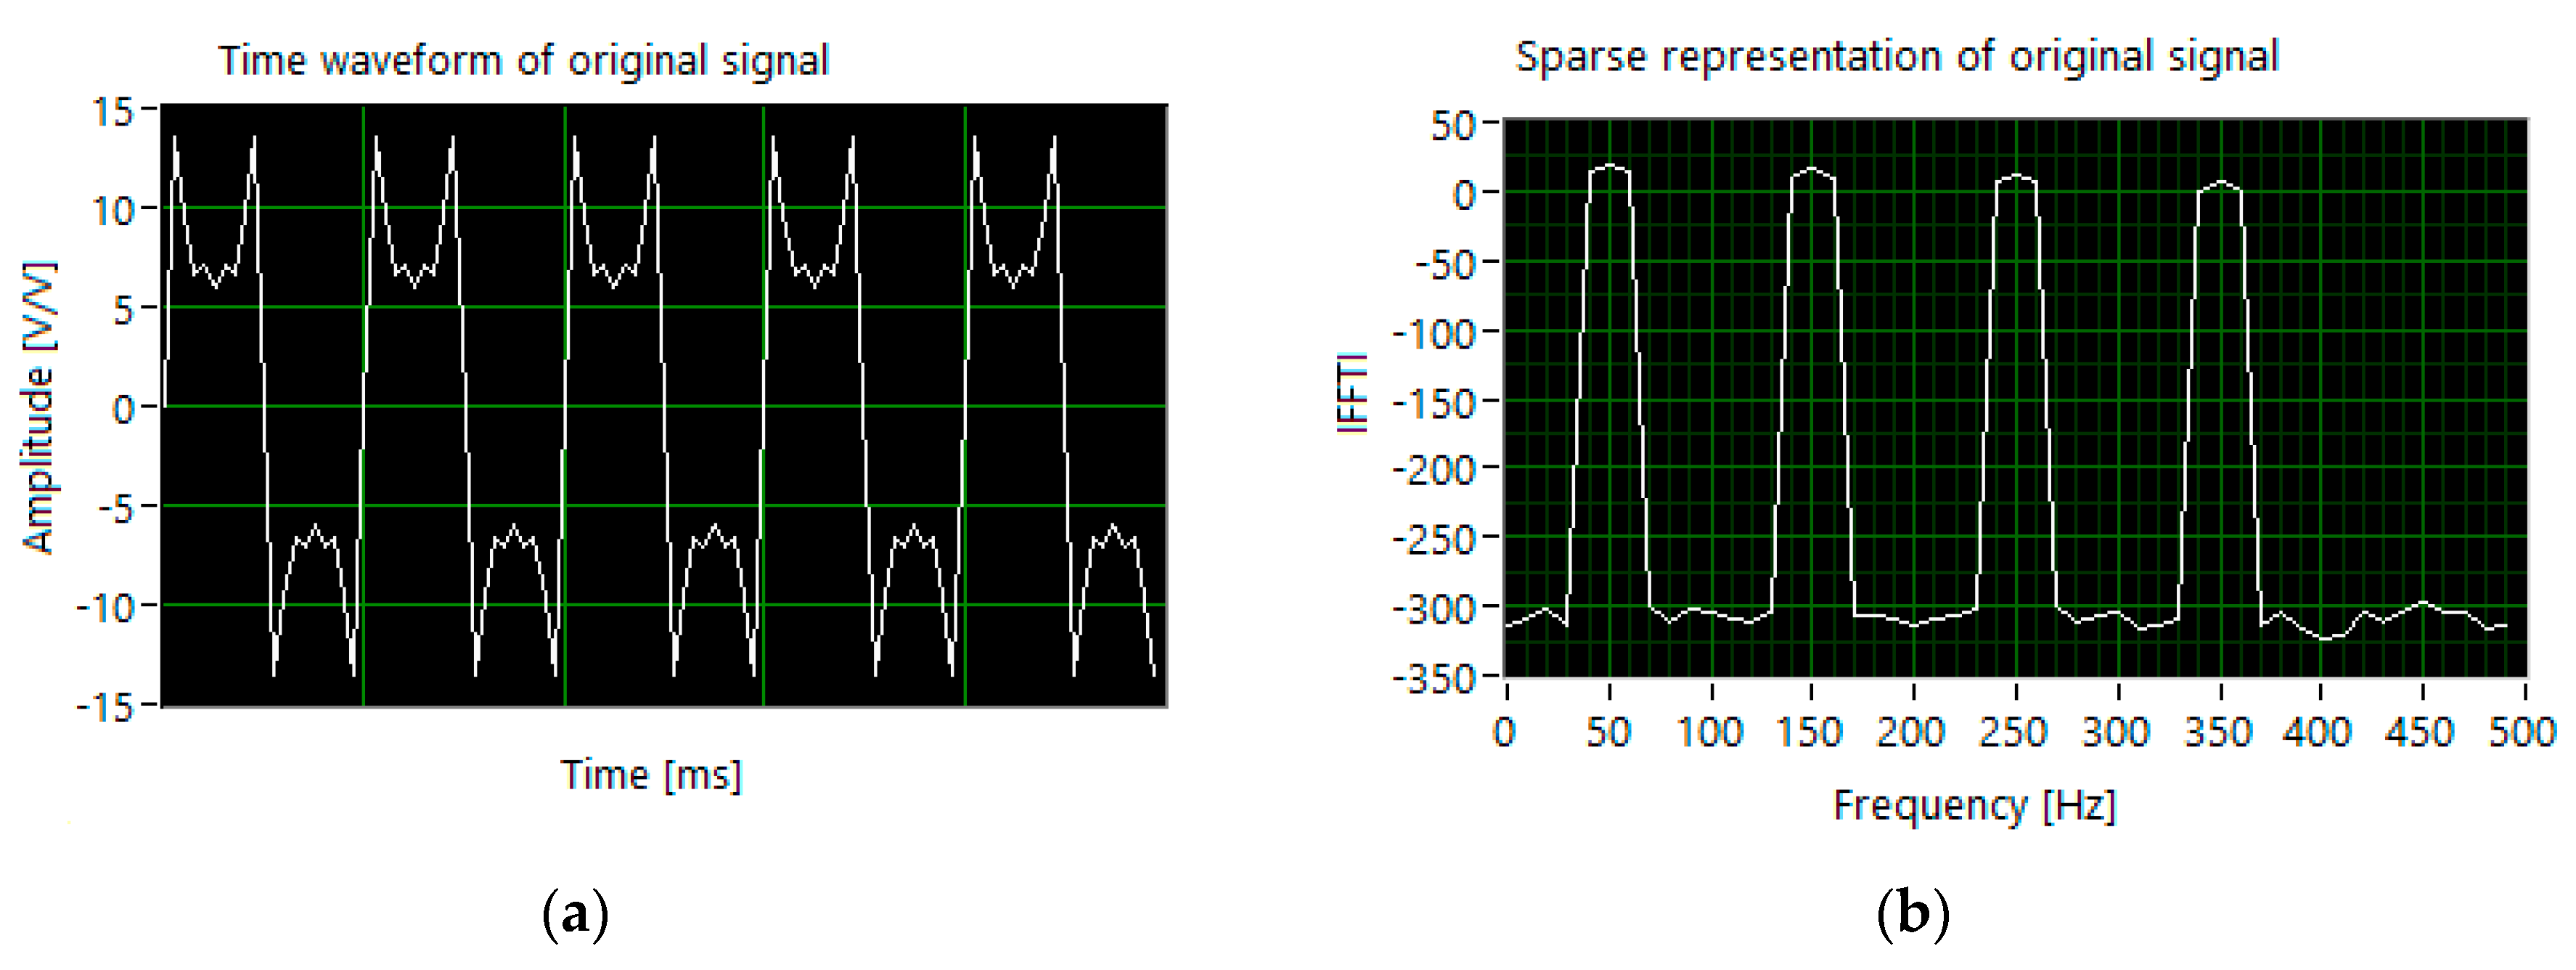
| Harmonic Order | Amplitude (V/V) | ||
|---|---|---|---|
| Set 1 | Set2 | Set 3 | |
| 1 | 10 | 50 | 100 |
| 3 | 6 | 6 | 6 |
| 5 | 4 | 4 | 4 |
| 7 | 2 | 2 | 2 |
| Name of Algorithm | K Sparsity | Run Time (s) |
|---|---|---|
| ℓ1-Least Squares (L1-LS) Regularization Algorithm 1 | - | 14.37 |
| Fixed Point Continuation (FPC) Method 1 | - | 8.66 |
| Orthogonal Matching Pursuit (OMP) 2 | 10 | 0.19 |
| Compressive sampling matching pursuit (CoSaMP) 2 | 10 | 0.28 |
| Presented in the paper | 7 | 0.54 |
© 2020 by the authors. Licensee MDPI, Basel, Switzerland. This article is an open access article distributed under the terms and conditions of the Creative Commons Attribution (CC BY) license (http://creativecommons.org/licenses/by/4.0/).
Share and Cite
Palczynska, B.; Masnicki, R.; Mindykowski, J. Compressive Sensing Approach to Harmonics Detection in the Ship Electrical Network. Sensors 2020, 20, 2744. https://doi.org/10.3390/s20092744
Palczynska B, Masnicki R, Mindykowski J. Compressive Sensing Approach to Harmonics Detection in the Ship Electrical Network. Sensors. 2020; 20(9):2744. https://doi.org/10.3390/s20092744
Chicago/Turabian StylePalczynska, Beata, Romuald Masnicki, and Janusz Mindykowski. 2020. "Compressive Sensing Approach to Harmonics Detection in the Ship Electrical Network" Sensors 20, no. 9: 2744. https://doi.org/10.3390/s20092744
APA StylePalczynska, B., Masnicki, R., & Mindykowski, J. (2020). Compressive Sensing Approach to Harmonics Detection in the Ship Electrical Network. Sensors, 20(9), 2744. https://doi.org/10.3390/s20092744