Article

Transition Activity Recognition System Based on Standard Deviation Trend Analysis

Department of Computer Science and Technology, Harbin Institute of Technology, Harbin 150001, China
*
Author to whom correspondence should be addressed.
Sensors 2020, 20(11), 3117; https://doi.org/10.3390/s20113117
Submission received: 27 April 2020 / Revised: 25 May 2020 / Accepted: 29 May 2020 / Published: 31 May 2020
(This article belongs to the Section Intelligent Sensors)

Abstract

:
With the development and popularity of micro-electromechanical systems (MEMS) and smartphones, sensor-based human activity recognition (HAR) has been widely applied. Although various kinds of HAR systems have achieved outstanding results, there are still issues to be solved in this field, such as transition activities, which means the transitional process between two different basic activities, discussed in this paper. In this paper, we design an algorithm based on standard deviation trend analysis (STD-TA) for recognizing transition activity. Compared with other methods, which directly take them as basic activities, our method achieves a better overall performance: the accuracy is over 80% on real data.

1. Introduction

Human activity recognition (HAR) is a significant subfield of pervasive computing and provides important context information for an ocean of applications such as medical care, education, and entertainment [1,2,3]. In recent decades, with the popularity of smart phones and other wearable devices, HAR applications based on built-in inertial sensors have been significantly developed. For example, WooSeok Hyun et al. [4] developed a wireless body sensor network which integrated different physiological sensors to sense physiological data from a human body with smartphones as computing platform. Chetty Girija et al. [5] realized an automatic and intelligent daily activity monitoring application for elderly people using smartphone inertial sensors. Espinilla Macarena et al. [6] designed a subwindow-based online recognition architecture, which achieved promising results in their experiments. Garcia-Ceja et al. [7] used sound and accelerometer data collected with a smartphone and a wristband while performing home task activities, and the whole system performed outstandingly using a multi-view stacking method. Zahin et al. [8] proposed a semi-supervised classifier, mainly using deep learning networks, in sensor-based smart health monitoring. In summary, most researchers pursue higher activity recognition accuracy.
Although most related works achieve excellent results in recognizing daily activities (e.g., walking, sitting, standing et al.) [9,10], there are still issues in HAR systems that affect its performance. One of them is transition activity, which is the transitional process between two different basic activities, as Figure 1 depicts.
Unlike basic daily activities, transition activity is usually transient and accompanied with intense changes. To the best of the authors’ knowledge, most related works choose to ignore the existence of these activities. Sometimes it may be an effective measure for specific practical needs. However, this will inevitably affect the performance of the HAR systems. HAR systems are faced with random noise in the real scenario, which obviously affects the performance of the overall system. Transition activity recognition helps to segment different basic activities to reduce the error rate. Moreover, some HAR systems focus on identifying the transitional activities, such as fall detection systems, require accurate recognition accuracy of these kind of activities. Therefore, transition activity recognition is necessary for HAR systems.
Several efforts attempt to solve this issue from their own perspectives. Reyes-Ortiz et al. [11] designed an architecture for recognizing transition activity. They used the probabilistic output of consecutive activity predictions as the main basis for identification and achieved promising results. Mohd et al. [12] took advantage of multivariate Gaussian distribution to judge whether the current activity is a transition activity. The above research mainly focuses on the transition between static activities, while there is relatively little discussion on transitions involving dynamic activities (e.g., standing↔walking).
In this paper, we build a HAR system based on smart phone built-in sensors. The overall work is depicted as follows:
  • We fuse two types of sensor data for accurately recognizing basic daily activities in our dataset.
  • We distinguish the transition activities from basic activities by analyzing the trend of standard deviation.
  • We develop an android application on a smartphone and conduct experiments in a real scenario.
The rest of this paper is organized as follows. In Section 2, we introduce related work, including HAR systems and approaches for recognizing transition activities. Section 3 gives the details of our proposed system architecture and algorithm. Section 4 covers the results of the experiment, and Section 5 is the conclusion and future work.

2. Related Works

2.1. Human Activity Recognition Systems

With the emergence of Micro-Electromechanical Systems (MEMS), researchers use a variety of professional sensing devices in the HAR systems. Pansiot et al. [13] developed the e-ar sensor, which can be worn on the ear to detect human body signs data for health care. Minnen et al. [14] put multiple sensors on a military suit to recognize tactical actions and provide battlefield information. Moreover, due to the popularity of smart phones, there are also studies developing HAR systems using smartphone built-in sensors. For example, Akhavian et al. [15] bound mobile phones to the upper arm of construction workers to recognize the workers’ ongoing activities. Wang et al. [16] developed a system to identify students’ behavior through a variety of built-in sensors in smartphones to evaluate their mental health and academic performance. Bisio et al. [17] used smart phones to realize telemedicine monitoring. Ronao et al. [18] proposed a two-stage continuous hidden Markov model (CHMM) approach for the task of activity recognition using accelerometer and gyroscope sensory data gathered from a smartphone. Lu et al. [19] designed an efficient and flexible framework for activity recognition based on smartphone sensors, and the proposed method was independent of device placement and orientation. Most similar HAR systems take advantage of smart devices for collecting sensing data and utilize machine learning algorithms (e.g., Support Vector Machine (SVM), Decision Tree (DT), K-Nearest Neighbor (KNN) [20,21,22]) for activity recognition. However, they choose to ignore the existence of transition activity instead of taking it as an important issue.

2.2. Transition Activity Recognition

For some studies, ignoring transition activity causes little influence on the result because they focus on long-term activity monitoring. However, there are also studies that address the transition issue. For example, Song et al. [23] used a 3D accelerometer for activity data collection, and they designed an event-based recognition architecture to deal with transition activity. In the method they utilized a hidden Markov model (HMM), which needed prior probability information, as classifier. Aminikhanghahi et al. [24] built a smart-home environment, placed various sensors on the human body and room doors to collect daily activity data and realized data segmentation and transition activity recognition through change point detection. This research mainly dealt with complex daily activities such as cooking. A similar scenario is also mentioned in Atallah et al. [25]. They used a method based on manifold embedding to map high-dimensional data into low-dimensional space. However, the recognition accuracy on standing-sitting was not high. Moreover, with the development of artificial intelligence, a quantity of works on transition activity regarded transition activity as a new kind of activity similar to the basic ones. Thien Huynh-The et al. [26] used SVM as a classifier to recognize transition activities. The approach was supported by excellent machine learning models. However, the transition activities can be easily classified as other activities in real scenarios, and vice versa.
In this paper, we refer to some ideas from the above works and identify transition activities by analyzing the standard deviation trend. As a simple recognition architecture, the system still achieves promising performance.

3. Method and Architecture

3.1. System Architecture

In this part, we introduce the whole process of activity recognition, as shown in Figure 2.
First, based on the results of our previous work [27], we put a smart phone on the right leg of subjects to collect data in order to achieve the best classification results. The data includes accelerometer data and barometer data. We separate the set into two types: basic activity and transition activity. Then we segment data via a sliding window algorithm and divide all the segments into two parts, one for training and the other for testing. In the feature extraction stage, we extract the statistical features of data segments to reduce the dimension of data and facilitate the training of classifiers. Considering the excellent performance of SVM in pattern recognition [28,29], we train a SVM model as the core classifier in the classifier training stage. SVM outputs the recognition results in the form of probability, which is namely the probabilistic results. In the transition activity recognition stage, we take advantage of the standard deviation trend analysis (STD-TA) method to judge whether the current activity is a transition activity. The final results are achieved in the recognition result stage, and transition activity is distinguished from basic activity.
In the next parts, we give the details of each stage.

3.2. Data Collection

We collect eight simple daily activities in our work. Table 1 shows more information about our dataset.
Most activities can be recognized via processing the accelerometer data. According to our previous experience, we set the accelerometer data sampling frequency at 50 Hz, which is enough to achieve outstanding recognition accuracy. We gather the barometer data for recognizing different motion patterns with huge similarity, and 5 Hz is a proper sampling rate given that it changes little in a few milliseconds. For example, the characteristics of upstairs and downstairs in acceleration are highly similar, it is tough to distinguish these two activities unless taking the barometer data into consideration. This is also the general idea of studies on sensor fusion [30]. We apply an upsampling process to make every 10 accelerometer data samples correspond to the same 10 barometer samples to facilitate model training in the following stage.
We collect 3 min data for each activity of each subject (80 s for upstairs and downstairs). For dynamic activities, we ask the subject to perform the same activity for 3 min, and each group of data is equivalent to a periodic repetition of single activity. Based on the actual observation on the data curve, we finally determined the single duration of these activities. For transition activities, we ask each subject to repeat two basic activities within 3 min, and the sequence of activities we obtained might be like A, shown below:
A = {Walking, Transition, Standing, Transition, Walking, Transition, Standing}
We get about 10 transition activities per collection, which is enough for us to determine the duration of a single transition activity with observation. We make a statistic on the duration of these activities, as shown in Table 2. With the sliding window algorithm, we segment the original data into data segments, which represent single complete activities. The window size is determined by the duration of a single activity. Static activities such as standing and sitting are a long-term static state. We make a statistic on the duration of other activities, as shown in Table 2.
Compared with basic activities, the proportion of transition activities is relatively low in the real scenario. Therefore, the window size mainly depends on the basic activities, especially the duration of single dynamic activities. As shown in Table 2, the duration of dynamic activities is about 50 data points, and the 1 s time window can well cover all dynamic activities and part of the transition activities. For some tiny short transition activities, such as “Walking to Running”, it may fall into the same segment as some other dynamic activities. Given the transitional characteristic of this segment, we consider it as a transition activity. Based on the above information, we finally set the window size as 1 s (50 data sample points).

3.3. Feature Extraction & Classifier Training

Feature extraction can provide the classifier training with statistical characteristics of original data. We get four columns of data after data collection in every data segment, which are named as (Acc_x, Acc_y, Acc_z, Baro). At this stage, we extract statistic features, including mean, variance, standard deviation (STD), etc, of all data segments. More details are given in Table 3.
We define A c c a l l as
A c c a l l = A c c _ x 2 + A c c _ y 2 + A c c _ z 2
In this stage, we focus on the A c c a l l trend of transition activity data. Figure 3 shows the trend of three main features of “Standing-QuickWalk”.
Take Figure 3a as an example. The data in the gray area are acquired when the user is standing. There are little changes over this period, and the small area in the middle represents the user stopping “Standing” and beginning to “QuickWalk”, at which point the mean value increases significantly. Then, the data in the light-yellow area represent the user continuing to “QuickWalk”, and the mean value changes dramatically in this part. It is obvious that the mean trends of these two larger regions are hugely different, so they can be easily distinguished. We observe the value range of these three kinds of features in Figure 3. Mean is in range [9,13], variance in the range [0, 160] and STD in the range [0,2.2]. Compared with the first two features, the STD is smaller and more controllable, which is convenient for us to fine-tune. Therefore, we decide to use the STD trend analysis (STD-TA) as the transition activity recognition method.
On the other hand, we choose SVM as the classifier for basic activities. As a common model in pattern recognition, SVM performs well in a number of studies. It does not rely on a tremendous amount of data input, which is suitable for research with a very small dataset. In our work, the feature vectors formed in the feature extraction stage are divided into two parts, one for training and the other for testing. After training SVM, we deploy it into a real-time environment. Every real data segment produces a probabilistic vector P = {p1, p2,…,pn}, where pi represents the probability that the data segment belongs to the ith activity. We name P as the probabilistic result, which is a vital basis to judge whether the current activity is a transition one.

3.4. Transition Activity Recognition and Recognition Result

At this stage, we introduce the details of the STD-TA. First, we define the transition relationship of activities to determine where the transition activity can happen. We design a transition diagram, as Figure 4 shows.
Figure 4 mainly specifies the basic activities between which the transition activities will take place, so that some illogical transitions could be effectively avoided to promote the overall accuracy. In the figure, there is no transition between basic activities without connection, such as “Lying” and “Running”. The rules can effectively avoid some recognition errors. According to the diagram, there are 14 transition activities in total. Here, we clarify some definitions:
Definition 1.
FVList = {V1,V2,…,Vn}
where Vi is the feature vector extracted from the ith segment of a data sequence.
Definition 2.
P = {SVM(V1), SVM(V2),…, SVM(Vn)},
PredAct = {index(max(P1)),index(max (P2)),…, index(max(Pn))}
where Pi = SVM(Vi) ∈ P denotes the probabilistic results of Vi after being classified by SVM, PAi = index(max(Pi)) ∈ PredAct is the category result of Vi, which is the label with the maximum probability. We extract the STD value of Vi and record it as STDi.
Definition 3.
Diff = {STD2-STD1, STD3-STD2, …, STDn-STDn-1}
Then, we depict the whole STD-TA algorithm as Algorithm 1 shows:
Algorithm 1. STD Trend Analysis Method (STD-TA).
Input: PAi−1, Diffi−1, Diffi, Diffi+1, Pi, STDi, Intrans, Count
  • If PAi−1StaticActivity:
  • If STDi > 0.1 and max(Pi) < 0.9:
  • Intrans = 1
  • Count = Count + 1
  • Else:
  • Ɵ1 = 1 if Diffi* Diffi−1 > 0 else 0
  • Ɵ2 = 1 if Diffi+1* Diffi > 0 else 0
  • Ɵ3 = 1 if abs(Diffi) > 0.1 else 0
  • Ɵ4 = 0.6 if max(Pi) < 0.6 else max(Pi)
  • R = 0.5* Ɵ1+0.4* Ɵ2 + 0.35* Ɵ3-(1 − Ɵ4)*0.625
  • If R ≥ 1.22:
  • Intrans = 1
  • Count = Count + 1
  • If Intrans == 1:
  • If STDi ≤ 0.1 or max(Pi) ≥ 0.9 or Count:
  • Intrans = 0
  • Count = 0
  • If Intrans == 1:
  • PAi = TransitionActivity
  • Else:
  • PAi = index(max(Pi))
Output: PAi
We refine all activities as Table 4 shows:
After refinement, activities are categorized as two kinds, basic activity and transition activity, and the basic activity mainly consists of static activity (SA) and dynamic activity (DA). Obviously, the SA are long-term stable postures, which means their STD values have few fluctuations.
In our algorithm, we first refer to the previous activity PAi−1 of the current window. If it belongs to SA, then we observe STDi. If it is a large value and the distribution of probabilistic results is scattered, then we consider the current window as transition activity. If PAi−1 ∈ DA, we take 4 factors into consideration: historical trend, future trend, real-time change and probabilistic results. Ɵ1 denotes historical trend, and it covers the trend of the STD value of three windows. Ɵ1 > 0 means the trend of STDi-2, STDi−1 and STDi are the same. Ɵ2 denotes future trend, which needs to check the next STD value to judge the future trend. Ɵ2 > 0 means the trend of STDi−1, STDi and STDi+1 are the same. Ɵ3 is real-time change. When its value increases sharply and overcomes a threshold, it suggests that the current window suffers a huge change with respect to the previous window. Ɵ4 denotes probabilistic results. When its value becomes too small, it means that SVM cannot clearly recognize the activity of the current window, which suggests that the current window is likely to be a transition activity. These four factors are a vital basis for judging if the current window is a transition activity. Here we define Ɵ = { Ɵ1, Ɵ2, Ɵ3, Ɵ4}, and we give the detail determination process of its value in Section 4.
The algorithm finally outputs the recognition result. The transition activities are given the same label, while if it is judged as a basic activity, it will be further classified by SVM to determine its final activity category.

4. Experiments

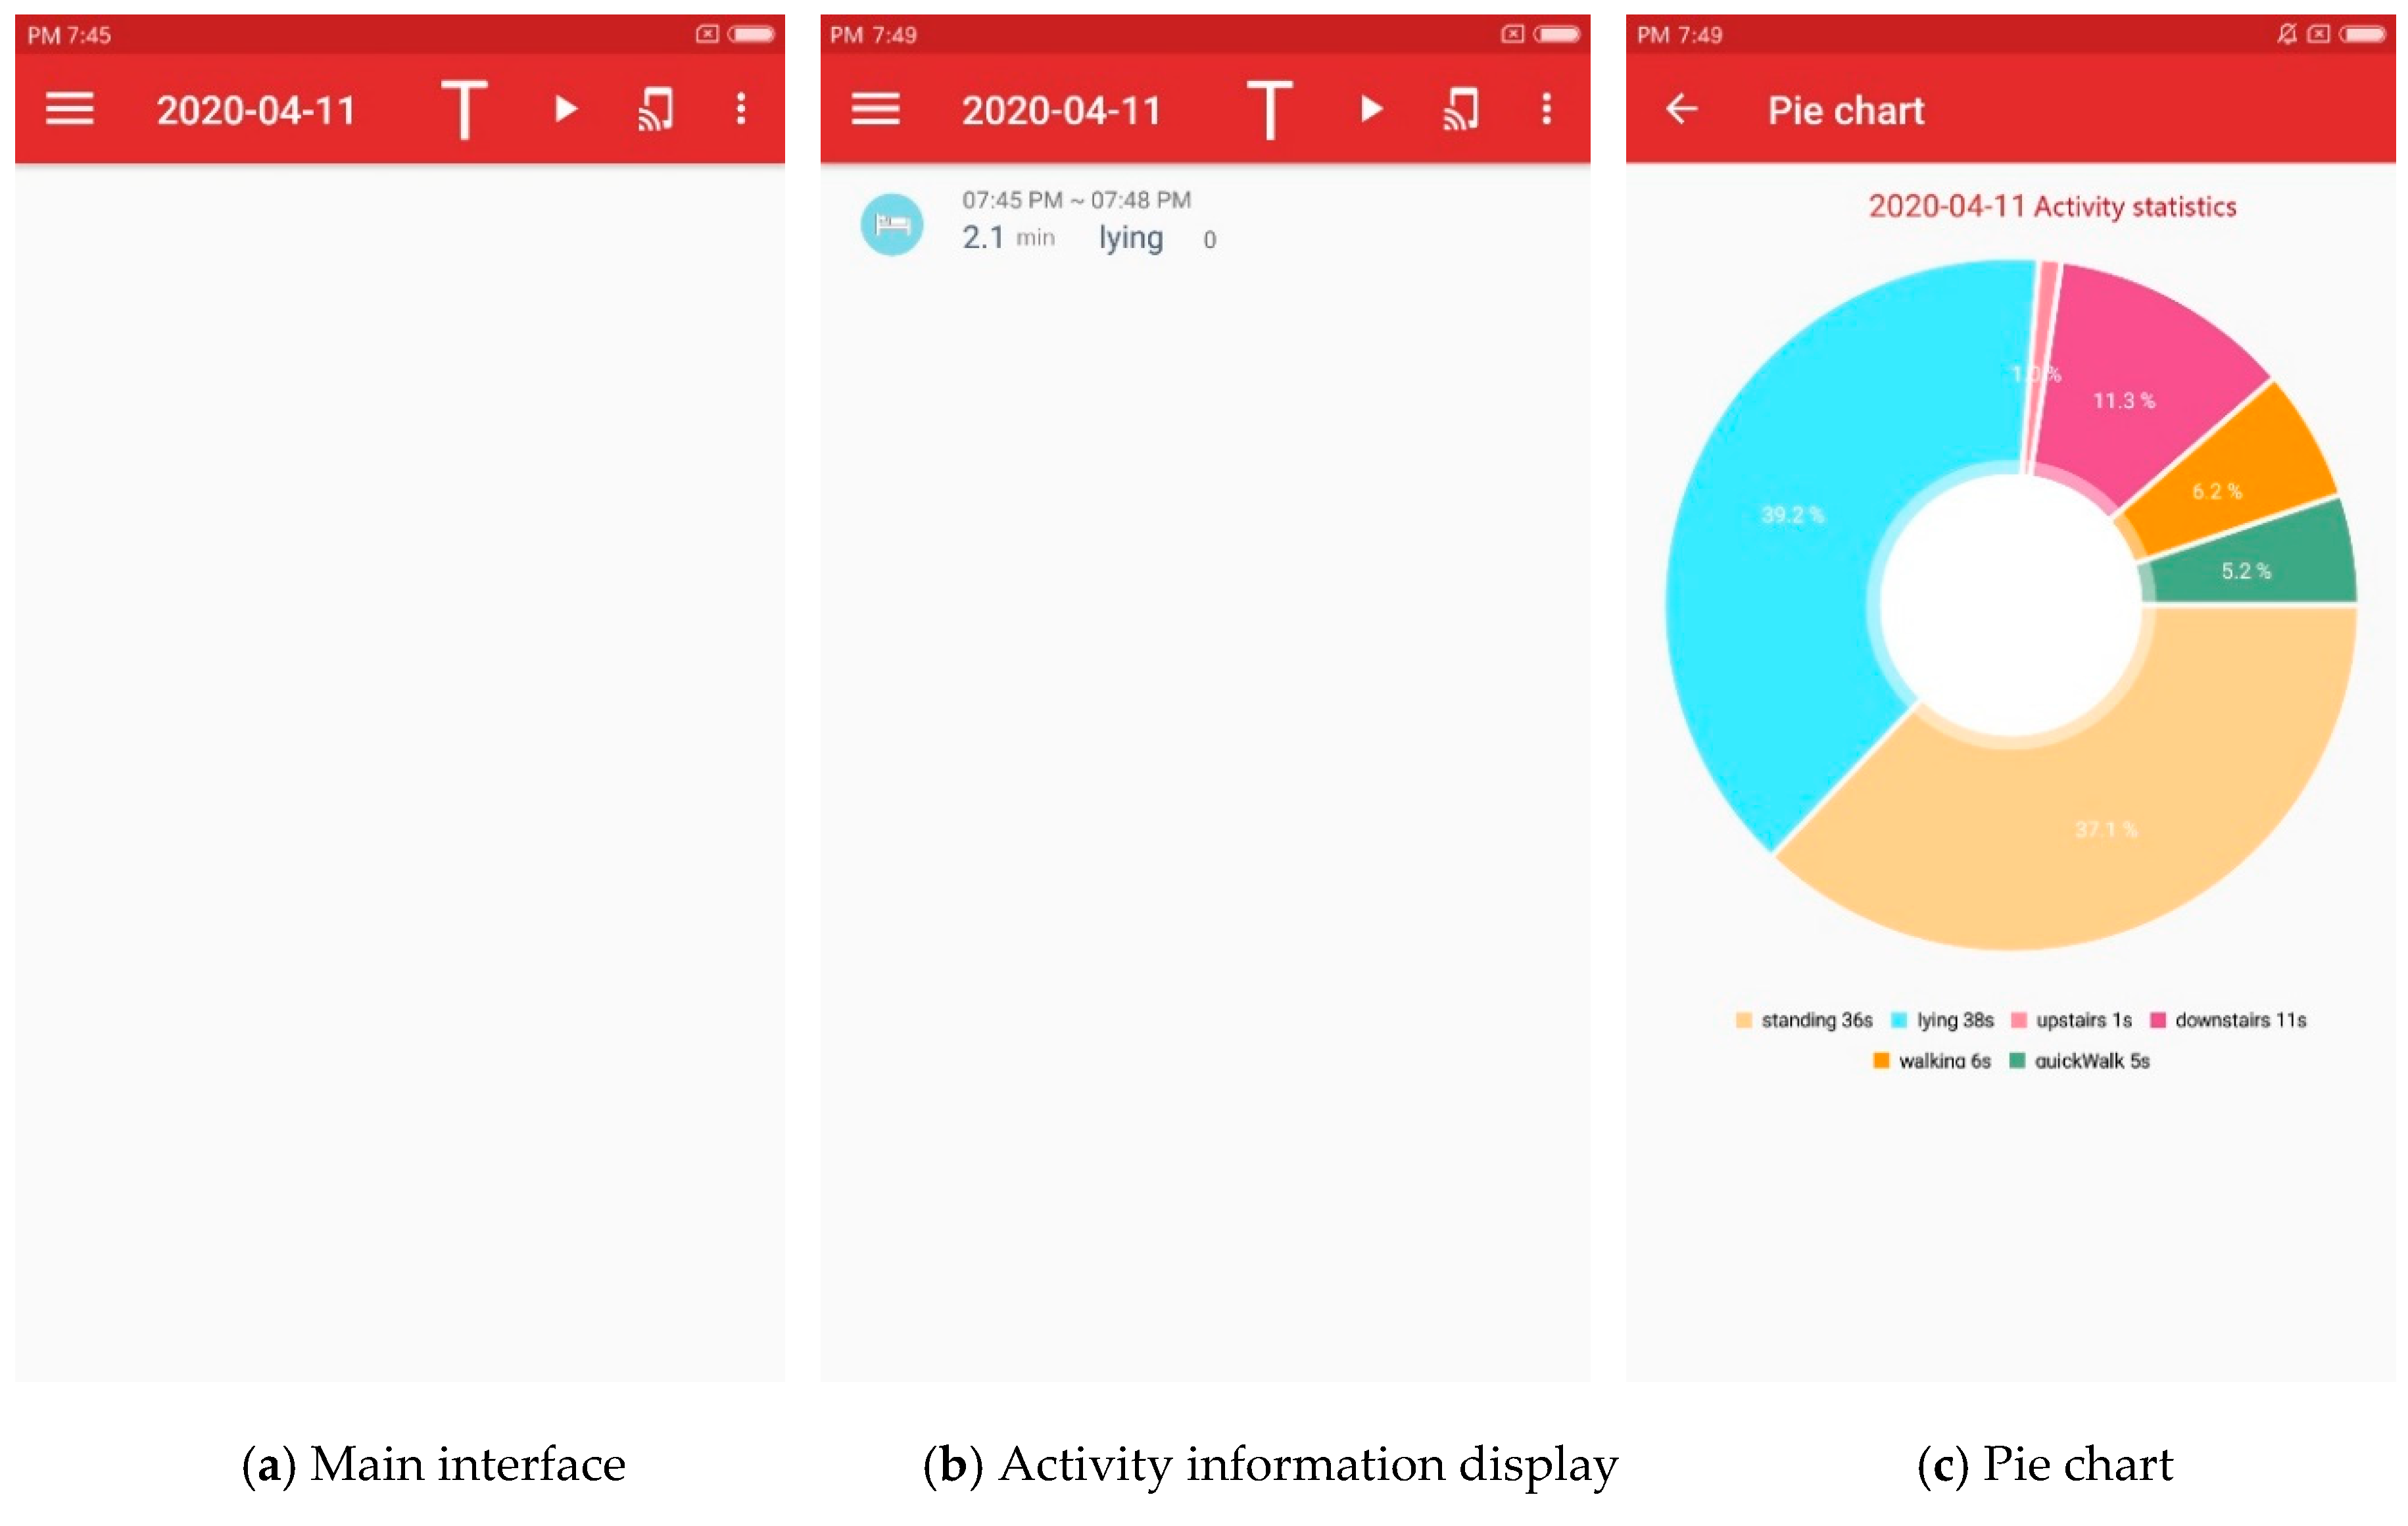
4.1. Android Application

We develop a simple Android application (APP) and deploy it in an Mi phone to conduct our experiments. The APP implements the whole architecture and we deploy it on the phone to carry out data collection and real-time activity recognition. Figure 5 shows the user interface (UI) of APP.
We design this APP to realize the activity recognition and statistics of subjects. We collect activity data using the built-in accelerometer and barometer of a smartphone and recognize the daily activity via the model described in the former sections. Due to the fact that the APP is just in a test stage, the recognition results are stored locally. Meanwhile, we design a long-term monitoring module for users in the APP. The line chart in Figure 5 gives the users’ activities in the previous 7 days, while the pie chart shows the duration and proportion of each daily activity of the users. These functions provide vital context information for high-level applications.
The entire APP is only a test version at present and still needs to be further improved. In the future, we will consider transferring the recognition model and results to the cloud to save the resources of the smart device.

4.2. Experiment 1: Classifier Comparison

After data collection and segmentation, we divide the whole dataset into 10 parts, and 10-fold cross validation is carried out on the classifiers. We select three common models, decision tree (DT) [31], K-nearest neighbor (KNN) [32] and support vector machine (SVM) [33], to carry out this experiment and compare the final results. We only consider the characteristics of these classifiers, so here the target activities only include basic activities. Table 5 shows the test results.
According to the results, all classifiers have tremendous high recognition accuracy for static activities (A01–A03), which is nearly 100%. However, this does not mean that it can maintain a high level under real scenarios. For A04, A07 and A08, the accuracy of the three models is all over 95%, while SVM is still slightly better than the other two. Although we combine the data of the accelerometer and barometer, these classifiers are not so effective on A05 and A06, and their accuracy is around 75%. Meanwhile, SVM performs better than the other two on DA. Lastly, we choose SVM as the core classifier in our work.

4.3. Experiment 2: Determination of Vector θ

According to Algorithm 1, we recognize the transition activity by analyzing the trend of STD. For SA, its STD value is stable and fluctuates around 0, which is easy to distinguish from DA. However, the boundary between DA and transition activity is confusing, which is the reason why we define the factor vector θ.
We take a transition activity as an example. Figure 6 shows the data fragment of “Standing-Walking”.
According to the figure, the vertical axis represents the STD value of the window, and the horizontal axis denotes the starting data point of the window. For example, there is a data point (x = 1150, y = 0.0159) in the figure, which represents the data of a window composed of 50 data points 1150–1200. The STD value of these data is 0.0159.
In the first half of this clip, this subject stays standing, and the STD values of these windows fluctuate around 0 with few changes. When x = 1350, the subject starts to walk. After x = 1450, the subject is completely in walking state. We can clearly detect the change of body posture from the trend of the STD value, especially when x ∈ [1350, 1425]. This is the transition we need to recognize. There are several distinct features of these STD values:
  • Continuous and identical changes. For example, the STD shows a monotonic increasing trend when x ∈ [1350, 1425]. Therefore, for the ith window (i = x/25), we check yi−1−yi−2, yi−yi−1 and yi+1−yi to judge the current STD trend. If the three values have the same symbol, which means they are all positive or negative, it is likely that the current activity is a transition one. This is what θ1 and θ2 represent.
  • Huge change. Transition activity is a transition from one stable state to another, so the change between them is usually intense. Thus, for the ith window (i = x/25), we check | yi-yi−1 |, when its value exceeds the threshold (here we set threshold as 0.1), we judge that the current window may be in transition. This is what θ3 represents. It should be noted that the amount of DA data also meets this condition. However, it is still an important indicator of transition activity.
  • Uncertain result. Due to the fact that the transition activity has the same features as multi activities, the recognition result is usually uncertain, although this situation is not absolute. Thus, for the ith window (i = x/25), we check max(P), which is the maximum probability that the current activity belongs to some basic activity. This is what θ4 represents.
We extract all the transition activity data fragments and the same amount of basic activity data fragments. For each segment, we calculate the θ as Algorithm 1 depicts. Meanwhile, we set labels for each fragment, 0 for basic activity and 1 for transition activity. Multiple linear regression (MLR) is utilized. The problem is described as follows:
This act denotes current activity, ∀ W = {w1,w2,w3,w4},
W θ T = { 0       T h i s A c t B a s i c   A c t i v i t y     1     T h i s A c t T r a n s i t i o n   A c t i v i t y
The function of MLR is finding a proper W. With this approach, we get:
W = {0.5139511, 0.4159489, 0.35475093, −0.61839164}
After a fine-tuning, we finally determine W as Algorithm 1 shows.

4.4. Experiment 3: Overall Performance

In this part, we explore the overall performance of our proposed method. For comparison, we set up control groups. Referring to the idea in [34], we regard all transition activities as one activity and assign a unified label to them. We then use SVM and KNN as classifiers for both transition and basic activities. Finally, we do the comparison with our method after experiments.
Here, we first use the whole dataset we acquired before, including basic and transition activities, to train the KNN and SVM. Moreover, we introduce the CUSUM chart (cumulative sum control chart) as another state-of-the-art algorithm in this experiment. CUSUM has excellent performance in change point detection issues [35,36], which are similar with our problem. We use a similar strategy using SVM as the basic classifier and CUSUM as the transition activity recognition method. Then, we invite five new subjects to perform activities as a test set for the four methods. Table 6 gives the results.
According to the results in the table, the three models all perform well on basic activities (A01–A08). Due to the fact that the SAs are stable and easy to distinguish from each other, there are few errors that happen when recognizing them (A01–A03). Accuracy on “Walking” (A04) is relatively low, because as a basic DA, its behavior mode is easily confused with other kinds of DA. In the recognition of “Upstairs” (A05) and “Downstairs” (A06), SVM, STD-TA and CUSUM, which also use SVM as core classifier, have a 6%–10% higher accuracy than KNN. This is similar to our results in Experiment 1. For “Running” (A07) and “QuickWalk” (A08), the results are all at a high level, above 95%. We believe that the intensity of these two activities is tremendously high, which leads to them being quite different from other activities and easy to distinguish.
A09 represents all transition activities. Both SVM and KNN maintain an accuracy of 66%. Obviously, a number of pieces of data which belong to the transition activity category are mistakenly identified as basic activities, and vice versa. We infer that transition activity has high similarity with DA. The CUSUM achieves a recognition accuracy of 73.24%. It is effective for detecting the change point of the activity sequence. However, this method is effective for a single kind of transition activity, which has limitation on recognizing multiple kinds of transitions in real scenarios. In contrast, our method improves the accuracy of detection of transition activity by nearly 20%, reaching 80%. It is supposed to be the trend features extracted by the STD-TA that produces the promotion.

5. Conclusions and Future Work

HAR is faced with some problems, and the transition activity mentioned in this paper is one of them. To solve this issue, we designed an algorithm based on STD trend analysis. For basic activity, we mainly utilized SVM for recognition. For transition activity, we analyzed the STD value of data to judge the trend of the overall data flow to recognize the activity. Through result comparison, the accuracy of our algorithm is 20% higher, reaching 82.85%, than only using a machine learning model in identifying the transition activity.
Our work has achieved promising results in distinguishing transition activity from basic activity. However, our method does not have an absolute advantage over the other two classifiers in the control group on distinguishing between transition activity and walking. In addition, the generalization of some specific parameters we calculate in this paper, such as W and θ , is limited. If there were some users whose height or age is beyond the range of the training set, the accuracy would be affected. Therefore, we should design an incremental update mechanism for these parameters in our future work. Moreover, we do not further discuss the specific categories of transition activities. This is because that we can judge the specific type of transition activity through activities before and after it. Adding the specific recognition method could increase the complexity of the whole architecture. In future work, we will focus on the generalization of our model and discuss more complex daily activities (e.g., cooking, reading, etc.).

Author Contributions

Conceptualization, J.S. and D.Z.; methodology, J.S.; software, J.S.; validation, Z.Z. and D.Z.; formal analysis, Z.Z.; investigation, J.S.; resources, Z.Z. and D.Z.; data curation, J.S.; writing—original draft preparation, J.S.; writing—review and editing, J.S. and D.Z.; visualization, J.S.; supervision, Z.Z.; project administration, D.Z.; funding acquisition, D.Z. All authors have read and agreed to the published version of the manuscript.

Funding

This research was funded by the National High-tech R&D Program of China, grant number 2013AA01A215 and the APC was funded by the National High-tech R&D Program of China, grant number 2013AA01A215.

Conflicts of Interest

The authors declare no conflict of interest.

References

  1. Cornacchia, M.; Zheng, Y.; Velipasalar, S.; Ozcan, K. A Survey on Activity Detection and Classification Using Wearable Sensors. IEEE Sens. J. 2016, 17, 386–403. [Google Scholar] [CrossRef]
  2. Chen, L.-W.; Ho, Y.-F.; Kuo, W.-T.; Tsai, M.-F. Intelligent file transfer for smart handheld devices based on mobile cloud computing. Int. J. Commun. Syst. 2015, 30, e2947. [Google Scholar] [CrossRef]
  3. Altun, K.; Barshan, B. Human Activity Recognition Using Inertial/Magnetic Sensor Units. Appl. Evol. Comput. 2010, 6219, 38–51. [Google Scholar] [CrossRef]
  4. Hyun, W.; You, I.; Jang, J.; Leu, F.-Y. A Wireless Body Sensor Network and Its Applications: Rehearsal with a Smartphone. In Proceedings of the 2016 10th International Conference on Innovative Mobile and Internet Services in Ubiquitous Computing (IMIS), Fukuoka, Japan, 6–8 July 2016; pp. 415–418. [Google Scholar]
  5. Chetty, G.; White, M. Body sensor networks for human activity recognition. In Proceedings of the 2016 3rd International Conference on Signal Processing and Integrated Networks (SPIN), Noida, India, 11–12 February 2016; pp. 660–665. [Google Scholar]
  6. Espinilla, M.; Medina, J.; Hallberg, J.; Nugent, C. A new approach based on temporal sub-windows for online sensor-based activity recognition. J. Ambient Intell. Humaniz. Comput. 2018, 1–13. [Google Scholar] [CrossRef] [Green Version]
  7. Garcia-Ceja, E.; Galván-Tejada, C.E.; Brena, R. Multi-view stacking for activity recognition with sound and accelerometer data. Inf. Fusion 2018, 40, 45–56. [Google Scholar] [CrossRef]
  8. Zahin, A.; Tan, L.T.; Hu, R.Q. Sensor-Based Human Activity Recognition for Smart Healthcare: A Semi-supervised Machine Learning. In Proceedings of the Lecture Notes of the Institute for Computer Sciences, Social Informatics and Telecommunications Engineering; Springer Science and Business Media LLC: Harbin, China, 2019; pp. 450–472. [Google Scholar]
  9. Yao, R.; Lin, G.; Shi, Q.; Ranasinghe, D. Efficient dense labelling of human activity sequences from wearables using fully convolutional networks. Pattern Recognit. 2018, 78, 252–266. [Google Scholar] [CrossRef]
  10. Shen, C.; Chen, Y.; Yang, G. On motion-sensor behavior analysis for human-activity recognition via smartphones. In Proceedings of the 2016 IEEE International Conference on Identity, Security and Behavior Analysis (ISBA), Sendai, Japan, 29 February–2 March 2016; pp. 1–6. [Google Scholar]
  11. Reyes-Ortiz, J.-L.; Oneto, L.; Samà, A.; Parra, X.; Anguita, D. Transition-Aware Human Activity Recognition Using Smartphones. Neurocomputing 2016, 171, 754–767. [Google Scholar] [CrossRef] [Green Version]
  12. Noor, M.H.M.; Salcic, Z.; Wang, K.I.-K. Adaptive sliding window segmentation for physical activity recognition using a single tri-axial accelerometer. Pervasive Mob. Comput. 2017, 38, 41–59. [Google Scholar] [CrossRef]
  13. Pansiot, J.; Stoyanov, D.; McIlwraith, D.; Lo, B.; Yang, G.Z. Ambient and Wearable Sensor Fusion for Activity Recognition in Healthcare Monitoring Systems. In World Congress on Medical Physics and Biomedical Engineering 2006; Springer Science and Business Media LLC: Seoul, Korea, 2006; Volume 13, pp. 208–212. [Google Scholar]
  14. Minnen, D.; Westeyn, T.; Ashbrook, D.; Presti, P.; Starner, T. Recognizing Soldier Activities in the Field. In World Congress on Medical Physics and Biomedical Engineering 2006; Springer Science and Business Media LLC: Seoul, Korea, 2007; Volume 13, pp. 236–241. [Google Scholar]
  15. Akhavian, R.; Behzadan, A.H. Smartphone-based construction workers’ activity recognition and classification. Autom. Constr. 2016, 71, 198–209. [Google Scholar] [CrossRef]
  16. Wang, R.; Chen, F.; Chen, Z.; Li, T.; Harari, G.; Tignor, S.; Zhou, X.; Ben-Zeev, D.; Campbell, A.T. StudentLife. In Proceedings of the 2014 ACM International Joint Conference on Pervasive and Ubiquitous Computing, Osaka, Japan, 7–11 September 2014; pp. 3–14. [Google Scholar] [CrossRef]
  17. Bisio, I.; Lavagetto, F.; Marchese, M.; Sciarrone, A. Smartphone-based user activity recognition method for health remote monitoring applications. In Proceedings of the International Conference on Pervasive and Embedded Computing and Communication Systems, Rome, Italy, 24–26 February 2012; pp. 200–205. [Google Scholar]
  18. Ronao, C.A.; Cho, S.-B. Human activity recognition using smartphone sensors with two-stage continuous hidden Markov models. In Proceedings of the 2014 10th International Conference on Natural Computation (ICNC), Xiamen, China, 19–21 August 2014; pp. 681–686. [Google Scholar]
  19. Lu, D.-N.; Nguyen, T.-T.; Ngo, T.-T.-T.; Nguyen, T.-H.; Nguyen, H.-N.; Akagi, M.; Nguyen, T.-T.; Vu, D.-T.; Phung, T.-N.; Huynh, V.-N. Mobile Online Activity Recognition System Based on Smartphone Sensors. Adv. Intell. Syst. Comput. 2016, 538, 357–366. [Google Scholar] [CrossRef]
  20. Wu, H.; Pan, W.; Xiong, X.; Xu, S. Human activity recognition based on the combined SVM&HMM. In Proceedings of the 2014 IEEE International Conference on Information and Automation (ICIA), Hailar, China, 28–30 July 2014; pp. 219–224. [Google Scholar]
  21. Fan, L.; Wang, Z.; Wang, H. Human Activity Recognition Model Based on Decision Tree. In Proceedings of the 2013 International Conference on Advanced Cloud and Big Data, Nanjing, China, 13–15 December 2013; pp. 64–68. [Google Scholar]
  22. Feng, Z.; Mo, L.; Li, M. A Random Forest-based ensemble method for activity recognition. In Proceedings of the 2015 37th Annual International Conference of the IEEE Engineering in Medicine and Biology Society (EMBC), Milan, Italy, 25–29 August 2015; Volume 2015, pp. 5074–5077. [Google Scholar]
  23. Song, M.H.; Lee, Y.H. Direct optimization of inference model for human activity and posture class recognition. Multimed. Tools Appl. 2015, 74, 1–18. [Google Scholar] [CrossRef]
  24. Aminikhanghahi, S.; Cook, D.J. Using change point detection to automate daily activity segmentation. In Proceedings of the 2017 IEEE International Conference on Pervasive Computing and Communications Workshops (PerCom Workshops), Kona, HI, USA, 13–17 March 2017. [Google Scholar]
  25. Ali, R.; Atallah, L.; Lo, B.; Yang, G.-Z. Transitional Activity Recognition with Manifold Embedding. In Proceedings of the 2009 Sixth International Workshop on Wearable and Implantable Body Sensor Networks, Berkeley, CA, USA, 3–5 June 2009; pp. 98–102. [Google Scholar] [CrossRef]
  26. Huynh-The, T.; Hua, C.-H.; Tu, N.A.; Hur, T.; Bang, J.; Kim, D.; Amin, M.B.; Kang, B.H.; Seung, H.; Shin, S.-Y.; et al. Hierarchical topic modeling with pose-transition feature for action recognition using 3D skeleton data. Inf. Sci. 2018, 444, 20–35. [Google Scholar] [CrossRef]
  27. Shi, J.; Zuo, D.; Zhang, Z.; Luo, D. Sensor-based activity recognition independent of device placement and orientation. Trans. Emerg. Telecommun. Technol. 2020, 31, e3823. [Google Scholar] [CrossRef]
  28. Madevska-Bogdanova, A.; Nikolik, D.; Curfs, L. Probabilistic SVM outputs for pattern recognition using analytical geometry. Neurocomputing 2004, 62, 293–303. [Google Scholar] [CrossRef]
  29. Liu, Y.; Wen, K.; Gao, Q.; Gao, X.; Nie, F. SVM based multi-label learning with missing labels for image annotation. Pattern Recognit. 2018, 78, 307–317. [Google Scholar] [CrossRef]
  30. Zhu, C.; Sheng, W. Human daily activity recognition in robot-assisted living using multi-sensor fusion. In Proceedings of the 2009 IEEE International Conference on Robotics and Automation, Kobe, Japan, 12–17 May 2009; pp. 303–304. [Google Scholar]
  31. Kumar, R.; Singh, B.; Shahani, D.T.; Chandra, A.; Al-Haddad, K.; Garg, R. Recognition of Power-Quality Disturbances Using S-Transform-Based ANN Classifier and Rule-Based Decision Tree. IEEE Trans. Ind. Appl. 2014, 51, 1249–1258. [Google Scholar] [CrossRef]
  32. Chen, S.-B.; Xu, Y.-L.; Ding, C.H.; Luo, B. A Nonnegative Locally Linear KNN model for image recognition. Pattern Recognit. 2018, 83, 78–90. [Google Scholar] [CrossRef]
  33. Codella, N.; Cai, J.; Abedini, M.; Garnavi, R.; Halpern, A.; Smith, J.R. Deep Learning, Sparse Coding, and SVM for Melanoma Recognition in Dermoscopy Images. In Applications of Evolutionary Computation; Springer Science and Business Media LLC: Munich, Germany, 2015; Volume 9352, pp. 118–126. [Google Scholar]
  34. Kozina, S.; Gjoreski, H.; Gams, M.; Luštrek, M. Three-layer Activity Recognition Combining Domain Knowledge and Meta-classification. J. Med. Biol. Eng. 2013, 33, 406–414. [Google Scholar] [CrossRef]
  35. Du Nguyen, H.; Tran, K.P.; Heuchenne, H.L. CUSUM control charts with variable sampling interval for monitoring the ratio of two normal variables. Qual. Reliab. Eng. Int. 2019, 36, 474–497. [Google Scholar] [CrossRef]
  36. Aytaçoğlu, B.; Woodall, W.H. Dynamic probability control limits for CUSUM charts for monitoring proportions with time-varying sample sizes. Qual. Reliab. Eng. Int. 2019, 36, 592–603. [Google Scholar] [CrossRef]
Figure 1. Example of transition activity.
Sensors 20 03117 g001
Figure 2. Overall activity recognition process.
Sensors 20 03117 g002
Figure 3. Mean, variance and STD of “Standing-QuickWalk”.
Sensors 20 03117 g003
Figure 4. Activity transition diagram.
Sensors 20 03117 g004
Figure 5. UI of the Android application.
Sensors 20 03117 g005aSensors 20 03117 g005b
Figure 6. A fragment of “Standing-Walking”.
Sensors 20 03117 g006
Table 1. Information of our dataset.
Basic ActivitySitting, Standing, Lying, Walking, Upstairs, Down Stairs, Running, QuickWalk
Sensors (Sample Frequency)1 Barometer (5 Hz),
1 3D-Accelerometer (50 Hz)
SubjectsNo. of Subjects10
Age Range25–40
Male/Female7/3
Height Range155 cm~180 cm
Time of Single Collection3 min
Size of Time Window1 s (50 data points)
Overlap0.5 s (25 data points)
Table 2. Duration of each activity.
ActivityTime (Data Point)
downstairs50–60
quickwalk50–60
upstairs50–60
walking50–60
running30–50
downstairs↔standing50
lying↔sitting160
quickwalk↔standing30
sitting↔standing150
upstairs↔standing40
standing↔walking45
walking↔quickwalk10–20
walking↔running10–20
Table 3. Duration of each activity.
No.FeatureFormula
1Mean a ¯
2Variance i = 1 n ( a i μ ) 2
3STD i = 1 n ( a i μ ) 2 n
4Maximum m a x ( a i )
5Minimum m i n ( a i )
6Range m a x ( a i ) m i n ( a i )
7ZCR i = 1 n s i g ( a i > 0 )
8Median m e d i a n ( a i )
9MAD m e d i a n ( | a i m e d i a n ( a i ) | )
10Information Entropy i = 1 m ( p i log ( p i ) )
11Kurtosis E [ ( a i μ ) 4 / σ 4 ]
12Skewness E [ ( a i μ ) 3 / σ 3 ]
13Coefficient c o v ( X , Y )
ZCR: zero crossing rate MAD: absolute median difference.
Table 4. Detailed category of activities.
ActivityBasic ActivityStatic ActivitySitting Standing Lying
Dynamic ActivityWalking Upstairs Downstairs Running QuickWalk
Transition ActivityLying-Standing Sitting-Standing
Standing-Upstairs Standing-Downstairs Standing-Walking Walking-Running
Walking-QuickWalk
Table 5. Recognition results comparison between three classifiers.
DTA01A02A03A04A05A06A07A08
A017030000000
A020745000000
A030071100000
A04000664411014
A05000184786404
A06060336333903
A070001006880
A080004110692
KNNA01A02A03A04A05A06A07A08
A017030000000
A020745000000
A030071100000
A040006794406
A050004848422010
A06000513935103
A070000006890
A080001400693
SVMA01A02A03A04A05A06A07A08
A017030000000
A020745000000
A030071100000
A040006841305
A05000125163006
A06060153938103
A070000006890
A080001200695
A01–A08 denote basic activities “sitting, standing, lying, walking, upstairs, downstairs, running, quickwalk”.
Table 6. Overall performance of four methods.
SVMA01A02A03A04A05A06A07A08A09SUMRecall
A016552340440000066300.988235
A020641725330000064750.991042
A0355651000000065200.998466
A040211456211101238412524664250.874864
A05000243596611743192764150.930008
A0600010812358521208619664850.90239
A0700032013635456064550.984353
A080005451257161466664130.958366
A0900035218617476213194429450.660102
KNNA01A02A03A04A05A06A07A08A09SUMRecall
A0166170850000066300.998039
A0206475000000064751
A03412650400000065200.997546
A04067195552761142416940464250.864125
A05002218856441392131149564150.879813
A060013355345512421326716864850.790131
A0700051670628941764550.974284
A0800019001263127064130.984251
A09000220206162167245194529450.660441
STD-TAA01A02A03A04A05A06A07A08A09SUMRecall
A0166184800000066300.99819
A0206475000000064751
A032241645700000065200.990337
A04002260146701226713364250.936031
A05000154584846774124964150.911613
A06000188205562216910519664850.866924
A0700010406375224464550.987607
A08000701404262543364130.975207
A09007122105917825251729450.854669
CUSUMA01A02A03A04A05A06A07A08A09SUMRecall
A016603171000000066300.995928
A0206475000000064751
A0363651100000065200.99862
A04021157417272887635464250.893541
A050012121579813910911412264150.903819
A060013241345533615426712964850.822822
A07000254457630024564550.975988
A0800231204051614712264130.958522
A09000120206162167133215729450.732428

