


Abstract
Grassland productivity faces heightened uncertainty under nonlinear climatic forcing. This study characterizes the spatial heterogeneity of nonlinear variations and nonstationary climate sensitivities across the Eurasian Steppe Region (EASR) to provide a scientific basis for its adaptive management. Using the aboveground net primary productivity (ANPP) and climate datasets (1982–2015), we employed piecewise linear regression, LOWESS, and sliding window partial correlation analysis to identify temporal turning points and dynamic climate–productivity relationships. We identified distinct turning points in 1994 and 2008, revealing a phased “Increasing–Decreasing–Increasing” trajectory. A key novelty is the mapping of eight phased trajectory patterns, illustrating significant spatial heterogeneity in productivity trends. Furthermore, we demonstrate temporally reversed climate sensitivities. Notably, the sensitivity of ANPP to temperature shifted from positive to negative as warming-induced water stress intensified. While precipitation remains the dominant driver (68% of the region), its influence is nonstationary and state-dependent. In the Qinghai–Tibet Plateau, the limiting factor transitioned from thermal to water availability. Overall, productivity in the EASR appears to undergo phased reorganization under shifting climatic baselines. Our findings suggest that future ecosystem models should incorporate time-varying sensitivity parameters to account for nonlinear dynamics and potential trend reversals in grassland ecosystems.
1. Introduction
In the context of intensifying global warming, the interannual variability of terrestrial ecosystem productivity is subject to increasingly strong climatic forcing, thereby presenting significantly heightened uncertainty. The IPCC Sixth Assessment Report highlights that anthropogenic warming is particularly pronounced over terrestrial regions. Moreover, this warming is accompanied by altered precipitation patterns and an increased frequency of extreme climate events. These shifts consequently exert profound impacts on vegetation growth, carbon cycling, and critical ecosystem services [1]. However, growing evidence suggests that these climatic shifts are triggering complex, nonlinear ecosystem responses rather than simple linear trajectories. While earlier studies often depicted global vegetation changes as “persistent greening” or “continuous browning,” recent high-resolution remote sensing analyses have revealed widespread “trend reversals” and saturation effects in vegetation growth [2,3]. This indicates that the sensitivity of vegetation to climate is not static but instead evolves with changing environmental baselines, potentially involving ecological tipping points and threshold behaviors [2,4].
Aboveground net primary productivity (ANPP) serves as a pivotal indicator characterizing the structure and function of grassland ecosystems. Consequently, its interannual variability effectively reflects the ecosystem’s response to climatic fluctuations. In arid and semi-arid grassland ecosystems, although water availability is widely recognized as the dominant driver of interannual variability and long-term trends in ANPP, this climatic control is not invariant in space or time. Recent studies focusing on the “productivity–environment” relationship have increasingly demonstrated that, as climatic backgrounds and resource limitation patterns shift, the sensitivity of ecosystem functions to climatic factors often exhibits significant state-dependence and dynamic characteristics [3,5].
For instance, a study based on long-term ANPP monitoring data from 13 typical global grasslands indicated that the direct impacts of extreme drought and wetness depend on the local climatic conditions; specifically, the ANPP of grasslands in drier climates exhibited heightened sensitivity to hydrological anomalies [2]. Similarly, analyses utilizing a nonlinear dynamical framework and 40-year observational records from 48 grassland sites in Mongolia revealed that productivity responses to climatic drivers present time-varying, state-dependent characteristics. Therefore, the “climate–productivity” relationship cannot be fully characterized under the assumption of stationarity [3]. Furthermore, research conducted on the grassland ecosystems of the Qinghai–Tibet Plateau revealed that regional environmental gradients significantly modulate the sensitivity of interannual ANPP variability to temperature and precipitation [6]. However, beyond precipitation and temperature, mounting evidence suggests that Vapor Pressure Deficit (VPD) and radiation conditions may also reshape the long-term trends and interannual fluctuations of grassland productivity at regional scales [7,8,9,10]. Most importantly, variations in productivity and their underlying drivers often exhibit significant spatial heterogeneity, arising from differences in hydrothermal regimes, topography, and soil conditions [11].
Spanning a vast climatic gradient from humid to arid and cold-temperate to temperate zones, the Eurasian Steppe Region (EASR) represents one of the most significant and continuous grassland belts globally, thus serving as an ideal natural laboratory for testing hypotheses regarding nonstationary climate sensitivities. Previous studies in the EASR have noted that precipitation use efficiency (PUE) fluctuates significantly across different biomes and temporal scales [11]. Concurrently, large-scale atmospheric circulation modes, such as ENSO and NAO, modulate temperature and precipitation variability in the EASR through teleconnections. These modes influence the grassland growth environment on interannual to decadal scales, consequently intensifying the non-stationarity of variability in interannual productivity [12]. At the same time, recent evidence suggests that the impacts of drought and productivity stability differ markedly across the broader Eurasian steppes, reinforcing the need to resolve both non-stationarity and spatial heterogeneity at regional scales [13,14,15].
Despite these advances, EASR-scale assessments still often emphasize linear trends or stationary correlations, leaving the joint characterization of (i) nonlinear turning points in ANPP, (ii) time-evolving (nonstationary) climate sensitivities, and (iii) their spatial heterogeneity insufficiently explored. In light of these insights, this study proposes the following hypotheses: (1) The interannual variation in ANPP in the EASR is not monotonically linear at the regional scale; instead, it exhibits a phased pattern characterized by distinct turning points. (2) The relationship between ANPP and climatic factors exhibits nonstationary temporal evolution. Finally, (3) at the regional scale, precipitation acts as the primary climatic driver of interannual ANPP variation, whereas temperature and cloud cover influence ANPP changes only in localized areas. However, both the trends in ANPP and its climate sensitivity possess significant spatial heterogeneity.
To verify the aforementioned hypotheses, this study leveraged datasets comprising ANPP, temperature, precipitation, and cloud cover. Consequently, a comprehensive methodological framework including simple linear regression, Locally Weighted Scatterplot Smoothing (LOWESS), piecewise linear regression, and partial correlation analysis was employed. Specifically, this study aims to achieve the following objectives: (1) to quantify the interannual variability in ANPP across the Eurasian steppe and identify its long-term trends; (2) to elucidate the dynamic response relationships between ANPP and key climatic factors, focusing on their temporal non-stationarity; and (3) to reveal the spatial differentiation patterns of ANPP variations and their climatic drivers by identifying dominant regional types. Ultimately, these findings are expected to provide a scientific basis for the sustainable management of the EASR in the context of climate change.
2. Materials and Methods
2.1. Study Area
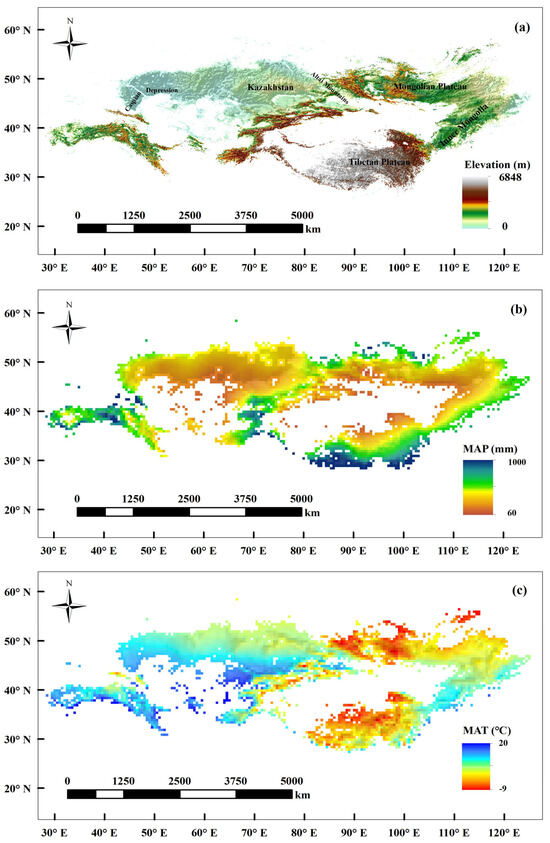
The Eurasian steppe region (EASR), situated in the northern mid-latitudes, spans approximately 110 degrees of longitude—stretching from the mouth of the Danube River in the west, traversing Russia, Kazakhstan, and Mongolia to the Songliao Plain in Eastern China, and extending southwest toward the Himalayas (Figure 1a) [16,17,18]. Although temperate grasslands are among the most threatened biomes globally [19], the Asian portion of the EASR remains relatively well-preserved compared to the tall-grass prairies of North America or the steppes of Eastern Europe. Climatic conditions vary significantly across the EASR, with multiyear mean annual precipitation (MAP) ranging from 60 to 1100 mm (Figure 1b) and mean annual temperature (MAT) varying from −9 to 20 °C (Figure 1c). Notably, the geographical extent of the EASR lacks a uniform definition in the existing literature. Consequently, we delineated the boundaries of the EASR and its three subregions using 2012 Moderate Resolution Imaging Spectroradiometer (MODIS) Land Cover data, consistent with descriptions provided in previous studies [17,20,21]. The study area encompasses several distinct grassland types, primarily including meadow steppe, typical steppe, desert steppe, and alpine grassland [22]. These ecosystems are dominated by key species such as Stipa capillata, Stipa grandis, Festuca ovina, Leymus chinensis, and various species of Artemisia [16,21]. Furthermore, the region’s soil distribution exhibits significant diversity, with Chernozems and Phaeozems prevailing in the eastern meadow steppes, while Kastanozems, Calcisols, and Leptosols are widely distributed across the typical, desert, and alpine steppe regions [23,24].
Figure 1.
The spatial distribution of elevation (a); mean annual precipitation (MAP) (b); and mean annual temperature (MAT) (c) in the Eurasian steppe region.
2.2. Data Sources
2.2.1. ANPP Data
Annual ANPP data for the period 1982–2015 with a spatial resolution of 0.083° were used in this study. These data were simulated using the Integrated ANPPNDVI model developed by Jiao et al. [25], which is an empirical model based on field-measured ANPP and Normalized Difference Vegetation Index (NDVI) data. The model explicitly accounts for spatial heterogeneity across the study area and composite NDVI periods [25].
The long-term NDVI time series employed in the Integrated ANPPNDVI model was derived from the third-generation GIMMS NDVI3g.v1 dataset, produced by the Global Inventory Modelling and Mapping Studies (GIMMS) group. These data (available at http://www.earthdata.nasa.gov/data/catalog/ornl-cloud-global-veg-greenness-gimms-3g-2187-1, accessed on 15 January 2026) were acquired via Advanced Very High-Resolution Radiometer (AVHRR) sensors onboard National Oceanic and Atmospheric Administration (NOAA) satellites. The dataset was processed at a spatial resolution of 0.083° using the 15-day Maximum Value Composite (MVC) technique [26,27].
The Integrated ANPPNDVI model [25] was parameterized initially using the NDVI3g.v0 dataset, which is temporally limited to 1981–2013. To utilize the extended temporal coverage of the NDVI3g.v1 dataset, we addressed the systematic discrepancies identified between the two versions (Figure S1); in particular, we quantified the linear relationships between NDVI 3g.v0 and NDVI 3g.v1 at the pixel scale and recalibrated the model accordingly. The ANPP estimates derived from the recalibrated model (NDVI3g.v1) showed high consistency with those from the original model (NDVI3g.v0) for the overlapping period (1982–2013; see Figure S2). These results confirm that the recalibrated ANPP data provide a robust basis for the subsequent analyses in this study.
2.2.2. Climatic Variables
The monthly climatic variables used in this study included air temperature, precipitation, and cloud cover (as a proxy for radiation conditions). These data were extracted from climatic data stored at the University of East Anglia’s Climate Research Unit (CRU TS 4.01) (https://crudata.uea.ac.uk/cru/data/hrg/cru_ts_4.01/cruts.1709081022.v4.01/, accessed on 15 January 2026) [28]. The CRU TS 4.01 dataset, characterized by a spatial resolution of 0.5° × 0.5° and covering the temporal range from 1901 to 2016, was restricted to our study period of 1982–2015. The monthly time series were further integrated over 12 months into annual climatic variables (mean annual temperature, MAT; mean annual precipitation, MAP; and cloud cover, CC) at a spatial resolution of 0.083°.
2.3. Methods
2.3.1. Trend Analysis of ANPP and Climatic Factors
This study employs three distinct methods to examine the temporal trends in ANPP and climatic variables. The overall change trends of ANPP and climate factors at the regional and pixel scales from 1982 to 2015 were analyzed using ordinary least squares linear regression [29]. The statistical significance of ANPP trends was evaluated using a t-test (Equation (1)):
where denotes the number of years used to analyze the ANPP trend, is the ANPP value in the year, and denotes the simple linear regression slope: if , it indicates an increasing trend in ANPP, while indicates a decreasing trend.
The locally weighted scatterplot smoothing (LOWESS) and piecewise linear regression (PLR) methods were used to further explore the patterns of ANPP variation. LOWESS is a non-parametric method, which involves selecting a local subset of a dataset and fitting a polynomial regression curve with respect to this subset in order to determine the regional patterns and trends in data [30,31].
This study also employed PLR to examine whether there was a significant turning point in the ANPP trend during the period 1982–2015 (Equation (2)).
where represents the corresponding year, with value ranging from 1982 to 2015; represents the ANPP value in year ; represents the estimated turning point at which the dynamic change trend of the ANPP underwent a significant change; , , and are regression coefficients; and is the fitting residual. In particular, and are the dynamic change rates of the ANPP before and after the time turning point (), respectively. The least-squares method was used to estimate the three regression coefficients, and a t-test was performed to determine whether the piecewise linear regression was significant at the p < 0.05 level by testing whether b2 = 0.
2.3.2. Correlation Analysis Between Vegetation Dynamics and Climate Change
Partial correlation analyses were conducted to characterize the relationships between ANPP dynamics and climatic factors. The partial correlation coefficient identifies the linear association between two variables while controlling for other confounding covariates; in this study, specifically, the partial correlation between ANPP and a target climatic variable (e.g., MAT) was calculated by controlling for the other two climatic variables (e.g., MAP and CC) to eliminate their potential confounding effects. Previous studies have shown that background climate variations over temporal scales of 15 years or longer can significantly alter the relationship between ANPP and climatic drivers [32,33]. Consequently, we analyzed partial correlations between ANPP and climatic factors from 1982 to 2015 using a 15-year sliding window approach (e.g., the coefficient for 2000 represents the 1993–2007 window). The 15-year window length was selected based on its widespread application in nonstationary ecological analysis, as it provides a sufficient sample size to ensure statistical stability while remaining sensitive enough to capture decadal shifts in climate–vegetation interactions [34,35].
3. Results
3.1. Dynamics of Regional-Scale ANPP and Its Relationships with Climatic Factors
3.1.1. Interannual Trends in Regional-Scale ANPP and Climatic Factors
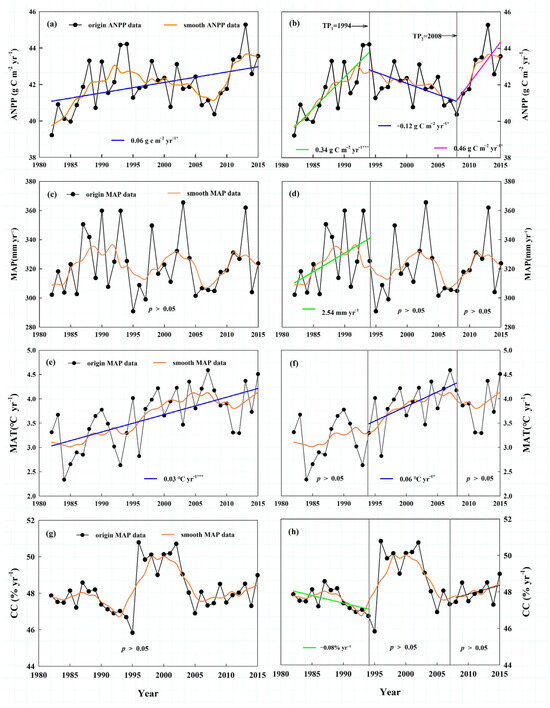
For the entire EASR, simple linear regression analysis indicated that ANPP exhibited a significant increasing trend from 1982 to 2015 (0.06 g C m−2 yr−1, p < 0.05; Figure 2a). Simultaneously, MAT demonstrated a significant upward trend at a rate of 0.03 °C yr−1 (p < 0.001; Figure 2e). In contrast, neither MAP nor CC displayed evident trends (Figure 2c,g). Consequently, the regional climate was characterized by a warming and drying trend over the past three decades. However, the LOWESS and PLR analyses revealed that the temporal trajectory of ANPP was not consistent throughout the 1982–2015 period, with significant shifts occurring in 1994 and 2008 (Figure 2b).
Figure 2.
Temporal dynamics of ANPP and climatic factors from 1982 to 2015. (a,b) The overall trend and phased characteristics of ANPP during the period 1982–2015; (c,d) The overall trend and phased characteristics of MAP during the period 1982–2015; (e,f) The overall trend and phased characteristics of MAT during the period 1982–2015; (g,h) The overall trend and phased characteristics of CC during the period 1982–2015. The black line with dots represents the original data, and the orange line represents the curve smoothed using the LOWESS method. * indicates that the regression relationship is significant at the p < 0.05 level, whereas *** denotes significance at the p < 0.001 level.
During the 1982–1994 period, ANPP increased significantly at a rate of 0.34 g C m−2 yr−1 (p < 0.001; Figure 2b). Simultaneously, MAP rose significantly by 2.54 mm yr−1 (p < 0.05; Figure 2d). Conversely, CC decreased gradually at 0.08% yr−1 (Figure 2h), whereas MAT exhibited substantial fluctuations without a discernible trend (Figure 2e).
However, during the 1994–2008 period, the trend in ANPP shifted to a significant decrease (0.12 g C m−2 yr−1, p < 0.05; Figure 2b). In contrast, MAT showed a significant upward trend of 0.06 °C yr−1 (p < 0.05; Figure 2f), whereas the trends for both MAP and CC were insignificant (Figure 2d,h). Subsequently, from 2008 to 2015, ANPP increased significantly again at a rate of 0.46 g C m−2 yr−1 (p < 0.001; Figure 2b). Although MAP increased dramatically between 2008 and 2013, it declined in 2014 and 2015 (Figure 2d). Furthermore, the rate of change in MAT was lower than that in the preceding period (Figure 2f), while CC showed no apparent trend (Figure 2h).
3.1.2. Correlations Between Regional-Scale ANPP Dynamics and Climatic Factors
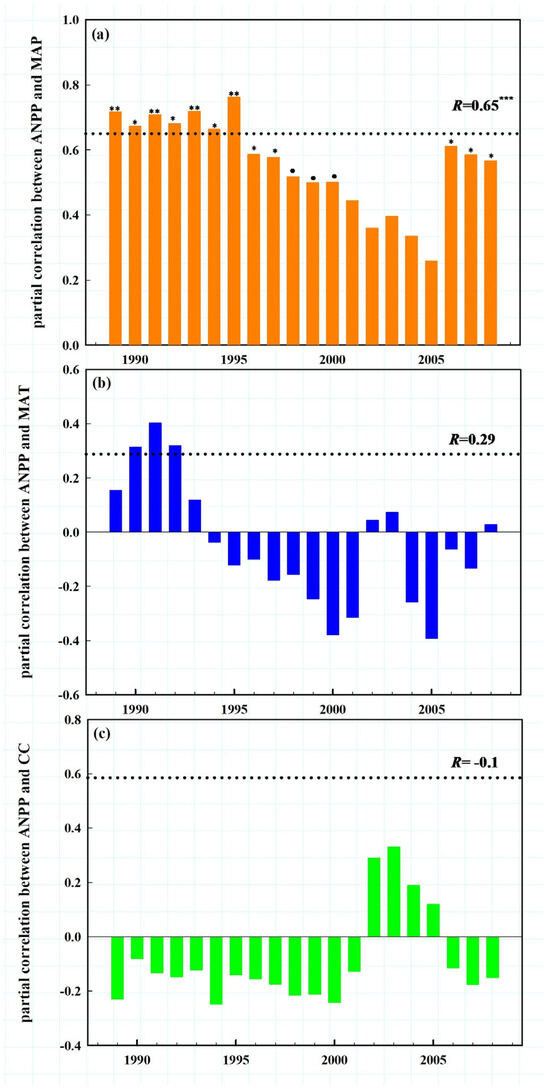
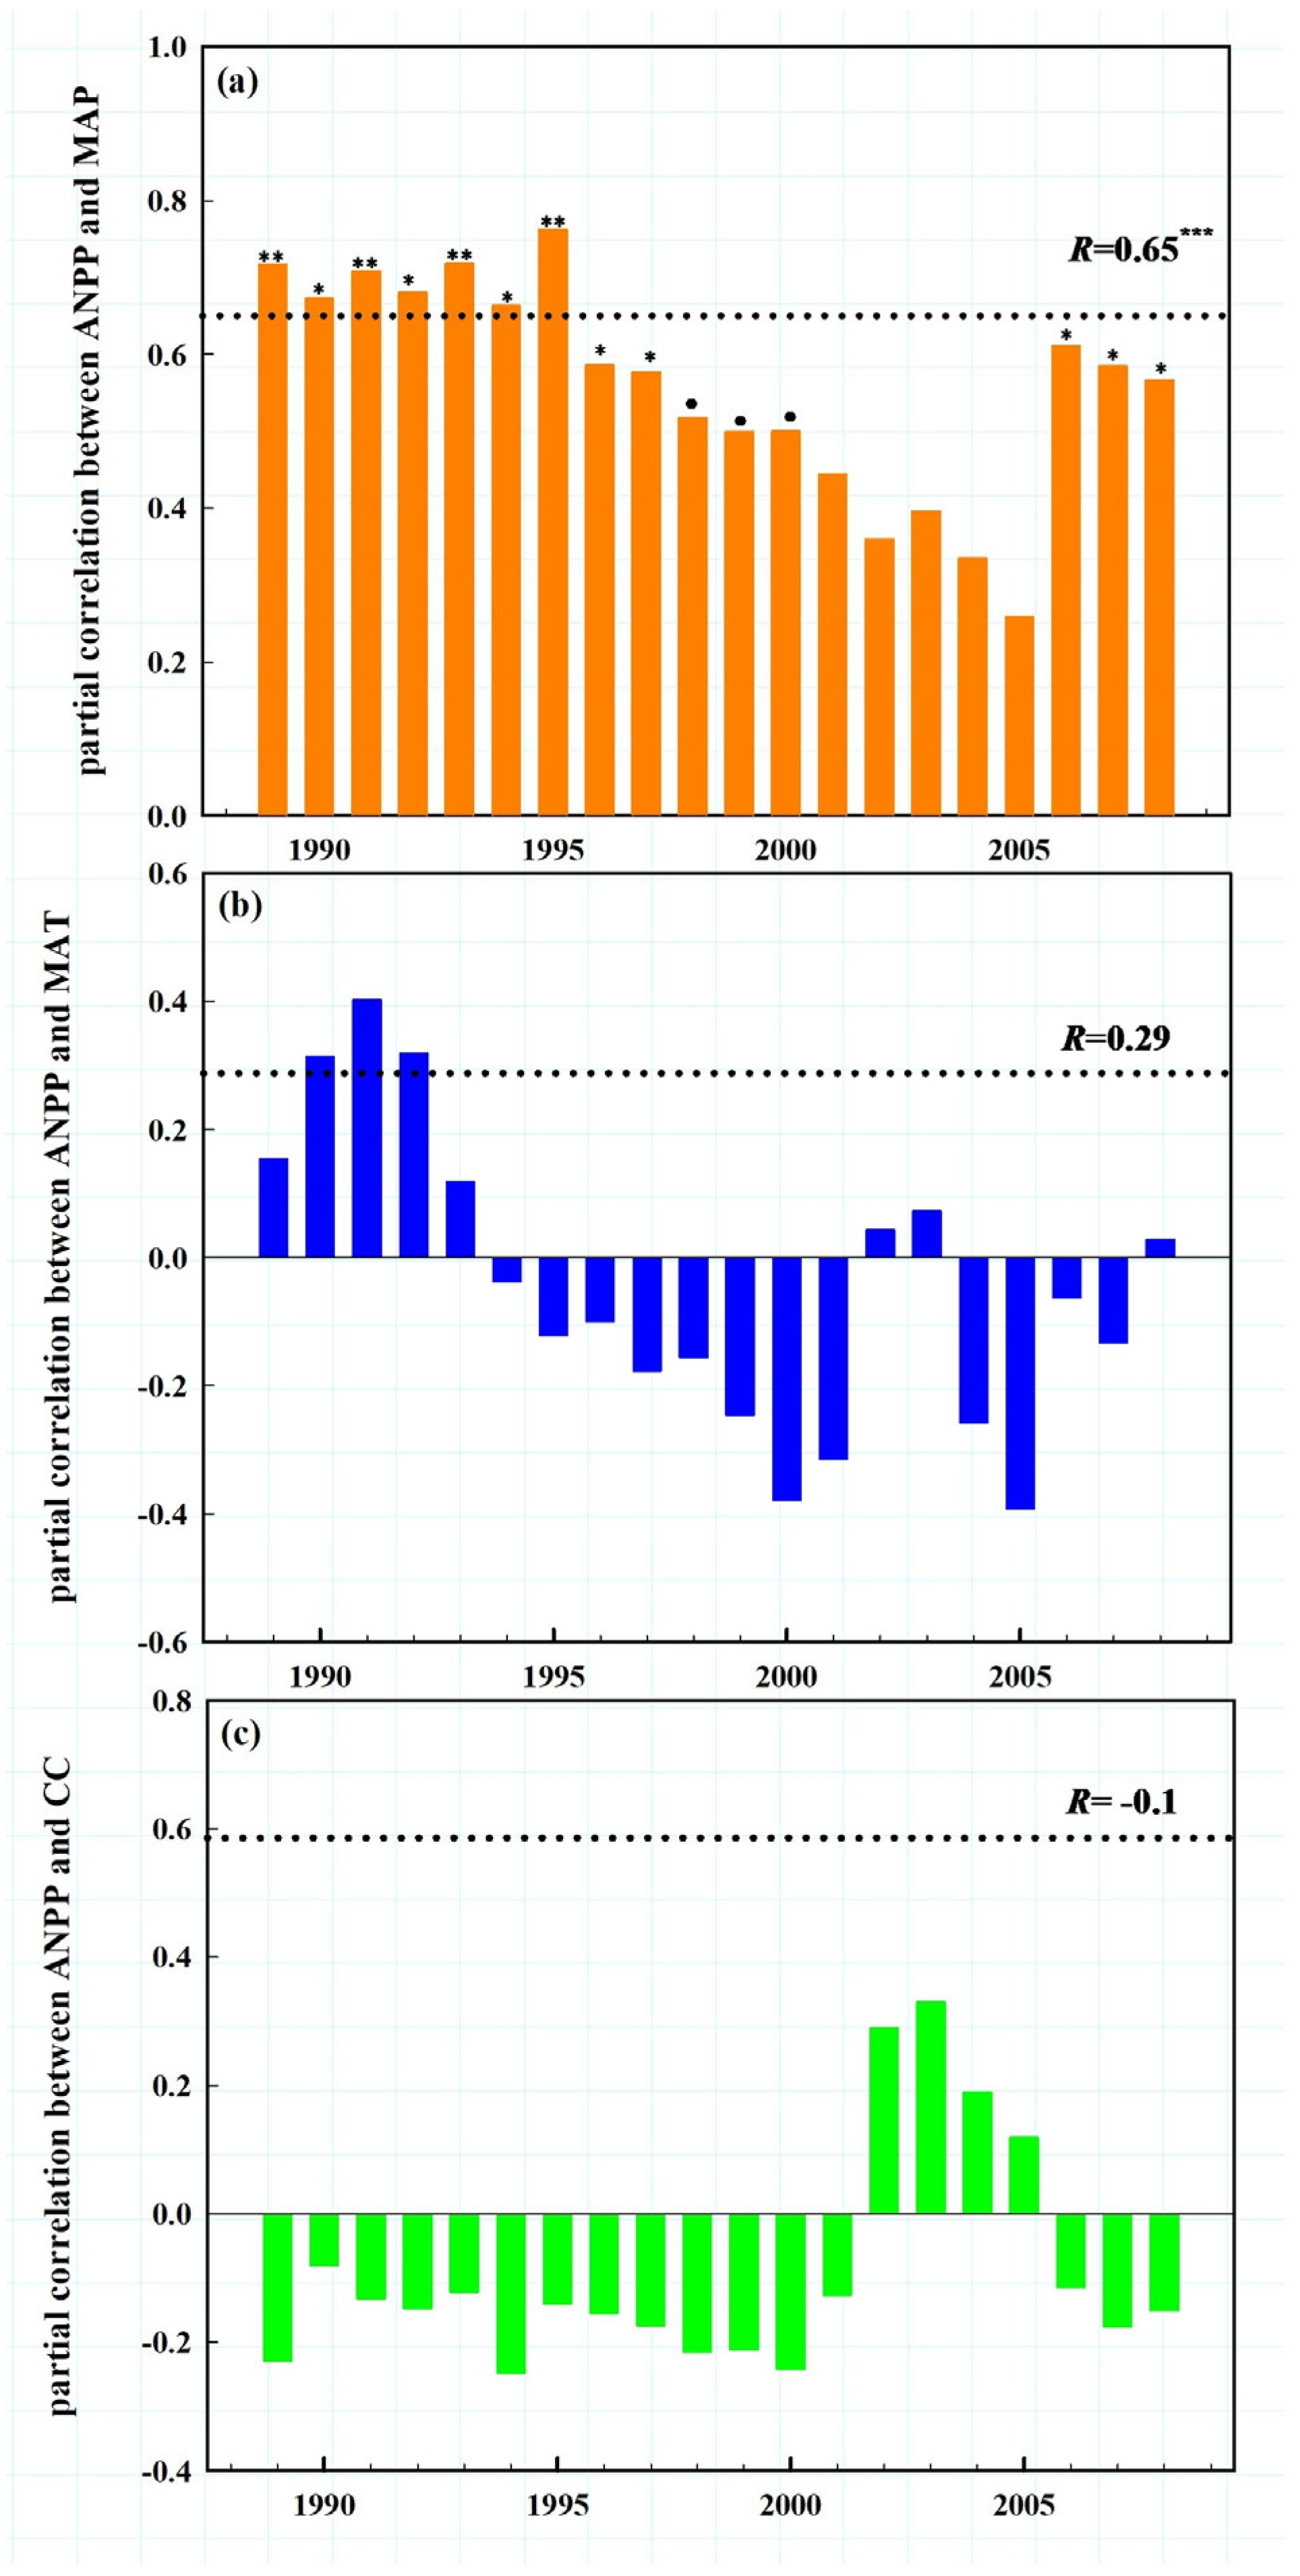
For the EASR as a whole, the partial correlation between ANPP and MAP over the entire study period (1982–2015) was significantly positive, with a correlation coefficient of 0.65 (Figure 3a). In contrast, the relationship with MAT was weakly positive (R = 0.29) and statistically insignificant (p > 0.05; Figure 3b); similarly, the correlation with CC was weakly negative (R = −0.01) and also insignificant (Figure 3c).
Figure 3.
Variations in the partial correlation coefficients between (a) ANPP and MAP; (b) ANPP and MAT; and (c) ANPP and CC with a 15−year moving window. In (a–c), the dashed lines with black circles represent the partial correlation coefficients between ANPP and MAP, MAT, and CC, respectively, over the entire study period (1982–2015). The asterisks *, **, and *** indicate statistical significance at the p < 0.05, p < 0.01, and p < 0.001 levels, respectively.
To further investigate temporal variations, a 15-year sliding window was used to analyze the partial correlation coefficients between ANPP and MAP, MAT, and CC (e.g., the coefficient for the year “2000” corresponds to the 1993–2007 window). This analysis revealed the high temporal heterogeneity of the relationships between ANPP and climatic factors. As illustrated in Figure 3, although the partial correlation between ANPP and MAP remained consistently positive, it exhibited distinct temporal phases. Specifically, it was characterized by a stronger correlation in the early windows, which subsequently weakened, and then strengthened again in later periods (Figure 3a). Regarding the partial correlation between ANPP and MAT, it was weakly positive in the early windows. However, it shifted to a predominantly negative correlation that peaked in intensity during the middle-to-late windows, eventually diminishing towards zero (Figure 3b). The partial correlation between ANPP and CC was largely negative in the early windows. Nevertheless, a phasic shift to a positive correlation emerged in the early 2000s, consequently reverting to a predominantly negative pattern in the later periods (Figure 3c).
3.2. Spatial ANPP Trend Patterns
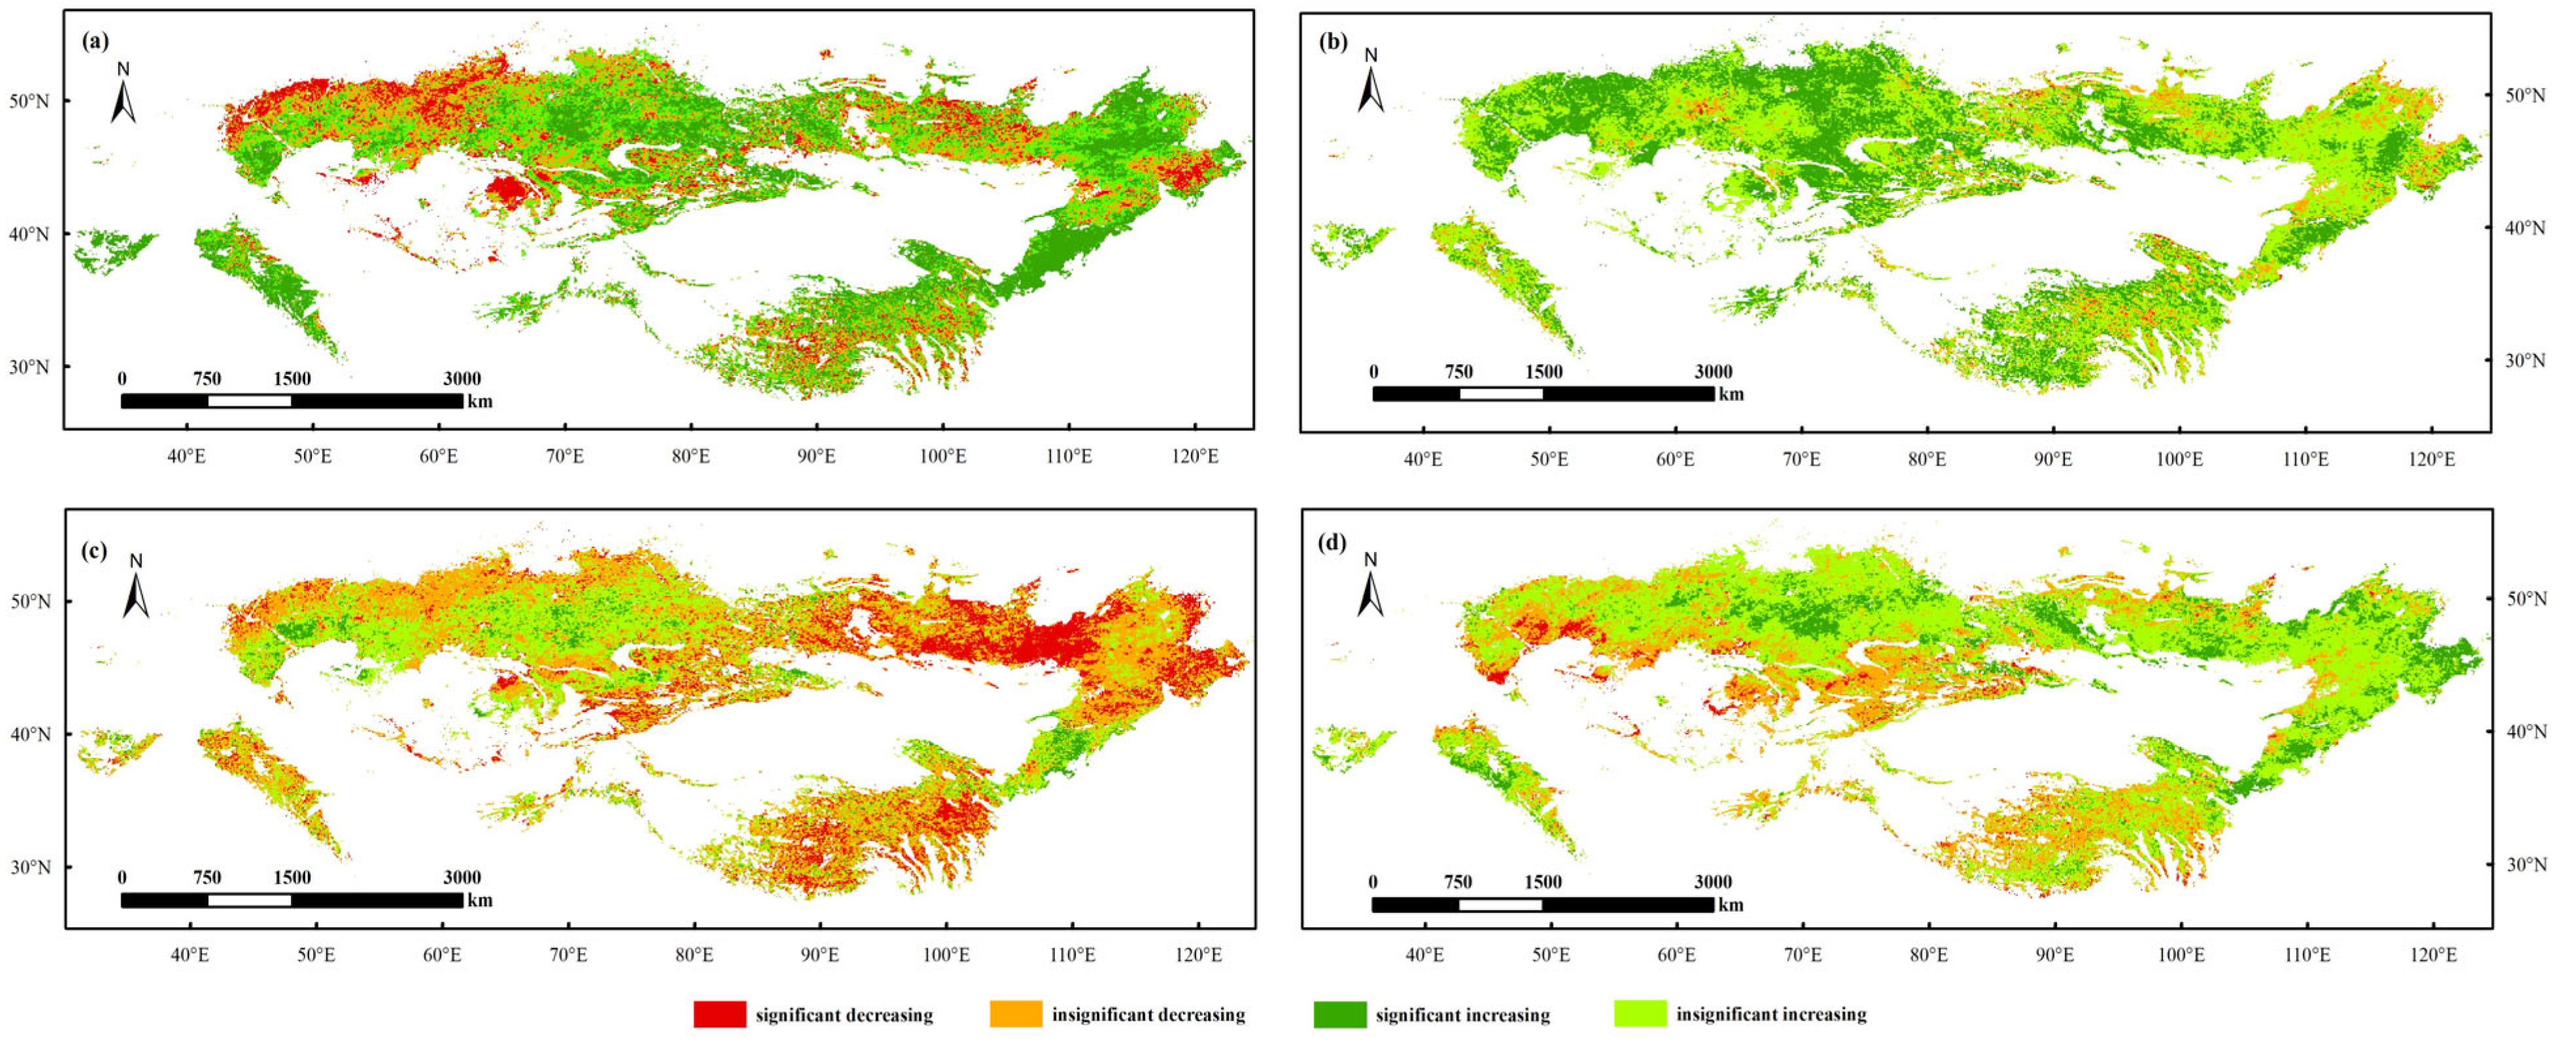
Although the spatial distribution of ANPP trends from 1982 to 2015 exhibited heterogeneity (Figure 4a), the region demonstrated an overall increasing trend (Table 1). Specifically, approximately 32% of the EASR displayed a significant upward trend in ANPP, primarily distributed across the Ordos Plateau, the eastern provinces of Mongolia (Dornod and Sukhbaatar), the Altai Mountains, the Tianshan Mountains, the East Kazakh Uplands, the Caspian Lowland, the Anatolian Plateau, and the Zagros Mountains. However, a minority of the region (13%) showed a significant decreasing trend, which was mainly concentrated in the Northeastern Inner Mongolia Plateau (including Xilingol League, Hinggan League, and Chifeng City), Central and Western Mongolia, the Northwestern Kazakhstan Uplands, and the Northern Caspian Lowland (Figure 4a).
Figure 4.
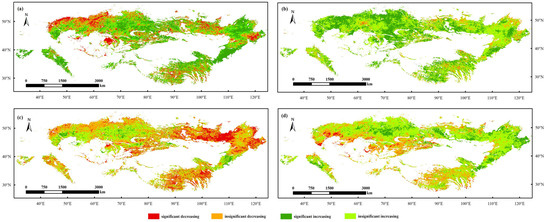
Spatial distribution of linear trends in ANPP during different periods. (a) 1982–2015; (b) 1982–1994; (c) 1994–2008; and (d) 2008–2015.
Table 1.
Percentage of areas showing significant increasing (SI), significant decreasing (SD), and negligible decreasing trends in ANPP during different periods.
The spatial ANPP trend patterns during the three sub-periods (1982–1994, 1994–2008, and 2008–2015) differed significantly from the long-term trend observed between 1982 and 2015 (Figure 4b–d). During the 1982–1994 period, ANPP increased across the majority (89%) of the EASR. Specifically, significant increases (p < 0.05) were observed for 40% of the region; most notably in the Ordos Plateau, the border region between Xilingol League (Inner Mongolia) and the Dornod and Sukhbaatar provinces of Mongolia, the Northwestern Kazakh Uplands, and the Northern Caspian Lowland. In contrast, only 0.7% of the area showed a significant decreasing trend (Figure 4b).
However, from 1994 to 2008, the trajectory shifted, with ANPP declining across 62% of the EASR. Significant decreases (18%) were primarily distributed in Central and Eastern Mongolia, Central and Eastern Inner Mongolia, and the Southeastern Qinghai–Tibet Plateau. Meanwhile, only 6.1% of the region exhibited a significant increase during this interval (Figure 4c). Subsequently, during the 2008–2015 period, approximately 68% of the EASR showed a renewed increasing trend in ANPP. Among these areas, 15% showed significant increases, distributed across most of the Mongolian Plateau, the Eastern Kazakh Uplands, and the Southeastern Qinghai–Tibet Plateau. Although growth was dominant, significant decreases persisted in 3.4% of the region, primarily concentrated in the Caspian Lowland, the Tianshan Mountains, and sporadic patches of the Qinghai–Tibet Plateau (Figure 4d).
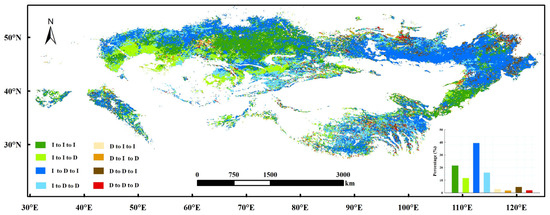
Based on the analysis of ANPP spatial patterns across three distinct periods (1982–1994, 1994–2008, and 2008–2015), the evolutionary trajectories of ANPP over the past three decades were classified into eight categories (Figure 5). Significantly, four primary trajectories—“Increasing to Decreasing to Increasing,” “Increasing to Increasing to Increasing,” “Increasing to Decreasing to Decreasing,” and “Increasing to Increasing to Decreasing”—dominated the landscape, collectively encompassing 88% of the EASR; conversely, the remaining four types—“Decreasing to Increasing to Increasing,” “Decreasing to Increasing to Decreasing,” “Decreasing to Decreasing to Increasing,” and “Decreasing to Decreasing to Decreasing”—exhibited only a sporadic distribution (11%).
Figure 5.
Spatial distribution of ANPP variation trends from 1982 to 2015. The inset graph shows the frequency distribution of the corresponding trend types. I and D denote Increasing and Decreasing, respectively.
Specifically, the “Increasing to Decreasing to Increasing” pattern was the most widespread, covering 39% of the region. Consequently, it represents the dominant trend, situated mainly in the Mongolian Plateau (excluding the Ordos Plateau), the Tibetan Plateau, the Northern Kazakh Uplands, and the North Caspian coast (Figure 5). Furthermore, pixels exhibiting the “Increasing to Increasing to Increasing” trend constituted 21% of the EASR, occurring primarily in the Ordos Plateau and the Central Kazakh Uplands. Meanwhile, the “Increasing to Decreasing to Decreasing” pattern accounted for 16% of the region, predominantly in the Central Tibetan Plateau, and the “Increasing to Increasing to Decreasing” trajectory covered 12% of the EASR, distributed mainly across the Caspian Lowland.
3.3. Spatial Patterns of Correlations Between ANPP and Climatic Factors
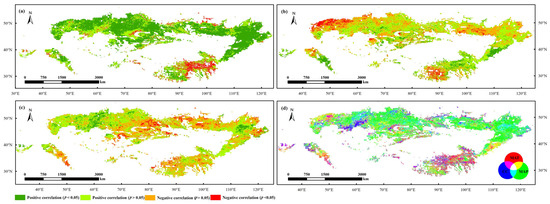
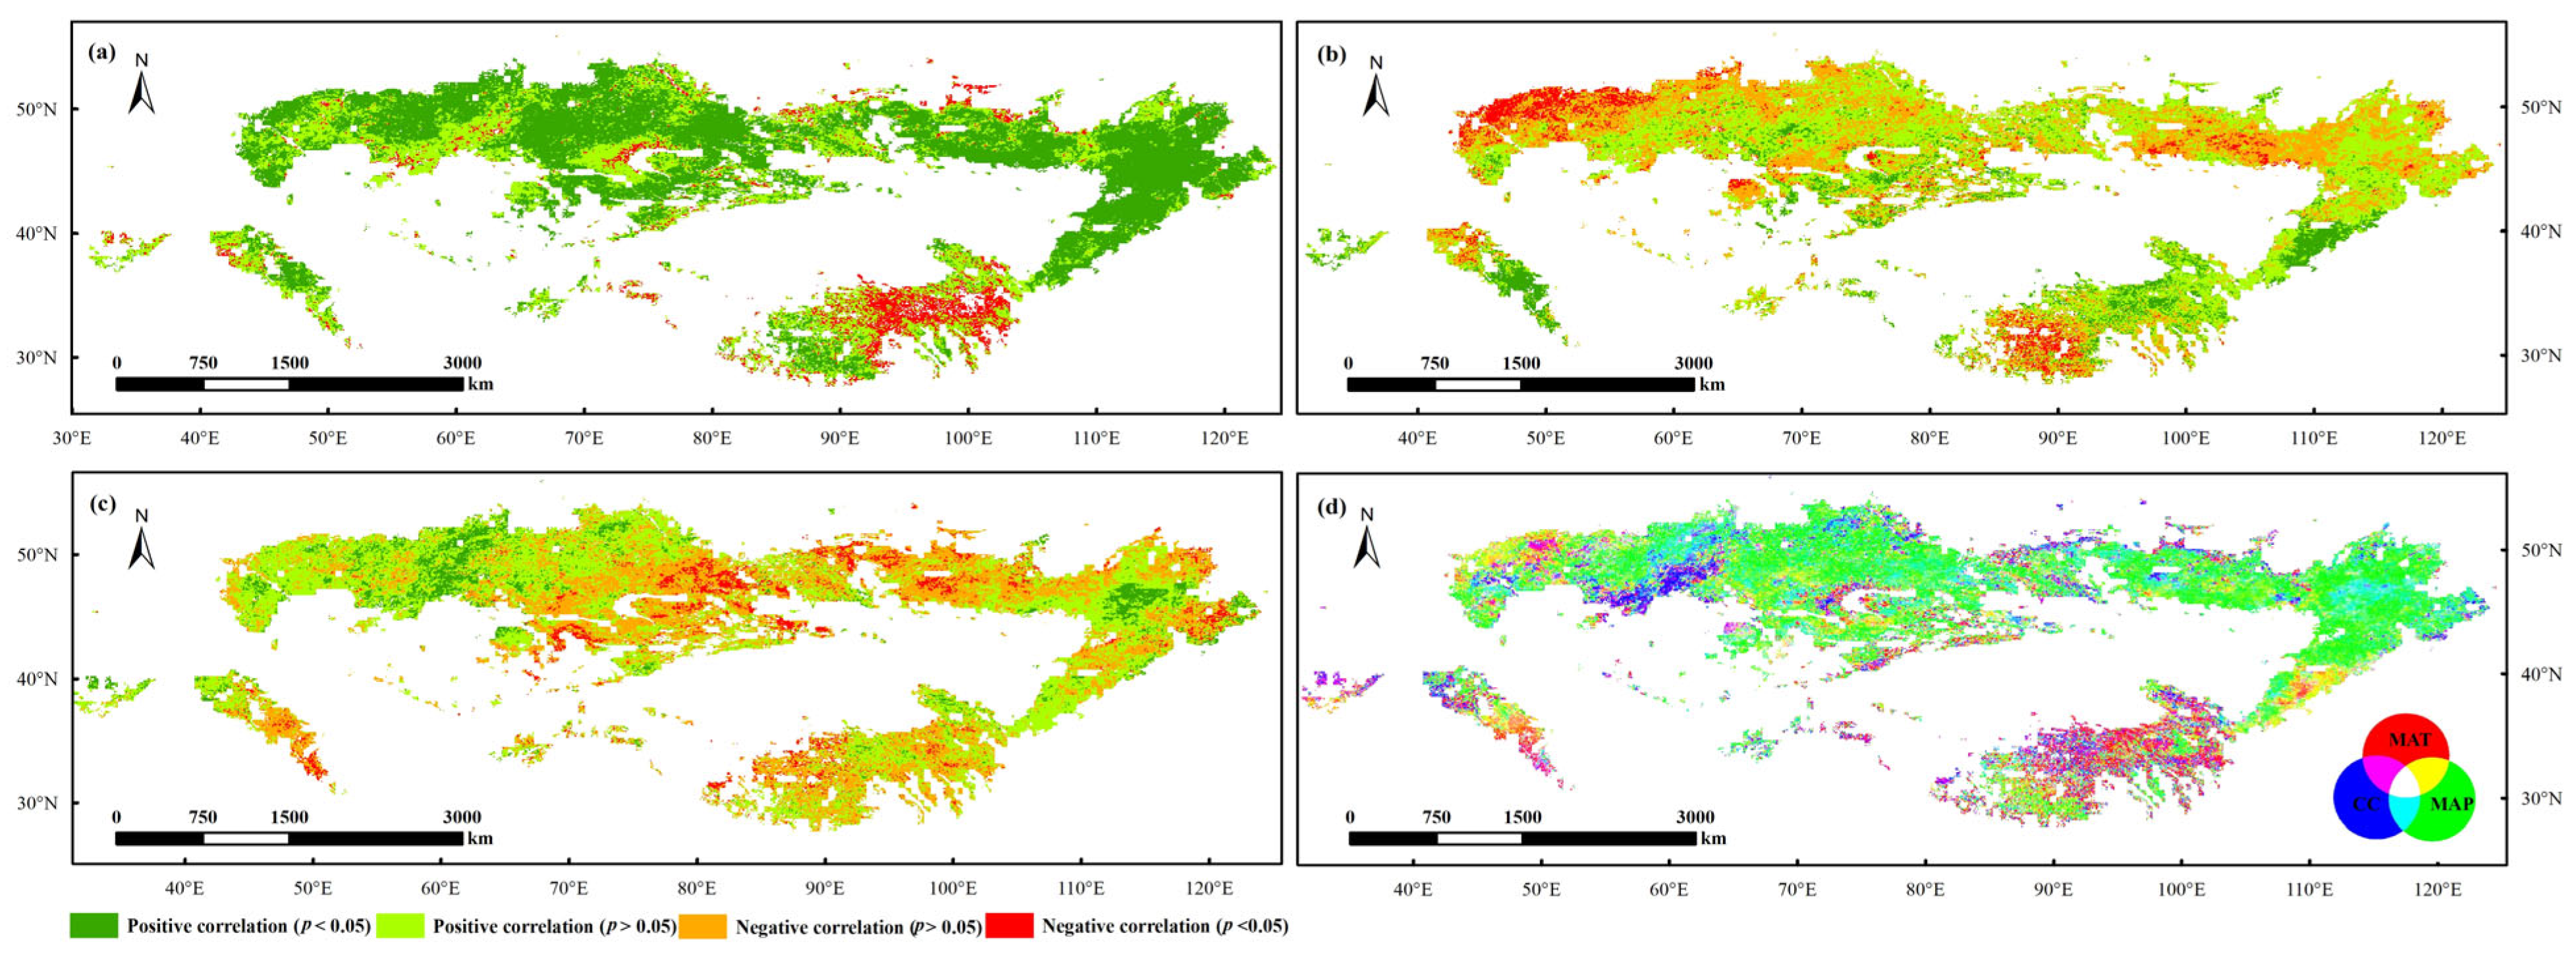
We analyzed the partial correlations between ANPP and MAP, MAT, and CC in the EASR at the pixel scale for the period 1982–2015 (Figure 6). For MAP, a positive correlation with ANPP was observed in the majority (68.20%) of the EASR. Specifically, areas showing significant positive correlations accounted for 25.80% and were primarily distributed across the entire Mongolian Plateau, the Kazakh Uplands, the Caspian Lowland, and the Southwestern Tibetan Plateau, while areas exhibiting a significant negative correlation with MAP were mainly concentrated in the central and eastern regions of the Tibetan Plateau (Figure 6a). Regarding MAT, ANPP exhibited a negative correlation over most of the EASR (Figure 6b), with regions showing significant negative correlations found primarily in the Southwestern Tibetan Plateau, Central and Eastern Mongolia, and the Northern Caspian Lowland; conversely, areas significantly positively correlated with MAT were distributed mainly in the East and Central Tibetan Plateau and the Ordos Plateau (Figure 6b). Furthermore, ANPP and CC were predominantly negatively correlated, although exceptions were observed at the border of the Xilingol League (Inner Mongolia) with the Dornod and Sukhbaatar Provinces (Mongolia), as well as in the Western Kazakh Uplands (Figure 6c). Additionally, it is worth noting that ANPP in parts of the Ordos region was subject to the combined effects of both MAP and MAT (Figure 6d).
Figure 6.
Spatial distribution of partial correlations between ANPP and climatic factors in the EASR over the period 1982–2015: (a) the correlation between ANPP and MAP; (b) the correlation between ANPP and MAT; (c) the correlation between ANPP and CC; and (d) combinations of correlations between ANPP and climatic variables.
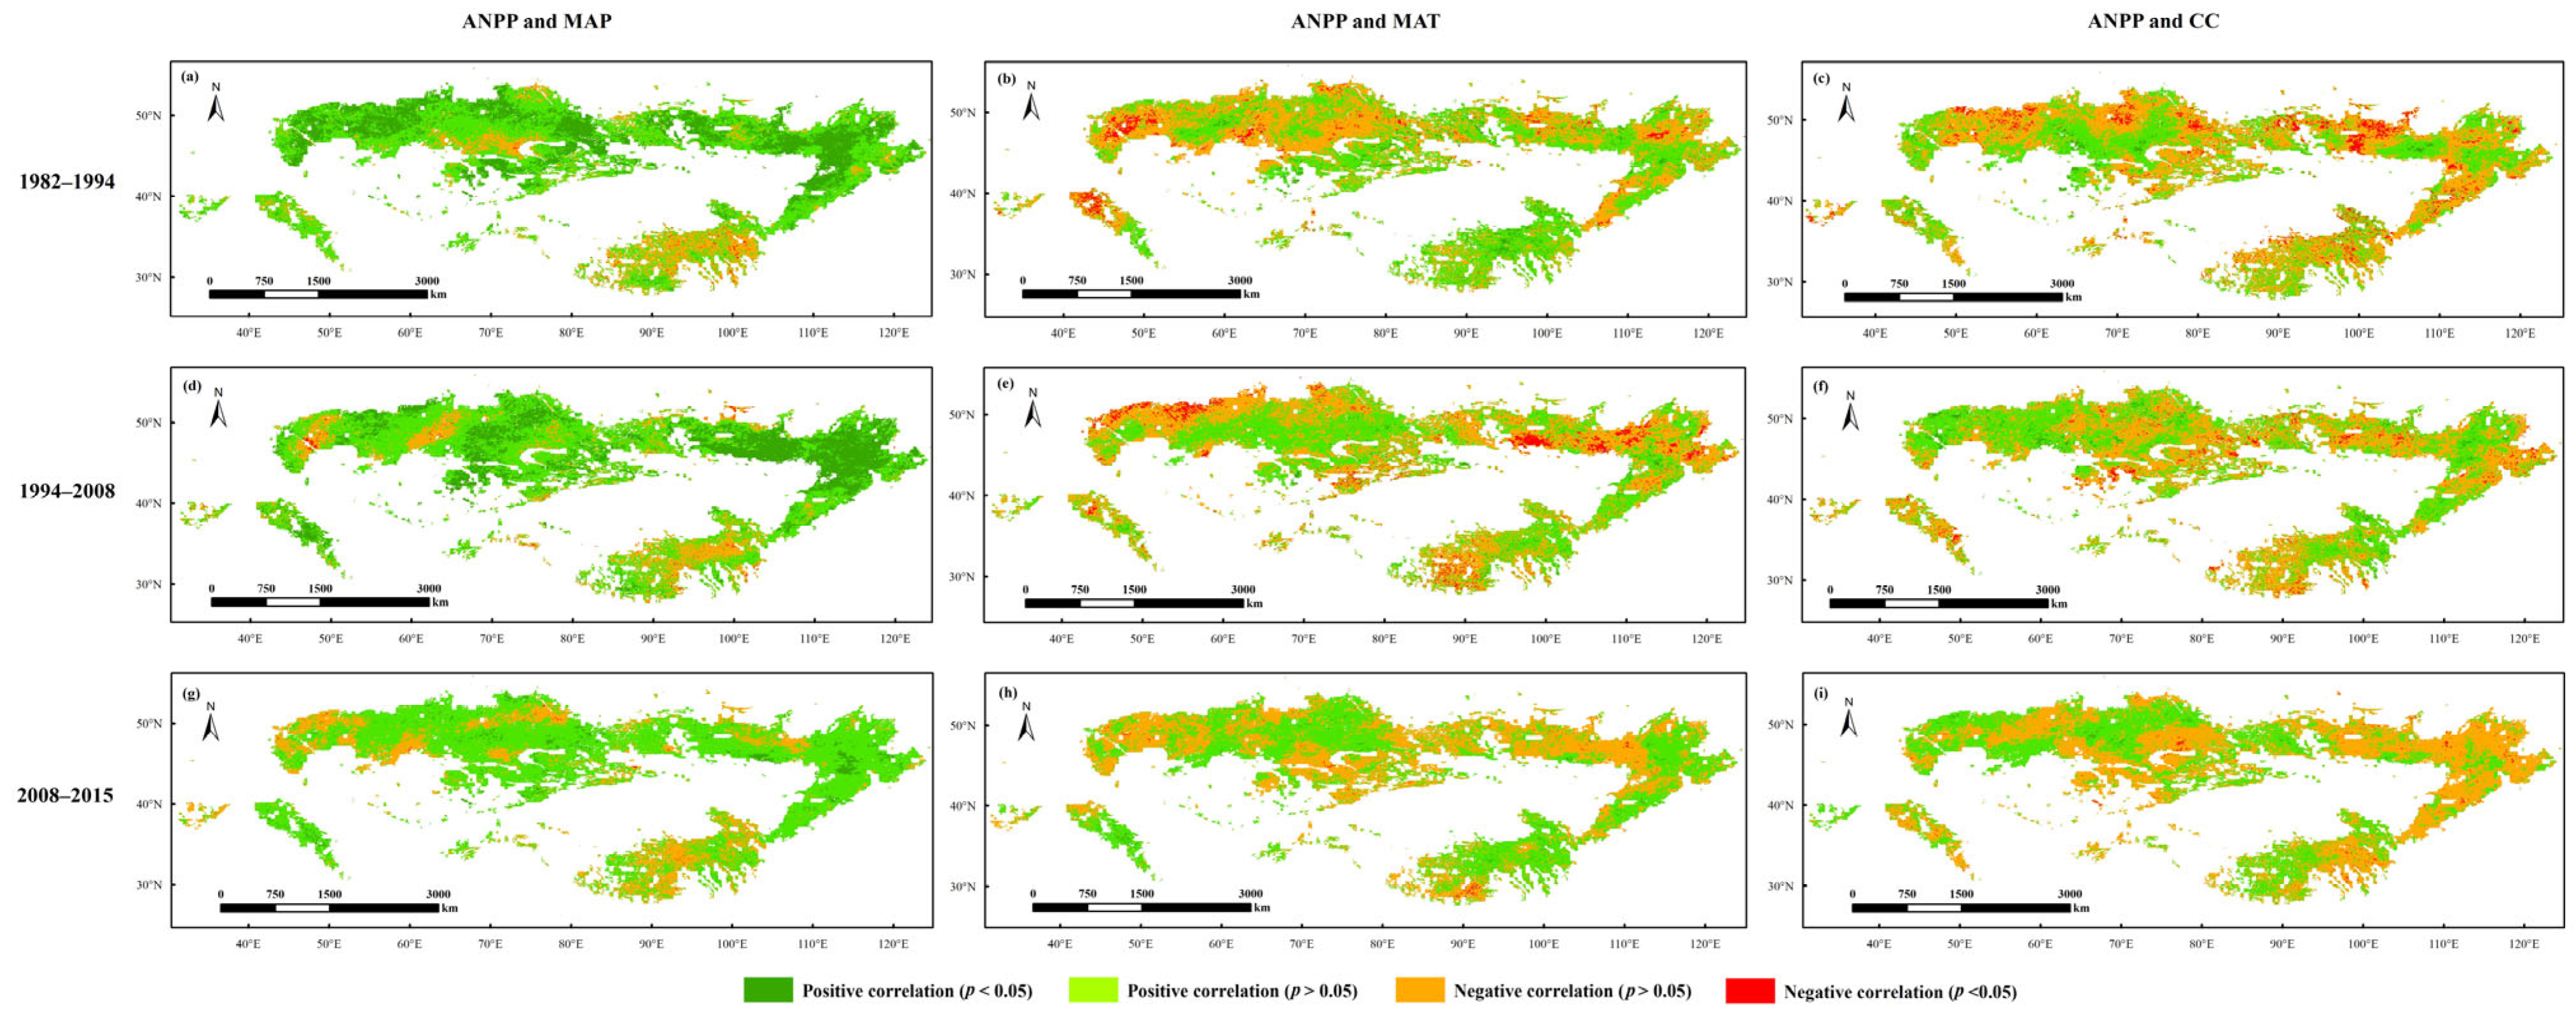
Figure 7 illustrates the partial correlations between ANPP and climatic factors across three distinct intervals: 1982–1994, 1994–2008, and 2008–2015. Throughout these three periods, the interannual variation in ANPP in the majority of the EASR exhibited a positive correlation with MAP. However, distinct variations were observed regarding the spatial extent and specific geographic distribution of these correlations (Figure 7a,d,g, Table 2). Although the proportion of the area showing a positive ANPP–MAP correlation remained comparable between the 1982–1994 (84.67%) and 1994–2008 (83.26%) periods (Table 2), shifts in spatial distribution were evident. Specifically, compared to the 1982–1994 period (Figure 7a), the extent of positively correlated regions increased in the southwestern and southeastern margins of the Tibetan Plateau grasslands during 1994–2008 (Figure 7d). Conversely, a contraction was observed in the Caspian Depression and the Central Kazakh Uplands (Figure 7d). Consequently, the total area exhibiting a positive correlation declined during the 2008–2015 period relative to the preceding two intervals, with this reduction primarily concentrated in the western regions of the Tibetan Plateau grasslands (Figure 7g).
Figure 7.
Spatial distribution of partial correlations between ANPP and climatic factors in the EASR during different periods: (a–c) 1982–1994; (d–f) 1994–2008; and (g–i) 2008–2015.
Table 2.
Areas (in percentage) showing positive and negative correlations between ANPP and the corresponding climatic factors in the EASR during different periods. Numbers in parentheses represent the areas with significant correlations.
Within the EASR, the area exhibiting a negative correlation between interannual variation in ANPP and MAT was largest during the 1994–2008 period (54.17%), surpassing both the 1982–1994 (49.40%) and 2008–2015 (47.44%) periods (Table 2); this pattern was predominantly observed in the western regions of the Tibetan Plateau grasslands (Figure 7b,e,h). Regarding the relationship with CC, the area showing a positive correlation with ANPP was larger during 1994–2008 (48.71%) compared to 1982–1994 (40.84%); specifically, this expansion was primarily distributed along the southeastern edge of the Tibetan Plateau (Figure 7c,f). However, the area showing a positive ANPP–CC correlation subsequently declined in the 2008–2015 period (42.23%), when compared with 1994–2008 (Table 2); these reductions were mainly situated in the Mongolian Plateau grasslands and the southeastern edge of the Tibetan Plateau grasslands (Figure 7f,i).
4. Discussion
4.1. Nonlinear Trajectories of ANPP and Underlying Hydrothermal Driving Mechanisms
Although the ANPP in the EASR has exhibited an overall increasing trend over the past three decades, this study reveals that its evolutionary trajectory is not monotonically linear. Instead, it generally presents a nonlinear “Increasing to Decreasing to Increasing” phased characteristic, distinguished by turning points in 1994 and 2008 (Figure 2). This trend reversal aligns with the recent global understanding of a shift in terrestrial vegetation activity from “greening” to “browning,” and underscores the idea that characterizing long-term changes solely through a single linear trend may obscure the functional non-stationarity and threshold responses of ecosystems at interannual to decadal scales [36].
These phased fluctuations are primarily governed by the dynamic evolution of hydrothermal systems in response to climate warming. Specifically, from 1982 to 1994, the increase in ANPP was predominantly driven by water. During this period, MAP increased significantly (at 2.54 mm yr−1) while CC decreased (indicating improved radiation conditions), thereby corroborating the water-limited mechanism typical of arid and semi-arid regions [11]. In contrast, the significant decline in ANPP observed from 1994 to 2008, particularly across the Mongolian Plateau and its surrounding areas, is attributed to warming–drying pressure. Although MAP and CC remained relatively stable during this interval, MAT rose sharply at a rate of 0.06 °Cyr−1. This rapid warming elevated atmospheric water demand, exacerbated soil moisture deficits, and subsequently inhibited vegetation growth [37,38]. The resurgence of ANPP after 2008 closely tracked the recovery of precipitation, further establishing water availability as the critical limiting factor driving the long-term evolution of ANPP at the regional scale in the EASR.
4.2. Non-Stationarity and State-Dependent Characteristics of ANPP Climate Sensitivity
Partial correlation analysis based on a 15-year sliding window revealed that the relationships between ANPP and various climatic factors exhibit significant dynamic variability. Specifically, ANPP consistently maintained a positive correlation with MAP; however, the strength of this correlation displayed a “strong–weak–strong” temporal fluctuation pattern. In contrast, the relationship between ANPP and MAT shifted from an initial weak positive correlation to a weak negative correlation in the middle and later periods, then trended toward zero. Meanwhile, the relationship between ANPP and CC exhibited a phasic shift characterized by a “negative–positive–negative” pattern. Collectively, these results reveal distinct temporal non-stationarity in ANPP’s response to climate. These observations question the validity of a constant “climate–productivity” relationship, as often assumed in traditional ecological models [39].
During the initial phase of the study, the EASR experienced a relatively humid period, during which water stress was partially alleviated. Therefore, elevated temperatures were conducive to vegetation growth. However, as temperatures continued to rise in a progressively drier environment, water re-emerged as the primary limiting factor; hence, the role of temperature shifted from promoting growth to inhibiting it. This phenomenon is consistent with the findings of Zhang et al. [11] regarding the Eurasian steppe, who indicated that precipitation use efficiency exhibits significant interannual fluctuations regulated by the climatic background. Specifically, the sensitivity of productivity to precipitation intensifies as water stress increases. The transition of the ANPP–MAT relationship from positive to negative suggests that, under global warming, the EASR ecosystem may have crossed a critical threshold. Consequently, rising temperatures no longer promote growth but instead act as a stress factor, intensifying evapotranspiration. This aligns with Piao et al. [35], who observed a weakening (or even reversal) in the sensitivity of vegetation growth to temperature across the Northern Hemisphere. Furthermore, this study supports the “state-dependent” nature of dryland ecosystem responses, as emphasized by Sasaki et al. [3]: as the climate shifts toward a hotter, drier state, the dependence of ANPP on water availability increases, while its tolerance to high temperatures declines.
This state-dependence may reflect ecological mechanisms such as shifts in dominant plant functional types and community structure under persistent climate stress, which can alter water-use strategies and rooting patterns, thus changing the apparent sensitivity of ANPP to precipitation and temperature over time [3,40]. Moreover, feedback between productivity, vegetation structure, and local resource availability (e.g., soil moisture) may reinforce nonlinear transitions and contribute to the emergence of alternative states in dryland grasslands [4,7]. Disturbance-mediated compositional changes (e.g., grazing-related shifts toward less palatable or shorter-statured species) may further interact with climatic anomalies to modify resistance and resilience, consistent with evidence that grassland responses to precipitation extremes depend on the background aridity [2]. Therefore, the temporal dynamics of the climate–productivity relationship imply that predicting future grassland productivity based solely on historical average climate states may yield significant errors.
4.3. Spatiotemporal Heterogeneity of ANPP Dynamics and Climate Driving Mechanisms
The pronounced hydrothermal and topographic gradients within the EASR provide a critical environmental context for elucidating the spatial heterogeneity of ANPP dynamics and their primary controlling factors. Over the study period from 1982 to 2015, the ANPP trends exhibited significant spatial differentiation, characterized by a mosaic pattern of interlaced regions alternating between increases and decreases. Further analysis revealed that the spatial evolutionary patterns of ANPP varied distinctly across three independent temporal intervals (1982–1994, 1994–2008, and 2008–2015). These spatiotemporal dynamics closely align with the cascading effects arising from variations in the “regional climate background–limiting factors–ecological sensitivity” nexus. Meanwhile, spatially variable anthropogenic influences (e.g., grazing pressure and land-use change) can also introduce heterogeneity and help to explain localized departures from climate-driven patterns in parts of the EASR [32,37].
Regarding the contributions of climate factors to interannual variations in ANPP, although MAP was found to play a dominant role across most of the EASR (approximately 68%), the underlying climatic drivers exhibited substantial spatial heterogeneity. Specifically, in typical water-limited regions—such as the Inner Mongolia Plateau, the Mongolian Plateau, and the Kazakh Uplands—ANPP showed a significant positive correlation with MAP. Hence, these findings provide robust support for the “Rainfall Use Efficiency (RUE)” hypothesis [40,41].
Although the QTP is traditionally regarded as a temperature-limited ecosystem [42,43], this study revealed a negative correlation between ANPP and temperature in parts of its southwestern and central-eastern regions. This suggests that, in the context of recent rapid warming, intensified evapotranspiration has exacerbated water deficits in semi-arid alpine steppes. Consequently, the primary ecosystem limiting factor has shifted from “thermal limitation” to “water limitation”—that is, the water-stress effect has superseded the thermal facilitation effect [44]. Furthermore, CC (serving as a proxy for solar radiation in this study) exhibited a positive correlation with ANPP in localized areas such as the southeastern margin of the QTP. This phenomenon may be attributed to the high evaporation potential induced by the intense radiation environment in this region. Specifically, moderate cloud shading not only alleviates water stress by reducing leaf temperature and transpiration rates but also often accompanies precipitation events, thereby synergistically promoting photosynthesis [45,46,47]. Therefore, this significant spatial heterogeneity underscores the need to consider site-specific climatic limiting factors and their potential interactions with land-use and grazing disturbances when formulating regional grassland management policies.
5. Conclusions
Drawing upon ANPP and climate data for the EASR from 1982 to 2015, this study employed a comprehensive methodological framework incorporating linear trend analysis, LOWESS, piecewise regression, and sliding window partial correlation analysis. Consequently, the following primary conclusions were obtained:
Although regional-scale ANPP in the EASR exhibited a significant increasing trend over the entire study period, this trajectory was not a continuous linear rise. Instead, it was characterized by distinct turning points in 1994 and 2008, manifesting as a phased “Increasing to Decreasing to Increasing” fluctuation. Specifically, ANPP generally increased from 1982 to 1994, shifted to a widespread decline from 1994 to 2008, and subsequently resumed growth from 2008 to 2015. Furthermore, the ANPP trends showed significant spatial heterogeneity across the entire study period and the individual sub-stages. The ANPP trends within the EASR were categorized into eight types, with four dominant patterns prevailing. Notably, the “Increasing–Decreasing–Increasing” pattern was the most widely distributed, suggesting that variations in grassland productivity are essentially processes of phased reorganization and recovery under shifting climatic backgrounds.
Throughout the study period, ANPP demonstrated a significant positive correlation with MAP—a relationship that was predominant at both the regional and pixel scale. Hence, moisture remains the primary controlling factor for ANPP. However, sliding window analysis revealed that the correlation between ANPP and MAP fluctuated over time, indicating evident non-stationarity. Although the overall responses of ANPP to MAT and CC were relatively weak, they showed significant strengthening or directional reversals during specific periods and in certain regions. This indicates that productivity is subject to the coupled regulation of multiple climatic factors, and that the dominant limiting factor may switch with the climatic phase. Ultimately, these insights provide a critical scientific basis for assessing grassland productivity and promoting adaptive management in the face of future climate uncertainty. Specifically, future ecosystem models should incorporate time-varying climate sensitivity parameters, rather than static coefficients, in order to better simulate nonlinear vegetation dynamics. Furthermore, grassland management policies must be flexible enough to accommodate potential trend reversals and shifting climatic constraints to ensure long-term ecosystem resilience.
Despite these findings, this study has certain limitations, including uncertainties in ANPP, the use of gridded climate datasets, and the omission of non-climatic influences (e.g., grazing intensity, land-use change, and CO2 fertilization). Therefore, future research should expand upon the present study to incorporate multi-source productivity products, finer-scale climate/management data, and process-based modeling to further test the robustness of the detected nonlinear dynamics and obtain improved projections under future climate scenarios.
Supplementary Materials
The following supporting information can be downloaded at https://www.mdpi.com/article/10.3390/d18020077/s1. Figure S1: Comparisons of monthly NDVI data between the NDVI 3g.v1 dataset and the NDVI 3g.v0 dataset in the MPGs during 1982–2013. (a) NDVIJan, (b) NDVIFeb, (c) NDVIMar, (d) NDVIApr, (e) NDVIMay, (f) NDVIJun, (g) NDVIJul, (h) NDVIAug, (i) NDVISep, (j) NDVIOct, (k) NDVINov and (l) NDVIDec represent NDVI values in January, February, March, April, May, June, July, August, September, October, November and December, respectively; Figure S2: Comparisons between ANPPs estimated using the recalibrated Integrated ANPPNDVI model based on the NDVI3g.v1 dataset and those estimated using the original Integrated ANPPNDVI model based on the NDVI3g.v0 dataset from 1982 to 2013. (a) The time series of ANPP estimated using the recalibrated Integrated ANPPNDVI model and the original Integrated ANPPNDVI model. (b) The linear relationships between ANPP estimated using the recalibrated Integrated ANPPNDVI model and the original Integrated ANPPNDVI model.
Author Contributions
Conceptualization, C.J., S.Z. and D.X.; methodology, X.Y. and Q.L. investigation, X.Y., S.Z. and D.X.; data curation, C.J., S.Z. and X.Y.; writing—original draft preparation, C.J. and X.Y.; writing—review and editing, C.J., S.Z. and D.X.; supervision, C.J.; project administration, C.J.; funding acquisition, C.J. All authors have read and agreed to the published version of the manuscript.
Funding
This research was funded by the National Natural Science Foundation of China, grant number 32201440, and was funded by the Sichuan Science and Technology Program, China, grant number 2025ZNSFSC1025. The APC was funded by 2025ZNSFSC1025.
Institutional Review Board Statement
Not applicable.
Data Availability Statement
The new data generated in this study are included in the Supplementary Materials. Other publicly archived datasets used in this study are available using the following links: http://www.earthdata.nasa.gov/data/catalog/ornl-cloud-global-veg-greenness-gimms-3g-2187-1 (accessed on 15 January 2026); and https://crudata.uea.ac.uk/cru/data/hrg/cru_ts_4.01/cruts.1709081022.v4.01/ (accessed on 15 January 2026).
Conflicts of Interest
The authors declare no conflicts of interest.
Abbreviations
The following abbreviations are used in this manuscript:
| EASR | the Eurasian steppe region |
| LOWESS | locally weighted scatterplot smoothing |
| PLS | piecewise linear regression |
| ANPP | aboveground net primary productivity |
| MAP | mean annual precipitation |
| MAT | mean annual temperature |
| CC | cloud cover |
References
- IPCC (The Intergovernmental Panel on Climate Change). Climate Change 2021: The Physical Science Basis; IPCC Sixth Assessment Report; IPCC: Geneva, Switzerland, 2021. [Google Scholar]
- Ning, S.; Yan, T.; Luo, W.; Tao, S.; Zou, X.; Li, Y.; Shangguan, Z.; Wu, Y.; Zhang, Z.; He, J.-S. Aridity-dependent resistance but strong resilience of grassland ANPP to naturally occurring precipitation extremes. J. Plant Ecol. 2024, 17, rtae084. [Google Scholar] [CrossRef] [Scilit]
- Sasaki, T.; Collins, S.L.; Rudgers, J.A.; Batdelger, G.; Baasandai, E.; Kinugasa, T. Dryland sensitivity to climate change and variability using nonlinear dynamics. Proc. Natl. Acad. Sci. USA 2023, 120, e2305050120. [Google Scholar] [CrossRef] [Scilit] [PubMed]
- Dakos, V.; Boulton, C.A.; Buxton, J.E.; Abrams, J.F.; Arellano-Nava, B.; Armstrong McKay, D.I.; Bathiany, S.; Blaschke, L.; Boers, N.; Dylewsky, D.; et al. Tipping point detection and early warnings in climate, ecological, and human systems. Earth Syst. Dyn. 2024, 15, 1117–1135. [Google Scholar] [CrossRef] [Scilit]
- Wei, X.; He, W.; Zhou, Y.; Cheng, N.; Xiao, J.; Bi, W.; Liu, Y.; Sun, S.; Ju, W. Increased sensitivity of global vegetation productivity to drought over the recent three decades. J. Geophys. Res. Atmos. 2023, 128, e2022JD037504. [Google Scholar] [CrossRef] [Scilit]
- Zeng, N.; Ren, X.; He, H.; Zhang, L.; Niu, Z. Precipitation conditions constrain the sensitivity of aboveground net primary productivity in tibetan plateau grasslands to climate change. Remote Sens. 2023, 15, 2591. [Google Scholar] [CrossRef] [Scilit]
- Zhong, Z.; He, B.; Wang, Y.-P.; Chen, H.W.; Chen, D.; Fu, Y.H.; Chen, Y.; Guo, L.; Deng, Y.; Huang, L.; et al. Disentangling the effects of vapor pressure deficit on northern terrestrial vegetation productivity. Sci. Adv. 2023, 9, eadf3166. [Google Scholar] [CrossRef] [Scilit]
- Fu, Z.; Ciais, P.; Prentice, I.C.; Gentine, P.; Makowski, D.; Bastos, A.; Luo, X.; Green, J.K.; Stoy, P.C.; Yang, H.; et al. Atmospheric dryness reduces photosynthesis along a large range of soil water deficits. Nat. Commun. 2022, 13, 989. [Google Scholar] [CrossRef] [Scilit]
- He, P.; Han, Z.; He, M.; Meng, X.; Ma, X.; Liu, H.; Dong, T.; Shi, M.; Sun, Z. Atmospheric dryness thresholds of grassland productivity decline in China. J. Environ. Manag. 2023, 338, 117780. [Google Scholar] [CrossRef] [Scilit]
- Lin, S.; Chen, X.; Xia, J.; Xin, Q.; Fu, Z.; He, B.; Liu, Q.; Piao, S.; Yuan, W. Global vegetation production may decrease in this century due to rising atmospheric dryness. Nat. Ecol. Evol. 2025, 9, 2279–2289. [Google Scholar] [CrossRef] [Scilit]
- Zhang, T.Y.; Chen, Z.; Zhang, W.K.; Jiao, C.C.; Yang, M.; Wang, Q.F.; Han, L.; Fu, Z.; Sun, Z.Y.; Li, W.H.; et al. Long-term trend and interannual variability of precipitation-use efficiency in Eurasian grasslands. Ecol. Indic. 2021, 130, 108091. [Google Scholar] [CrossRef] [Scilit]
- Liu, C.; Li, J.; Liu, Q.; Gao, J.; Mumtaz, F.; Dong, Y.; Wang, C.; Gu, C.; Zhao, J. Combined influence of ENSO and North Atlantic Oscillation (NAO) on Eurasian Steppe during 1982–2018. Sci. Total Environ. 2023, 892, 164735. [Google Scholar] [CrossRef] [Scilit] [PubMed]
- Yu, Q.; Xu, C.; Wu, H.; Ke, Y.; Zuo, X.; Luo, W.; Ren, H.; Gu, Q.; Wang, H.; Ma, W.; et al. Contrasting drought sensitivity of Eurasian and North American grasslands. Nature 2025, 639, 114–118. [Google Scholar] [CrossRef] [Scilit] [PubMed]
- Yan, Y.; Xu, C.; Hautier, Y.; Wang, H.; Ke, Y.; Wu, H.; Wang, J.; Cheng, C.; Zuo, X.; Luo, W.; et al. Extreme drought decreases the stability of above- but not below-ground productivity across Eurasian steppes. Glob. Change Biol. 2025, 31, e70303. [Google Scholar] [CrossRef] [Scilit] [PubMed]
- Zhang, T.; Liu, Y.; Zimini, Y.; Yuan, L.; Wen, Z. Effects of soil moisture and atmospheric vapor pressure deficit on the temporal variability of productivity in Eurasian Grasslands. Remote Sens. 2024, 16, 2368. [Google Scholar] [CrossRef] [Scilit]
- Zhou, X.M. A summary of alpine grasslands in the Tibetan Plateau and their correlation to the Eurasian steppe. Acta Agrestia Sin. 1980, 4, 1–6. (In Chinese) [Google Scholar]
- Li, B. General characters of vegetation in grasslands in China. Chin. J. Grassl. 1979, 1, 2–12+26. (In Chinese) [Google Scholar]
- Hou, X.Y. Thinking and practice on the protection and development of the Eurasian steppe based on the northern China’s grasslands. Chin. J. Grassl. 2014, 36, 1–2. (In Chinese) [Google Scholar]
- Henwood, W.D. Toward a strategy for the conservation and protection of the world’s temperate grasslands. Great Plains Res. 2009, 20, 121–134. [Google Scholar]
- Wu, Z. Chinese Vegetation; Science Press: Beijing, China, 1980. (In Chinese) [Google Scholar]
- Woodward, S.L. The Temperate Grassland Biome. In Grassland Biomes; Woodward, S.L., Ed.; Greenwood Press: Westport, CT, USA, 2008. [Google Scholar]
- Olson, D.M.; Dinerstein, E.; Wikramanayake, E.D.; Burgess, N.D.; Powell, G.V.N.; Underwood, E.C.; D’Amico, J.A.; Itoua, I.; Strand, H.E.; Morrison, J.C. Terrestrial ecoregions of the world: A new map of life on earth. BioScience 2001, 51, 933–938. [Google Scholar] [CrossRef] [Scilit]
- Malyshev, V.V.; Alekseev, A.O. Iron Compounds in Steppe Soils of the East-European Plain: Association with Soil Processes, Paleoclimatic Aspects. Eurasian Soil Sci. 2024, 57, 1461–1473. [Google Scholar] [CrossRef] [Scilit]
- Smirnova, M.A.; Lozbenev, N.I.; Levchenko, E.A.; Fil, P.P.; Kozlov, D.N. Chernozems of Eastern European forest-steppe lowland landscapes: Morphology, classification and spatial distribution. Geoderma Reg. 2025, 41, e00965. [Google Scholar] [CrossRef] [Scilit]
- Jiao, C.C.; Yu, G.R.; Ge, J.P.; Chen, X.; Zhang, C.; He, N.P.; Chen, Z.; Hu, Z.M. Analysis of spatial and temporal patterns of aboveground net primary productivity in the Eurasian steppe region from 1982 to 2013. Ecol. Evol. 2017, 7, 5149–5162. [Google Scholar] [CrossRef] [Scilit] [PubMed]
- Zhu, Z.; Bi, J.; Pan, Y.; Ganguly, S.; Anav, A.; Xu, L.; Samanta, A.; Piao, S.; Nemani, R.; Myneni, R. Global Data Sets of Vegetation Leaf Area Index (LAI)3g and Fraction of Photosynthetically Active Radiation (FPAR)3g Derived from Global Inventory Modeling and Mapping Studies (GIMMS) Normalized Difference Vegetation Index (NDVI3g) for the Period 1981 to 2011. Remote Sens. 2013, 5, 927–948. [Google Scholar]
- Tucker, C.J.; Pinzon, J.E.; Brown, M.E.; Slayback, D.A.; Pak, E.W.; Mahoney, R.; Vermote, E.F.; EI Saleous, N. An extended AVHRR 8-km NDVI dataset compatible with MODIS and SPOT vegetation NDVI data. Int. J. Remote Sens. 2005, 26, 4485–4498. [Google Scholar] [CrossRef] [Scilit]
- Harris, I.; Jones, P.D.; Osborn, T.J.; Lister, D.H. Updated high-resolution grids of monthly climatic observations—The CRU TS3.10 Dataset. Int. J. Climatol. 2014, 34, 623–642. [Google Scholar] [CrossRef] [Scilit]
- Hou, W.; Gao, J.; Wu, S.; Dai, E. Interannual variations in growing-season ndvi and its correlation with climate variables in the southwestern karst region of china. Remote Sens. 2015, 7, 11105–11124. [Google Scholar] [CrossRef] [Scilit]
- Basarin, B.; Lukic, T.; Pavic, D.; Wilby, R.L. Trends and multi-annual variability of water temperatures in the river Danube, Serbia. Hydrol. Process. 2016, 30, 3315–3329. [Google Scholar] [CrossRef] [Scilit]
- Brook, K.; Camargo, C.A.; Christopher, K.B.; Quraishi, S.A. Admission vitamin D status is associated with discharge destination in critically ill surgical patients. Ann. Intensive Care 2015, 5, 23. [Google Scholar] [CrossRef] [Scilit]
- Jiang, L.L.; Jiapaer, G.; Bao, A.M.; Guo, H.; Ndayisaba, F. Vegetation dynamics and responses to climate change and human activities in Central Asia. Sci. Total Environ. 2017, 599, 967–980. [Google Scholar] [CrossRef] [Scilit]
- Chen, A.; He, B.; Wang, H.; Huang, L.; Zhu, Y.; Lv, A. Notable shifting in the responses of vegetation activity to climate change in China. Phys. Chem. Earth Parts A/B/C 2015, 87–88, 60–66. [Google Scholar] [CrossRef] [Scilit]
- Cong, N.; Shen, M.; Yang, W.; Yang, Z.; Zhang, G.; Piao, S. Varying responses of vegetation activity to climate changes on the Tibetan Plateau grassland. Int. J. Biometeorol. 2017, 61, 1433–1444. [Google Scholar] [CrossRef] [Scilit] [PubMed]
- Piao, S.; Nan, H.; Huntingford, C.; Ciais, P.; Friedlingstein, P.; Sitch, S.; Peng, S.; Ahlstrom, A.; Canadell, J.G.; Cong, N.; et al. Evidence for a weakening relationship between interannual temperature variability and northern vegetation activity. Nat. Commun. 2014, 5, 5018. [Google Scholar] [CrossRef] [Scilit] [PubMed]
- Higgins, S.I.; Conradi, T.; Muhoko, E. Shifts in vegetation activity of terrestrial ecosystems attributable to climate trends. Nat. Geosci. 2023, 16, 147–153, Erratum in Nat. Geosci. 2023, 16, 546. [Google Scholar] [CrossRef] [Scilit]
- Guo, E.; Wang, Y.; Wang, C.; Sun, Z.; Bao, Y.; Mandula, N.; Jirigala, B.; Bao, Y.; Li, H. NDVI indicates long-term dynamics of vegetation and its driving forces from climatic and anthropogenic factors in mongolian plateau. Remote Sens. 2021, 13, 688. [Google Scholar] [CrossRef] [Scilit]
- He, B.; Tuya, W.; Qinchaoketu, S.; Nanzad, L.; Yong, M.; Kesi, T.; Sun, C.Q. Climate change characteristics of typical grassland in the mongolian plateau from 1978 to 2020. Sustainability 2022, 14, 16529. [Google Scholar] [CrossRef] [Scilit]
- Goetz, S.J.; Prince, S.D.; Goward, S.N.; Thawley, M.M.; Small, J. Satellite remote sensing of primary production: An improved production efficiency modeling approach. Ecol. Model. 1999, 122, 239–255. [Google Scholar] [CrossRef] [Scilit]
- Zhang, T.; Chen, Z.; Jiao, C.; Zhang, W.; Han, L.; Fu, Z.; Sun, Z.; Liu, Z.; Wen, Z.; Yu, G. Using the dynamics of productivity and precipitation-use efficiency to detect state transitions in Eurasian grasslands. Front. Ecol. Evol. 2023, 11, 1189059. [Google Scholar] [CrossRef] [Scilit]
- Hu, Y.; Yang, Y.; Wei, Y.; Li, X.; Jiao, Y.; Liao, J.; Fu, R.; Dai, L.; Hu, Z. Contrasting spatial variations between above and below-ground net primary productivity in global grasslands. Ecol. Indic. 2025, 170, 113083. [Google Scholar] [CrossRef] [Scilit]
- Xie, J.; Yin, G.; Ma, D.; Chen, R.; Zhao, W.; Xie, Q.; Wang, C.; Lin, S.; Yuan, W. Climatic limitations on grassland photosynthesis over the Tibetan Plateau shifted from temperature to water. Sci. Total Environ. 2024, 906, 167663. [Google Scholar] [CrossRef] [Scilit]
- Xu, C.; Liu, D.; Wang, X.; Wang, T. Shifting from a thermal-constrained to water-constrained ecosystem over the Tibetan Plateau. Front. Plant Sci. 2023, 14, 1125288. [Google Scholar] [CrossRef] [Scilit]
- Zuo, C.; Wang, J.B.; Zhang, X.J.; Ye, H.; Wang, S.Q.; Watson, A.E.; Li, Y.N.; Zhao, X.Q. Drought will constrain ongoing increase in net ecosystem productivity under future climate warming over alpine grasslands on the Qinghai-Tibetan Plateau, China. Ecol. Indic. 2023, 154, 110823. [Google Scholar] [CrossRef] [Scilit]
- Hughes, N.M.; Sanchez, A.; Berry, Z.C.; Smith, W.K. Clouds and plant ecophysiology: Missing links for understanding climate change impacts. Front. For. Glob. Change 2024, 7, 1330561. [Google Scholar] [CrossRef] [Scilit]
- van Diepen, K.H.H.; Kaiser, E.; Hartogensis, O.K.; Graf, A.; de Arellano, J.V.-G.; Moene, A.F. When do clouds and aerosols lead to higher canopy photosynthesis? Agric. For. Meteorol. 2025, 370, 110597. [Google Scholar] [CrossRef] [Scilit]
- Wu, Y.; Gao, J.; Zhao, A. Cloud properties and dynamics over the Tibetan Plateau—A review. Earth-Sci. Rev. 2024, 248, 104633. [Google Scholar] [CrossRef] [Scilit]

Disclaimer/Publisher’s Note: The statements, opinions and data contained in all publications are solely those of the individual author(s) and contributor(s) and not of MDPI and/or the editor(s). MDPI and/or the editor(s) disclaim responsibility for any injury to people or property resulting from any ideas, methods, instructions or products referred to in the content. |
© 2026 by the authors. Licensee MDPI, Basel, Switzerland. This article is an open access article distributed under the terms and conditions of the Creative Commons Attribution (CC BY) license.