Article

Environmental DNA Metabarcoding of a Seagrass Meadow in Vostok Bay (Peter the Great Bay, Sea of Japan): A COI Snapshot of Coastal Biodiversity and Its Limitations

by
Sergei V. Turanov
A.V. Zhirmunsky National Scientific Center of Marine Biology, Far Eastern Branch, Russian Academy of Sciences, 690041 Vladivostok, Russia
Diversity 2026, 18(2), 120; https://doi.org/10.3390/d18020120
Submission received: 30 January 2026 / Revised: 12 February 2026 / Accepted: 12 February 2026 / Published: 13 February 2026

Abstract

Temperate seagrass meadows are foundation habitats, but their communities are hard to census. Here, I provide a first COI environmental DNA (eDNA) metabarcoding snapshot from seawater at a Zostera marina meadow in the Vostok Bay marine reserve (Peter the Great Bay, Sea of Japan). In September 2021, eDNA from two 900 mL replicates of water were filtered, isolated, amplified for the 313 bp COI fragment with dual-index PCR (multiple replicates), and sequenced on Illumina NovaSeq. I obtained 53,666 reads for 176 operational taxonomic units (OTUs). Eukaryota dominated (154 OTUs; 93.7% of reads), while 22 bacterial OTUs comprised 6.3%. The assemblage was largely photosynthetic microeukaryotes, especially diatoms (61 OTUs; 49% of reads), consistent with late-summer productivity. Metazoan detections included a strong signal of the phoronid Phoronopsis harmeri (7511 reads; 14%), diverse invertebrates, and few vertebrate reads (0.5%), indicating limited fish sensitivity of universal COI assays. One abundant OTU was initially assigned to the giant kelp Macrocystis pyrifera but was rejected after additional BLAST and phylogenetic checks, illustrating database-driven misassignments. COI eDNA offers rapid, low-impact screening for marine protected area monitoring, but robust use requires seasonal replication, multi-marker assays, and a curated regional reference library.

1. Introduction

Temperate coastal ecosystems of the Northwest Pacific form a fine-scale mosaic of habitats (rocky reefs, soft sediments, kelp forests, and seagrass meadows) that collectively sustain high biodiversity and fisheries productivity. Among these habitats, seagrass beds are widely recognized as foundation ecosystems that provide nursery, refuge, and foraging grounds, while also supporting strong connectivity with adjacent coastal habitats [1,2]. At the same time, seagrass meadows are highly vulnerable to coastal development, eutrophication, dredging, recreational pressure, and climate-driven change, and global analyses have documented persistent decline in many regions [2]. These realities make regular biodiversity monitoring a core requirement for evidence-based conservation and management in temperate coastal zones.
In recent years, environmental DNA (eDNA) metabarcoding has emerged as a powerful, non-invasive approach for assessing aquatic biodiversity [3]. eDNA refers to genetic material (such as shed cells, mucus, or gametes) that organisms leave behind in their environment. By filtering water samples and sequencing taxonomically informative genetic markers, eDNA surveys can detect a wide spectrum of organisms without direct observation or capture. This approach has proven capable of revealing species that conventional surveys miss—including rare, cryptic, or elusive taxa—with minimal disturbance [4]. For example, an eDNA survey in a California marine reserve detected 76% of the fish species observed by divers and revealed 23 additional fish species known from the area that the divers did not record during the survey [5]. Likewise, in a coral reef study, eDNA detected 44% more shark species than traditional visual counts, despite requiring two orders of magnitude less sampling effort [6]. Compared to diver-based methods, eDNA metabarcoding is generally faster, more cost-effective, and able to simultaneously capture multiple taxonomic groups from microbes to megafauna in a single water sample [5,6]. However, overall turnaround time and cost may increase due to bioinformatics and taxonomic validation, and detection success is strongly primer -dependent. Despite well-known limitations of the approach [7], practical guidance for integrating eDNA into marine monitoring programs has matured, with emphasis on sampling design, controls, and careful interpretation of detections [8].
In the northwestern Sea of Japan, coastal biodiversity patterns are shaped by strong oceanographic gradients. Regional circulation involves the warm Tsushima Current system and colder western boundary currents (often discussed in connection with the Liman and Primorye system), with frontal zones and seasonal variability contributing to mixing and species turnover along the Russian Far East margin [9]. At the scale of Peter the Great Bay, this large-scale background is further modulated by wind-driven circulation, episodic storms, and freshwater inputs, which can affect nearshore retention, exchange with adjacent waters, and thus the spatial footprint of eDNA signals in semi-enclosed bays. Within this setting, Vostok Bay is a relatively small embayment in the northeastern part of Peter the Great Bay, Sea of Japan (Figure 1). Despite its modest size, the bay harbors remarkably rich biodiversity. Published inventories report at least 128 fish species for Vostok Bay [10]. The macrobenthic community is especially diverse. An early comprehensive catalog documented 587 benthic taxa [11]. Subsequent taxon-focused studies have refined and expanded the knowledge for particular groups, including 69 species of decapod crustaceans [12] and 277 species of mollusks (including 7 Polyplacophora, 7 Cephalopoda, 112 Bivalvia, and 151 Gastropoda) [13]. The bay also supports a rich flora of marine macrophytes—up to 170 species of seaweeds and seagrasses have been reported [14,15].
More broadly, Peter the Great Bay is highlighted as an exceptionally species-rich temperate coastal area in the region. In a synthesis of regional biodiversity and monitoring strategy, Peter the Great Bay is described as the most species-rich and taxonomically diverse coastal area in the Russian sector of the Sea of Japan, with nearly 4000 recorded marine species spanning 52 phyla and more 105 classes (including about 2600 marine invertebrate species). It was also identified as a priority locality for standardized long-term coastal biodiversity monitoring within international Western Pacific initiatives (e.g., DIWPA or NaGISA framework), with underwater transects implemented in the Far Eastern Marine Biosphere Reserve and the Vostok Bay protected area [16].
Overall, Vostok Bay’s biota represents nearly all major animal phyla known from Peter the Great Bay [17], with the expected underrepresentation of taxa dominated by minute interstitial or parasitic forms and certain rare and difficult-to-survey macrobenthic groups. Given the bay’s size and geographic setting, no local endemism has been reported to date to my knowledge, yet the concentration of recorded taxa underscores Vostok Bay’s status as a regional biodiversity hotspot. To protect these natural assets, the “Zaliv Vostok” Marine Reserve was established within Vostok Bay in 1989 [18]. It remains one of only two marine protected areas in the Peter the Great Bay region (the other being the Far Eastern Marine Biosphere Reserve), providing formal protection for the bay’s key habitats and biota.
The inner part of Vostok Bay is characterized by extensive seagrass habitats. Contemporary macrophyte surveys identify Zostera marina as dominant on muddy–sandy substrates and Phyllospadix iwatensis as a key surfgrass on hard substrates, reflecting strong habitat partitioning within the Zosteraceae [14,15]. Seagrass meadows commonly function as ecosystem engineers that modify local hydrodynamics, stabilize sediments, and create three-dimensional structure that supports diverse associated communities, including juvenile fishes and mobile invertebrates [1,2]. This makes Zosteraceae meadows a particularly informative target for biodiversity assessment in a protected coastal bay.
From a methodological standpoint, seagrass beds also provide a clear ecological unit for testing water-column eDNA. Its signals can vary at surprisingly fine spatial scales across habitat boundaries, and studies around eelgrass beds have demonstrated meter-scale resolution of community patterns in seawater eDNA [19]. Recent temperate case studies further show that eDNA metabarcoding can characterize fish assemblages associated with Zostera beds and complement conventional sampling [20,21]. Thus, focusing on a Zosteraceae community allows habitat-standardized biodiversity profiling, sensitivity to taxa that are difficult to census visually or morphologically, and an ecologically meaningful baseline for subsequent monitoring in a marine protected area (MPA) context.
In this study, I applied eDNA metabarcoding of the mitochondrial COI “Leray” fragment [22] to a water sample collected from a Zosteraceae meadow in inner Vostok Bay. My aims were (1) to provide a first non-invasive molecular snapshot of the local coastal community detectable from water eDNA in this protected bay, and (2) to discuss strengths and limitations of COI-based eDNA for routine monitoring in temperate coastal habitats. Because sampling was restricted to a single site and a single date, the dataset is intended as an exploratory, hypothesis-generating baseline snapshot rather than a comprehensive characterization of seagrass-associated biodiversity in Vostok Bay. I selected the COI Leray fragment as a widely used, broadly amplifying marker that supports a cross-trophic exploratory scan and enables comparability with existing marine invertebrate-focused metabarcoding studies. I note, however, that group-targeted markers (12S for fishes, 18S for broad eukaryotes, and plastid loci such as rbcL for plants and macroalgae) can outperform COI for specific monitoring goals and are prioritized for future multi-marker surveys.

2. Materials and Methods

2.1. Study Area and Sample Collection

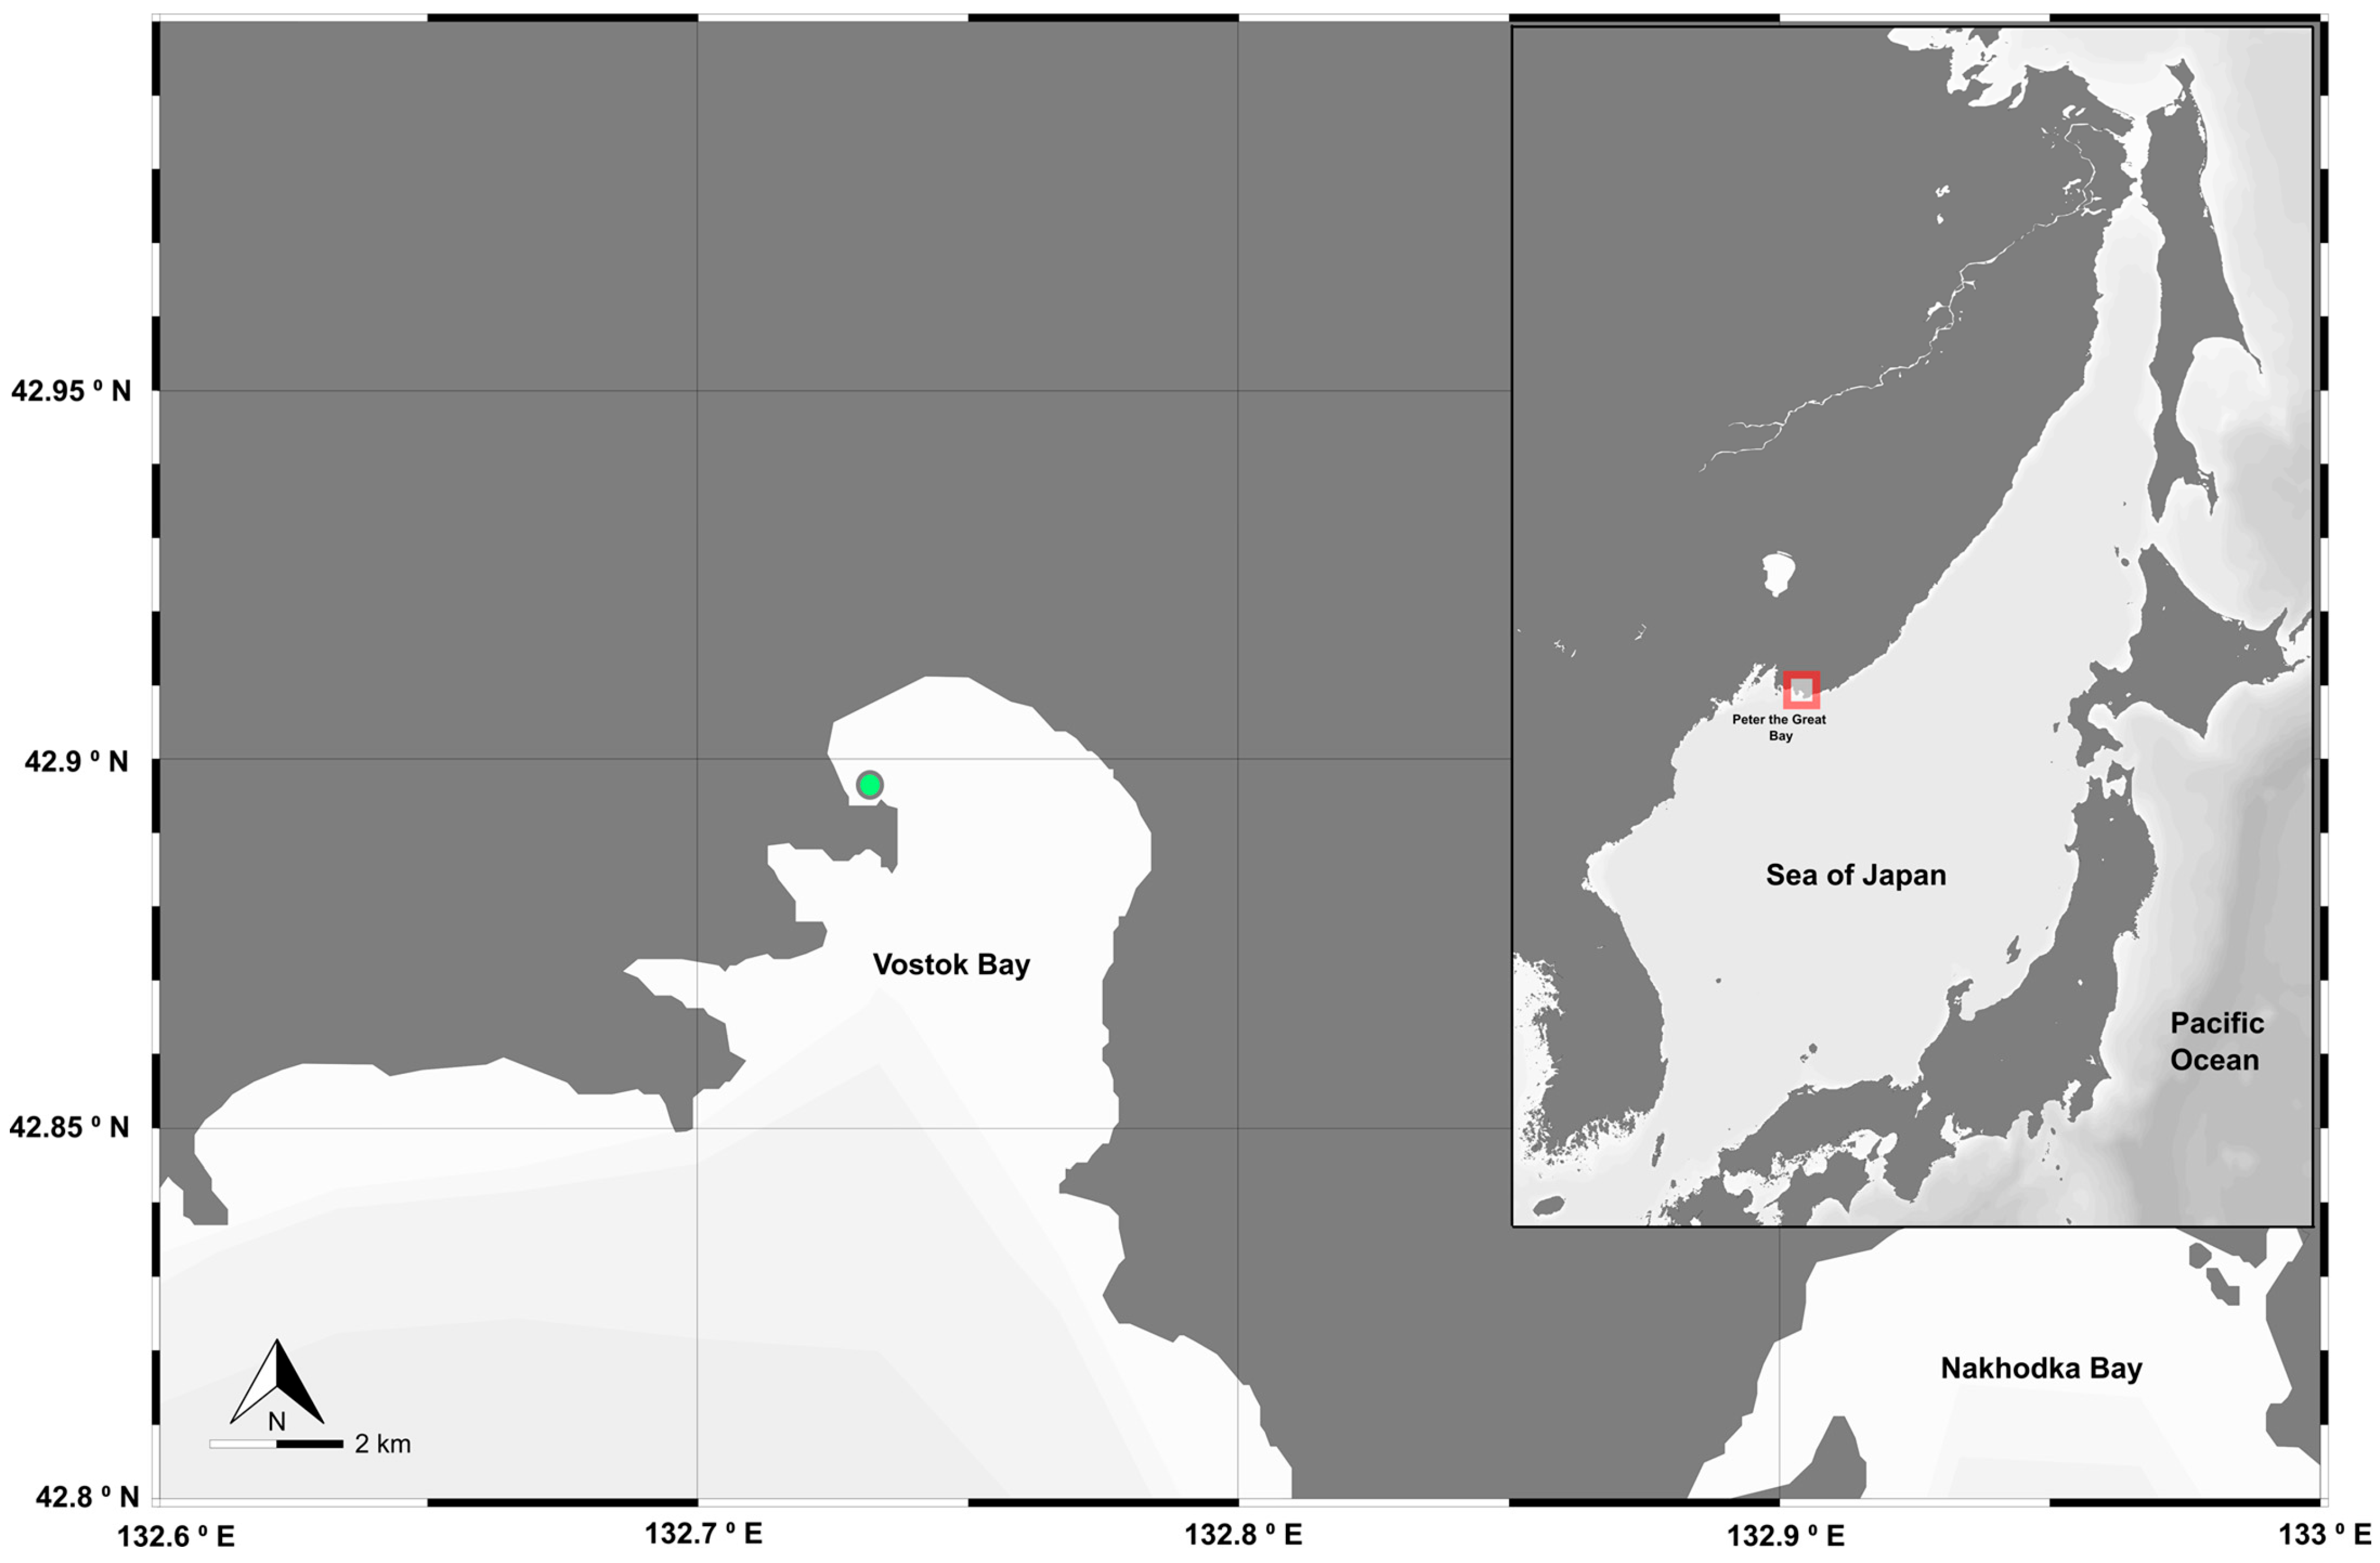
The eDNA sample was collected in September 2021 from the inner northeast corner of Vostok Bay (Figure 1), within a shallow seagrass meadow dominated by Zostera marina. Sampling in September was chosen based on the timing of an available field campaign and represents late-summer coastal conditions. This site lies in a sheltered cove with soft sediment and dense eelgrass growth. Water surface temperature was 20 °C. I collected two replicates of 900 mL seawater from below the surface (approximately 0.6 m depth) at the edge of the eelgrass bed. These two water draws were collected side-by-side at the same sampling micro-site and should be interpreted as handling replicates rather than spatial replicates across the meadow. Each 900 mL sample was drawn into a sterile 150 mL syringe (with repeated fills) and immediately filtered on-site through a 33 mm diameter syringe filter (PFS material, 0.45 μm pore size). After filtration, I preserved the eDNA on the filter by passing 1 mL of Longmire’s lysis buffer [23] through the syringe filter. The filter housing was then sealed with sterile combi-stopper plugs. Filter samples were transferred to −20 °C storage until DNA extraction. A field blank (150 mL of MQ water) was processed alongside the samples to monitor for any contamination during sampling and filtering.

2.2. DNA Extraction and Amplification

DNA was extracted from the syringe filters using an M-Sorb-OOM kit (Syntol, Russia) with modification of the manufacture’s protocol. At the initial stage, the lysis buffer was heated to 65 °C and passed through the filter tip in the opposite direction to the filtration (backflushing method, after [24]). The entire volume of the resulting liquid was drained into a clean test tube. The resulting DNA eluate (100 µL per sample) was stored at −20 °C. DNA extraction was also performed on the field blank filter to serve as a negative extraction control.
I targeted the 313-bp metabarcoding fragment of the mitochondrial COI gene [22,25,26]. To increase sample specificity and mitigate tag-jumping, I used a dual-index (doubly tagged) PCR strategy. Both the forward and reverse primers carried a unique 7-nucleotide index tag appended to the 5′ end, so that each library could be identified by a distinct tag combination. Tag sequences were generated in ecotag [27]. In total, six independent PCR replicates were performed for the eDNA sample using the same tagged primer pair, and three PCR replicates were performed for the pooled control library using its own tagged primer pair. A higher number of PCR replicates was used for the eDNA sample to mitigate stochastic amplification in a complex mixed-template extract and to improve recovery of low-template taxa. Controls were amplified in triplicate to confirm the absence of detectable contamination while limiting sequencing overhead for negative libraries. The PCR master mix contained 10 µL AmpliTaq Gold 360 Master Mix (Applied Biosystems, USA), 0.5 µL forward primer (10 µM), 0.5 µL reverse primer (10 µM), 0.16 µL bovine serum albumin (20 mg/mL), 2 µL template DNA (~10 ng), and nuclease-free water to a final volume of 20 µL. Thermal cycling consisted of an initial denaturation at 95 °C for 10 min, followed by 35 cycles of 94 °C for 60 s, 45 °C for 60 s, and 72 °C for 60 s, with a final extension at 72 °C for 5 min.
PCR negative controls were included in each run to check for reagent contamination. Amplification success was assessed by electrophoresis of 1 µL of each PCR product on a 1% agarose gel stained with ethidium bromide. A bright 313-bp band indicated successful amplification. No bands were observed in the negative controls or the extraction blank. PCR products from the eDNA sample and the pooled control library were purified to remove primers and dNTPs (Cleanup S-Cap columns, Evrogen, Russia) and pooled in equal volumes. The pooled amplicons were sequenced at Novogene (Tianjin, China). Libraries were prepared using the PCR-free NEBNext Ultra II DNA Library Prep Kit for Illumina (New England Biolabs, UK) and sequenced on an Illumina NovaSeq 6000 platform using 250-bp paired-end reads. Raw reads were deposited in the NCBI Sequence Read Archive under run accession SRR22284826. Note that the sequencing data deposited comprise multiple tagged libraries that were multiplexed based on these 7-nt index tags. In the present study, I used one uniquely tagged primer pair for the focal eDNA sample and a second uniquely tagged primer pair for the controls. The control library pooled the field blank and the PCR negative control under the same tag combination.

2.3. Bioinformatics and Taxonomic Analysis

All sequence data processing was carried out using Begum metabarcoding workflow [28] with modifications for my dataset. Initially, Illumina adapter sequences were trimmed from raw reads and overall read quality was assessed using FastQC v0.11.9. I applied error correction with SPAdes v3.13 [29] in read correction mode, which reduces sequencing errors prior to assembly. Forward and reverse paired reads were then merged into full-length amplicon sequences using PANDAseq [30] with a minimum overlap of 20 bp. Only read pairs that overlapped successfully and had no ambiguous bases were retained. The merged reads were next sorted by sample tags. I used Begum’s demultiplexing function [28,31] (see Supplementary File S1 for tags and samples information) to bin sequences by their 7 nt tag combination, thereby separating the eDNA sample reads from blank control reads and samples from other projects. Reads matching the blanks tag were extremely low in number (<0.1% of total).
I clustered the merged sequences into operational taxonomic units (OTUs) using SUMACLUST v1.0.00 [32] at a 98% similarity threshold (−t 0.98). I used OTU clustering rather than ASV denoising as a pragmatic choice. While ASVs can improve fine-scale sequence resolution and cross-study comparability, OTU clustering here reduces sensitivity to over-splitting closely related haplotypes in a short COI fragment and keeps the workflow consistent with the Begum-style filtering applied. The result was a set of high-confidence OTU representative sequences in BIOM format (Supplementary File S2).
I inferred the taxonomic origin of each OTU by querying its representative sequence against the NCBI nucleotide (nt) database using BLAST+ v2.12.0 [33] with an e-value cutoff of 1 × 10⁻⁵. For each OTU, the ten highest-scoring BLAST hits were retrieved and inspected. Taxonomy was assigned based on a consensus among the top hits, prioritizing reference sequences showing ≥97% sequence identity across an aligned region of at least 300 bp. In many cases, OTUs matched published barcode references at 98–100% identity, enabling species-level annotation. Other OTUs were resolved only to genus or higher ranks due to lower similarity and the absence of close reference sequences in the database. Because COI reference coverage is uneven for some microbial eukaryotes and macroalgae, assignments for these groups were treated as provisional. BLAST results were imported into MEGAN Community Edition [34] to parse the output and generate a taxonomic summary table (Supplementary File S2). Taxonomic names for each OTU, from domain to the lowest supported rank, were compiled and cross-validated in R using the taxize package [35]. For community-composition summaries, OTU abundances were aggregated by major taxonomic groups. Figures were produced in R v4.2.2 using ggplot2 [36].

3. Results

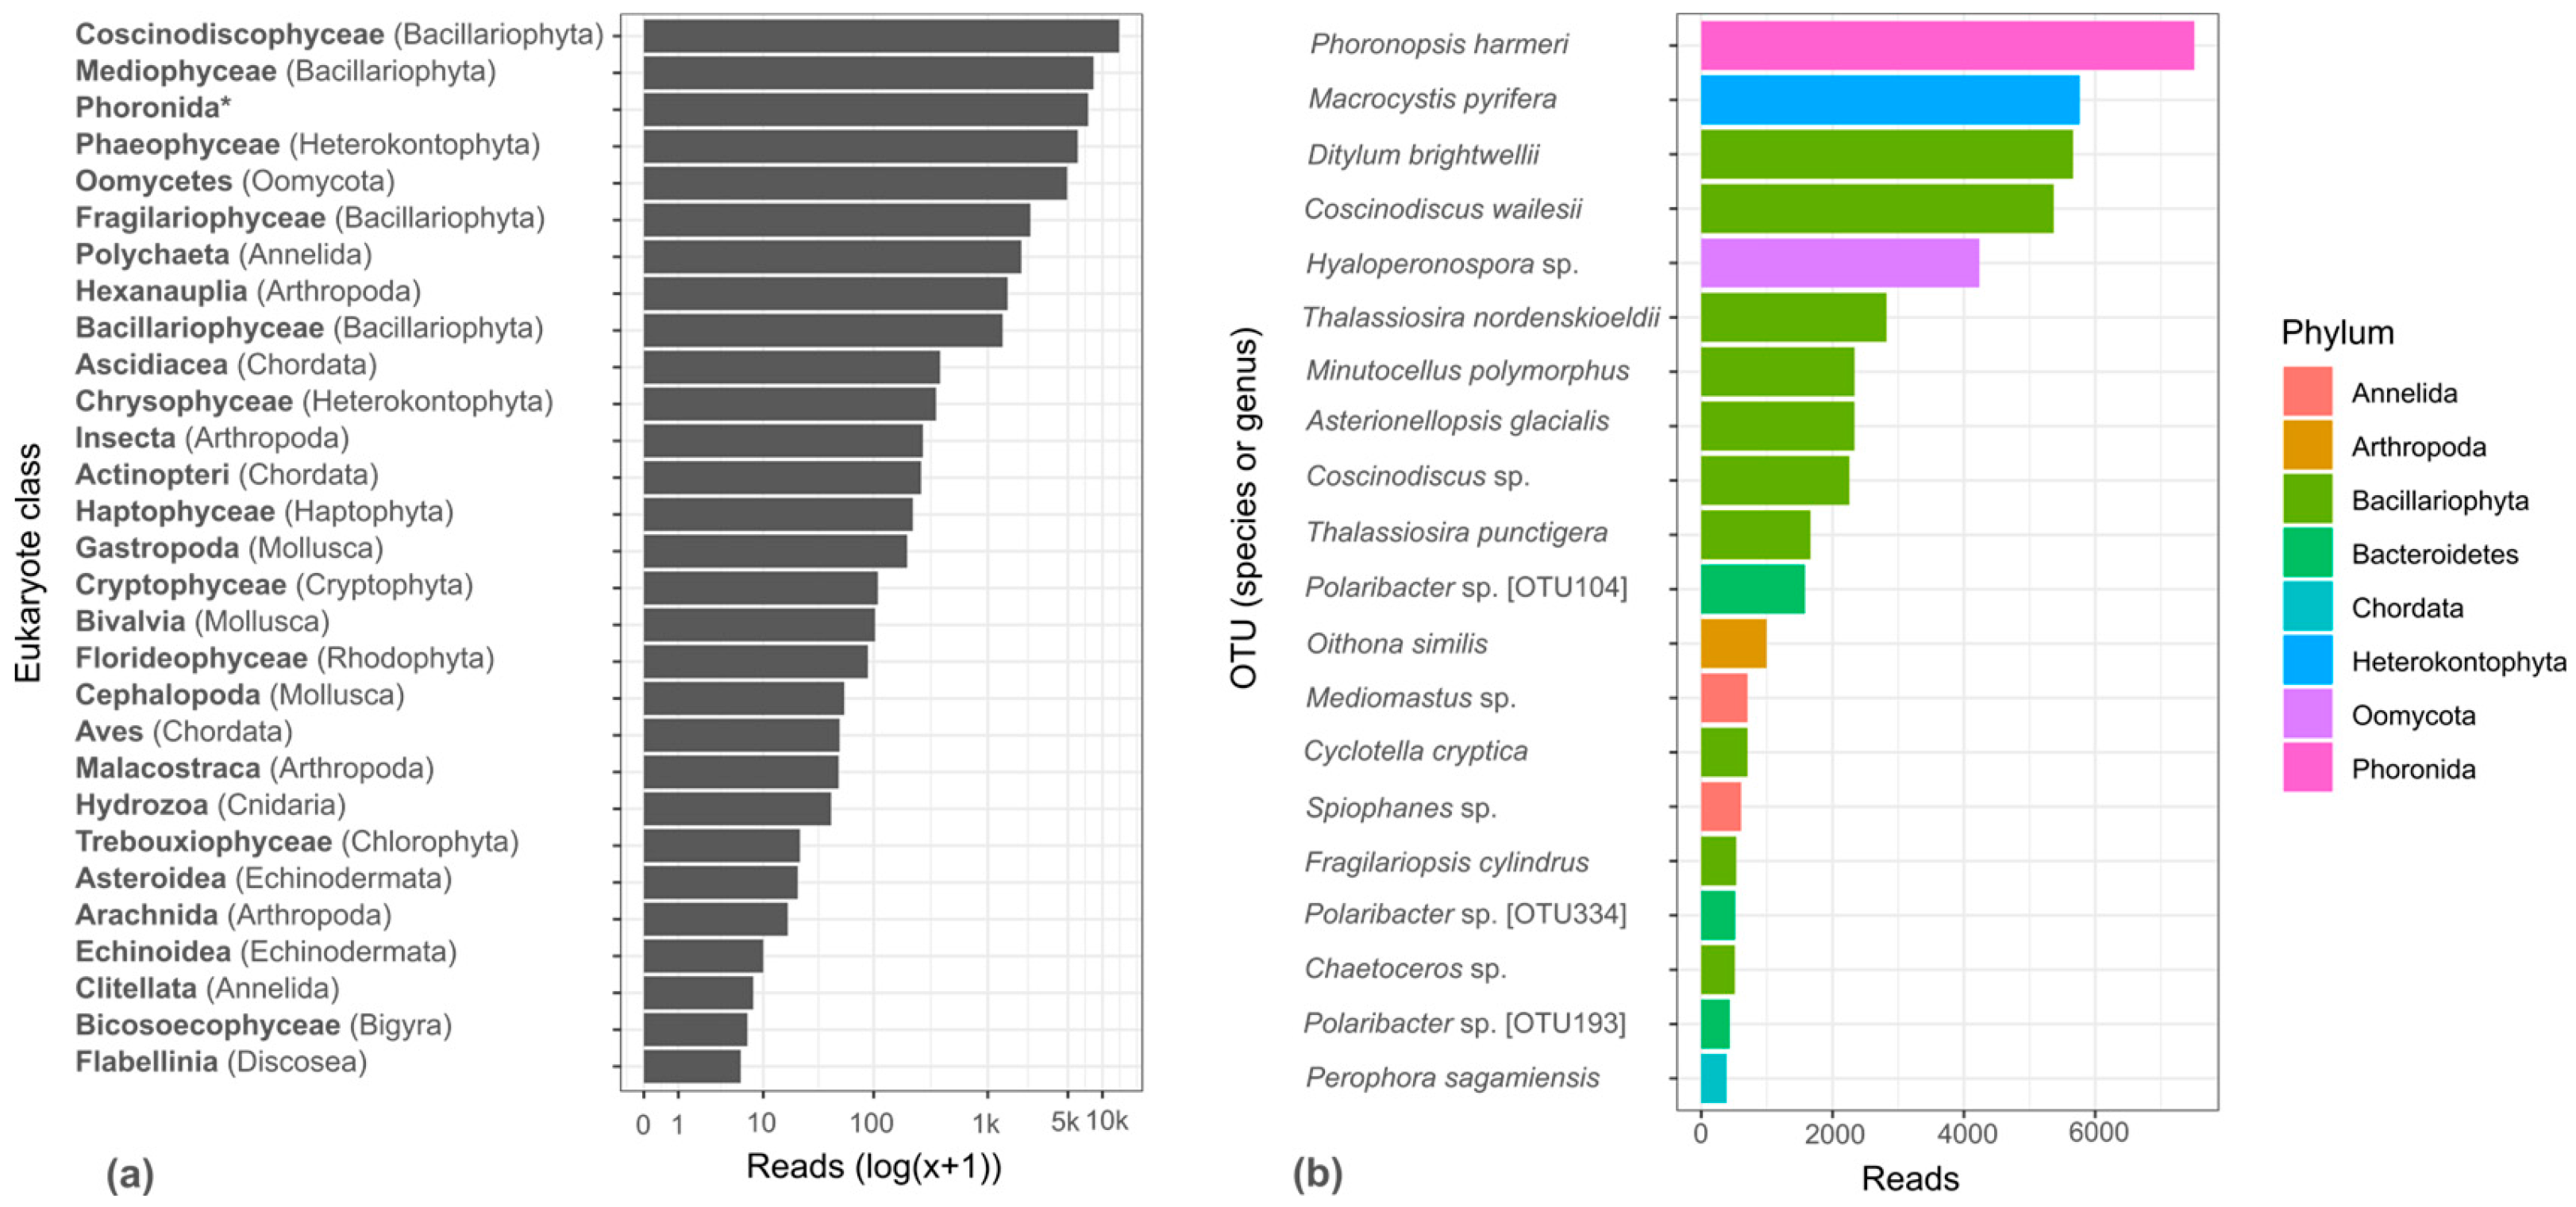
After sequencing and quality filtering, the Vostok Bay eDNA sample yielded 53,666 reads clustered into 176 OTUs. No OTUs were detected in the blank control, indicating negligible contamination. Of the 176 OTUs, most were classified as Eukaryota (154 OTUs, accounting for 93.7% of all reads), whereas a smaller fraction were assigned to Bacteria (22 OTUs, 6.3% of reads). The eDNA assemblage was taxonomically broad, spanning 17 eukaryotic phyla and one bacterial phylum (Figure 2; Supplementary File S2). The sample was dominated by photosynthetic microeukaryotes, particularly diatoms (Bacillariophyta). Diatoms were the most diverse group, comprising 61 OTUs (34% of all OTUs). These diatom OTUs spanned multiple classes, including centric diatoms (Coscinodiscophyceae and Mediophyceae) and pennate diatoms (Bacillariophyceae and Fragilariophyceae). Diatoms also dominated read abundance, contributing approximately 26,071 reads (49% of all reads). Coscinodiscophyceae alone accounted for about 14,000 reads (26% of all reads), the highest among eukaryotic classes, followed by Mediophyceae (8370 reads; 15.6%).
Several diatom taxa showed particularly high read counts. Multiple OTUs assigned to Ditylum brightwellii collectively yielded about 6000 reads (11%), including one OTU with 5663 reads. Coscinodiscus wailesii was represented by two OTUs (one with 5368 reads), and single OTUs assigned to Thalassiosira nordenskioeldii (2822 reads; 5,3%), Minutocellus polymorphus (2335 reads), and Asterionellopsis glacialis (2334 reads) each exceeded 1000 reads. Notably, several species were represented by multiple distinct OTUs. For example, D. brightwellii occurred as eight OTUs and the copepod Oithona similis as three OTUs; in both cases, one OTU dominated the read count while the remaining OTUs were less abundant, together supporting the presence of these taxa in the sample.
Most eukaryotic OTUs were represented by a 313-bp COI fragment, although several taxa showed slightly different amplicon lengths: Peltogasterella gracilis (Hexanauplia: Peltogasterella) and Mya sp. (Bivalvia: Myidae) yielded 316 bp, whereas Hiatella arctica (Bivalvia: Hiatellidae) yielded 310 bp. In contrast, all bacterial OTUs were represented by a 352-bp fragment.
Apart from microalgae, the dataset contained DNA from a broad range of metazoans. In total, 16 OTUs were assigned to Arthropoda, 10 to Annelida, 7 to Mollusca, and 7 to Chordata, with smaller numbers assigned to Cnidaria, Echinodermata, Porifera, and other phyla (including Phoronida).
A particularly abundant metazoan signal corresponded to the phoronid Phoronopsis harmeri—a single OTU accounted for 7511 reads (14.0% of all reads), representing the most abundant OTU in the sample. Additional benthic invertebrates were detected at lower read counts. For example, one OTU matched the mud shrimp Upogebia major (Upogebiidae; 31 reads). Polychaete annelids were also represented: nine OTUs were assigned to Polychaeta (Annelida), including Scalibregma and Spiophanes, together totaling 1961 reads (3,7% of all reads).
Several water-column metazoans were detected. Copepods (Hexanauplia) comprised seven OTUs. The cyclopoid copepod Oithona similis was represented by three OTUs (995, 152, and 15 reads). Cnidarian DNA was detected as three Hydrozoa OTUs at low read counts. One OTU was assigned to Ascidiacea and identified as Perophora sagamiensis (383 reads). A low-level terrestrial arthropod signal was also observed: one OTU was assigned to the ground-spider genus Nodocion (Araneae; 10 reads).
Vertebrate DNA was present but rare. Five teleost taxa were detected: Pseudaspius brandtii (6 reads), Pseudaspius hakonensis (9 reads), Hexagrammos octogrammus (5 reads), Pleurogrammus azonus (155 reads), and Oncorhynchus keta (86 reads). Together, these taxa accounted for 261 reads (0.5% of total reads). No marine mammal DNA was detected. In addition, eelgrass (Zostera marina) DNA was not amplified from this sample. One avian signal was detected—an OTU assigned to Larus was present with 49 reads.
Among non-diatom microbial eukaryotes, oomycetes were prominent. OTUs assigned to Oomycota (class Oomycetes) comprised 11 OTUs totaling 4918 reads (9.2% of total reads), including assignments to genera that include plant-associated pathogens (Pythium, Phytophthora, and Hyaloperonospora). Most oomycete reads were contributed by a single OTU assigned to Hyaloperonospora (Peronosporaceae; 4237 reads).
Brown algae were also detected. OTUs assigned to Phaeophyceae comprised eight OTUs totaling 6087 reads (11.0% of reads). Most were low-abundance assignments (e.g., Desmarestia, Analipus), whereas one OTU assigned to Macrocystis pyrifera accounted for 5763 reads (10.7% of total reads) and was among the most abundant OTUs in the dataset. Red algae (Florideophyceae; 4 OTUs) and green algae (Chlorophyta; 2 OTUs) were detected at low levels (<0.2% and <0.05% of reads, respectively). Because Macrocystis is not part of the regional flora, this assignment was treated as provisional and evaluated further (see Discussion).
The bacterial component was taxonomically narrow. All 22 bacterial OTUs were assigned to Bacteroidetes (class Flavobacteriia) and all belonged to Flavobacteriaceae. Within this family, 18 OTUs were assigned to Polaribacter, three to Formosa, and one to Aquimarina. Collectively, Flavobacteriaceae accounted for 3359 reads (6.0% of total reads). The most abundant bacterial OTU (OTU_104) was assigned to Polaribacter sp. and comprised 1579 reads.

4. Discussion

4.1. Multi-Trophic Signal from a Single Seawater eDNA Sample

A major strength of eDNA metabarcoding is its capacity to provide multi-trophic and multi-habitat coverage from minimally invasive sampling. From a single surface-water sample collected in Vostok Bay, I obtained an integrated snapshot spanning primary producers (diverse diatom phytoplankton and multiple brown and red algal lineages), microbial eukaryotes (e.g., oomycetes), and metazoans from several compartments of the ecosystem, including plankton (copepods such as Oithona similis and Paracalanus parvus), benthos-associated taxa (e.g., sponges, ascidians, and the infaunal burrowing shrimp Upogebia major), and higher trophic levels (teleost fishes). This breadth is consistent with the idea that water eDNA integrates DNA shed from organisms living in the water column as well as taxa associated with benthic and nearshore habitats through resuspension, mixing, and transport [37,38].
This ecosystem-wide perspective is particularly valuable in structurally complex habitats such as eelgrass meadows, where pelagic and benthic assemblages intersect and where conventional biodiversity assessment typically requires multiple gear types and targeted protocols (e.g., plankton nets, benthic cores, settlement plates or diving surveys, and fish sampling). In contrast, metabarcoding can rapidly screen a broad spectrum of taxa (including cryptic, microscopic, or transient components) that would rarely be captured simultaneously by routine monitoring. Recent work has highlighted the utility of eDNA approaches for characterizing biodiversity in seagrass ecosystems and for supporting multi-trophic monitoring across habitats, while also emphasizing that sampling design and marker choice strongly shape which compartments and taxa are best detected [38,39,40].
Importantly, this eDNA snapshot should be interpreted as complementary to rather than a replacement for classical inventories. Long-term surveys of the Vostok Bay marine reserve report exceptionally high biodiversity (e.g., 128 mollusc species and 96 arthropod species among many other groups), reflecting decades of targeted sampling and taxonomic effort [11]. In comparison, a single eDNA sample is inevitably incomplete and can include allochthonous signals (for example, terrestrial insects and a ground spider were detected in the dataset), underscoring that presence of DNA does not always imply a local, resident population at the sampling point. Nevertheless, by simultaneously capturing signals from the water column, benthos-associated taxa, and transient fauna, COI eDNA metabarcoding offers a powerful, scalable screening tool for ecosystem-based assessments and for detecting shifts that may occur at different trophic levels [37,38].
Given the single-marker, single-site, and single-date design, the completeness of this snapshot inevitably differs among trophic groups. Abundant planktonic microeukaryotes and some meroplankton and soft-bottom taxa were readily detected, whereas vertebrates and habitat-forming macrophytes were poorly captured. In addition, seawater eDNA integrates both locally produced and advected DNA. In a semi-enclosed bay, wind-driven surface transport and wave action can redistribute floating material and resuspend particles, and precipitation or freshwater inflow can deliver terrestrial and nearshore DNA. Accordingly, low-level signals such as Larus and terrestrial arthropods are best interpreted as evidence of DNA presence in the water at the sampling moment rather than as proof of a resident population directly at the sampling point.

4.2. A Strong Phoronid Signal

The strongest metazoan signal in the dataset was the phoronid Phoronopsis harmeri (14% of reads). This pronounced signal may reflect a pelagic larval contribution. In Vostok Bay, actinotrocha larvae occur for half of the year and can become particularly prominent in autumn. At the nearshore station, their densities may range from 3 to 3940 ind/m3, with maxima in October–November, and comprise up to 83.2% of meroplankton and 63.8% of total zooplankton [41]. Given that the actinotrocha stage can persist in the plankton for weeks to months before settlement, a strong surface-water DNA signal in late summer and early autumn is consistent with elevated larval abundance. At the same time, adult P. harmeri is known to reach very high biomass in Vostok Bay (up to 100 g/m2 with 8000 ind/m2, see [42]) and Peter the Great Bay in general [43], indicating that a mixed contribution (larvae plus resuspended or otherwise transported adult-derived eDNA) cannot be excluded. In the highly impacted inner bays (e.g., Amursky Bay), P. harmeri is explicitly treated as a pollution-tolerant positive indicator species and is discussed in the context of community restructuring under chronic disturbance [44]. In the Golden Horn Bay (Peter the Great Bay, Sea of Japan), macrobenthos surveys likewise report communities in which tolerant taxa predominate, with phoronids among the dominant groups and P. harmeri present at measurable densities [45]. Phoronids have a global distribution and are described as being euryhaline, eurythermal and resistant to the effects of red tides, suggesting they are highly adaptable [46].

4.3. The Detection of Other Metazoans

Beyond the dominant phoronid signal, COI metabarcoding recovered DNA from several soft-bottom invertebrates that are well documented in Vostok Bay. For example, an OTU matched the Japanese mud shrimp Upogebia major (Upogebiidae, 31 reads). This upogebiid forms local populations in Vostok Bay [47] and is most characteristic of shallow subtidal sandy sediments, including habitats associated with eelgrass belts, where it functions as a conspicuous burrower and bio-irrigator.
Polychaetes were represented by nine OTUs (1961 reads) spanning several taxa and functional guilds typical of sheltered coastal sediments. The polychaete signal was dominated by Capitellidae (Mediomastus sp., 706 reads) and Spionidae (Spiophanes spp., 965 reads across three OTUs, including an OTU assigned to S. kroyeri), together with lower-abundance detections of Scalibregmatidae (Scalibregma inflatum, three OTUs totaling 105 reads) and Glyceridae (Glycera sp., 164 reads). In addition, a low-abundance echiuran (Metabonellia haswelli, 21 reads) was detected. These taxa are consistent with a soft-bottom assemblage dominated by burrowing and tube-dwelling worms, including deep-burrowing detritivores (e.g., scalibregmatids) and spionids that often thrive in shallow-water sediments with active particle flux [48]. While the recovered polychaete OTU richness is modest, this is expected for a single water eDNA sample and does not contradict the well-known high diversity of the bay’s macrobenthos. Classical inventories report 161 polychaete species from Vostok Bay (as part of a broader macrobenthic fauna, see [11]).
Although my COI metabarcoding assay was implemented as a broadly universal metazoan survey, it recovered a small vertebrate signal. I detected sequences assigned to five teleost taxa, including two redfins (Pseudaspius spp.), the masked greenling Hexagrammos octogrammus, the arabesque greenling Pleurogrammus azonus, and chum salmon Oncorhynchus keta. All of these taxa are consistent with the regional fauna of Peter the Great Bay and adjacent coastal waters, including nearshore habitats and brackish environments in the Vostok Bay [10]. Given that published inventories report at least 128 fish species for Vostok Bay [10], the five fish taxa detected here correspond to about 4% (5/128) of the known fish fauna, underscoring that a single universal COI water sample provides only a coarse and opportunistic glimpse of vertebrate diversity.
Fish-derived reads were rare (261 reads or 0.5% of the dataset), and no marine mammal reads were detected. Such low vertebrate recovery is not unexpected for aqueous eDNA when using highly degenerate COI primer sets, because these primers are optimized for broad metazoan amplification and can preferentially amplify abundant non-vertebrate templates present in the same extract. In particular, COI-based eDNA surveys are known to be susceptible to non-target amplification and reduced reproducibility at low template concentrations, which can further suppress vertebrate detection in mixed communities [49,50].
The absence of Zostera marina DNA, even though the sample was collected over an eelgrass bed, is also consistent with marker choice. Standard animal-focused COI assays are generally unsuitable for vascular plants, both because plant mitochondrial genes typically evolve relatively slowly limiting their barcoding utility and because commonly used COI primer sets do not reliably amplify angiosperm templates. Plant and seagrass eDNA studies therefore typically employ plastid and nuclear loci (e.g., rbcL, matK, ITS or short trnL intron) rather than COI [51,52].
For vertebrates, primer choice is likewise critical. Fish-targeted metabarcoding commonly uses mitochondrial 12S rRNA primer sets, which consistently outperform COI for fish detection and richness in comparative evaluations of eDNA primers [53,54]. Accordingly, a multi-marker strategy would likely provide a more complete inventory of vertebrates and habitat-forming vegetation in future surveys of Vostok Bay.

4.4. Diatom Dominance and Consequences for Detection of Rare Taxa

Diatoms dominated both OTU richness and read abundance (approximately half of all reads), which is ecologically plausible for late-summer and early-autumn coastal waters of the northwestern Sea of Japan and is consistent with microscopy-based observations of seasonal phytoplankton maxima in Vostok Bay [55,56].
Several large centric diatoms ranked among the highest-read taxa in the sample, including Ditylum brightwellii, Coscinodiscus wailesii, and Thalassiosira spp. High read counts for these taxa are consistent with their ability to become abundant components of coastal blooms and to contribute substantially to chlorophyll maxima when environmental conditions are favorable. For example, C. wailesii is a well-known bloom-forming species in Japanese coastal waters, where dense proliferations have been linked to strong nutrient drawdown and high organic matter export [57,58].
At the same time, the apparent dominance of diatom reads should be interpreted as the product of both biological reality and methodological effects inherent to amplicon-based eDNA. First, standard water eDNA filtration captures intact phytoplankton cells in addition to extracellular DNA, which can inflate the contribution of abundant microalgae to the extracted DNA pool. Second, mixed-template PCR can amplify the most common templates disproportionately—taxa present at high biomass or with many copies of target mitochondrial DNA can be preferentially amplified as cycle number increases, effectively swamping rarer templates. This observation bias driven by taxon-specific amplification efficiencies and competition among templates is widely recognized in metabarcoding and can weaken any quantitative interpretation of read counts, especially in highly uneven communities [59,60,61,62]. Accordingly, the strong diatom signal may have reduced detection sensitivity for low-abundance metazoan sequences in this particular sample. Nonetheless, diatom dominance is not merely a technical artifact. It is itself an ecologically meaningful result, consistent with a productive plankton community in Vostok Bay at the time of sampling.

4.5. Assignment Caveats for Non-Target Groups and Plant Pathogens

Beyond algae and metazoans, the COI eDNA dataset highlighted a substantial signal from oomycetes, a group that is rarely targeted in conventional marine COI eDNA surveys. I recovered 11 oomycete-affiliated OTUs totaling 4918 reads, including assignments to Pythium, Phytophthora, and Hyaloperonospora. The dominant oomycete OTU was classified as Hyaloperonospora (4237 reads), a genus best known as an obligate downy-mildew pathogen of terrestrial plants [63].
Because Hyaloperonospora is not typically considered a marine taxon, this result should be interpreted cautiously. One plausible explanation is terrestrial input—spores, infected plant debris, or soil-derived DNA can reach coastal waters via runoff and nearshore transport, and DNA-based assays are capable of detecting such propagules even when organisms are not actively growing in seawater [64]. A second, non-exclusive explanation is taxonomic misassignment driven by marker and database limitations. Short COI amplicons and incomplete reference libraries for marine oomycetes can cause marine lineages to be assigned to better-sampled terrestrial genera. In this context, the Hyaloperonospora label may represent a closest available match rather than definitive evidence of a downy-mildew pathogen reproducing in the bay [63].
In contrast, the detection of Phytophthora-affiliated reads is ecologically more straightforward, because oomycetes related to Phytophthora and Halophytophthora are increasingly recognized in coastal habitats and can interact with seagrasses. For example, widespread infection of Zostera marina by Phytophthora and Halophytophthora species has been reported, with potential implications for seagrass conservation and restoration [65,66]. Moreover, a recently highlighted seagrass-associated pathogen, Phytophthora gemini, has been reported as highly prevalent across surveyed North Atlantic and Mediterranean eelgrass populations and resistant to reduced acidity [67].
Given the management implications of reporting potential plant pathogens, I recommend targeted follow-up to validate these detections, e.g., sequencing with oomycete-focused markers like ITS, quantitative assays, and sampling of eelgrass tissues and sediments where infections would be expected to concentrate [68,69].
Although most taxonomic assignments were ecologically plausible, one highly abundant OTU in the dataset warrants special attention. An OTU comprising 5763 reads (10.7% of total reads) was assigned by the pipeline to the giant kelp Macrocystis pyrifera. This identification is biogeographically incongruent—M. pyrifera is a habitat-forming kelp with an antitropical distribution centered on the northeastern Pacific and multiple Southern Hemisphere coastlines, and it is not regarded as part of the Northwest Pacific and Sea of Japan flora [70].
I therefore interpret this record as a taxonomic misassignment rather than evidence for the occurrence of Macrocystis in Vostok Bay. When the OTU sequence was analyzed together with additional brown-algal COI sequences retrieved by targeted BLAST (including Pelagophycus, Macrocystis, and Saccharina representatives), reference sequences clustered by genus as expected, whereas targeted OTU occupied an external position relative to all of these kelp lineages and differed from them by >19% p-distance, whereas the natural distances between genera ranged from 2 to 9%. This case illustrates a common caveat of COI metabarcoding: short amplicons and incomplete or geographically biased reference libraries can force classifiers to assign sequences to the closest available named taxon, occasionally producing conspicuous false positives—especially when a local lineage lacks representative barcodes [62,71,72]. The issue can be exacerbated when using the Leray 313 bp COI fragment, which was designed primarily for broad metazoan amplification and may provide limited resolution for some non-target groups, including macroalgae [22]. More generally, conservative taxonomic resolution and occasional biogeographically implausible best hits are widely reported outcomes of COI metabarcoding in marine systems, largely driven by uneven and geographically biased reference coverage rather than by shortcomings of the sequencing data. Recent syntheses highlight substantial gaps in taxonomic coverage of the COI fragment databases even in comparatively well-studied coastal regions and show that incomplete libraries can both increase the fraction of unassigned reads and promote nearest-match artefacts that require cautious interpretation [72,73]. Accordingly, unexpected records in the dataset were treated as hypotheses requiring validation (e.g., via targeted phylogenetic checks), while broader improvements are best achieved through curated regional barcode resources and customized, nonredundant reference databases tailored to the study region and marker [72,74]. This supports my interpretation that several limitations noted here primarily reflect current reference-library constraints and motivates the regional library strategy proposed below for Peter the Great Bay.
For routine multi-trophic monitoring in Vostok Bay, I recommend complementing COI with a small prioritized marker set: (i) fish-targeted 12S rRNA to improve vertebrate detection, (ii) a plastid marker such as rbcL to better capture seagrass and macroalgae, and (iii) ITS2 when fungi and plant-associated groups are a monitoring focus (or, alternatively, 18S rRNA V4 for broader eukaryote coverage).

4.6. Implications for MPA Monitoring and the Need for a Regional Reference Library

Despite all mentioned limitations, COI metabarcoding from seawater provides a rapid, non-destructive screening layer well aligned with ecosystem-based monitoring in the Marine Reserve “Zaliv Vostok”. A single assay may simultaneously track dominant primary producers, planktonic consumers, benthos-associated taxa, and transient vertebrates [39]. Operational MPA monitoring, however, should be validation-focused. Replicated sampling across seasons and habitats, a multi-marker design tailored to management questions, and routine curation and phylogenetic checks for unexpected assignments. The reliability of taxonomic calls—especially for macroalgae and other under-barcoded groups—will strongly benefit from a curated regional reference library that links local voucher specimens to high-quality barcodes and complements public repositories [71,72,74]. Developing such a library for Peter the Great Bay (including dominant macroalgae, key benthic invertebrates, and locally relevant fishes) would directly reduce false positives, improve taxonomic resolution, and strengthen the interpretability of eDNA time series as biodiversity indicators for conservation decision-making in Vostok Bay.

5. Conclusions

COI metabarcoding of seawater eDNA from a Zosteraceae meadow in the Vostok Bay marine reserve yielded a first molecular snapshot of local coastal biodiversity, dominated by diatoms and featuring a strong phoronid signal alongside diverse invertebrates and a small fish component. Given its intentionally limited spatial and temporal scope, this snapshot should be interpreted as a baseline reference point for future replicated surveys, not as an exhaustive inventory of the meadow community. Taken together, the concordance between eDNA detections and published faunal records supports the use of COI eDNA metabarcoding as a low-impact complement to conventional soft-bottom sampling, especially for presence/absence screening of key infaunal taxa, while recognizing that overlying-water eDNA is not a substitute for sediment surveys when exhaustive inventories are required [62,75,76]. These results illustrate the value of COI eDNA as a rapid, non-invasive, multi-trophic screening approach for MPA monitoring, but they also demonstrate key limitations of single-marker surveys and public databases, including low vertebrate sensitivity and occasional biogeographically implausible assignments. Accordingly, I recommend interpreting single-site COI snapshots cautiously and implementing future monitoring with replicated seasonal sampling, a multi-marker strategy, and, critically, the development of a curated regional reference library, which will substantially improve taxonomic resolution and the reliability of eDNA-based biodiversity indicators in the northwestern Sea of Japan.

Supplementary Materials

The following supporting information can be downloaded at: https://www.mdpi.com/article/10.3390/d18020120/s1, Supplementary File S1: tags and primers sequences and sample metadata; Supplementary File S2: OTU table (BIOM format) and representative sequences. These files will be provided as supplementary materials upon submission.

Funding

This study was supported by baseline (institutional) funding of the authors’ organizations. No targeted external grants were obtained.

Institutional Review Board Statement

Not applicable.

Data Availability Statement

The raw sequencing reads and associated metadata are available in the NCBI Sequence Read Archive under accession SRR22284826.

Acknowledgments

The author thanks colleagues who assisted with laboratory work.

Conflicts of Interest

The author declares no conflicts of interest.

References

  1. Duffy, J.E. Biodiversity and the functioning of seagrass ecosystems. Mar. Ecol. Prog. Ser. 2006, 311, 233–250. [Google Scholar] [CrossRef]
  2. Waycott, M.; Duarte, C.M.; Carruthers, T.J.B.; Orth, R.J.; Dennison, W.C.; Olyarnik, S.; Calladine, A.; Fourqurean, J.W.; Heck, K.L., Jr.; Hughes, A.R.; et al. Accelerating loss of seagrasses across the globe threatens coastal ecosystems. Proc. Natl. Acad. Sci. USA 2009, 106, 12377–12381. [Google Scholar] [CrossRef] [PubMed]
  3. Veilleux, H.D.; Misutka, M.D.; Glover, C.N. Environmental DNA and environmental RNA: Current and prospective applications for biological monitoring. Sci. Total Environ. 2021, 782, 146891. [Google Scholar] [CrossRef] [PubMed]
  4. Rees, H.C.; Maddison, B.C.; Middleditch, D.J.; Patmore, J.R.M.; Gough, K.C. REVIEW: The detection of aquatic animal species using environmental DNA—A review of eDNA as a survey tool in ecology. J. Appl. Ecol. 2014, 51, 1450–1459. [Google Scholar] [CrossRef]
  5. Gold, Z.; Sprague, J.; Kushner, D.J.; Zerecero Marin, E.; Barber, P.H. eDNA metabarcoding as a biomonitoring tool for marine protected areas. PLoS ONE 2021, 16, e0238557. [Google Scholar] [CrossRef]
  6. Boussarie, G.; Bakker, J.; Wangensteen, O.S.; Mariani, S.; Bonnin, L.; Juhel, J.-B.; Kiszka, J.J.; Kulbicki, M.; Manel, S.; Robbins, W.D.; et al. Environmental DNA illuminates the dark diversity of sharks. Sci. Adv. 2018, 4, eaap9661. [Google Scholar] [CrossRef]
  7. Ruppert, K.M.; Kline, R.J.; Rahman, M.S. Past, present, and future perspectives of environmental DNA (eDNA) metabarcoding: A systematic review in methods, monitoring, and applications of global eDNA. Glob. Ecol. Conserv. 2019, 17, e00547. [Google Scholar] [CrossRef]
  8. Gold, Z.; Wall, A.R.; Schweizer, T.M.; Pentcheff, N.D.; Curd, E.E.; Barber, P.H.; Meyer, R.S.; Wayne, R.; Stolzenbach, K.; Prickett, K.; et al. A manager’s guide to using eDNA metabarcoding in marine ecosystems. PeerJ 2022, 10, e14071. [Google Scholar] [CrossRef]
  9. Danchenkov, M.A.; Lobanov, V.B.; Riser, S.C.; Kim, K.; Takematsu, M.; Yoon, J.-H. A history of physical oceanographic research in the Japan/East Sea. Oceanography 2006, 19, 18–31. [Google Scholar] [CrossRef]
  10. Sokolovskiy, A.S.; Sokolovskaya, T.G.; Kharin, V.E.; Dolganov, S.M. Ichthyofauna of Vostok Bay, Sea of Japan. Biodivers. Environ. Far East Reserves 2014, 1, 71–99. (In Russian) [Google Scholar]
  11. Tyurin, S.A. Macrobenthos of the Vostok Bay of the Sea of Japan (A Check-List); Rea: Vladivostok, Russia, 2002; 30p. (In Russian) [Google Scholar]
  12. Marin, I.N.; Kornienko, E.S. The list of Decapoda species from Vostok Bay, Sea of Japan. Biodivers. Environ. Far East Reserves 2014, 2, 49–71. (In Russian) [Google Scholar]
  13. Lebedev, E.B.; Levenets, I.R. Malacofauna composition of far eastern marine reserve (Peter the Great Bay, the Sea of Japan). Vestn. KrasGAU 2018, 3, 189–193. (In Russian) [Google Scholar]
  14. Levenets, I.R.; Tyurin, S.A. Macrophytes of Vostok Bay, Sea of Japan. Biodivers. Environ. Far East Reserves 2014, 1, 36–48. (In Russian) [Google Scholar]
  15. Skriptsova, A.V.; Belous, O.S.; Kalita, T.L. The current status of upper subtidal communities of macrophytes in Vostok Bay, Sea of Japan. Russ. J. Mar. Biol. 2024, 50, S3–S16. [Google Scholar] [CrossRef]
  16. Adrianov, A.V. Strategies and methodology of marine biodiversity studies. Russ. J. Mar. Biol. 2004, 30, S17–S21. [Google Scholar] [CrossRef]
  17. Adrianov, A.V.; Kusakin, O.G. A Check-List of Biota of the Peter the Great Bay, the Sea of Japan; Dalnauka: Vladivostok, Russia, 1998; 350p. (In Russian) [Google Scholar]
  18. Dolganov, S.M.; Tyurin, A.N. Marine Reserve “Zaliv Vostok”. Biodivers. Environ. Far East Reserves 2014, 1, 9–24. [Google Scholar]
  19. Jacobs-Palmer, E.; Gallego, R.; Ramón-Laca, A.; Kunselman, E.; Cribari, K.; Horwith, M.; Kelly, R.P. A halo of reduced dinoflagellate abundances in and around eelgrass beds. PeerJ 2020, 8, e8869. [Google Scholar] [CrossRef]
  20. He, X.; Stanley, R.R.; Rubidge, E.M.; Jeffery, N.W.; Hamilton, L.C.; Westfall, K.M.; Gilmore, S.R.; Roux, L.-M.D.; Gale, K.S.P.; Heaslip, S.G.; et al. Fish community surveys in eelgrass beds using both eDNA metabarcoding and seining: Implications for biodiversity monitoring in the coastal zone. Can. J. Fish. Aquat. Sci. 2022, 79, 1335–1346. [Google Scholar] [CrossRef]
  21. Waters, T.; Gold, Z.; Obaza, A.; Ambrose, R.F.; Eagle, R.A. Environmental DNA metabarcoding reveals distinct fish assemblages supported by seagrass (Zostera marina and Zostera pacifica) beds in different geographic settings in Southern California. PLoS ONE 2023, 18, e0286228. [Google Scholar] [CrossRef]
  22. Leray, M.; Yang, J.Y.; Meyer, C.P.; Mills, S.C.; Agudelo, N.; Ranwez, V.; Boehm, J.T.; Machida, R.J. A new versatile primer set targeting a short fragment of the mitochondrial COI region for metabarcoding metazoan diversity: Application for characterizing coral reef fish gut contents. Front. Zool 2013, 10, 34. [Google Scholar] [CrossRef]
  23. Longmire, J.L.; Maltbie, M.; Baker, R.J. Use of “lysis buffer” in DNA Isolation and Its Implication for Museum Collections; Museum of Texas Tech University: Lubbock, TX, USA, 1997. [Google Scholar]
  24. Kesberg, A.I.; Schleheck, D. Improved protocol for recovery of bacterial DNA from water filters: Sonication and backflushing of syringe filters. J. Microbiol. Methods 2013, 93, 55–57. [Google Scholar] [CrossRef] [PubMed]
  25. Geller, J.; Meyer, C.; Parker, M.; Hawk, H. Redesign of PCR primers for mitochondrial COI for marine invertebrates and application in all-taxa biotic surveys. Mol. Ecol. Resour. 2013, 13, 851–861. [Google Scholar] [CrossRef] [PubMed]
  26. Wangensteen, O.S.; Palacín, C.; Guardiola, M.; Turon, X. DNA metabarcoding of littoral hard-bottom communities: High diversity revealed by two molecular markers. PeerJ 2018, 6, e4705. [Google Scholar] [CrossRef] [PubMed]
  27. Boyer, F.; Mercier, C.; Bonin, A.; Le Bras, Y.; Taberlet, P.; Coissac, E. OBITools: A UNIX-inspired software package for DNA metabarcoding. Mol. Ecol. Resour 2016, 16, 176–182. [Google Scholar] [CrossRef]
  28. Zepeda-Mendoza, M.L.; Bohmann, K.; Carmona Baez, A.; Gilbert, M.T.P. DAMe: A toolkit for the initial processing of datasets with PCR replicates of double-tagged amplicons for DNA metabarcoding analyses. BMC Res. Notes 2016, 9, 255. [Google Scholar] [CrossRef]
  29. Bankevich, A.; Nurk, S.; Antipov, D.; Gurevich, A.A.; Dvorkin, M.; Kulikov, A.S.; Lesin, V.M.; Nikolenko, S.I.; Pham, S.; Prjibelski, A.D.; et al. SPAdes: A new genome assembly algorithm and its applications to single-cell sequencing. J. Comput. Biol. 2012, 19, 455–477. [Google Scholar] [CrossRef]
  30. Masella, A.P.; Bartram, A.K.; Truszkowski, J.M.; Brown, D.G.; Neufeld, J.D. PANDAseq: Paired-end assembler for Illumina sequences. BMC Bioinform. 2012, 13, 31. [Google Scholar] [CrossRef]
  31. Yang, C.; Bohmann, K.; Wang, X.; Cai, W.; Wales, N.; Ding, Z.; Gopalakrishnan, S.; Yu, D.W. Biodiversity soup II: A bulk-sample metabarcoding pipeline emphasizing error reduction. Methods Ecol. Evol. 2021, 12, 1252–1264. [Google Scholar] [CrossRef]
  32. Mercier, C.; Boyer, F.; Bonin, A.; Coissac, E. SUMATRA and SUMACLUST: Fast and exact comparison and clustering of sequences. In Programs and Abstracts of the SeqBio 2013 Workshop; Citeseer: Princeton, NJ, USA, 2013; p. 27. [Google Scholar]
  33. Camacho, C.; Coulouris, G.; Avagyan, V.; Ma, N.; Papadopoulos, J.; Bealer, K.; Madden, T.L. BLAST+: Architecture and applications. BMC Bioinform. 2009, 10, 421. [Google Scholar] [CrossRef]
  34. Huson, D.H.; Beier, S.; Flade, I.; Górska, A.; El-Hadidi, M.; Mitra, S.; Ruscheweyh, H.-J.; Tappu, R. MEGAN Community Edition—Interactive exploration and analysis of large-scale microbiome sequencing data. PLoS Comput. Biol. 2016, 12, e1004957. [Google Scholar] [CrossRef]
  35. Chamberlain, S.; Szocs, E. taxize—Taxonomic search and retrieval in R. F1000Research 2013, 2, 191. [Google Scholar] [CrossRef] [PubMed]
  36. Wickham, H. ggplot2. WIREs Comp. Stat. 2011, 3, 180–185. [Google Scholar] [CrossRef]
  37. Holman, L.E.; de Bruyn, M.; Creer, S.; Carvalho, G.; Robidart, J.; Rius, M. Detection of introduced and resident marine species using environmental DNA metabarcoding of sediment and water. Sci. Rep. 2019, 9, 11559. [Google Scholar] [CrossRef]
  38. Adams, C.I.M.; Jeunen, G.-J.; Cross, H.; Taylor, H.R.; Bagnaro, A.; Currie, K.; Hepburn, C.; Gemmell, N.J.; Urban, L.; Baltar, F.; et al. Environmental DNA metabarcoding describes biodiversity across marine gradients. ICES J. Mar. Sci. 2023, 80, 953–971. [Google Scholar] [CrossRef]
  39. Capurso, G.; Carroll, B.; Stewart, K.A. Transforming marine monitoring: Using eDNA metabarcoding to improve the monitoring of the Mediterranean Marine Protected Areas network. Mar. Policy 2023, 156, 105807. [Google Scholar] [CrossRef]
  40. Trask, C.G.; Jeffery, N.W.; Stanley, R.R.; Van Wyngaarden, M.; McBride, M.C.; He, X.; Abbott, C.L.; Rawlings, T.A. Applying eDNA metabarcoding to assess invertebrate biodiversity of eelgrass (Zostera marina) meadows across Nova Scotia. Can. J. Fish. Aquat. Sci. 2025, 82, 1–18. [Google Scholar] [CrossRef]
  41. Omelyanenko, V.A.; Kulikova, V.A. Pelagic larvae of benthic invertebrates of the Vostok Bay, Peter the Great Bay, Sea of Japan: Composition, phenology, and population dynamics. Russ. J. Mar. Biol. 2011, 37, 7–22. [Google Scholar] [CrossRef]
  42. Tarasov, V.G. Distribution and trophic zonation of the soft bottom communities in the Vostok Bay (Sea of Japan). Mar. Biol. 1978, 6, 16–22. [Google Scholar]
  43. Moshchenko, A.V.; Belan, T.A.; Borisov, B.M. Communities of macrozoobenthos on soft sediments in the coastal areas of open parts of Peter the Great Bay, Japan Sea and their ecological status. Izv. TINRO 2023, 203, 581–600. [Google Scholar] [CrossRef]
  44. Chen, L.; Lutaenko, K.A.; Li, X.; Li, X.; Zhou, Z.; Li, B.; Pavlyuk, O.N.; Tarasova, T.S. Long-term changes of marine subtidal benthic communities in North East Asia (Yellow and Japan seas) in a global change context: A review. Aquat. Conserv. Mar. Freshw. Ecosyst. 2020, 30, 1451–1475. [Google Scholar] [CrossRef]
  45. Smirnova, E.V.; Matrosova, I.V. The State of the Planktonic and Benthic Components of the Ecosystem of the Golden Horn Bay (Peter the Great Bay, Sea of Japan) in the Area of the Coal Terminal. E3S Web Conf 2021, 320, 01001. [Google Scholar] [CrossRef]
  46. Emig, C.C. The biology of Phoronida. In Advances in Marine Biology; Academic Press: Cambridge, MA, USA, 1982; Volume 19, pp. 1–89. [Google Scholar]
  47. Selin, N.I. Features of the spatial distribution of the Japanese mud shrimp Upogebia major (De Haan, 1841) (Decapoda: Upogebiidae) in the Vostok Bay, Sea of Japan. Russ. J. Mar. Biol. 2015, 41, 219–222. [Google Scholar] [CrossRef]
  48. Fauchald, O.K.; Jumars, P.A. The diet of worms: A study of polychaete feeding guilds. Oceanogr. Mar. Biol. Ann. Rev 1979, 17, 193–284. [Google Scholar]
  49. Collins, R.A.; Bakker, J.; Wangensteen, O.S.; Soto, A.Z.; Corrigan, L.; Sims, D.W.; Genner, M.J.; Mariani, S. Non-specific amplification compromises environmental DNA metabarcoding with COI. Methods Ecol. Evol 2019, 10, 1985–2001. [Google Scholar] [CrossRef]
  50. Hintikka, S.; Carlsson, J.E.; Carlsson, J. The bacterial hitchhiker’s guide to COI: Universal primer-based COI capture probes fail to exclude bacterial DNA, but 16S capture leaves metazoa behind. Metabarcoding Metagenomics 2022, 6, e80416. [Google Scholar] [CrossRef]
  51. Foster, N.R.; Van Dijk, K.J.; Biffin, E.; Young, J.M.; Thomson, V.A.; Gillanders, B.M.; Jones, A.R.; Waycott, M. A multi-gene region targeted capture approach to detect plant DNA in environmental samples: A case study from coastal environments. Front. Ecol. Evol. 2021, 9, 735744. [Google Scholar] [CrossRef]
  52. Braukmann, T.W.; Kuzmina, M.L.; Sills, J.; Zakharov, E.V.; Hebert, P.D.N. Testing the efficacy of DNA barcodes for identifying the vascular plants of Canada. PLoS ONE 2017, 12, e0169515. [Google Scholar] [CrossRef]
  53. Miya, M.; Sato, Y.; Fukunaga, T.; Sado, T.; Poulsen, J.Y.; Sato, K.; Minamoto, T.; Yamamoto, S.; Yamanaka, H.; Araki, H.; et al. MiFish, a set of universal PCR primers for metabarcoding environmental DNA from fishes: Detection of more than 230 subtropical marine species. R. Soc. Open Sci. 2015, 2, 150088. [Google Scholar] [CrossRef]
  54. Zhang, S.; Zhao, J.; Yao, M. A comprehensive and comparative evaluation of primers for metabarcoding eDNA from fish. Methods Ecol. Evol. 2020, 11, 1609–1625. [Google Scholar] [CrossRef]
  55. Morozova, T.V.; Orlova, T.Y. Monitoring of phytoplankton in the area of a sea farm in Vostok Bay (Sea of Japan). Russ. J. Mar. Biol. 2005, 31, 1–6. [Google Scholar] [CrossRef]
  56. Zuenko, Y.; Selina, M.; Stonik, I. On conditions of phytoplankton blooms in the coastal waters of the North-Western East/Japan Sea. Ocean Sci. J. 2006, 41, 31–41. [Google Scholar] [CrossRef]
  57. Manabe, T.; Ishio, S. Bloom of Coscinodiscus wailesii and DO deficit of bottom water in Seto Inland Sea. Mar. Pollut. Bull. 1991, 23, 181–184. [Google Scholar] [CrossRef]
  58. Ono, A.; Tada, K.; Ichimi, K. Chemical composition of Coscinodiscus wailesii and the implication for nutrient ratios in a coastal water, Seto Inland Sea, Japan. Mar. Pollut. Bull. 2008, 57, 94–102. [Google Scholar] [CrossRef]
  59. Kelly, R.P.; Shelton, A.O.; Gallego, R. Understanding PCR processes to draw meaningful conclusions from environmental DNA studies. Sci. Rep. 2019, 9, 12133. [Google Scholar] [CrossRef] [PubMed]
  60. Elbrecht, V.; Leese, F. Can DNA-based ecosystem assessments quantify species abundance? Testing primer bias and biomass—Sequence relationships with an innovative metabarcoding protocol. PLoS ONE 2015, 10, e0130324. [Google Scholar] [CrossRef]
  61. Piñol, J.; Senar, M.A.; Symondson, W.O.C. The choice of universal primers and the characteristics of the species mixture determine when DNA metabarcoding can be quantitative. Mol. Ecol. 2019, 28, 407–419. [Google Scholar] [CrossRef] [PubMed]
  62. Van Der Loos, L.M.; Nijland, R. Biases in bulk: DNA metabarcoding of marine communities and the methodology involved. Mol. Ecol. 2021, 30, 3270–3288. [Google Scholar] [CrossRef]
  63. Tör, M.; Wood, T.; Webb, A.; Göl, D.; McDowell, J.M. Recent developments in plant-downy mildew interactions. Semin. Cell Dev. Biol. 2023, 148–149, 42–50. [Google Scholar] [CrossRef]
  64. Klosterman, S.J.; Anchieta, A.; McRoberts, N.; Koike, S.T.; Subbarao, K.V.; Voglmayr, H.; Choi, Y.J.; Thines, M.; Martin, F.N. Coupling spore traps and quantitative PCR assays for detection of the downy mildew pathogens of spinach (Peronospora effusa) and beet (P. schachtii). Phytopathology 2014, 104, 1349–1359. [Google Scholar] [CrossRef]
  65. Govers, L.L.; Meffert, J.P.; Bouma, T.J.; van Rijswick, P.C.J.; Heusinkveld, J.H.T.; Orth, R.J.; van Katwijk, M.M.; van der Heide, T. Marine Phytophthora species can hamper conservation and restoration of vegetated coastal ecosystems. Proc. R. Soc. B 2016, 283, 20160812. [Google Scholar] [CrossRef]
  66. Sullivan, B.K.; Trevathan-Tackett, S.M.; Neuhauser, S.; Govers, L.L. Host-pathogen dynamics of seagrass diseases under future global change. Mar. Pollut. Bull. 2018, 134, 75–88. [Google Scholar] [CrossRef]
  67. Lowell, A.; Hill, C.E.; Dupont, S.; Infantes, E.; Ramesh, K.; Peterson, B.; Govers, L.L.; Cox, T.E. Low pH enhances germination of eelgrass (Zostera marina L.) seeds despite ubiquitous presence of Phytophthora gemini. Aquat. Bot. 2024, 195, 103805. [Google Scholar] [CrossRef]
  68. Legeay, J.; Husson, C.; Cordier, T.; Vacher, C.; Marcais, B.; Buée, M. Comparison and validation of Oomycetes metabarcoding primers for Phytophthora high throughput sequencing. J. Plant Pathol. 2019, 101, 743–748. [Google Scholar] [CrossRef]
  69. Ríos-Castro, R.; Romero, A.; Aranguren, R.; Pallavicini, A.; Banchi, E.; Novoa, B.; Figueras, A. High-throughput sequencing of environmental DNA as a tool for monitoring eukaryotic communities and potential pathogens in a coastal upwelling ecosystem. Front. Vet. Sci. 2021, 8, 765606. [Google Scholar] [CrossRef] [PubMed]
  70. Graham, M.H.; Vasquez, J.A.; Buschmann, A.H. Global ecology of the giant kelp Macrocystis: From ecotypes to ecosystems. Oceanogr. Mar. Biol. 2007, 45, 39–88. [Google Scholar]
  71. Bourret, A.; Nozères, C.; Parent, E.; Parent, G.J. Maximizing the reliability and the number of species assignments in metabarcoding studies using a curated regional library and a public repository. Metabarcoding Metagenomics 2023, 7, e98539. [Google Scholar] [CrossRef]
  72. Mugnai, F.; Costantini, F.; Chenuil, A.; Leduc, M.; Ortega, J.M.G.; Meglécz, E. Be positive: Customized reference databases and new, local barcodes balance false taxonomic assignments in metabarcoding studies. PeerJ 2023, 11, e14616. [Google Scholar] [CrossRef]
  73. Mugnai, F.; Meglécz, E.; Abbiati, M.; Bavestrello, G.; Bertasi, F.; Bo, M.; Capa, M.; Chenuil, A.; Colangelo, M.A.; De Clerck, O.; et al. Are well-studied marine biodiversity hotspots still blackspots for animal barcoding? Glob. Ecol. Conserv. 2021, 32, e01909. [Google Scholar] [CrossRef]
  74. Meglécz, E. COInr and mkCOInr: Building and customizing a nonredundant barcoding reference database from BOLD and NCBI using a semi-automated pipeline. Mol. Ecol. Resour. 2023, 23, 933–945. [Google Scholar] [CrossRef]
  75. Klunder, L.; van Bleijswijk, J.D.L.; Kleine Schaars, L.; van der Veer, H.W.; Luttikhuizen, P.C.; Bijleveld, A.I. Quantification of marine benthic communities with metabarcoding. Mol. Ecol. Resour. 2022, 22, 1043–1054. [Google Scholar] [CrossRef]
  76. Shaffer, M.R.; Andruszkiewicz Allan, E.; Van Cise, A.M.; Parsons, K.M.; Shelton, A.O.; Kelly, R.P. Observation bias in metabarcoding. Mol. Ecol. Resour. 2025, 25, e14119. [Google Scholar] [CrossRef]
Figure 1. Map of the study area in Vostok Bay. The eDNA sampling site is marked by a green circle. The inset shows the location of Vostok Bay (marked by a red square) along the coastline of the Sea of Japan.
Diversity 18 00120 g001
Figure 2. Taxonomic composition of the Vostok Bay eDNA sample. (a) Distribution of read abundance across major eukaryotic classes, with the corresponding phylum indicated in parentheses. * Phoronida lacks formal class-level subdivisions. Therefore, only the phylum is shown. (b) The 20 most abundant OTUs ranked by read count and colored by phylum.
Diversity 18 00120 g002
Disclaimer/Publisher’s Note: The statements, opinions and data contained in all publications are solely those of the individual author(s) and contributor(s) and not of MDPI and/or the editor(s). MDPI and/or the editor(s) disclaim responsibility for any injury to people or property resulting from any ideas, methods, instructions or products referred to in the content.