Article

Seasonal and Interspecific Variation in Frugivory by a Mixed Resident-Migrant Overwintering Songbird Community

1
Department of Natural Resources Science, University of Rhode Island, Kingston, RI 02881, USA
2
Great Hollow Nature Preserve and Ecological Research Center, New Fairfield, CT 06812, USA
3
Department of Biology, University of Florida, Gainesville, FL 32611, USA
4
Washington Department of Fish and Wildlife, Wildlife Research Division, Olympia, WA 98501, USA
5
U.S Fish & Wildlife Service, National Wildlife Refuge System, Inventory and Monitoring Branch, Athens, GA 30605, USA
6
Population and Community Ecology Cluster, Division of Environmental Biology, National Science Foundation, Alexandria, VA 22314, USA
*
Author to whom correspondence should be addressed.
Diversity 2021, 13(7), 314; https://doi.org/10.3390/d13070314
Submission received: 26 May 2021 / Revised: 6 July 2021 / Accepted: 7 July 2021 / Published: 9 July 2021
(This article belongs to the Collection Stable Isotope Ecology)

Abstract

:
Many temperate passerine bird species switch from diets of mostly invertebrates in the spring and summer to diets that include fruit and seeds in the fall and winter. However, relatively few studies have quantified diet composition or the extent of seasonal shifts during the non-breeding period, particularly among species and across communities with both residents and migrants. We measured carbon and nitrogen stable isotope values in food items (fruits, C3 and C4 seeds, and insects from various trophic levels and plant communities) and in multiple tissues (feathers and plasma/whole blood) from 11 species of songbirds wintering in the southeastern U.S. We combined these diet and tissue values with empirically derived discrimination factors and used concentration-dependent mixing models to quantify seasonal diet shifts. We also validated mixing model results with data from fecal samples. Diets in this bird community, as delineated N and C isotopic space, diverged in the fall and winter relative to the summer as consumption of fruits and seeds increased. Across this songbird community, estimated contributions of fruit to plasma/whole blood increased from 16.2 ± 7.5% in the fall (mean ± SD; range: 4–26%) to 21.7 ± 10.3% (range: 9–37%) in the winter, while contributions of seeds increased from 29.4 ± 2.6% (range: 28–32%) in the fall to 36.6 ± 4.8% (range: 32–42%) in the winter. Fecal data showed qualitatively similar trends to mixing models, but consistently estimated higher contributions of fruit. Our work indicates that fruits and seeds constitute substantial sources of sustenance for non-breeding songbirds, there is considerable separation of resource use among species in the fall and winter, and fecal estimates of contributions to songbird tissues should be interpreted cautiously.

1. Introduction

Animal diets are constrained by the availability of different food items, so many animals seasonally shift their diets as resource availability changes [1,2,3]. Because diet is a key interface between an organism and its environment [4,5], investigating the direction and scope of dietary shifts is often essential for understanding both the influence of the environment on individual condition and the influence of species on ecological communities [6,7,8]. More specifically, understanding diet shifts can help illuminate aspects of physiological function such as immune responses [9] or fat accumulation [10] and also aspects of community structure such as niche partitioning [11] and predation pressure [2]. However, despite the potential value of studying diet shifts, diets have not often been described in both qualitative and quantitative terms for multiple species that compose a bird community.
A relatively well-established example of a highly predictable diet shift is the seasonal transition by many species of passerine birds in temperate regions from invertebrate prey in the spring and summer to alternate resources (e.g., fruits and seeds) in the fall and winter [12,13,14]. This shift is likely driven by reduced biomass of invertebrates during fall and winter and a concurrent increase in availability of fruits and seeds [15,16,17], which are generally conspicuous, energy rich, and easily “captured” [14,18,19]. The most common methods for studying this phenomenon have included both direct and indirect observations of fruit consumption by birds and analysis of the contents of fecal samples. These methods have been used to successfully identify the species of birds that engage in frugivory, the kinds of fruit they consume, and the timing of fruit consumption [13,16,17,20,21]. Thus, prior work has made considerable progress in characterizing networks of bird–plant interactions and other community-level patterns of frugivory involving songbirds.
Methodological constraints have limited the investigation of seasonal frugivory by songbirds in a manner that is both quantitative and readily integrated with organismal biology. For example, whereas the impact of frugivory on fruits is highly visible, direct observations and fecal analysis can only provide information on what is ingested, not what is assimilated by songbirds [7,18]. Moreover, direct observations can be affected by bias in detectability of different food items and effort [20], and fecal analysis is complicated by variation in digestibility, nutrient content, and retention time of food items [22,23,24]. Many of these issues can be addressed through the use of stable isotope diet reconstruction methods, which provide information on both assimilated nutrients and establish a common currency that can be used to calculate relative contributions of food items to consumers (e.g., [19,25,26]). This is particularly the case for studies using Bayesian mixing models, which are able to produce robust estimates of contributions by different food items to animal tissues through the propagation of the underlying uncertainty in various isotopic measurements [27,28]. For example, Gagnon and Hobson [29] were able to document a surprisingly high reliance on fruits by American Redstarts (Setophaga ruticilla) and black-and-white Warblers (Mniotilta varia), and surprisingly low reliance on fruits by American Robins (Turdus migratorius) and Cedar Waxwings (Bombycilla cedrorum) during both spring and fall migration. Meanwhile, Gómez et al. [30] estimated that fruits contributed approximately 14% of the diet of Gray-cheeked Thrushes (Catharus minimus) during spring migration and Ruhl et al. [31] estimated that Rubus fruits contributed 9–13% of the diets of Scarlet Tanagers (Piranga olivacea) during the post-fledgling period. Such quantitative estimates of assimilated diet and seasonal frugivory are still relatively rare, in large part due to the challenge of obtaining high-quality information on potential food sources and diet–tissue discrimination factors [32,33]. Furthermore, few studies document variation in resource use within and among species, despite its known effect on both the structure and stability of ecological communities [34,35] and potential insights into behavioral variation among individuals [36,37,38].
We used measurements of stable isotope (13C and 15N) enrichment of tissues and three types of food resource (arthropods, fruits, and seeds) to estimate resource use by a songbird community composed of eleven resident and migratory species during fall and winter at a site in South Carolina, USA. Our primary objective was to provide estimates of fruit and seed use by this non-breeding bird community, with those estimates made more organismally relevant by focusing on assimilated nutrients and made more robust by providing contemporaneous measurements of the isotope values of potential food items in our study area. These estimates also allowed us to directly compare estimates of diet from the stable isotope mixing models with those from traditional fecal analyses and assess the scope of differences between these methods. As a secondary objective, we characterized changes in the composition and variability of songbird diets between seasons, where changes in resource availability might drive changes in diet. In particular, we expected fruit and seed contributions to increase as insect abundance decreased from summer to fall to winter, and we expected diet variability to increase as resource use diverged across the songbird community over time. Finally, our database of isotope values for a diverse array of prey items may be particularly useful for future estimates of consumer diet composition.

2. Materials and Methods

2.1. Study Site

We worked at the Savannah River National Environmental Research Park, located in Aiken and Barnwell counties, South Carolina, USA (33°18′ N, 81°37′ W). This 780 km2 site occurs in the Sandhill and upper Coastal Plain physiographic provinces. Forested areas cover >80% of the study site and are primarily comprised of managed stands of longleaf (Pinus palustris) and loblolly pine (P. taeda), with riparian forest and large patches of second-growth and hardwoods where fruit is seasonally abundant [39]. Detailed descriptions of the site, its history and management are provided by Kilgo and Blake [40].

2.2. Study Design

We collected feathers, blood, and fecal samples from passerines captured in the fall and winter of 1998 and 1999 and used two methods to evaluate dietary contributions to tissues: (1) a comparison of the isotopic values of tail feathers to those of plasma and blood, and (2) measuring the remains of arthropods, fruits, and seeds in fecal samples collected at the same time as the tissue samples. Flight feathers are grown during a ~3 week interval [41] on the breeding grounds predominantly between late June and early September (hereafter “summer”) for the species included in this study [42,43,44,45,46,47,48,49,50,51,52], although several species extend molt beyond this period and there may be considerable variation among individuals (Figure 1). The isotopic value of feathers reflects an integration of dietary inputs during their growth, after which the tissue is inert [53,54]. In contrast, isotopic values of plasma and whole blood are constantly changing and represent the integration of dietary inputs during the hours-to-days (plasma) or weeks (blood) prior to sampling [19,25,55,56]. Gut passage rates depend on substrate, but fecal samples generally represent consumption no more than several hours prior to sample collection [22,57].
To parameterize our mixing model with isotopic signatures of the resources that birds were consuming locally, we collected arthropods, fruits, and seeds from the same site and at the same time of year as bird captures. We sampled fruit species known to be important to birds at the study site [39]. We collected invertebrates by sweeping vegetation with a net and by visually searching leaves and litter at randomly determined locations within all bird capture sites. We included only those arthropod taxa commonly contributing to the diets of our study species, identified via literature review or that we observed in feces of captured birds. We included only taxa of seeds that we observed birds eating on or near our study site. We did not include seeds found in fruit because the fruit-eating species we captured typically defecate those seeds intact (S. Pearson and D. Levey, pers. obs.).

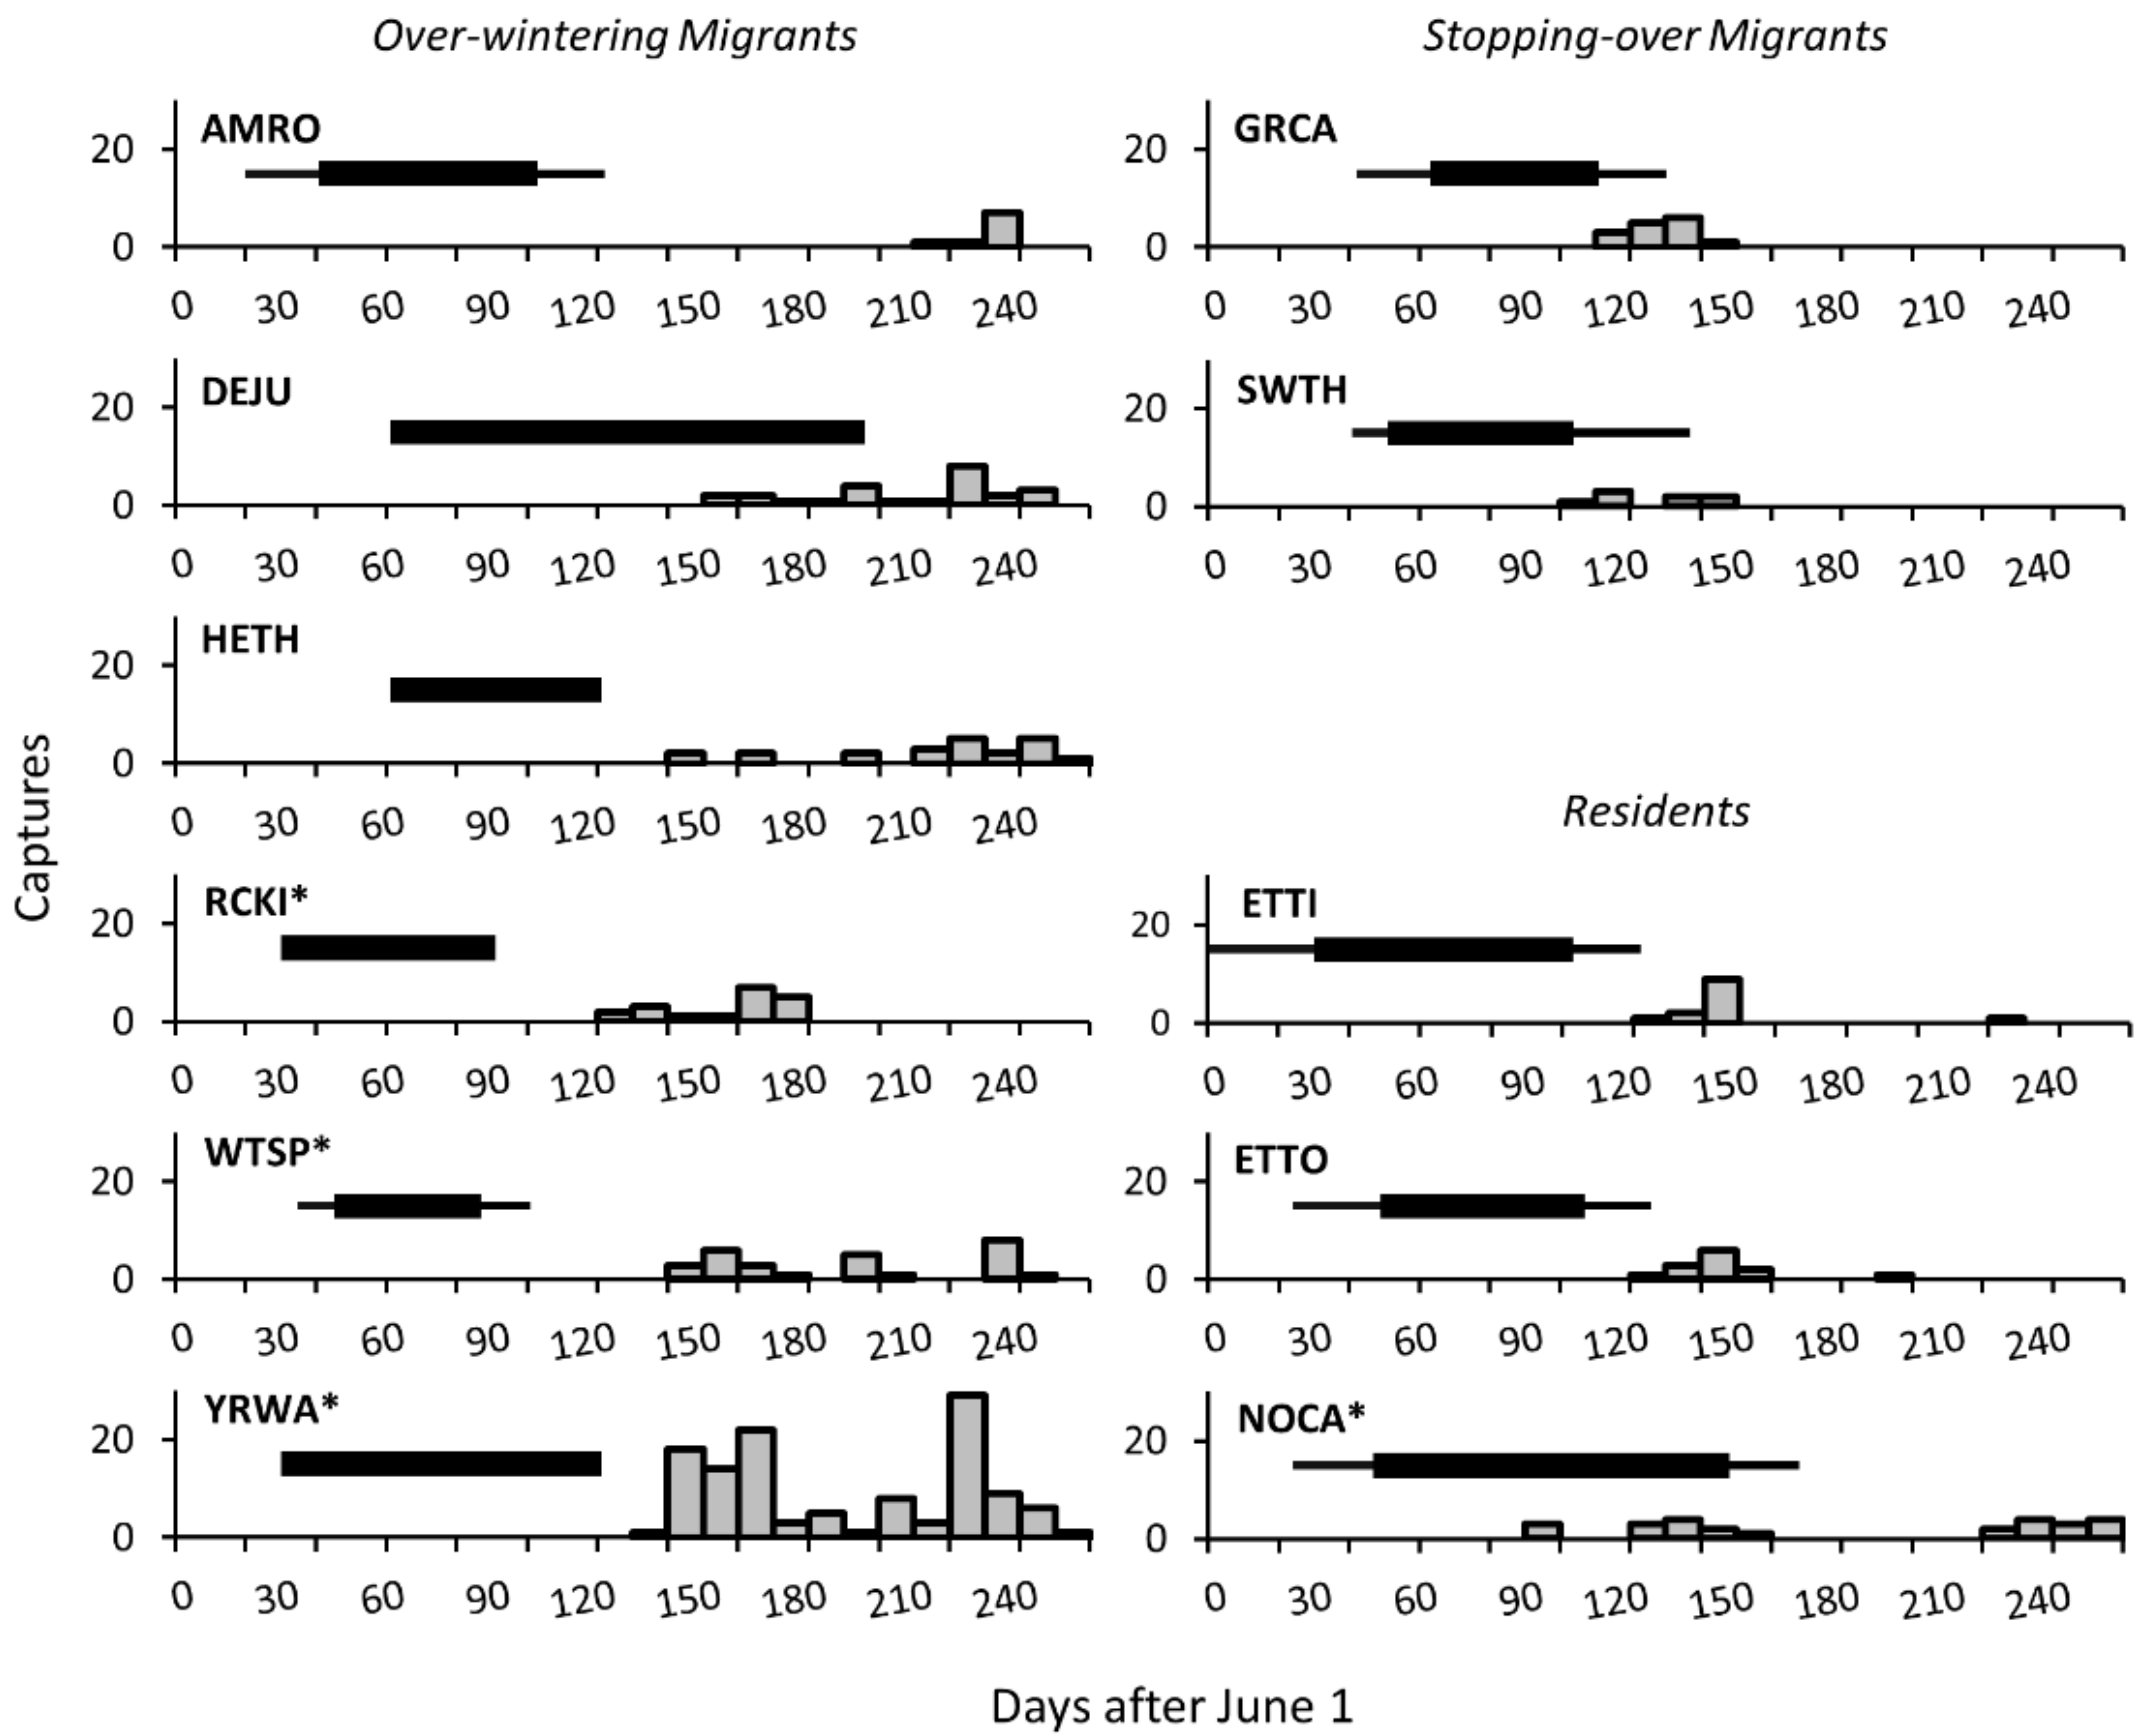
2.3. Defining Fall and Winter

For seasonal comparisons, we used the change-point analysis approach and software developed by Taylor [58] to identify changes between a warmer than average to a colder than average ambient temperature, based on cumulative sum graphs of locally measured daytime high temperatures throughout study periods. For the 1998–1999 study period, the daily high temperature shifted from relatively mild fall conditions (average ± SD high temperature: 26.9 ± 4.6 °C) to cooler winter conditions (17.5 ± 6.4 °C) on 8 December 1998. For the 1999–2000 study period, the transition from fall conditions (27.0 ± 5.8 °C) to winter conditions (14.6 ± 6.1 °C) occurred on 12 November 1999. For subsequent analyses, we use these transition dates to define fall (before 8 December in 1998 and before 12 November in 1999) and winter (on or after 8 December in 1998, and on or after 12 November in 1999).

2.4. Bird Capture and Sample Collection

We captured a total of 653 birds of 47 species in mist nets placed in upland (n = 3) and bottomland (n = 1) areas of second growth and in bottomland hardwood stands (n = 3). Nets were active from 22 September 1998 to 19 February 1999 and from 24 August 1999 to 5 February 2000. Approximately 51% of these captures occurred in upland second growth, 24% in bottomland hardwood stands and 17% in bottomland second growth. Yellow-Rumped Warblers (Setophaga coronata) and Ruby-Crowned Kinglets (Regulus calendula) represented 24% and 15% of captures, respectively. We were able to obtain at least 5 blood samples from the following species, which were therefore included in subsequent analyses: residents = Eastern Towhee (Pipilio erythrophthalmus), Tufted Titmouse (Baeolophus bicolor), and Northern Cardinal (Cardinalis cardinalis); migrants = Gray Catbird (Dumetella carolinensis; rarely nests in the region and is common during migration) and Swainson’s Thrush (Catharus ustulatus); overwintering migrants = American Robin (which nests in the region but not in our study area), Dark-Eyed Junco (Junco hyemalis), Hermit Thrush (Catharus guttatus), Ruby-Crowned Kinglet, White-Throated Sparrow (Zonotrichia albicollis), and Yellow-Rumped Warbler.
Some species showed preferences for different habitats, with the majority of Yellow-Rumped Warblers (91%) and Ruby-Crowned Kinglets (70%) captured in upland second growth habitats and a majority of White-Throated Sparrows captured in bottomland hardwood stands (65%). However, none of our focal species changed habitat types between seasons, meaning that our subsequent analyses comparing seasonal diet shifts are unlikely to be driven by seasonal shifts in habitat use. Migratory movements by individuals have the potential to complicate stable isotope-based diet estimation by introducing the signatures of unmeasured, non-local diet items. However, we do not believe that this strongly influenced our diet estimates for two reasons: (1) for all but one species we used plasma, which has a rapid turnover rate (half-life no more than 24 h [19,25,55,56]); and (2) we found relatively high recapture rates during winter among resident (8–23%) and overwintering migrant (3–25%) species, with some species, such as the Hermit Thrush, known to hold overwintering territories in the region (e.g., [59]). Short turnover times likely result in local diet integration, while local residency implies consistent use of local resources. The one species for which we conducted stable isotope analysis on whole blood (Ruby-Crowned Kinglet, see below) was also a species with a high recapture rate and local winter residency, which may compensate for the integration of diet over a longer time.
Upon capture, birds were immediately placed in clean cloth bags. For all individuals, we plucked a center tail feather and, when possible, collected a blood sample from the brachial vein in a non-heparinized micro-hematocrit capillary tube. For most species, we were able to obtain a relatively large blood sample (~120 μL), which we then centrifuged to obtain the plasma for analysis. However, we were only able to obtain a small volume of blood from Ruby-Crowned Kinglets (~60 μL), and so analyzed samples from that species as whole blood. We transferred blood and plasma samples from capillary tubes to cryovials and stored them at −70 °C until analysis. Tail feathers were stored individually in plastic bags.

2.5. Fecal Analysis

When available, fecal samples were scraped from the inside of the cloth bags that held birds after capture and stored in 90% ethanol. We estimated percentages of fruit, invertebrates and seeds by placing each sample into a Petri dish and separating the sample into a relatively uniform layer of material. We then examined each sample under a dissecting microscope against a 2 × 2 mm grid background to count the number of grid cells obscured by arthropods, fruits, seeds, and other items in 4–5 randomly selected views, from which we derived an estimate of the percent of cells at least partially obscured by each dietary item. We identified many of the arthropod parts to order, following Moorman et al. [60].

2.6. Isotope Sample Preparation and Analysis

Prior to analysis in the winter of 2007/2008, we freeze-dried blood samples and prepared tail feathers by washing them in ether to remove oils [61] and cutting them into small pieces (~1 mm2). Fruit pulp (hereafter “fruit”), arthropods, and seeds were placed in a drying oven at 55 °C for seven days, and then ground into a powder using a mortar and pestle. We then loaded aliquots of samples into tin capsules for isotopic analysis.
The University of California, Davis Stable Isotope Facility performed all isotopic analyses. Samples were combusted in an elemental analyzer coupled to a continuous flow isotope ratio mass spectrometer (ANCA-CFIRMS; Europa Scientific Crewe, England; ANCA combustion unit and 20–20 mass spectrometer). The ratio of C and N stable isotopes in the CO2 and N2 gases produced is expressed in delta (δ) notation: [(Rsample/Rstandard) −1] × 1000, where δ is the isotope ratio of the sample relative to a standard (C = Vienna Peedee Belemnite (VPDB) limestone formation; N = atmospheric N (AIR)). Isotope ratios were derived by comparison of sample with reference gas injections in each analytical cycle. Raw delta values were normalized to international values δ15N AIR and δ13C VPDB using combusted standard samples (ammonium sulfate + sucrose; δ13C = −23.83‰, δ15N = +1.33‰) inserted at intervals in each batch of samples. Masses of C and N in each sample were derived by integrating the ion beam intensities and comparing the integrals to those of standard samples with known concentrations of C and N. Carbon and N mass were converted to percent by dividing the mass of N and C in the sample by the sample’s mass and multiplying by 100.

2.7. Comparing Community-Level Diet Divergence between Summer, Fall, and Winter

We plotted the average tissue location in isotope space (defined by plotting mean δ13C against mean δ15N) to graphically assess the degree of bird community diet divergence in summer, fall and winter. Differences among species within and among seasons in δ13C identify the relative contribution to tissue synthesis from food resources originating from primary producers with different photosynthetic pathways. Higher values indicate greater contributions of C4 pathways and lower values indicate greater contributions of C3 pathways. Differences in δ15N identify the contribution to tissue synthesis from trophically distinct food resources or groups of food resources (e.g., resources from primary producers, low-trophic arthropods, and high-trophic arthropods). Values of δ15N generally increase with trophic level. We compared the dispersion of isotope values by calculating the average distance to the centroid for each season.

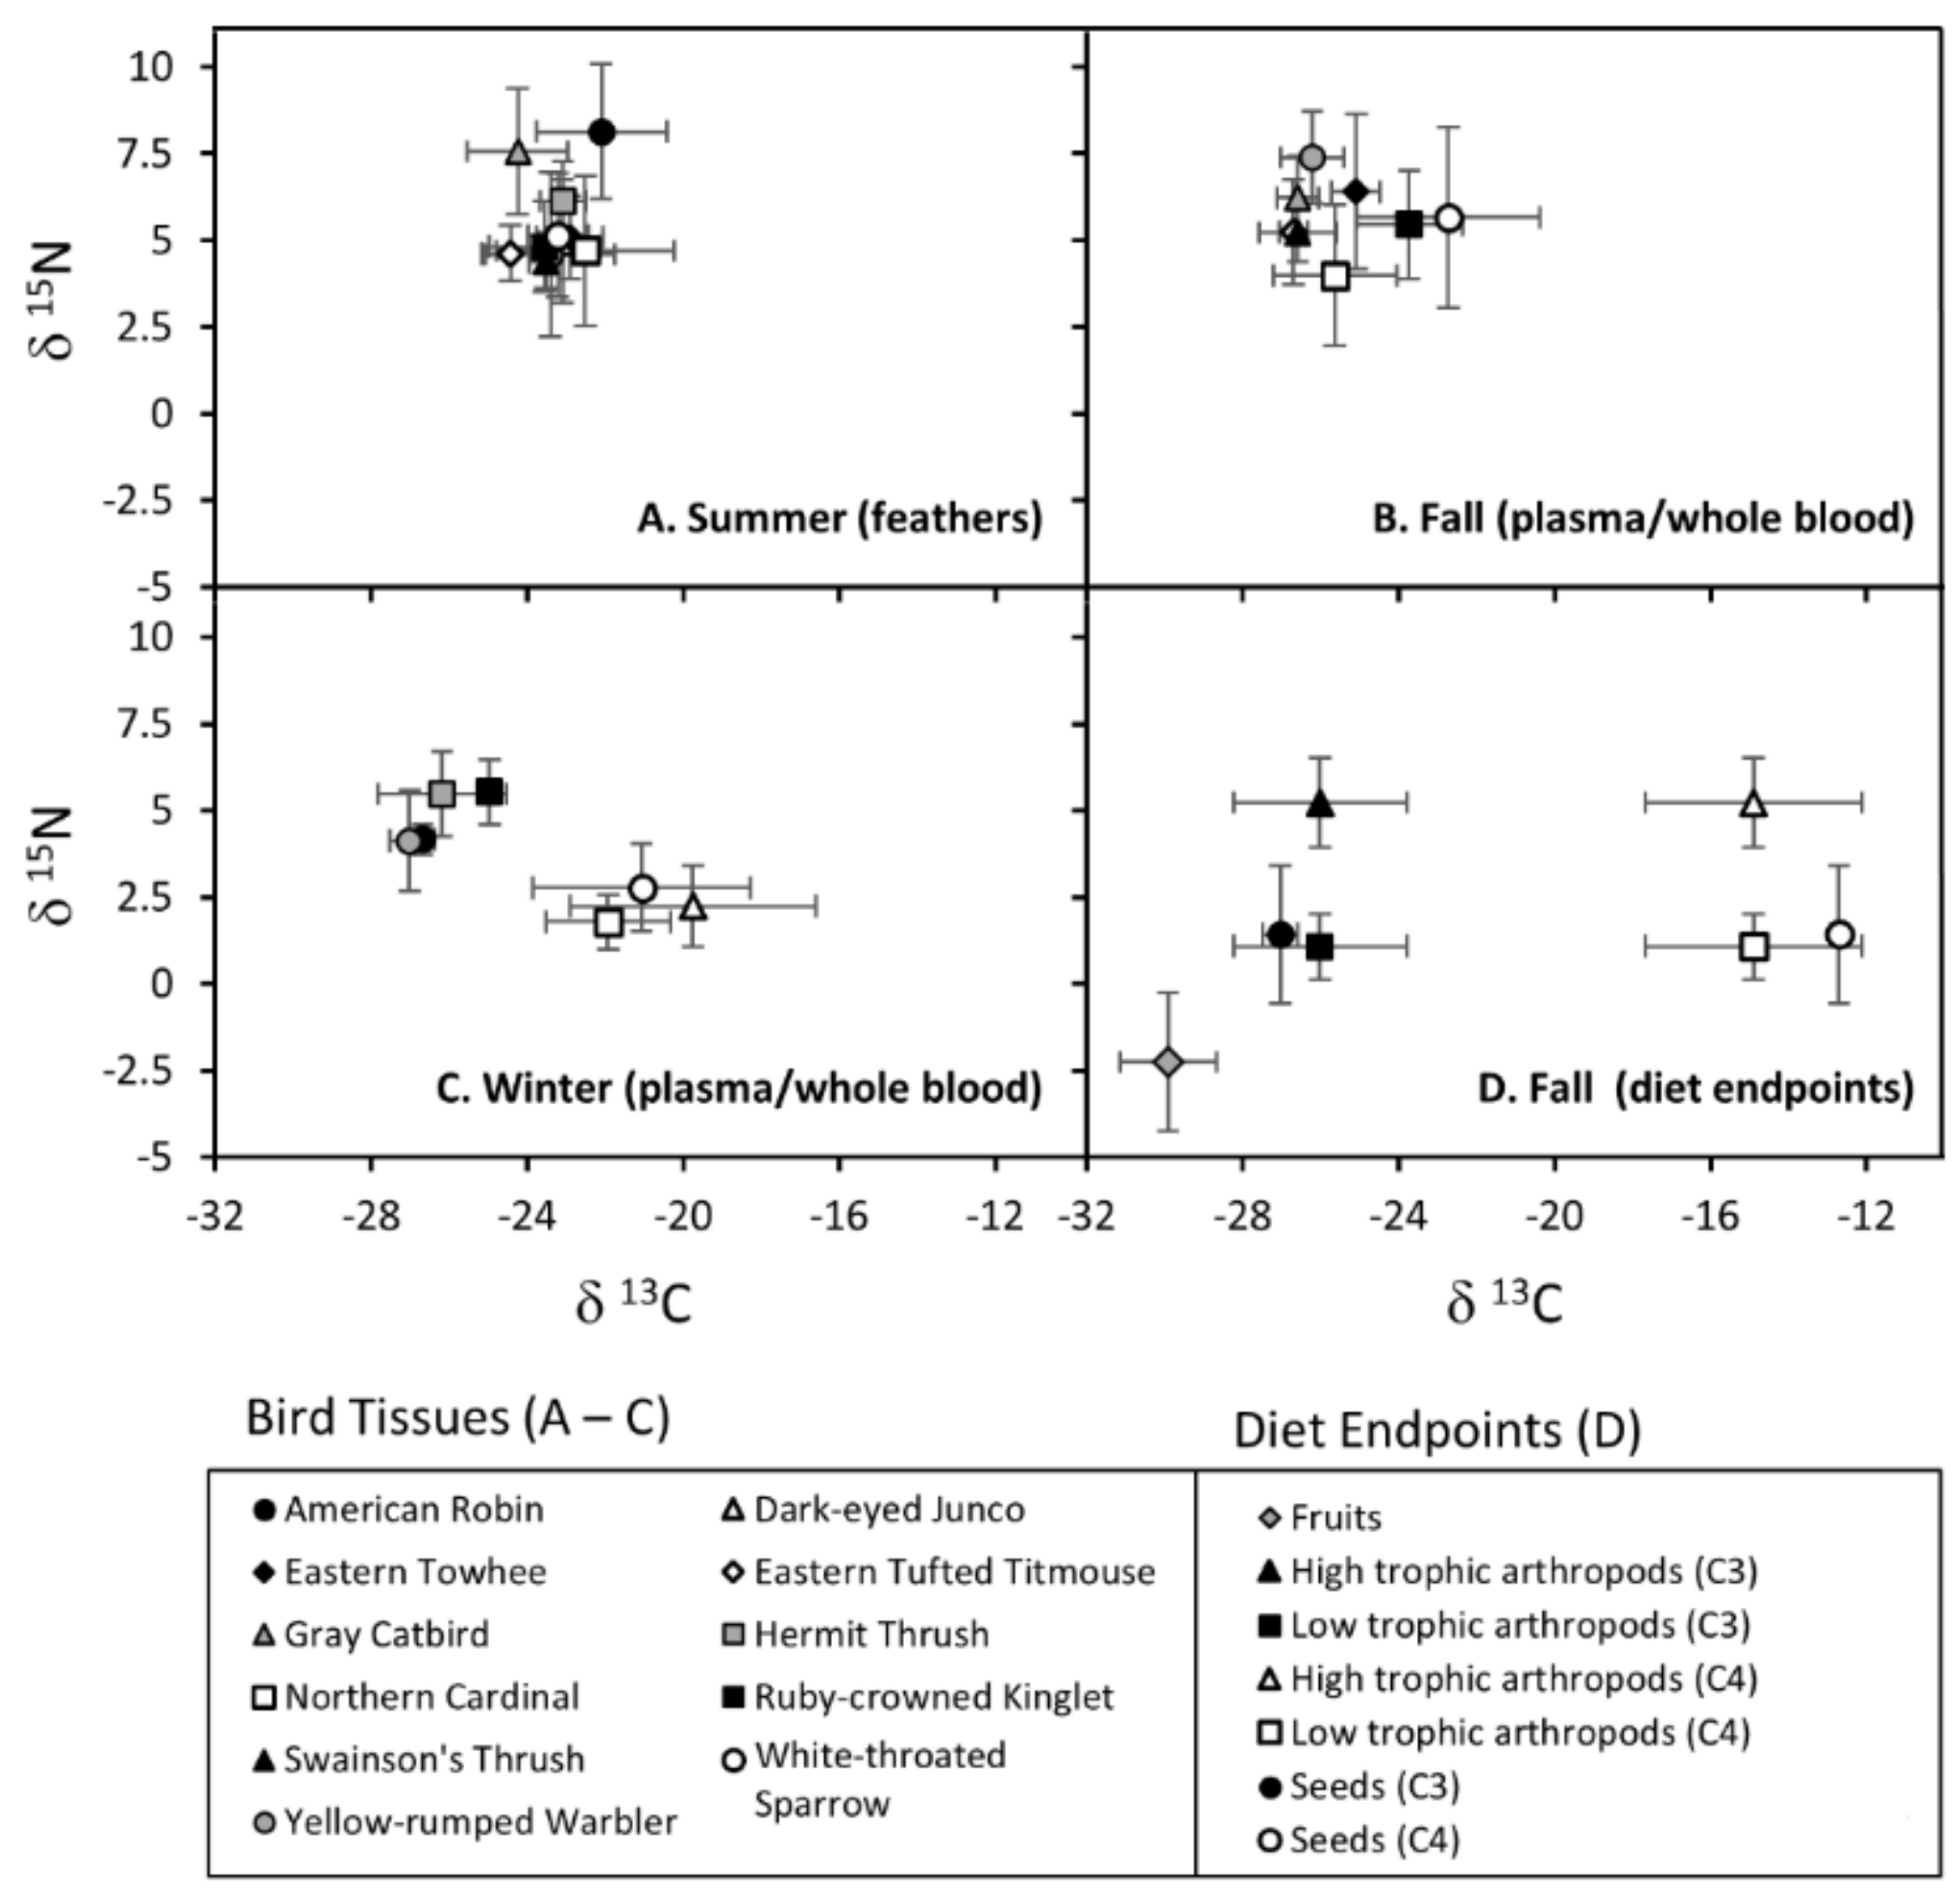
2.8. Potential Foods and Their Isotopic Values

Stable isotope values of potential diet items are archived in the Dryad data repository and available at https://doi.org/10.5061/dryad.xwdbrv1dc. We used the average δ13C and δ15N values for each diet group (i.e., arthropods, fruits, and seeds) as “dietary endpoints” or isotopic signatures of pure diets (e.g., 100% fruit diet). Specifically, we identified seven potential dietary endpoints: (1) all fruits, (2) high-trophic-level arthropods from C313C < −21‰) environments, (3) low-trophic-level arthropods from C313C < −21‰) environments, (4) high-trophic-level arthropods from C413C > −18‰) environments, (5) low-trophic-level arthropods from C413C > −18‰) environments, (6) seeds from C3 plants, and (7) seeds from C4 plants (see footnote in Table S1). We initially considered Myricaceae fruits separately from other fruits, but neither δ15N nor δ13C values differed from those of other fruits (Table S1), and so we combined all fruits into a single endpoint.
To distinguish high-trophic-level arthropods (e.g., spiders) from low-trophic arthropods (e.g., larval lepidoptera), we applied a k-means cluster analysis to the entire arthropod dataset, which identified two groups of arthropods separated at a δ15N of 3%; we classified those above and below this cutoff as high- and low-trophic arthropods, respectively. There was a gap in arthropod δ13C values from −21‰ to −18‰, so we arbitrarily used these values to distinguish between arthropods from C3 and C4 environments. We calculated δ13C values for C3 and C4 arthropods independent of trophic level. Likewise, we calculated δ15N values for high- and low-trophic arthropods independent of C3 or C4 status. For example, low-trophic C4 arthropods were assigned the average δ13C value of all C4 arthropods, regardless of trophic status. This method maximized the use of our arthropod samples and produced more consistent δ13C and δ15N values among dietary endpoints. We used a similar approach to calculate seed δ15N endpoints. Our small sample of C3 seeds resulted in an exceptionally low standard deviation in δ13C values, so we scaled the standard deviation to produce a coefficient of variation equivalent to that in C4 seeds. For fruits and seeds, we weighted by sample size the contribution from a given taxon when calculating average δ15N and δ13C values, but used the uncertainty associated with the overall averages. For arthropods, each sample represented a different taxon (although often within the same order), so we elected to calculate unweighted averages for δ15N and δ13C.

2.9. Assessing Distinctiveness of Dietary Endpoints

Only isotopically distinct diet sources can be distinguished using mixing models. Consequently, we conducted a multivariate analysis of variance (MANOVA; PROC GLM; SAS Version 9.1, SAS Institute, Cary, NC, USA) to determine whether 15N and 13C varied among diet items. The MANOVA indicated that diets differed (see results). We then used Scheffe’s multiple contrasts with follow-up univariate ANOVAs to establish how δ15N and δ13C differed among dietary items. Because PROC GLM cannot accommodate missing data, only diet items with measures of both δ15N and δ13C were used in the MANOVA analysis; we conducted follow-up ANOVAs and pair-wise contrasts in PROC MIXED (SAS Version 9.1, SAS Institute, Cary, NC, USA) using maximum likelihood estimation so that statistical comparisons are based on the full δ15N and δ13C datasets of dietary endpoints (i.e., those used in the mixing model analysis).

2.10. Dietary Discrimination Values

We used experimentally derived results in Pearson et al. [56] to estimate arthropod and fruit diet discrimination values (Δ) relating diet–tissue discrimination values to the elemental concentration of the diet items (Table S2) [56]. These discrimination values are within the range reported by other authors (e.g., [25,61,62]) and avoid potential bias associated with assuming constant values [63]. For plasma and whole blood, we calculated ΔN and ΔC for fruit based on the average N and C concentrations of all fruit samples, and for arthropods based on the average N and C concentrations of all arthropod samples (Table 1). We calculated the uncertainty (standard deviations) associated with ΔN and ΔC by summing in quadrature the standard deviation of tissue-specific regression residuals from the published equations [56] and the standard deviation of discrimination estimates resulting from uncertainty in the elemental concentrations of the dietary endpoints. That is, the change in ΔN or ΔC when using N and C concentrations one standard deviation above or below their average represented the standard deviation of the discrimination value due to uncertainty in elemental concentrations. Similarly, we calculated diet–plasma δ15N and δ13C discrimination values and their uncertainty for the seed endpoint based on the average C and N concentrations of all seed samples (Table 1). Although not used in any mixing models, estimated Δ values for whole blood from the Pearson et al. [56] equations agreed generally with published estimates of discrimination in blood cells of birds on known corn diets [64]. The tissue and diet specific discrimination values used in our mixing models are provided in Table S2.

2.11. Mixing Model Diet Estimation and Comparison of Fall and Winter Resource Use

We used concentration-dependent Bayesian mixing models to estimate the isotopic contributions of fruit, arthropods, and seeds to blood and plasma collected from birds in the fall and winter (sample sizes in Table S3). For this analysis, we used the SIAR program (version 4.2) [65], operated within the R statistical computing environment (version 3.1.2; R development core team, Vienna, Austria).
We related δ15N and δ13C values of plasma (or blood for Ruby-Crowned Kinglets) to δ15N and δ13C values of fruits, arthropods and seed species that plausibly occurred in the diet of each species, using N and C elemental concentrations from each food source and empirically derived discrimination factors from Yellow-Rumped Warblers (see above). The dietary endpoints used in mixing models (see above for numbers) varied among species based primarily on whether their typical diet included fruits or certain seeds: the potential diets of American Robin, Gray Catbird, Hermit Thrush, Ruby-Crowned Kinglet, Swainson’s Thrush, and Yellow-Rumped Warbler included endpoints 1–3; Tufted Titmouse included endpoints 1–3 and 6; Eastern Towhee and Northern Cardinal included endpoints 1–7; and Dark-Eyed Juncos and White-Throated Sparrows included endpoints 2–7. We estimated average contributions of food items to songbird diets at the population level (≥5 individual samples) for each possible combination of species and season. Based on our experience in captive studies using known mixtures of diet items, this approach trades off the ability to estimate individual resource use for less variation and bias in estimates for species. The default settings for uniform priors, burn-in iterations, subsequent iterations, and thinning interval successfully resulted in probability distributions for estimated dietary proportions based on 10,000 iterations.
To estimate the probability that the contribution of a particular dietary endpoint exceeded that of another within or between seasons, we compared the mixing model output on an iteration-by-iteration basis (A. Parnell, pers. comm.). For example, to find the probability that the contribution of fruit in the winter diet of Ruby-Crowned Kinglets exceeded that of fruit in their fall diet, we divided the number of iterations in which the proportion of winter fruit was greater than the proportion of fall fruit (i.e., 8399) by the total number of iterations (i.e., 10,000), which in this case produced a probability of 0.8399. A probability of 0.5 indicates no difference in dietary contributions. Probabilities are symmetrical at approximately 0.5, so that a probability of 0.75 represents the same magnitude of difference as a probability of 0.25. In such a comparison, probabilities above 0.5 indicate support for the one-sided comparisons (e.g., winter fruit > fall fruit) whereas probabilities below 0.5 indicate support in the other direction (e.g., fall fruit > winter fruit). We restricted our quantitative comparisons between seasons to species with at least five samples in each season (Northern Cardinal, Ruby-Crowned Kinglet, White-Throated Sparrow, and Yellow-Rumped Warbler).

3. Results

3.1. Characterizing Dietary Endpoints

Diet items differed from each other in our multivariate comparison for δ15N and δ13C (MANOVA: Wilk’s Lambda = 0.011, F12,78 = 55.97, P < 0.0001), and univariate ANOVAs indicated differences among dietary endpoints in δ15N (ANOVA: F6,76 = 40.18, P < 0.0001) and δ13C (ANOVA: F6,65 = 105.71, P < 0.0001; pairwise contrasts between all dietary endpoints are summarized in Table S1). These isotopically distinct dietary endpoints confirm that mixing models are appropriate for estimating dietary contributions to tissues.

3.2. Seasonal Changes in Diet Dispersion

Feather (i.e., summer) δ15N and δ13C values were relatively clumped compared to more dispersed fall and winter plasma/blood δ15N and δ13C values, when plotted in isotope space (Figure 2). This increased dispersion was largely the result of a clear divergence in δ13C values of plasma/blood among the songbird community, where the range of 13C values increased from 2.3‰ in the summer to 7.6‰ in the winter. The average distance to the centroid was 1.1 ± 0.8 (Mean ± SD) in the summer, 1.6 ± 0.6 in the fall, and 3.0 ± 0.7 in the winter. Specific changes in the winter included increased δ13C values in Dark-Eyed Junco, White-Throated Sparrow, and Northern Cardinal plasma, likely resulting from an increased contribution of C4 dietary items. On average, δ15N values decreased in the fall and winter, suggesting lower trophic contributions to these tissues at that time of year (Figure 2). However, this trend in δ15N was inconsistent among species with, for example, Ruby-Crowned Kinglet blood being relatively stable across time and seasons whereas that for Dark-Eyed Junco, White-Throated Sparrow, and Northern Cardinal plasma decreasing especially in winter (Figure 2).

3.3. Variability and Seasonal Patterns of Resource Use

For birds known to eat at least some fruit, results of the mixing model indicate that median fruit contribution to plasma/blood ranged from 4 to 26% in the fall (mean ± SD: 16.2 ± 7.5%; n = 7 species) and 9–37% in the winter (21.7 ± 10.3%; n = 5 species, Figure 3, Table S4). There was a similar pattern for seed-consuming species, with median seed contributions ranging from 28 to 32% in the fall (29.4 ± 2.6%; n = 3 species) and from 32 to 42% in the winter (36.6 ± 4.8%; n = 3 species, Figure 3, Table S4). Thus, (1) both fruits and seeds constitute substantial proportions of the fall and winter diets of this songbird community and (2) those contributions are generally larger and more variable in the winter than the fall, although this trend is more pronounced for seeds than fruit.
These community-level patterns were mirrored by similar changes in the two overwintering migrants with adequate sample sizes for inter-seasonal comparisons. For both the Yellow-Rumped Warbler and Ruby-Crowned Kinglet, fruit resources contributed more to tissues during the winter than during the fall (Probabilities ≥ 0.77; Table 1). Specifically, median fruit contribution increased from 10.2% in the fall to 36.8% (1998/1999) or 19.2% (1999/2000) in the winter for Yellow-Rumped Warblers and median fruit contribution increased from 4.3% in the fall to 18.2% in the winter for Ruby-Crowned Kinglets (Figure 3, Table S4). Interestingly, this was not the case among resident Northern Cardinals, for whom the median fruit contribution to plasma decreased from 25.8% in the fall to 16.0% in the winter (Table 1, probability = 0.25). However, cardinals did use more C4 seeds in the winter (17.8%) than in the fall (6.0%; Table 1, probability = 0.86). Meanwhile, the one overwintering migrant granivore with sufficient data for inter-seasonal comparisons, the White-Throated Sparrow, showed no difference between the fall and winter in median seed contribution (Table 1, probability = 0.57), but did increase their C4 seed usage from 11.9% in the fall to 17.2% in the winter (Table 1, probability = 0.65).

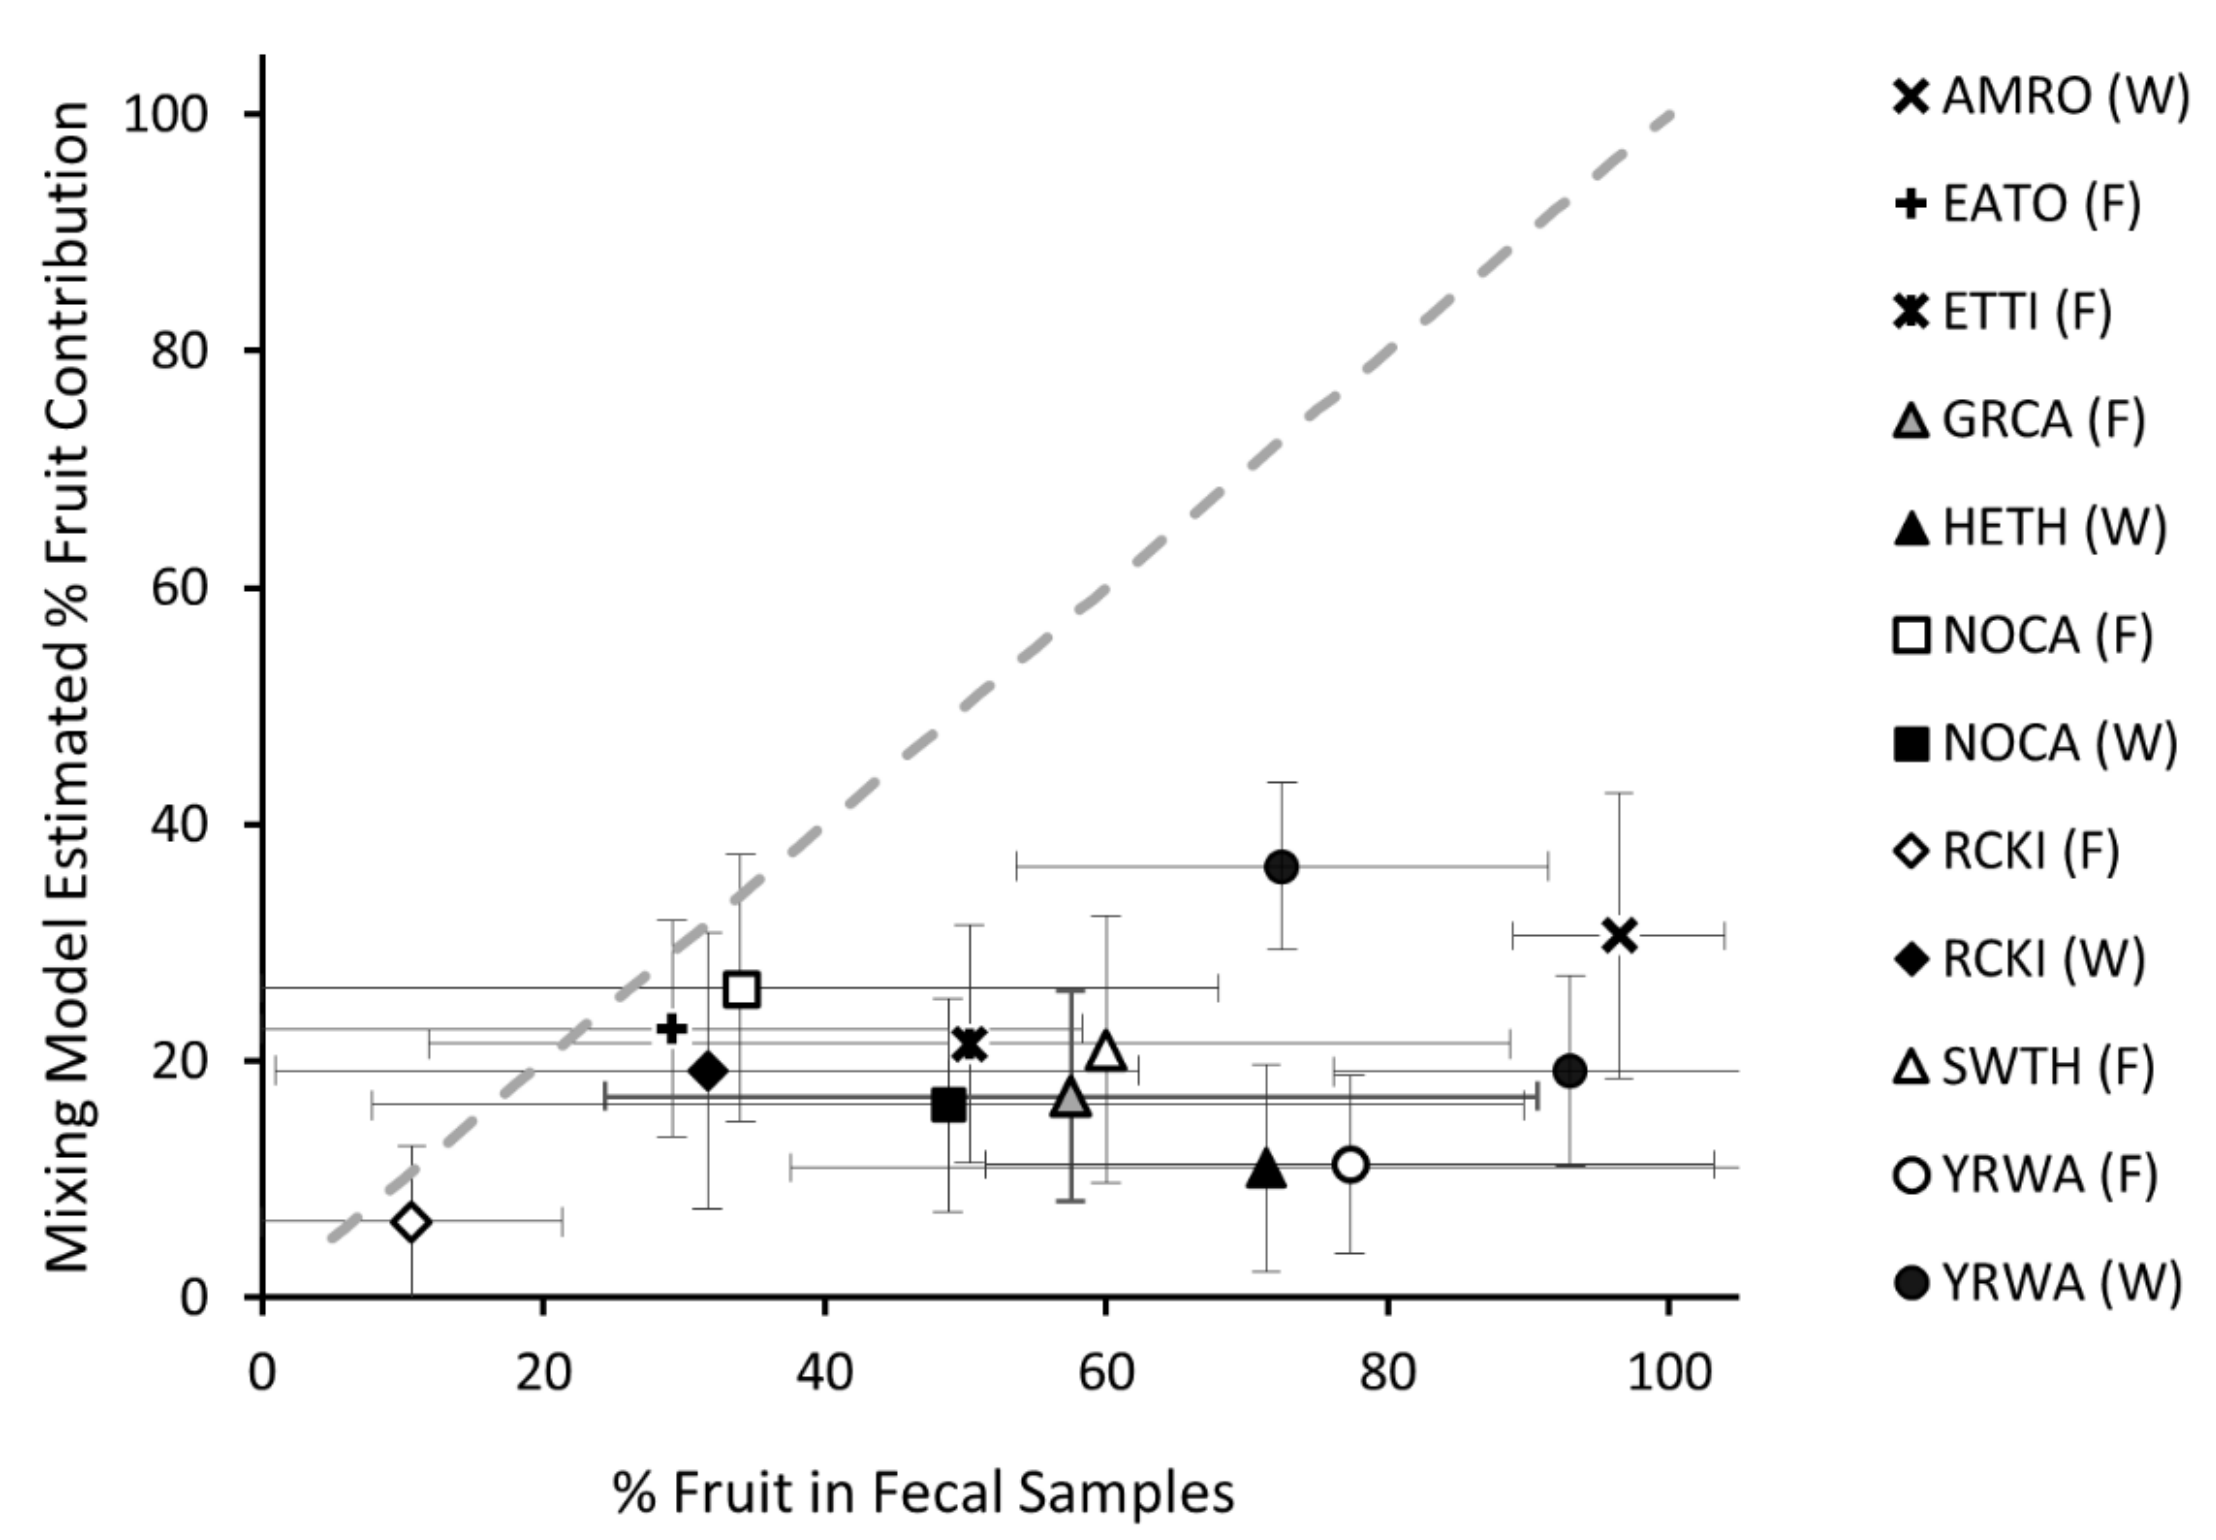
3.4. Comparison of Fecal and Mixing Model Estimates of Songbird Fruit Consumption

Fecal samples from all our focal species except Dark-Eyed Junco and White-Throated Sparrow contained at least some fruit tissue. American Robin, Hermit Thrush, Gray Catbird, and Yellow-Rumped Warbler, all species previously described as being fruit-eaters during the fall and winter months, consistently contained at least 50% fruit pulp and skin in their feces (Figure 3). Fruit was also consistently consumed by Northern Cardinal and Tufted Titmouse (Figure 3), neither of which are noted frugivores. Mixing model estimates of fruit contributions to songbird diets showed a general positive relationship with fecal estimates of fruit consumption, although the average amount of fruit observed in the feces was consistently and substantially greater than mixing model estimates (Figure 4). Moreover, both fecal and mixing model estimates of fruit contributions to songbird diets showed extreme variability regardless of sample size, with between-species coefficients of variation of 62.3% and 53.8%, respectively, and within-species coefficients of variation ranging from 7.8 to 100%. Details on the taxonomic identity of fruits found in songbird fecal samples are provided in the footnote to Table S1.

4. Discussion

4.1. Fruit and Seed Contributions to Assimilated Songbird Diets

Consistent with prior data on fruit production [39], fruit disappearance [66,67], and songbird resource tracking [68,69,70] at our study site, results from our concentration-dependent mixing models indicated that fruit contributed substantially to songbird tissue synthesis during the fall and winter. For fruit-eating species at our site, fruit resources contributed as much as 26% to tissue synthesis in the fall (Northern Cardinal) and 37% in the winter (Yellow-Rumped Warbler). These higher estimates are generally greater than contributions estimated in other studies on related species that used similar stable isotope mixing models. For example, the greatest contribution of fruits among three species in the post-fledging period was only 13% in southern Indiana [31]. Similarly, the median contribution to fruit was only 14% in Gray-cheeked thrushes during spring migration in Colombia [30] and 15–22% in overwintering Wood Thrushes (Hylocichla mustelina) in Belize [71], although the estimated contribution increased to ~35% during spring migration in the latter case. The lower estimates of fruit use by songbirds in these studies may be the result of differences in fruit availability between study sites, as the post-fledging period likely precedes peak fruit abundance in temperate areas and fruit resources are less pulsed in tropical areas [72]. Alternately, differences in nutritional requirements between seasons (e.g., higher energetic requirements during migration and overwintering) may explain the high fruit consumption present in our bird community during winter in a temperate area and high fruit consumption during migration in Belize [71]. However, the most likely explanation for the differences across studies is simply differences between focal species. Such interspecific differences in fruit consumption were readily apparent within our study; although we found large contributions of fruit for most bird species, the minimum estimated contribution was 4% in the fall (Ruby-Crowned Kinglet) and 9% in the winter (Hermit Thrush). This interspecific variation in contribution of fruits may be weak evidence for partitioning of fruit and other food resources among songbirds at our study site. For example, Eastern Towhee and Tufted Titmouse showed similar overall reliance on arthropods and seeds (Figure 3a), but Eastern Towhee showed markedly greater use of resources from C4 plant communities (Figure 3b).
As with fruits, mixing model estimates of songbird reliance on seeds matched our expectations based on prior research, with contributions as high as 32% in the fall (White-Throated Sparrow) and 42% in the winter (Dark-Eyed Junco). There are relatively few studies that have used mixing models to quantify seed use by songbirds, but seed use in our study was comparable to the reliance on tree mast by overwintering Rusty Blackbirds (Euphagus carolinus) in Georgia [73]. The relatively high seed contributions to tissues in our study were similarly comparable to the reliance of overwintering Black-capped Chickadees (Poecile atricapillus) on sunflower seed subsidies in Alaska [74], although, interestingly, the contribution of native seeds in that study was much lower. Overall, seed use appears to be much more consistent across studies and species than fruit use. However, despite this difference, our isotopic reconstructions of diet indicate that both fruits and seeds make substantial contributions to the tissues of individuals in this songbird community.

4.2. Comparing Estimates Derived from Stable Isotope Modeling to Those from Feces

Fecal analysis is a well-established method for analyzing the composition of animal diets and has been used to make estimates of fruit use by songbird populations [15,16]. However, few studies have contrasted fecal estimates of fruit use by songbirds with estimates derived using other methods such as stable isotope analysis. In our study, fecal data independently supported the importance of fruit to birds in the fall and winter. However, fecal data suggested a much greater contribution of fruit to songbird diets than did stable isotope data in all cases (Figure 3 and Figure 4). Overall, fecal data estimated an average fruit contribution that was 214 ± 186% (mean ± SD) greater than values derived from mixing models.
There are several potential explanations for this consistent difference. For one, fecal data may overestimate the occurrence of fruit in the diet because birds were always caught within 2.6 m of the ground and usually in the vicinity of fruit-producing shrubs (e.g., Morella cerifera and Ilex opaca), which were widely scattered throughout our study site. As a result, we likely captured birds when they were near the ground foraging on fruit and not, for example, when in the canopy foraging on arthropods. Thus, considering the short time window of diet represented by fecal samples [22,57], estimates of reliance on fruit from feces may differ from estimates integrated over longer periods, with a bias towards fruit. Alternately, it is well established that songbirds are generally inefficient at digesting and absorbing fruits, particularly in comparison to arthropods [24,75,76], meaning that fruit tissue may be overrepresented in fecal samples. Mixing model estimates of resource use, by contrast, represent the contributions of assimilated nutrients and will therefore more accurately account for the contributions of arthropods that are more thoroughly digested and less apparent in feces. The underrepresentation of arthropods in fecal samples due to more efficient digestion is supported by the difficulty of determining the taxonomic identity of arthropod parts, which were highly fragmented and restricted to limited hard parts (e.g., mandibles, head capsules, elytra). Finally, isotopic routing could result in under- or over-representation of dietary items to tissues because stable isotopes from various macronutrients in the diet may be routed differentially into tissues [62,77]. Specifically, if the carbon from dietary protein (primarily from arthropods) is preferentially routed to songbird plasma and whole blood, then mixing model estimates based on those tissues will tend to exaggerate the contribution of arthropods and undervalue the contributions of fruits. It is important to note that none of these explanations are exclusive—it is entirely possible that all of them contributed to the observed discrepancies between fecal and mixing model estimates of resource use. Considering both the scope of the disparity between these methods and the difficulty of identifying the source of the difference, it is clear that stable isotope mixing model and fecal estimates of diet provide very different results and, due to assimilation and processing differences, are not readily substitutable for one another. Accordingly, the choice of method will depend on the context of the study, and studies focused on organism-level patterns and consequences of frugivory, where assimilated nutrients are particularly important, should ideally use stable isotope analysis and interpret fecal estimates of diet cautiously.

4.3. Seasonal Changes in Diet: The Importance of Fruits and Seeds

Seasonal diet shifts have been documented in species ranging from water snakes [78] to geese [79], with many songbirds in the northern hemisphere exhibiting a seasonal change in fruit consumption in the fall as fruits become more available and arthropods less available [12,13,14]. Seasonal variation in seed consumption by songbirds has not been quantified to the same extent as frugivory, but there is evidence for seasonal changes in seed production and abundance that could drive similar shifts [80,81,82]. Consistent with our expectations for both fruits and seeds, estimated contributions of these resources to songbird tissues were generally higher in the winter than the fall across our focal community. These community-level patterns were mostly mirrored in species for which we were able to make population-level seasonal comparisons: two out of three species used greater proportions of fruits in the winter than fall and both seed-consuming species used greater proportions of seeds in the winter than fall. Thus, our results largely corroborate previous findings about broad-scale temporal patterns of resource use by songbirds.
Our results suggest interesting seasonal trends in the variability of resource use across this songbird community. At the community level (Figure 2), songbird diets showed a marked increase in dispersion in isotope space from the summer to the fall to the winter, a finding supported by the greater range of fruit and seed contributions estimated by mixing models in the winter than the fall. These results indicate that, although this community generally shifted away from a reliance on arthropod resources in the fall and winter, that shift was not consistent in direction or magnitude. Such divergence in diets is consistent with winter food limitation: as food becomes scarcer or as consumer abundance increases, resource use should diverge to reduce the potential for competition [83,84,85]. Our results provide evidence that some of this divergence comes at the level of species (Table 1, Figure 3). For example, both Yellow-Rumped Warbler and Ruby-Crowned Kinglet increased their reliance on fruit in the winter compared to the fall, whereas Northern Cardinal decreased fruit usage in the winter. Meanwhile, both Northern Cardinal and White-Throated Sparrow increased their reliance on C4 seeds in the winter compared to the fall. This partitioning may simply result from species-specific differences in foraging and digestive capabilities [4,18], although it is interesting that frugivory increased in the two overwintering migrants and decreased in the one resident. For migrating birds, food limitation during winter can negatively affect body condition and reduce subsequent breeding success [79,86,87], and so there may be more incentive to take advantage of predictably available fruit resources that minimize foraging time and effort [39,88].
In addition to between-species variation, we also found evidence for within-species variation in diet shifts, as levels of frugivory by Yellow-Rumped Warblers differed between the two winters in which we collected plasma samples. It is possible that this disparity reflects interannual variation in fruit availability, which has been documented at our study site [39,68]. However, variation in resource use at the community and population levels may also be the result of distinct preferences among individuals, which have been observed to vary seasonally in some cases [89,90]. Thus, the high degree of variation in our estimates of diet, as well as variation among years may indicate the influence of individual preferences and possibly resource partitioning among individuals. In either case, our results demonstrate a great deal of flexibility in resource use by our focal songbird community, which add to the complexity of describing seasonal diet shifts.

5. Conclusions

Diet is a key interface between the organism and its environment, and so quantifying diet and dietary shifts can provide valuable insight into animal–environment relationships. Here, we used a stable isotope analysis of tissues and a range of diet items to document a notable reliance on non-arthropod resources by a mixed migrant and resident songbird community during the non-breeding season. Not only do these estimates add to the relatively few studies that quantify the contributions of fruit and seeds to songbird tissues, they also provide a useful step towards identifying critical winter food resources, which has important implications for conservation and management of migratory birds. Furthermore, by characterizing the variability of resource use across this songbird community and in different seasons, our results suggest that there is considerable separation of diet items both between species and within species. Finally, our study demonstrates that, although there may be considerable uncertainty associated with estimates of diet composition, there is a consistent and substantial offset between estimates derived from stable isotope mixing models and those derived from fecal analysis. This finding highlights an important consideration for those wishing to compare historical accounts of songbird diets as well as those designing dietary studies.

Supplementary Materials

The following are available online at https://www.mdpi.com/article/10.3390/d13070314/s1 Table S1: Isotopic and elemental composition of diet items, Table S2: Tissue–diet discrimination factors, Table S3: Sample sizes, Table S4: Estimated feces composition and isotopic contribution to tissues.

Author Contributions

Conceptualization, S.F.P., D.J.L. and S.R.M.; methodology, S.F.P. and D.J.L.; formal analysis, A.D.S. and W.A.C.; resources, S.R.M. and D.J.L.; data curation, S.F.P., A.D.S. and W.A.C.; writing—original draft preparation, W.A.C.; writing—review and editing, W.A.C., S.F.P., A.D.S., S.R.M. and D.J.L.; visualization, A.D.S. and W.A.C.; supervision, S.R.M.; project administration, S.R.M. and D.J.L.; funding acquisition, S.R.M. and D.J.L. All authors have read and agreed to the published version of the manuscript.

Funding

This project was supported by funds (Agreement # USDA Forest Service Southern Research Station 33-CA-99-523) provided by the Department of Energy–Savannah River Operations Office through the Forest Service Savannah River and Forest Service Southern Research Station, Asheville, North Carolina under Interagency Agreement DE-IAS09-76SR00056. A.D.S. was supported by an NSF grant to S.R.M. (IOS) during analysis.

Institutional Review Board Statement

This work was carried out under the approval of the University of Florida Institutional Animal Care and Use Committee (Protocol #Z976; S.F.P. and D.J.L.) and with appropriate banding and collection permits: Master Banding Permit #22913 (S.F.P.), U.S. Fish & Wildlife Service Scientific Collecting permit #MB001980-0 (S.F.P.), and State of South Carolina DNR letter of Authorization, Scientific Collecting (S.F.P.).

Data Availability Statement

A database containing measurements of the stable isotope values of diet items and songbird tissues as well as the composition of fecal samples is archived in the Dryad data repository and available at the following doi: https://doi.org/10.5061/dryad.xwdbrv1dc.

Acknowledgments

We thank Katie Greenberg for her leadership in establishing the project at Savanna River Site that led to this study. We thank John Blake, John Kilgo, and Ed Olson with the U.S. Forest Service for helping with logistics and for creating a friendly research environment. We also thank Kathy Borgmann, Alicia Brinton, and Colette DeGarady for field assistance, Mark Hopey for lab assistance, and Chris Romanek and I. Lehr Brisbin at the Savannah River Ecology Lab for their logistical and lab support. Finally, we thank the two anonymous reviewers for their valuable feedback, which allowed us to substantially improve this paper. All opinions, findings, and conclusions expressed in this material are those of the authors and do not necessarily reflect the views of the National Science Foundation.

Conflicts of Interest

The authors declare no conflict of interest.

References

  1. Renton, K. Lilac-crowned parrot diet and food resource availability: Resource tracking by a parrot seed predator. Condor 2001, 103, 62–69. [Google Scholar] [CrossRef]
  2. Paltridge, R. The diets of cats, foxes and dingoes in relation to prey availability in the Tanami Desert, Northern Territory. Wildl. Res. 2002, 29, 389–403. [Google Scholar] [CrossRef] [Green Version]
  3. Soininen, E.M.; Ravolainen, V.T.; Bråthen, K.A.; Yoccoz, N.G.; Gielly, L.; Ims, R.A. Arctic small rodents have diverse diets and flexible food selection. PLoS ONE 2013, 8, e68128. [Google Scholar] [CrossRef] [PubMed] [Green Version]
  4. Karasov, W.H.; Martínez del Rio, C.; Caviedes-Vidal, E. Ecological physiology of diet and digestive systems. Annu. Rev. Physiol. 2011, 73, 69–93. [Google Scholar] [CrossRef] [Green Version]
  5. Cohen, A.A.; Martin, L.B.; Wingfield, J.C.; McWilliams, S.R.; Dunne, J.A. Physiological regulatory networks: Ecological roles and evolutionary constraints. Trends Ecol. Evol. 2012, 27, 428–435. [Google Scholar] [CrossRef]
  6. Barboza, P.S.; Parker, K.L.; Hume, I.D. (Eds.) Integrative Wildlife Nutrition; Springer: Berlin/Heidelberg, Germany, 2009; ISBN 978-3-540-87884-1. [Google Scholar]
  7. Karasov, W.H.; Martínez del Rio, C. Physiological Ecology; Princeton University Press: Princeton, NJ, USA, 2007; ISBN 9780691213316. [Google Scholar]
  8. Raubenheimer, D.; Simpson, S.J.; Mayntz, D. Nutrition, ecology and nutritional ecology: Toward an integrated framework. Funct. Ecol. 2009, 23, 4–16. [Google Scholar] [CrossRef]
  9. Nwaogu, C.J.; Galema, A.; Cresswell, W.; Dietz, M.W.; Tieleman, B.I. A fruit diet rather than invertebrate diet maintains a robust innate immunity in an omnivorous tropical songbird. J. Anim. Ecol. 2020, 83, 867–883. [Google Scholar] [CrossRef]
  10. Bairlein, F. How to get fat: Nutritional mechanisms of seasonal fat accumulation in migratory songbirds. Naturwissenschaften 2004, 89, 1–10. [Google Scholar] [CrossRef]
  11. Stephens, R.B.; Hobbie, E.A.; Lee, T.D.; Rowe, R.J. Pulsed resource availability changes dietary niche breadth and partitioning between generalist rodent consumers. Ecol. Evol. 2019, 9, 10681–10693. [Google Scholar] [CrossRef] [Green Version]
  12. Bairlein, F. Fruit-Eating in Birds and Its Nutritional Consequences. Biochem. Physiol. 1996, 113, 215–224. [Google Scholar] [CrossRef]
  13. Parrish, J.D. Patterns of frugivory and energetic condition in nearctic landbirds during autumn migration. Condor 1997, 99, 681–697. [Google Scholar] [CrossRef] [Green Version]
  14. Smith, S.B.; McPherson, K.H.; Backer, J.M.; Pierce, B.J.; Podlesak, D.W.; McWilliams, S.R. Fruit quality and consumption by songbirds during autumn migration. Wilson J. Ornithol. 2007, 119, 419–428. [Google Scholar] [CrossRef]
  15. Strong, C.M.; Brown, D.R.; Stouffer, P.C. Frugivory by wintering Hermit Thrush in Louisiana. Southeast. Nat. 2005, 4, 627–638. [Google Scholar] [CrossRef]
  16. Mudrzynski, B.M.; Norment, C.J. Influence of habitat structure and fruit availability on use of a northeastern stopover site by fall songbirds. Wilson J. Ornithol. 2013, 125, 744–754. [Google Scholar] [CrossRef]
  17. Smith, A.D.; McWilliams, S.R. Fruit removal rate depends on neighborhood fruit density, frugivore abundance, and spatial context. Oecologia 2014, 174, 931–942. [Google Scholar] [CrossRef]
  18. Levey, D.J.; Martinez del Rio, C. It takes guts (and more) to eat fruit: Lessons from avian nutritional ecology. Auk 2001, 118, 819–831. [Google Scholar] [CrossRef]
  19. Podlesak, D.W.; McWilliams, S.R.; Hatch, K.A. Stable isotopes in breath, blood, feces and feathers can indicate intra-individual changes in the diet of migratory songbirds. Oecologia 2005, 142, 501–510. [Google Scholar] [CrossRef]
  20. Yoshikawa, T.; Isagi, Y. Dietary breadth of frugivorous birds in relation to their feeding strategies in the lowland forests of central Honshu, Japan. Oikos 2012, 121, 1041–1052. [Google Scholar] [CrossRef]
  21. Plein, M.; Langsfeld, L.; Neuschulz, E.L.; Schulthei, C.; Ingmann, L.; Topfer, T.; Bohning-Gaese, K.; Schleuning, M. Constant properties of plant-frugivore networks despite fluctuations in fruit and bird communities in space and time. Ecology 2013, 94, 1296–1306. [Google Scholar] [CrossRef]
  22. Levey, D.J.; Karasov, W.H. Gut passage of insects by European Starlings and comparison with other species. Auk 1994, 111, 478–481. [Google Scholar] [CrossRef]
  23. Afik, D.; Karasov, W.H. The trade-offs between digestion rate and efficiency in warblers and their ecological implications. Ecology 1995, 76, 2247–2257. [Google Scholar] [CrossRef]
  24. Klasing, K.C. Comparative Avian Nutrition; CAB International: Wallingford, UK, 1998; ISBN 9780851992198. [Google Scholar]
  25. Hobson, K.A.; Bairlein, F. Isotopic fractionation and turnover in captive Garden Warblers (Sylvia borin): Implications for delineating dietary and migratory associations in wild passerines. Can. J. Zool. 2003, 81, 1630–1635. [Google Scholar] [CrossRef]
  26. Ayliffe, L.K.; Cerling, T.E.; Robinson, T.; West, A.G.; Sponheimer, M.; Passey, B.H.; Hammer, J.; Roeder, B.; Dearing, M.D.; Ehleringer, J.R. Turnover of carbon isotopes in tail hair and breath CO 2 of horses fed an isotopically varied diet. Oecologia 2004, 139, 11–22. [Google Scholar] [CrossRef] [PubMed]
  27. Moore, J.W.; Semmens, B.X. Incorporating uncertainty and prior information into stable isotope mixing models. Ecol. Lett. 2008, 11, 470–480. [Google Scholar] [CrossRef] [PubMed]
  28. Phillips, D.L. Converting isotope values to diet composition: The use of mixing models. J. Mammal. 2012, 93, 342–352. [Google Scholar] [CrossRef]
  29. Gagnon, C.; Hobson, K.A. Using stable isotopes to track frugivory in migratory passerines. Can. J. Zool. 2009, 87, 981–992. [Google Scholar] [CrossRef]
  30. Gómez, C.; Larsen, T.; Popp, B.; Hobson, K.A.; Cadena, C.D. Assessing seasonal changes in animal diets with stable—Isotope analysis of amino acids: A migratory boreal songbird switches diet over its annual cycle. Oecologia 2018, 187, 1–13. [Google Scholar] [CrossRef]
  31. Ruhl, P.J.; Flaherty, E.A.; Dunning, J.B. Using stable isotopes of plasma, red blood cells, feces, and feathers to assess mature-forest bird diet during the post-fledging period. Can. J. Zool. 2020, 98, 39–46. [Google Scholar] [CrossRef]
  32. Bond, A.L.; Diamond, A.W. Recent bayesian stable-isotope mixing models are highly sensitive to variation in discrimination factors. Ecol. Appl. 2011, 21, 1017–1023. [Google Scholar] [CrossRef] [Green Version]
  33. Phillips, D.L.; Inger, R.; Bearhop, S.; Jackson, A.L.; Moore, J.W.; Parnell, A.C.; Semmens, B.X.; Ward, E.J. Best practices for use of stable isotope mixing models in food-web studies. Can. J. Zool. 2014, 835, 823–835. [Google Scholar] [CrossRef] [Green Version]
  34. Law, R.; Morton, R.D. Permanence and the assembly of ecological communities. Ecology 1996, 77, 762–775. [Google Scholar] [CrossRef]
  35. Valdovinos, F.S.; Ramos-Jiliberto, R.; Garay-Narváez, L.; Urbani, P.; Dunne, J.A. Consequences of adaptive behaviour for the structure and dynamics of food webs. Ecol. Lett. 2010, 13, 1546–1559. [Google Scholar] [CrossRef] [PubMed]
  36. Semmens, B.X.; Ward, E.J.; Moore, J.W.; Darimont, C.T. Quantifying inter-and intra-population niche variability using hierarchical bayesian stable isotope mixing models. PLoS ONE 2009, 4, 1–9. [Google Scholar] [CrossRef] [PubMed]
  37. Derbridge, J.J.; Krausman, P.R.; Darimont, C.T. Using bayesian stable isotope mixing models to estimate wolf diet in a multi-prey ecosystem. J. Wildl. Manag. 2012, 76, 1277–1289. [Google Scholar] [CrossRef]
  38. Larroque, J.; Ruette, S.; Vandel, J.M.; Devillard, S. Level- and scale-dependent habitat selection for resting sites by 2 syntopic Martes species. J. Mammal. 2017, 98, 1709–1720. [Google Scholar] [CrossRef]
  39. McCarty, J.P.; Levey, D.J.; Greenberg, C.H.; Sargent, S. Spatial and temporal variation in fruit use by wildlife in a forested landscape. For. Ecol. Manag. 2002, 164, 277–291. [Google Scholar] [CrossRef]
  40. Kilgo, J.C.; Blake, J.I. (Eds.) Ecology and Management of a Forested Landscape: Fifty Years on the Savannah River Site; Island Press: Washington, DC, USA, 2005; ISBN 9781597260114. [Google Scholar]
  41. Rohwer, S.; Ricklefs, R.E.; Rohwer, V.G.; Copple, M.M. Allometry of the duration of flight feather molt in birds. PLoS Biol. 2009, 7, e1000132. [Google Scholar] [CrossRef] [Green Version]
  42. Vanderhoff, N.; Pyle, P.; Patten, M.A.; Sallabanks, R.; James, F.C. American Robin (Turdus migratorius). In Birds of the World; Rodewald, P.G., Ed.; Cornell Lab of Ornithology: Ithaca, NY, USA, 2020. [Google Scholar]
  43. Nolan, V., Jr.; Ketterson, E.D.; Cristol, D.A.; Rogers, C.M.; Clotfelter, E.D.; Titus, R.C.; Schoech, S.J.; Snajdr, E. Dark-eyed Junco (Junco hyemalis). In Birds of the World; Poole, A.F., Gill, F.B., Eds.; Cornell Lab of Ornithology: Ithaca, NY, USA, 2020. [Google Scholar]
  44. Greenlaw, J.S. Eastern Towhee (Pipilo erythrophthalmus). In Birds of the World; Rodewald, P.G., Ed.; Cornell Lab of Ornithology: Ithaca, NY, USA, 2020. [Google Scholar]
  45. Ritchison, G.; Grubb, T.C., Jr.; Pravosudov, V.V. Tufted Titmouse (Baeolophus bicolor). In Birds of the World; Rodewald, P.G., Ed.; Cornell Lab of Ornithology: Ithaca, NY, USA, 2020. [Google Scholar]
  46. Smith, R.J.; Hatch, M.I.; Cimprich, D.A.; Moore, F.R. Gray Catbird (Dumetella carolinensis). In Birds of the World; Poole, A.F., Ed.; Cornell Lab of Ornithology: Ithaca, NY, USA, 2020. [Google Scholar]
  47. Dellinger, R.; Wood, P.B.; Jones, P.W.; Donovan, T.M. Hermit Thrush (Catharus guttatus). In Birds of the World; Poole, A.F., Ed.; Cornell Lab of Ornithology: Ithaca, NY, USA, 2020. [Google Scholar]
  48. Halkin, S.L.; Shustack, D.P.; DeVries, M.S.; Jawor, J.M.; Linville, S.U. Northern Cardinal (Cardinalis cardinalis). In Birds of the World; Rodewald, P.G., Keeney, B.K., Eds.; Cornell Lab of Ornithology: Ithaca, NY, USA, 2021. [Google Scholar]
  49. Swanson, D.L.; Ingold, J.L.; Wallace, G.E. Ruby-crowned Kinglet (Regulus calendula). In Birds of the World; Poole, A.F., Ed.; Cornell Lab of Ornithology: Ithaca, NY, USA, 2020. [Google Scholar]
  50. Mack, D.E.; Yong, W. Swainson’s Thrush (Catharus ustulatus). In Birds of the World; Poole, A.F., Gill, F.B., Eds.; Cornell Lab of Ornithology: Ithaca, NY, USA, 2020. [Google Scholar]
  51. Falls, J.B.; Kopachena, J.G. White-throated Sparrow (Zonotrichia albicollis). In Birds of the World; Poole, A.F., Ed.; Cornell Lab of Ornithology: Ithaca, NY, USA, 2020. [Google Scholar]
  52. Hunt, P.D.; Flaspohler, D.J. Yellow-rumped Warbler (Setophaga coronata). In Birds of the World; Rodewald, P.G., Ed.; Cornell Lab of Ornithology: Ithaca, NY, USA, 2020. [Google Scholar]
  53. Hobson, K.A.; Wassenaar, L.I. Linking breeding and wintering grounds of neotropical migrant songbirds using stable hydrogen isotopic analysis of feathers. Oecologia 1997, 109, 142–148. [Google Scholar] [CrossRef]
  54. Graves, G.R.; Romanek, C.S.; Rodriguez Navarro, A. Stable isotope signature of philopatry and dispersal in a migratory songbird. Proc. Natl. Acad. Sci. USA 2002, 99, 8096–8100. [Google Scholar] [CrossRef] [Green Version]
  55. Hobson, K.A.; Clark, R.G. Turnover of 13C in cellular and plasma fractions of blood: Implications for nondestructive sampling in avian dietary studies. Auk 1993, 110, 638–641. [Google Scholar] [CrossRef]
  56. Pearson, S.F.; Levey, D.J.; Greenberg, C.H.; Martínez del Rio, C. Effects of elemental composition on the incorporation of dietary nitrogen and carbon isotopic signatures in an omnivorous songbird. Oecologia 2003, 135, 516–523. [Google Scholar] [CrossRef]
  57. Zurovchak, J.G.; Stiles, E.W.; Place, A.R. Effect of dietary lipid level on lipid passage rate and lipid absorption efficiency in American robins (Turdus migratorius). J. Exp. Zool. 1999, 283, 408–417. [Google Scholar] [CrossRef]
  58. Taylor, W. Change-Point Analyzer Shareware Program version 2.0; Taylor Enterprises: Libertyville, IL, USA, 2000. [Google Scholar]
  59. Brown, D.R.; Stouffer, P.C.; Strong, C.M. Movement and territoriality of wintering hermit thrushes in southeastern Louisiana. Wilson Bull. 2000, 112, 347–353. [Google Scholar] [CrossRef]
  60. Moorman, C.E.; Bowen, L.T.; Kilgo, J.C.; Sorenson, C.E.; Hanula, J.L.; Horn, S.; Ulyshen, M.D. Seasonal diets of insectivorous birds using canopy gaps in a bottomland forest. J. Field Ornithol. 2007, 78, 11–20. [Google Scholar] [CrossRef]
  61. Hobson, K.A.; Clark, R.G. Assessing avian diets using stable isotopes II: Factors influencing diet-tissue frationation. Condor 1992, 94, 189–197. [Google Scholar] [CrossRef]
  62. Podlesak, D.W.; McWilliams, S.R. Metabolic routing of dietary nutrients in birds: Effects of diet quality and macronutrient composition revealed using stable isotopes. Physiol. Biochem. Zool. 2006, 79, 534–549. [Google Scholar] [CrossRef] [PubMed] [Green Version]
  63. Caut, S.; Angulo, E.; Courchamp, F. Caution on isotopic model use for analyses of consumer diet. Can. J. Zool. 2008, 86, 438–445. [Google Scholar] [CrossRef] [Green Version]
  64. Carleton, S.A.; Martínez del Rio, C. The effect of cold-induced increased metabolic rate on the rate of 13C and 15N incorporation in house sparrows (Passer domesticus). Oecologia 2005, 144, 226–232. [Google Scholar] [CrossRef]
  65. Parnell, A.C.; Jackson, A.L. Package “Siar” Version 4.2 2013. pp. 467–504. Available online: http://CRAN.R-project.org/package=siar, (accessed on 1 May 2013).
  66. Greenberg, C.H.; Levey, D.J.; Kwit, C.; Mccarty, J.P.; Pearson, S.F.; Sargent, S.; Kilgo, J. Long-term patterns of fruit production in five forest types of the South Carolina upper coastal plain. J. Wildl. Manag. 2012, 76, 1036–1046. [Google Scholar] [CrossRef]
  67. Kwit, C.; Levey, D.J.; Greenberg, C.H.; Pearson, S.F.; McCarty, J.P.; Sargent, S. Cold temperature increases winter fruit removal rate of a bird-dispersed shrub. Oecologia 2004, 139, 30–34. [Google Scholar] [CrossRef]
  68. Kwit, C.; Levey, D.J.; Greenberg, C.H.; Pearson, S.F.; McCarty, J.P.; Sargent, S.; Mumme, R.L. Fruit abundance and local distribution of wintering Hermit Thrushes (Catharus guttatus) and Yellow-Rumped Warblers (Dendroica coronata) in South Carolina. Auk 2004, 121, 46–57. [Google Scholar] [CrossRef]
  69. Borgmann, K.L.; Pearson, S.F.; Levey, D.J.; Greenberg, C.H. Wintering Yellow-Rumped Warblers (Dendroica Coronata) track manipulated abundance of Myrica Cerifera fruits. Auk 2004, 121, 74–87. [Google Scholar] [CrossRef]
  70. Bechtoldt, C.L.; Stouffer, P.C. Home-range size, response to fire, and habitat preferences of wintering Henslow’s Sparrows. Wilson Bull. 2005, 117, 211–225. [Google Scholar] [CrossRef]
  71. McKinnon, E.A.; Kurt Kyser, T.; Stutchbury, B.J.M. Does the proportion of arthropods versus fruit in the diet influence overwintering condition of an omnivorous songbird? J. Field Ornithol. 2017, 88, 65–79. [Google Scholar] [CrossRef]
  72. Ting, S.; Hartley, S.; Burns, K.C. Global patterns in fruiting seasons. Glob. Ecol. Biogeogr. 2008, 17, 648–657. [Google Scholar] [CrossRef]
  73. Newell Wohner, P.J.; Cooper, R.J.; Greenberg, R.S.; Schweitzer, S.H. Weather affects diet composition of rusty blackbirds wintering in suburban landscapes. J. Wildl. Manag. 2016, 80, 91–100. [Google Scholar] [CrossRef]
  74. Van Hemert, C.; Handel, C.M.; O’Brien, D.M. Stable isotopes identify dietary changes associated with beak deformities in Black-capped Chickadees (Poecile atricapillus). Auk 2012, 129, 460–466. [Google Scholar] [CrossRef]
  75. Castro, G.; Stoyan, N.; Myers, J.P. Assimilation efficiency in birds: A function of taxon or food type? Comp. Biochem. Physiol. Part A Physiol. 1989, 92, 271–278. [Google Scholar] [CrossRef]
  76. Levey, D.J.; Karasov, W.H. Digestive responses of temperate birds switched to fruit or insect diets. Auk 1989, 106, 675–686. [Google Scholar]
  77. Robbins, C.T.; Felicetti, L.A.; Sponheimer, M. The effect of dietary protein quality on nitrogen isotope discrimination in mammals and birds. Oecologia 2005, 144, 534–540. [Google Scholar] [CrossRef]
  78. Willson, J.D.; Winne, C.T.; Pilgrim, M.A.; Romanek, C.S.; Gibbons, J.W. Seasonal variation in terrestrial resource subsidies influences trophic niche width and overlap in two aquatic snake species: A stable isotope approach. Oikos 2010, 119, 1161–1171. [Google Scholar] [CrossRef]
  79. Inger, R.; Harrison, X.A.; Ruxton, G.D.; Newton, J.; Colhoun, K.; Gudmundsson, G.A.; McElwaine, G.; Pickford, M.; Hodgson, D.; Bearhop, S. Carry-over effects reveal reproductive costs in a long-distance migrant. J. Anim. Ecol. 2010, 79, 974–982. [Google Scholar] [CrossRef]
  80. Russi, L.; Cocks, P.S.; Roberts, E.H. Seed bank dynamics in a Mediterranean grassland. J. Appl. Ecol. 1992, 29, 763–771. [Google Scholar] [CrossRef]
  81. Giuliani, A.L.; Kelly, E.F.; Knapp, A.K. Geographic variation in growth and phenology of two dominant central US grasses: Consequences for climate change. J. Plant Ecol. 2014, 7, 211–221. [Google Scholar] [CrossRef] [Green Version]
  82. Crosby, S.C.; Ivens-Duran, M.; Bertness, M.D.; Davey, E.; Deegan, L.A.; Leslie, H.M. Flowering and biomass allocation in U.S. Atlantic coast Spartina alterniflora. Am. J. Bot. 2015, 102, 669–676. [Google Scholar] [CrossRef] [Green Version]
  83. Pimm, S.L.; Rosenzweig, M.L.; Mitchell, W. Competition and food selection: Field tests of a theory. Ecology 1985, 66, 798–807. [Google Scholar] [CrossRef]
  84. Chesson, P. Mechanisms of maintenance of species diversity. Annu. Rev. Ecol. Syst. 2000, 31, 343–366. [Google Scholar] [CrossRef] [Green Version]
  85. Gurd, D.B. Mechanistic analysis of interspecific competition using foraging trade-offs: Implications for duck assemblages. Ecology 2008, 89, 495–505. [Google Scholar] [CrossRef] [PubMed]
  86. Raveling, D.G. The annual cycle of body composition of canada geese with special reference to control of reproduction. Auk 1979, 96, 234–252. [Google Scholar]
  87. Marra, P.P.; Hobson, K.A.; Holmes, R.T. Linking winter and wummer events in a migratory bird by using stable-carbon isotopes. Science 1998, 282, 1884–1886. [Google Scholar] [CrossRef] [Green Version]
  88. Parrish, J.D. Behavioral, energetic, and conservation implications of foraging plasticity during migration. Stud. Avian Biol. 2000, 20, 53–70. [Google Scholar]
  89. Inger, R.; Ruxton, G.D.; Newton, J.; Colhoun, K.; Robinson, J.A.; Jackson, A.L.; Bearhop, S. Temporal and intrapopulation variation in prey choice of wintering geese determined by stable isotope analysis. J. Anim. Ecol. 2006, 75, 1190–1200. [Google Scholar] [CrossRef] [PubMed]
  90. Pires, L.P.; de Melo, C. Individual-resource networks reveal distinct fruit preferences of selective individuals from a generalist population of the Helmeted Manakin. Ibis 2020, 162, 713–722. [Google Scholar] [CrossRef]
Figure 1. The timing of captures and molt for songbird species used in this study. Histograms indicate the numbers of birds from whom tail feathers and/or blood samples were collected over time between June and January. Heavy black bars depict the period in which a majority of individuals for a given species molt their flight feathers, with narrow bars indicating infrequent observations of flight feather molt. Molt data are taken from [42,43,44,45,46,47,48,49,50,51,52]. Species are grouped by life history (overwintering migrant, stopping-over migrant, or resident) and asterisks denote species with sufficient sample sizes for quantitative comparisons between fall and winter diets. Species codes: AMRO = American Robin; DEJU = Dark-Eyed Junco; EATO = Eastern Towhee; ETTI = Tufted Titmouse; GRCA = Gray Catbird; HETH = Hermit Thrush; NOCA = Northern Cardinal; RCKI = Ruby-Crowned Kinglet; and SWTH = Swainson’s Thrush; WTSP = White-Throated Sparrow; and YRWA = Yellow-Rumped Warbler. Sample dates: days 0–29 = June; days 30–60 = July, days 61–91 = August; days 92–121 = September; days 122–152 = October; days 153–182 = November; days 183–213 = December; days 214–244 = January; days 245–250 = February.
Diversity 13 00314 g001
Figure 2. Seasonal community-level patterns in 15N and 13C isotopic space of (A) bird feathers grown during the late summer months and consequently influenced by late summer diet and (B) blood (Ruby-Crowned Kinglet only) and plasma (all other species) collected during the fall and (C) winter months. Note the broad overlap between species in isotopic values from feathers, indicating similar diets among species in summer, and the increasingly divergent values in fall and especially in winter. The dietary endpoint graph (D) is provided as a reference and, when compared to the isotopic values of bird tissues in the winter, suggests that birds increased the use of fruit (lower δ15N values in the winter) and seeds (more positive δ13C values during the winter).
Diversity 13 00314 g002
Figure 3. (A) Estimated percent of fruit in feces and estimated contribution of fruit, arthropods, and seeds to tissues of individual bird species by stable isotope mixing models during the fall (F) and winter (W; W1 and W2 refer to winter 1998/1999 and winter 1999/2000, respectively). (B) A refined breakdown of median resource contributions to tissues of focal songbird species in different seasons as estimated from stable isotope mixing models. This panel includes different patterns to distinguish between C3 and C4 sources and between high- and low-trophic arthropods. Species codes: AMRO = American Robin; DEJU = Dark-Eyed Junco; EATO = Eastern Towhee; ETTI = Tufted Titmouse; GRCA = Gray Catbird; HETH = Hermit Thrush; NOCA = Northern Cardinal; RCKI = Ruby-Crowned Kinglet; SWTH = Swainson’s Thrush; WTSP = White-Throated Sparrow; and YRWA = Yellow-Rumped Warbler.
Diversity 13 00314 g003
Figure 4. The relationship between fecal and mixing model estimates of fruit contributions to songbird diets. Points represent population-level means calculated for a given species and season (F = fall, W = winter), while error bars depict standard deviations. The dashed grey line depicts a 1:1 match between fecal and mixing model estimates and points below the line indicate that fecal estimates are larger than mixing model estimates.Species codes: AMRO = American Robin; DEJU = Dark-Eyed Junco; EATO = Eastern Towhee; ETTI = Tufted Titmouse; GRCA = Gray Catbird; HETH = Hermit Thrush; NOCA = Northern Cardinal; RCKI = Ruby-Crowned Kinglet; and SWTH = Swainson’s Thrush; WTSP = White-Throated Sparrow; and YRWA = Yellow-Rumped Warbler.
Diversity 13 00314 g004
Table 1. Species-specific probabilities that dietary endpoints differ among seasons. Probabilities above 0.5 indicate support for the one-sided comparisons (e.g., winter fruit > fall fruit) whereas probabilities below 0.5 indicate support in the other direction (e.g., fall fruit > winter fruit). Dashes indicate that contributions of those dietary endpoints were not estimated for that species-season combination. Abbreviations: Arth = arthropod; H-C3 = high-trophic C3 arthropods; L-C3 = low-trophic C3 arthropods, etc. Winter samples were pooled across years for all species except the Yellow-Rumped Warbler, for which there was sufficient sample size to estimate the two years separately (winter 1 refers to 1998/1999 and winter 2 refers to 1999/2000).
SpeciesComparisonFruitArthArth
(H-C3)
Arth
(L-C3)
Arth
(H-C4)
Arth
(L-C4)
SeedsSeeds (C3)Seeds (C4)
Northern CardinalWinter > Fall?0.250.600.400.350.550.850.610.340.86
Ruby-Crowned KingletWinter > Fall?0.840.160.490.21-----
Yellow-Rumped WarblerWinter 1 > Fall?0.980.020.001.00-----
Winter 2 > Fall?0.770.230.000.98-----
White-Throated SparrowWinter > Fall?-0.430.280.500.430.660.570.460.65
Publisher’s Note: MDPI stays neutral with regard to jurisdictional claims in published maps and institutional affiliations.

