Article

Are Urban Communities in Successional Stasis? A Case Study on Epiphytic Lichen Communities

1
Comparative Fungal Biology, Department of Comparative Plant and Fungal Biology, Royal Botanic Gardens, Kew, Richmond TW9 3DS, UK
2
Science and Solutions for a Changing Planet DTP, Department of Life Sciences, Imperial College London, South Kensington Campus, London SW7 2AZ, UK
3
Centre for Biodiversity and Environment Research, Department of Genetics, Evolution and Environment, University College London, Darwin Building, Gower Street, London WC1E 6BT, UK
*
Author to whom correspondence should be addressed.
Diversity 2020, 12(9), 330; https://doi.org/10.3390/d12090330
Submission received: 29 June 2020 / Revised: 25 August 2020 / Accepted: 28 August 2020 / Published: 29 August 2020
(This article belongs to the Special Issue Effects of Human Disturbance on Ecological Communities)

Abstract

:
Urban areas may contain a wide range of potential habitats and environmental gradients and, given the many benefits to human health and well-being, there is a growing interest in maximizing their biodiversity potential. However, the ecological patterns and processes in urban areas are poorly understood. Using a widely applicable ecological survey method, we sampled epiphytic lichen communities, important bioindicators of atmospheric pollution, on host Quercus trees in urban parks of London, UK, to test if common patterns relating to lichen diversity are mirrored in urban green spaces. We found lichen diversity to be dependent on host species identity, and negatively related to local tree crowding. In addition, we found a strong negative effect of tree size on lichen diversity, leaving large trees as unexploited niches. A novel network analysis revealed the presence of only pioneer communities, showing the lichen communities are being held in successional stasis, likely due to the heritage effects of SO2 emissions and current nitrogen pollution and particulate emissions. Our study highlights that jointly assessing species richness, community structure and the successional stage can be key to understanding diversity patterns in urban ecosystems. Subsequently, this may help best determine the optimum conditions that will facilitate biodiversity increase within cities.

Graphical Abstract

1. Introduction

Cities contain a diverse range of habitats and environmental gradients within relatively small areas [1]. They also present unique combinations of climatic, hydrological and biogeochemical conditions [1,2]. These factors, added to their proximity to centres of research and academia, make cities a promising study system for testing and developing ecological theories. Despite this, most ecology studies are still focused on non-urban areas. This means that many of the processes affecting urban biodiversity are poorly understood and simply applying results from non-urban systems may not always be appropriate [3].
Some ecological patterns appear to be the same in urban and rural ecosystems. Metapopulation theory, for example, has been effectively applied to both urban and rural systems and shows that factors such as patch connectivity [4], patch density [5] and patch area [6] affect urban metapopulations in the same way as non-urban ones. A test of the species area relationship (SAR) has also shown comparable results for urban and rural bird communities [7]. The same study also revealed similar latitudinal diversity gradients between urban and rural communities [7]. Seasonal shifts in diversity in urban and rural areas have also shown similar patterns when looking at mycorrhizal fungal communities [8]. On the other hand, fewer cases exist of contrasting patterns between urban and rural communities. The intermediate disturbance hypothesis, which predicts that species diversity should be highest in areas of intermediate disturbance, is one example. Research on urban carabid and nematode populations suggests urban communities do not support the intermediate disturbance hypothesis [9,10]. However, many key patterns and processes and taxonomic groups have yet to be investigated so the generality of these results remain unclear. The first step towards comparing these patterns and processes is therefore to thoroughly examine and describe the ecological patterns of urban communities, which may also be critical for improving the biodiversity potential of urban green spaces.
A significant proportion of urban biota associates with trees given their abundance across the urban landscape and the range of niches they provide. Many of these organisms live as epiphytes: organisms that grow commensally on plants without causing damage, and one of the most common epiphyte groups is lichenized fungi. Lichens are obligate mutualistic associations consisting of a fungus (mycobiont), at least one photosynthetic alga or cyanobacteria (photobiont) and potentially numerous other microbial symbionts [11,12], and are an important feature of the biota of urban green spaces [13]. Lichens provide many important ecosystem services in urban green spaces including primary production, nitrogen and carbon fixation [14,15], provision of food and microhabitat for invertebrates [16] and nesting material for passerine birds [17]. They are a species rich group, with approximately 20,000 species globally [18], and are an ideal study system to investigate ecological patterns and processes in urban green spaces.
Unlike plants, lichens do not have a protective outer layer and hence absorb nutrients directly into their thalli from rainwater and the atmosphere [19]. This makes them particularly sensitive to the damaging effects of atmospheric pollution, as pollutants are also readily absorbed. As a result, urban lichen communities tend to be dominated by pollution-tolerant species [20]. The relationship between lichens and atmospheric pollution has been widely researched and many studies have demonstrated the detrimental effects pollution has on lichen diversity [21,22,23,24]. As a consequence, lichens have been considered important bioindicators of atmospheric pollution and have been used globally to assess atmospheric pollution levels in a range of environments (see [23,25,26,27,28] for some recent examples).
London (UK) has been a classic study site for assessing the relationship between lichen diversity and atmospheric pollution [20,29,30,31]. Since the early nineteenth century lichen diversity decreased with the expansion of the city, reaching its lowest in the 1960s when only a single species, Lecanora dispersa (Pers.) Röhl. 1813, could be found in central London [29]. The term ‘lichen desert’ [32] has been used to describe these species-poor lichen areas and in London this situation was mainly caused by extremely high sulphur dioxide levels (SO2) [33]. From 1960 to the 1980s, restrictions on emissions resulted in a 50% drop in national SO2 emissions and inner London levels decreased from 200 to 250 μgm−3 to less than 130 μgm−3 [30]. This was accompanied by a subsequent recolonization of lichen species into the city [30]. Sulphur dioxide concentrations now rarely exceed EU limits [34] but nitrogen pollution in its various forms, including nitrogen oxides (NOx) from vehicle emissions and nitrates (NO3) from agricultural fertilisers, remains high and is what now appears to be affecting current lichen assemblages in London and other cities most strongly [31,35]. London communities in particular are still low in biodiversity and are dominated by pollution-tolerant species such as Xanthoria parietina (L.) Th. Fr. 1860 and Physcia adscendens H. Olivier 1882 [36,37].
The effects of pollution on lichen diversity interact with many other ecological factors and understanding this interaction is key to elucidating patterns in urban lichen communities. For epiphytic lichen communities, one of the most reported factors in predicting diversity at the level of the individual tree is the trunk diameter, often measured as a diameter at breast height (DBH). DBH, which correlates with a number of other factors [38], and it affects lichen diversity partly because larger trees are also older and therefore may have had more time for lichen colonization [39]. However, from a pure ecological point of view a larger DBH implies more surface area for epiphytic lichens and so we can expect higher diversity from the classical species area relationship. Indeed, the predominant relationship of DBH with lichen (alpha) diversity has been positive across a range of study areas and host tree species [38,39,40,41,42,43,44,45,46,47]. However, examples with a unimodal [44,48,49], negative [50,51] and even no relationship at all also exist [28,52,53,54,55], suggesting there may be no universal relationship between lichen diversity and DBH.
Functional categorisation can be a powerful tool in understanding responses to environmental factors. The use of functional traits, such as reproductive strategy, growth form and eutrophication tolerance, is a rapidly growing field of research in lichen ecology [25,26,56]. Individual lichen species can show strong preferences for bark chemistry and are often functionally categorised according to their substrate pH preference [31,57,58] and nitrogen tolerance [59,60]. Despite its widespread use in the literature, Giordani and Malaspina (2016) showed that under eutrophic conditions, bark pH alone did not significantly affect lichen community abundance [28]. This result therefore leads to the possibility that the effect of bark pH may be site-specific or dependent on the type of nitrogen source. Furthermore, bark pH also co-correlates with cation concentration and nitrogen pollution levels, making it difficult to separate the effects of these variables [14,35].
Bark structure and chemistry often differ between tree species [61], and consequently, lichens will preferentially associate with certain host tree species. The diversity of epiphyte communities can therefore be explained and predicted by the diversity of hosts [62,63]. It has actually been suggested that the tree species is of greater importance than bark pH alone in explaining lichen colonization, as a changing pollution climate concomitant with a general increase in bark pH seems to have made many lichen species less sensitive to substrate pH [64] as shown above in Giordani and Malaspina (2016).
The use of functional traits has also uncovered important successional trends that are not apparent when only considering species richness. Functional trait analyses along chronosequences of tree age reveal significant species turnover as trees age/grow, with a general shift from predominantly crust-like (crustose), sexually reproducing communities to leafier (foliose), asexual ones [49,65,66,67]. This community succession can be explained by a combination of allogenic factors, relating to changes in microhabitat conditions as the tree gets older/larger, and autogenic factors such as out-competition of smaller early-stage pioneers by larger, late-stage species [14]. Different successional stages differ in their response to environmental factors. Therefore, investigating community composition and structure as well as species richness may help to explain certain patterns in lichen ecology.
Individual host trees as well as woodland fragments can be seen as potential habitat patches for lichen species, making epiphytic lichens an ideal study system to test metapopulation and metacommunity theory. Connectivity between individual trees and woodland patches could therefore be very important in determining colonisation of trees, which in turn is also dependent on the dispersal abilities of lichen species. Lichen spores and vegetative propagules are very small so we might expect them to be well dispersed by wind, yet various studies have uncovered evidence for dispersal limitation [14,38,68,69,70,71], although most have focused on one or a few lichen species. For example, Buckley (2011) found that whilst tree DBH explained the most variation, lichen diversity was negatively related to distance to a source population of woodland in New Zealand mountain beech trees, indicating lichens are limited in their ability to colonize new substrate, even over distances of less than 1 km. Furthermore, Buckley also found a weak but significant negative effect of local crowding (tree density within 5 m of the host), and this could be caused by crowding leading to shading and a change in the conditions required for some lichen species to colonise, especially early succession species. Hence, epiphytic diversity can be affected by processes occurring at a number of spatial scales, and the tree host spatial ecological context could be important for determining biodiversity patterns.
The complex interaction between the abiotic and biotic factors discussed above makes it difficult to predict which have a significant effect on the diversity of urban epiphytic lichen communities. For this reason, we chose to investigate these factors simultaneously and model how their interaction may affect the diversity of epiphytic lichen communities in London. Specifically, we investigated how tree host species, its geographic location, spatial isolation and size/age, can be used to predict epiphytic lichen diversity in urban green spaces in London. We also looked at how functional trait diversity responds to these factors and whether determining the successional stage of the communities can help to understand the observed trends. We hypothesized that:
  • The history of change in pollution levels in London would mean that older and therefore larger trees may have spanned both high and low atmospheric pollution and that this could alter the tree DBH-lichen diversity relationship.
  • Lichen communities show a shift in functional trait diversity with sexual reproduction and basidophilous substrate pH preference becoming less abundant as tree size increases.

2. Materials and Methods
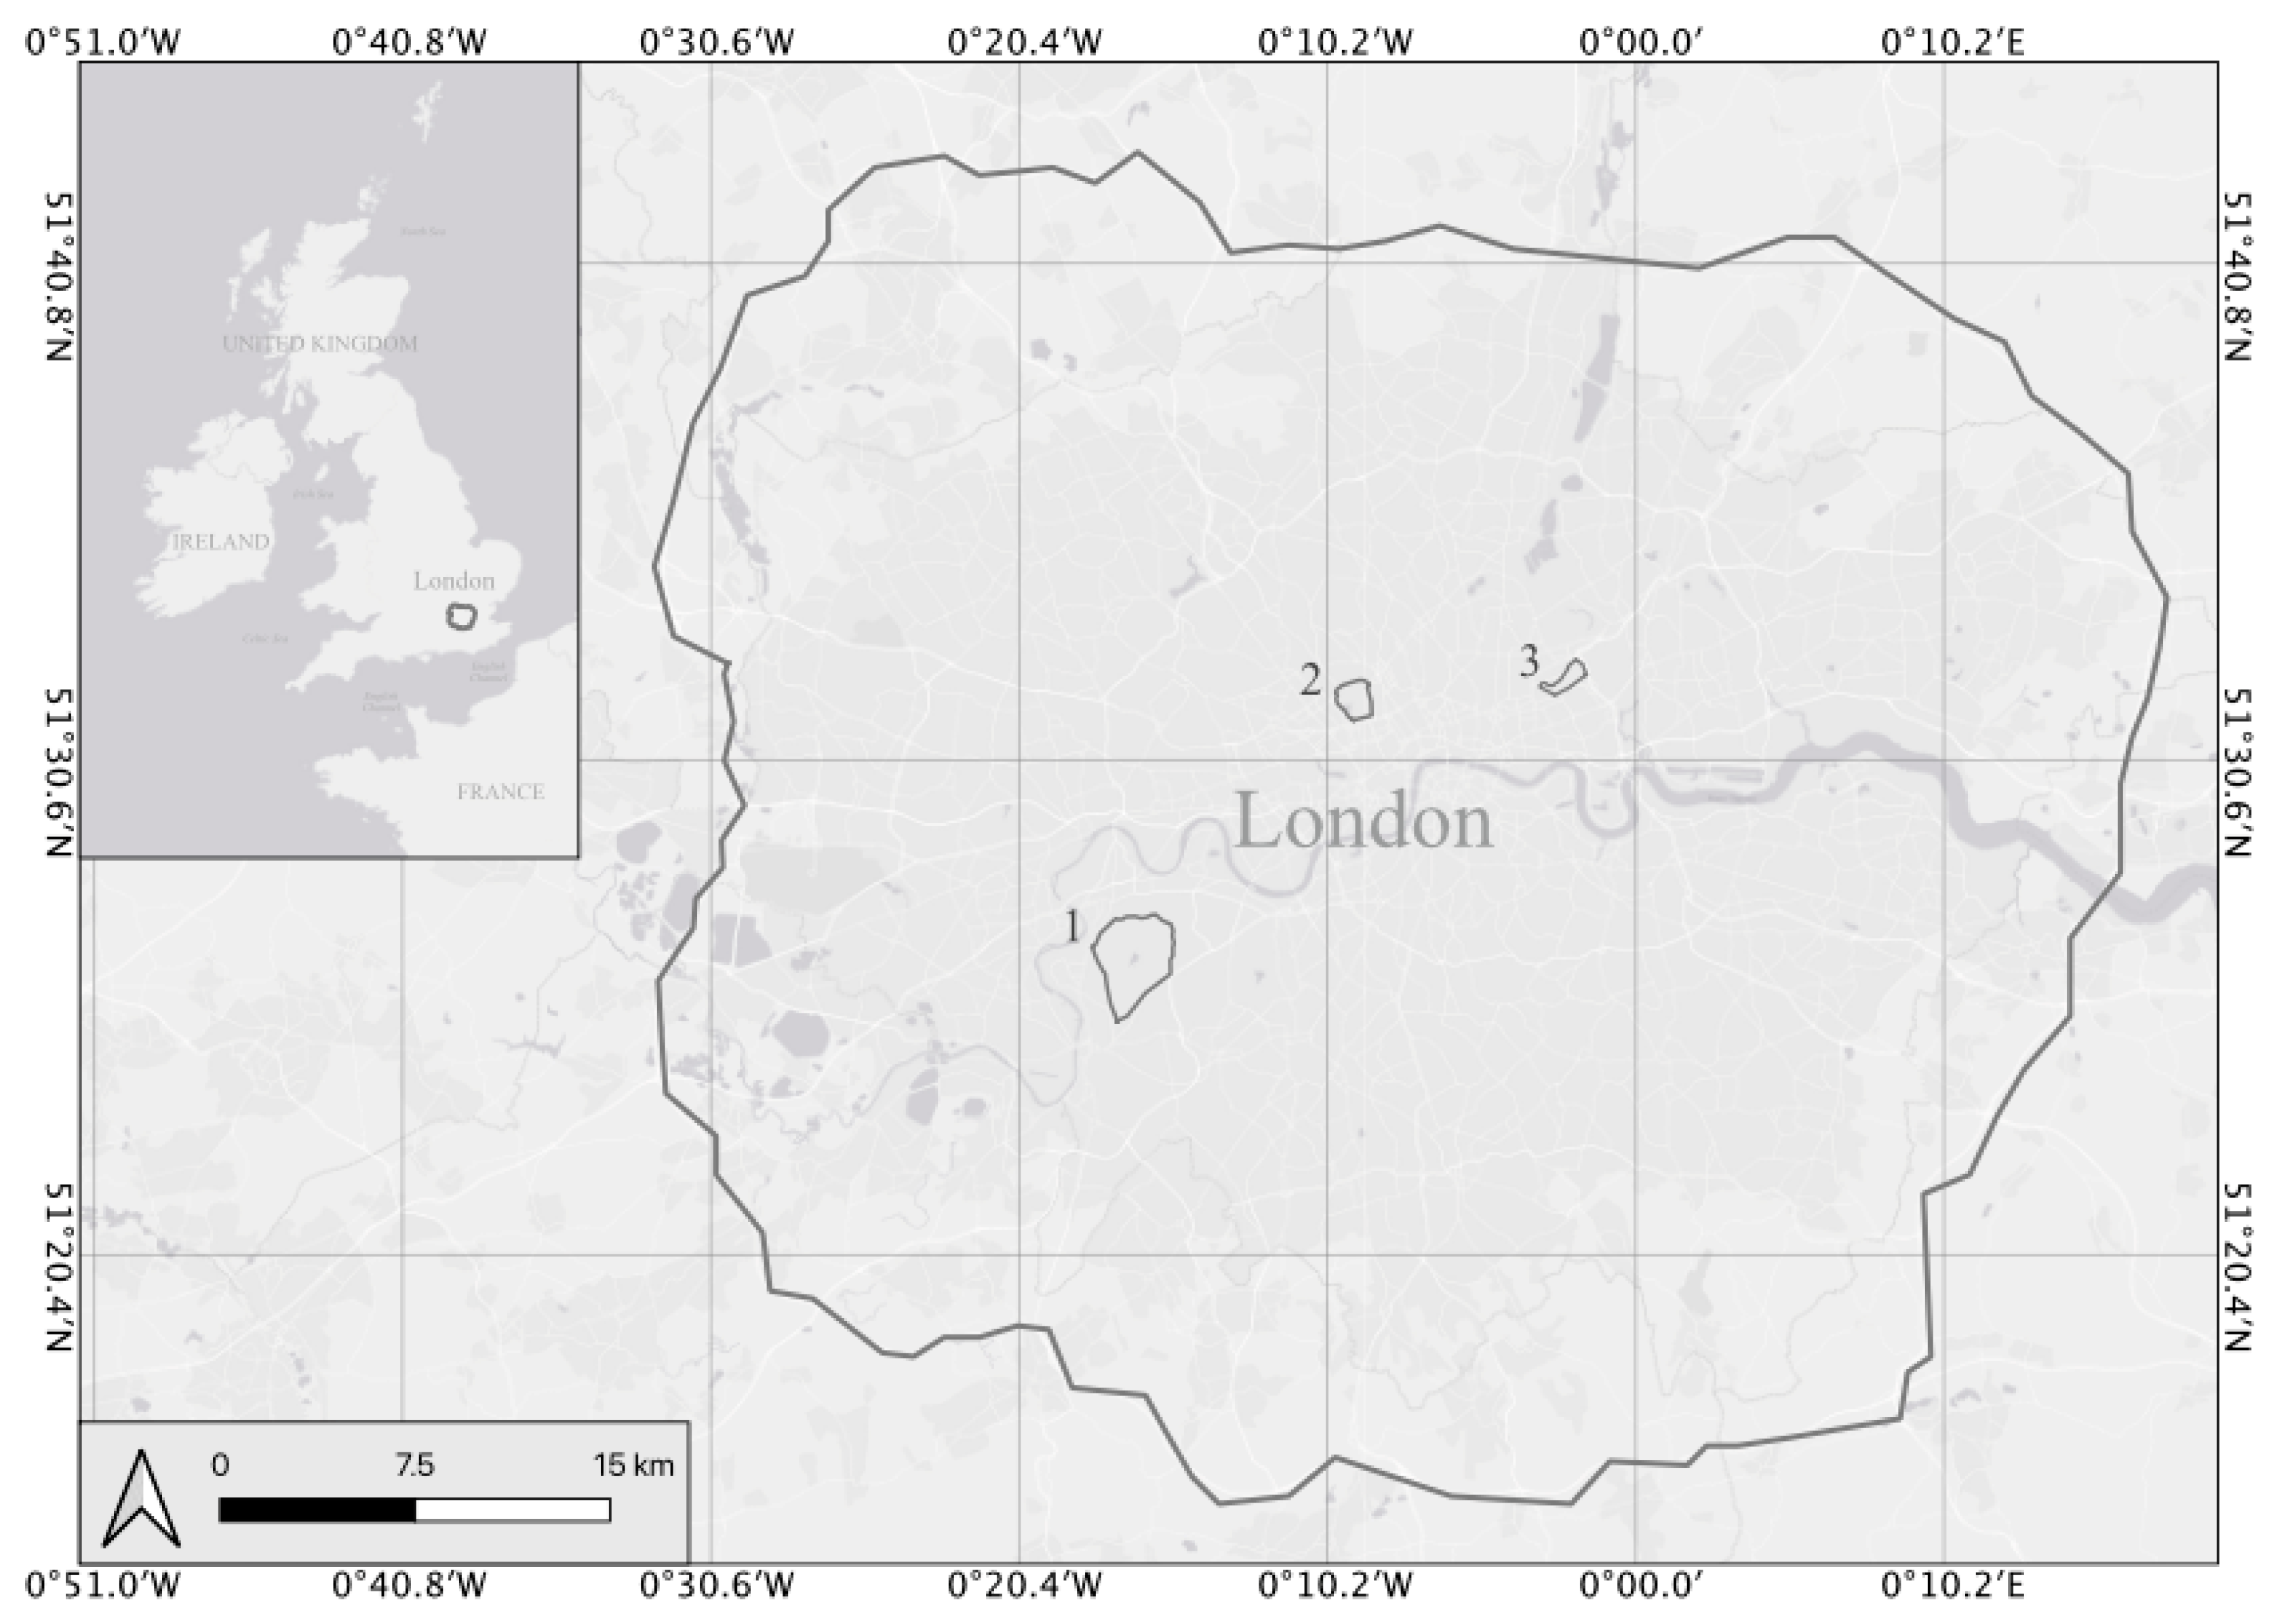
2.1. Survey Sites

We sampled 124 Quercus trees in Richmond Park, Regent’s Park and Victoria Park in Greater London, UK (Figure 1). These parks were chosen to get an approximate west to east transect covering a pollution gradient from lower in the west to higher in the east [72]. All three contained at least 40 Quercus host trees of at least two of the species included in this study (Quercus robur, Q. cerris, Q. rubra and Q. palustris), enabling us to test for interspecific variation of lichen communities within the genus Quercus. We selected trees of various sizes to cover a range of ages and successional stages of epiphytic communities. We georeferenced each tree using an iPhone 6s GPS, which has an approximate mean distance error of 4.19 m [73]. Individual tree locations can be found in Figure S1.

2.2. Host Species

We selected Quercus as the only host genus to reduce the variation in genus-specific traits (e.g., bark properties, nutrient content and moisture retention), and because being a widespread taxon it would facilitate comparison to previous studies and guarantee adequate sample sizes. The bark of Quercus in the UK tends to be slightly acidic, which provides a buffering effect with NH3 and/or NOx pollution, limiting nitrophytic lichens to truly eutrophic sites. High abundances of nitrophytic lichens on oak will hence indicate high concentrations of environmental nitrates [31] and these lichens can therefore be considered reliable bioindicators of urban pollution.
The species Quercus robur, Q. cerris, Q. rubra and Q. palustris were the most abundant in the three parks and all trees met the standardised EU lichen recording criteria: free-standing; over 70 cm in trunk girth; less than 10° inclination from vertical and with no clear signs of disease/stress (for example burls or high Ganoderma coverage) [74]. We avoided trees near highly trafficked roads, where possible, to reduce localised effects of pollution. Q. robur is the only native UK host tree species in this study.

2.3. Sampling Method

We concentrated on lichen communities on the lower boles of trees and did not sample upper boles or twigs. Lichen biodiversity was sampled using the standardised EU lichen recording method; sampling quadrats were attached on the north, south, east and west faces of the tree at 1.5 m above ground level and the abundance of all lichen species within the quadrats was recorded (see [74] for full details of protocol). We measured the tree circumference at 1.5 m to give an estimation of tree age and size, and tree isolation was quantified via a number of proxies: (1) the distance to the nearest tree, (2) distance to the nearest Quercus and (3) the number of trees within a 10 m radius. We also estimated bark rugosity by separating bark structure into five classes following the quantitative scale of Öckinger 2005 [69].
We identified lichen species predominantly in the field using a 10× hand lens and C and K chemical spot tests following Dobson (2011) and the online key ‘A key to common lichens on trees in England’ [75,76]. Field identifications were confirmed in the lab using a Leica MZ6 dissecting scope (Leica, Wetzlar, Germany) and a Zeiss Primo Star confocal microscope (ZEISS, Oberkochen, Germany) to observe and measure spores and microscopic characters.

2.4. Statistical Analysis

We produced rarefaction curves (Figure S2) using the ‘vegan’ package v.2.4-5 implemented in R v.3.6.2 [77] to make sure sampling intensity was sufficient. A lichen diversity value (LDV) was quantified for each tree by calculating the mean abundance (number of 10 cm × 10 cm quadrats occupied) across all lichen species at each cardinal point individually and then summating the four means (N, S, E and W) to get a single LDV per tree [74].

2.4.1. Generalized Linear Modeling

We used a generalized linear model (GLM) to test the effects of the environmental variables measured on lichen diversity (LDV), using a gamma distribution with a log link function. Gamma was used as LDV is a continuous variable bound at zero. The explanatory environmental variables used were tree circumference (continuous), host tree species (categorical with four levels), park (categorical with three levels), bark rugosity (categorical with five levels), distance to nearest tree (continuous), distance to nearest Quercus (continuous) and number of trees within 10 m (count data). We used the following interaction terms: host tree species × circumference, host tree species × bark rugosity and circumference × bark rugosity. Interaction terms were only included for those variables that could be clearly linked with a biological explanation; for example, we may expect the relationship between lichen biodiversity and tree circumference to differ depending on tree species. The GLM was implemented in R using the base function ‘glm’ [77]. We added a value of one to the response variable LDV as the glm function does not accept zero-values with a gamma distribution.
We used a top-down model selection approach, beginning with the full model, using partial F-tests to assess the significance of variables and interactions terms, removing non-significant variables in a stepwise fashion and testing the model again until we reached our minimum best-fitting model. Factor levels for categorical explanatory variables showing significant effects on LDV were collapsed into a single level if t-tests showed no significant difference between those factor levels. An ANOVA comparing the collapsed factor-level model and the non-collapsed model tested whether collapsing factor levels significantly affected the model. Residual vs. fitted plots and Q–Q plots accompanied each model to test for homoscedasticity and normality of errors. Generalized variance inflation factors were calculated to test for collinearity of variables.
For functional trait analysis, we assigned functional groups to each species for two traits, reproductive strategy (sexual vs. asexual-sorediate) and substrate pH preference (acidophilous vs. basidophilous). These were assigned according to [56,60] (see Table S1 for functional groups information). Non-binary functional traits were not included to simplify analyses. We then calculated the community weighted mean (CWM) of each functional group on each tree by weighting the functional group by the abundance of species belonging to that group [78]. This was computed using the ‘dbFD’ function in the FD package v.1.0-12 [79] in R. GLMs were repeated as with the LDV but using the CWM of each functional group as the output variable. A binomial distribution was used as the CWMs are proportions between zero and one. For binary functional traits (acidophilous vs. basidophilous and sexual vs. asexual-sorediate), we only produced models for one of the groups (acidophilous and sexual), as the CWM of the two groups of the trait is complementary, adding up to one.

2.4.2. Species Co-Occurrence and Community Detection

Finally, we assessed community structure using paired species co-occurrence probabilities, which can be used to detect species interactions and/or shared habitat preferences. Co-occurrences assessed whether lichen species were significantly positively, negatively or randomly associated with each other. We converted the abundance data into presence–absence to conduct co-occurrence analyses. Co-occurrence probabilities were calculated using the probabilistic model of Veech (2013) via the ‘cooccur’ package v.1.3 in R [80,81] with the threshold argument set to ‘TRUE’ to remove any species pairs expected to occur at less than one site. We used a 2.5% significance level for the p-values as the test is two-tailed (species can be positively or negatively co-occurring). We then used the effect sizes matrix produced by ‘cooccur’ for community detection using K-means clustering. The standardised effect size calculated by cooccur ranges from −1 to 1, where increasingly negative values indicate stronger negative co-occurrences and increasingly positive values indicate stronger positive co-occurrences. However, K-means clustering requires distance measures that must be positive. Therefore, effect sizes, Eij, for each lichen pair (i and j) were converted into a distance dij using the relationship dij = (1 − Eij), so that positively co-occurring species pairs had low distance scores and negatively co-occurring species pairs had high distance scores. Species that showed no significant positive or negative associations from the cooccur analysis were removed from the distance matrix prior to running the clustering analysis. The data was partitioned into k = 2 clusters using ‘partitioning around medoid (pam)’ clustering using the pam function of the R package ‘cluster’ [82].
Raw data and computer code for all statistical analyses in R are available in Supplementary Materials.

3. Results

Overall, we identified 24 lichen species on Quercus trees across the three parks. The abundance for all species and grouped abundance of Physcia spp. is shown in Figure 2. Abundances of Physcia species were grouped as the thalli of most Physcia individuals (most likely P. adscendens and P. tenella) were immature and lacked the characters needed for species-level identification. All species have been previously recorded in London [36]. Table S1 gives the full list of species with assigned functional groups. The highest individual tree LDV was 3.708 and the lowest was zero. The mean LDV across all individual host trees was 1.239 with a standard deviation of 0.850.

3.1. Generalized Linear Modeling

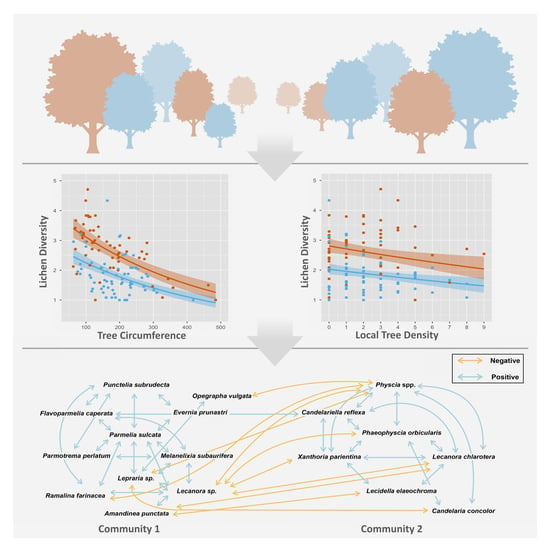
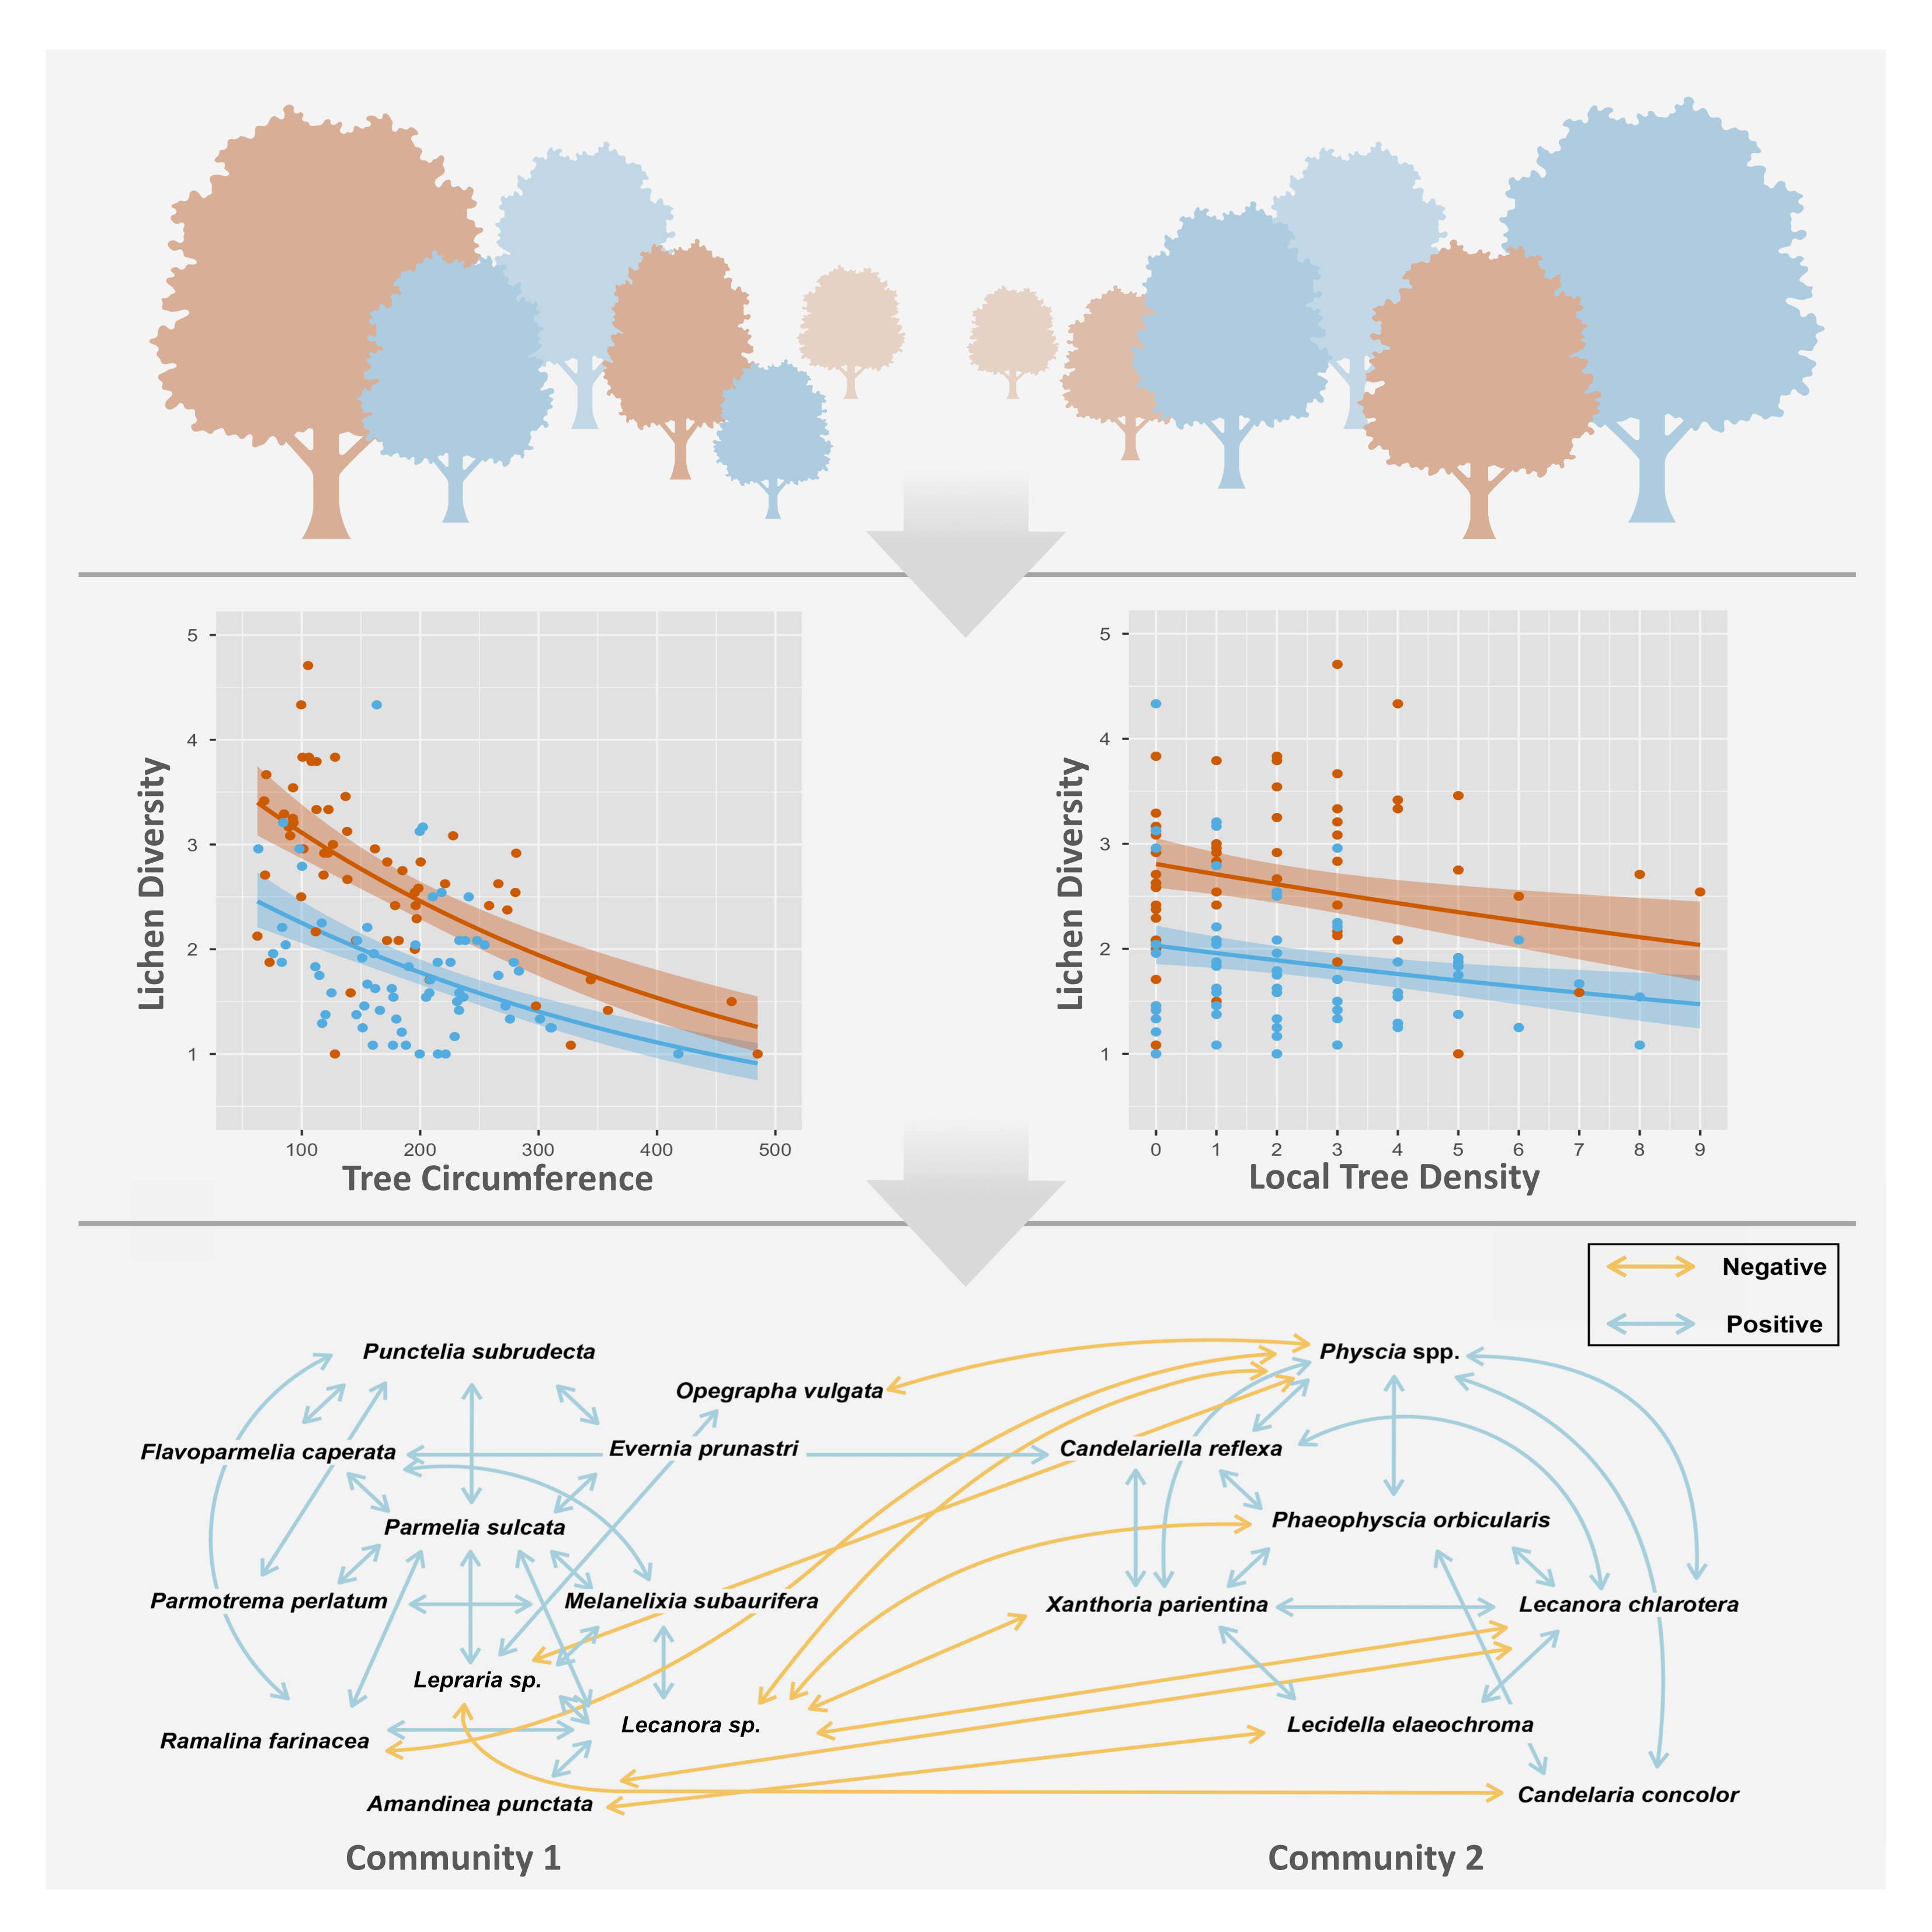
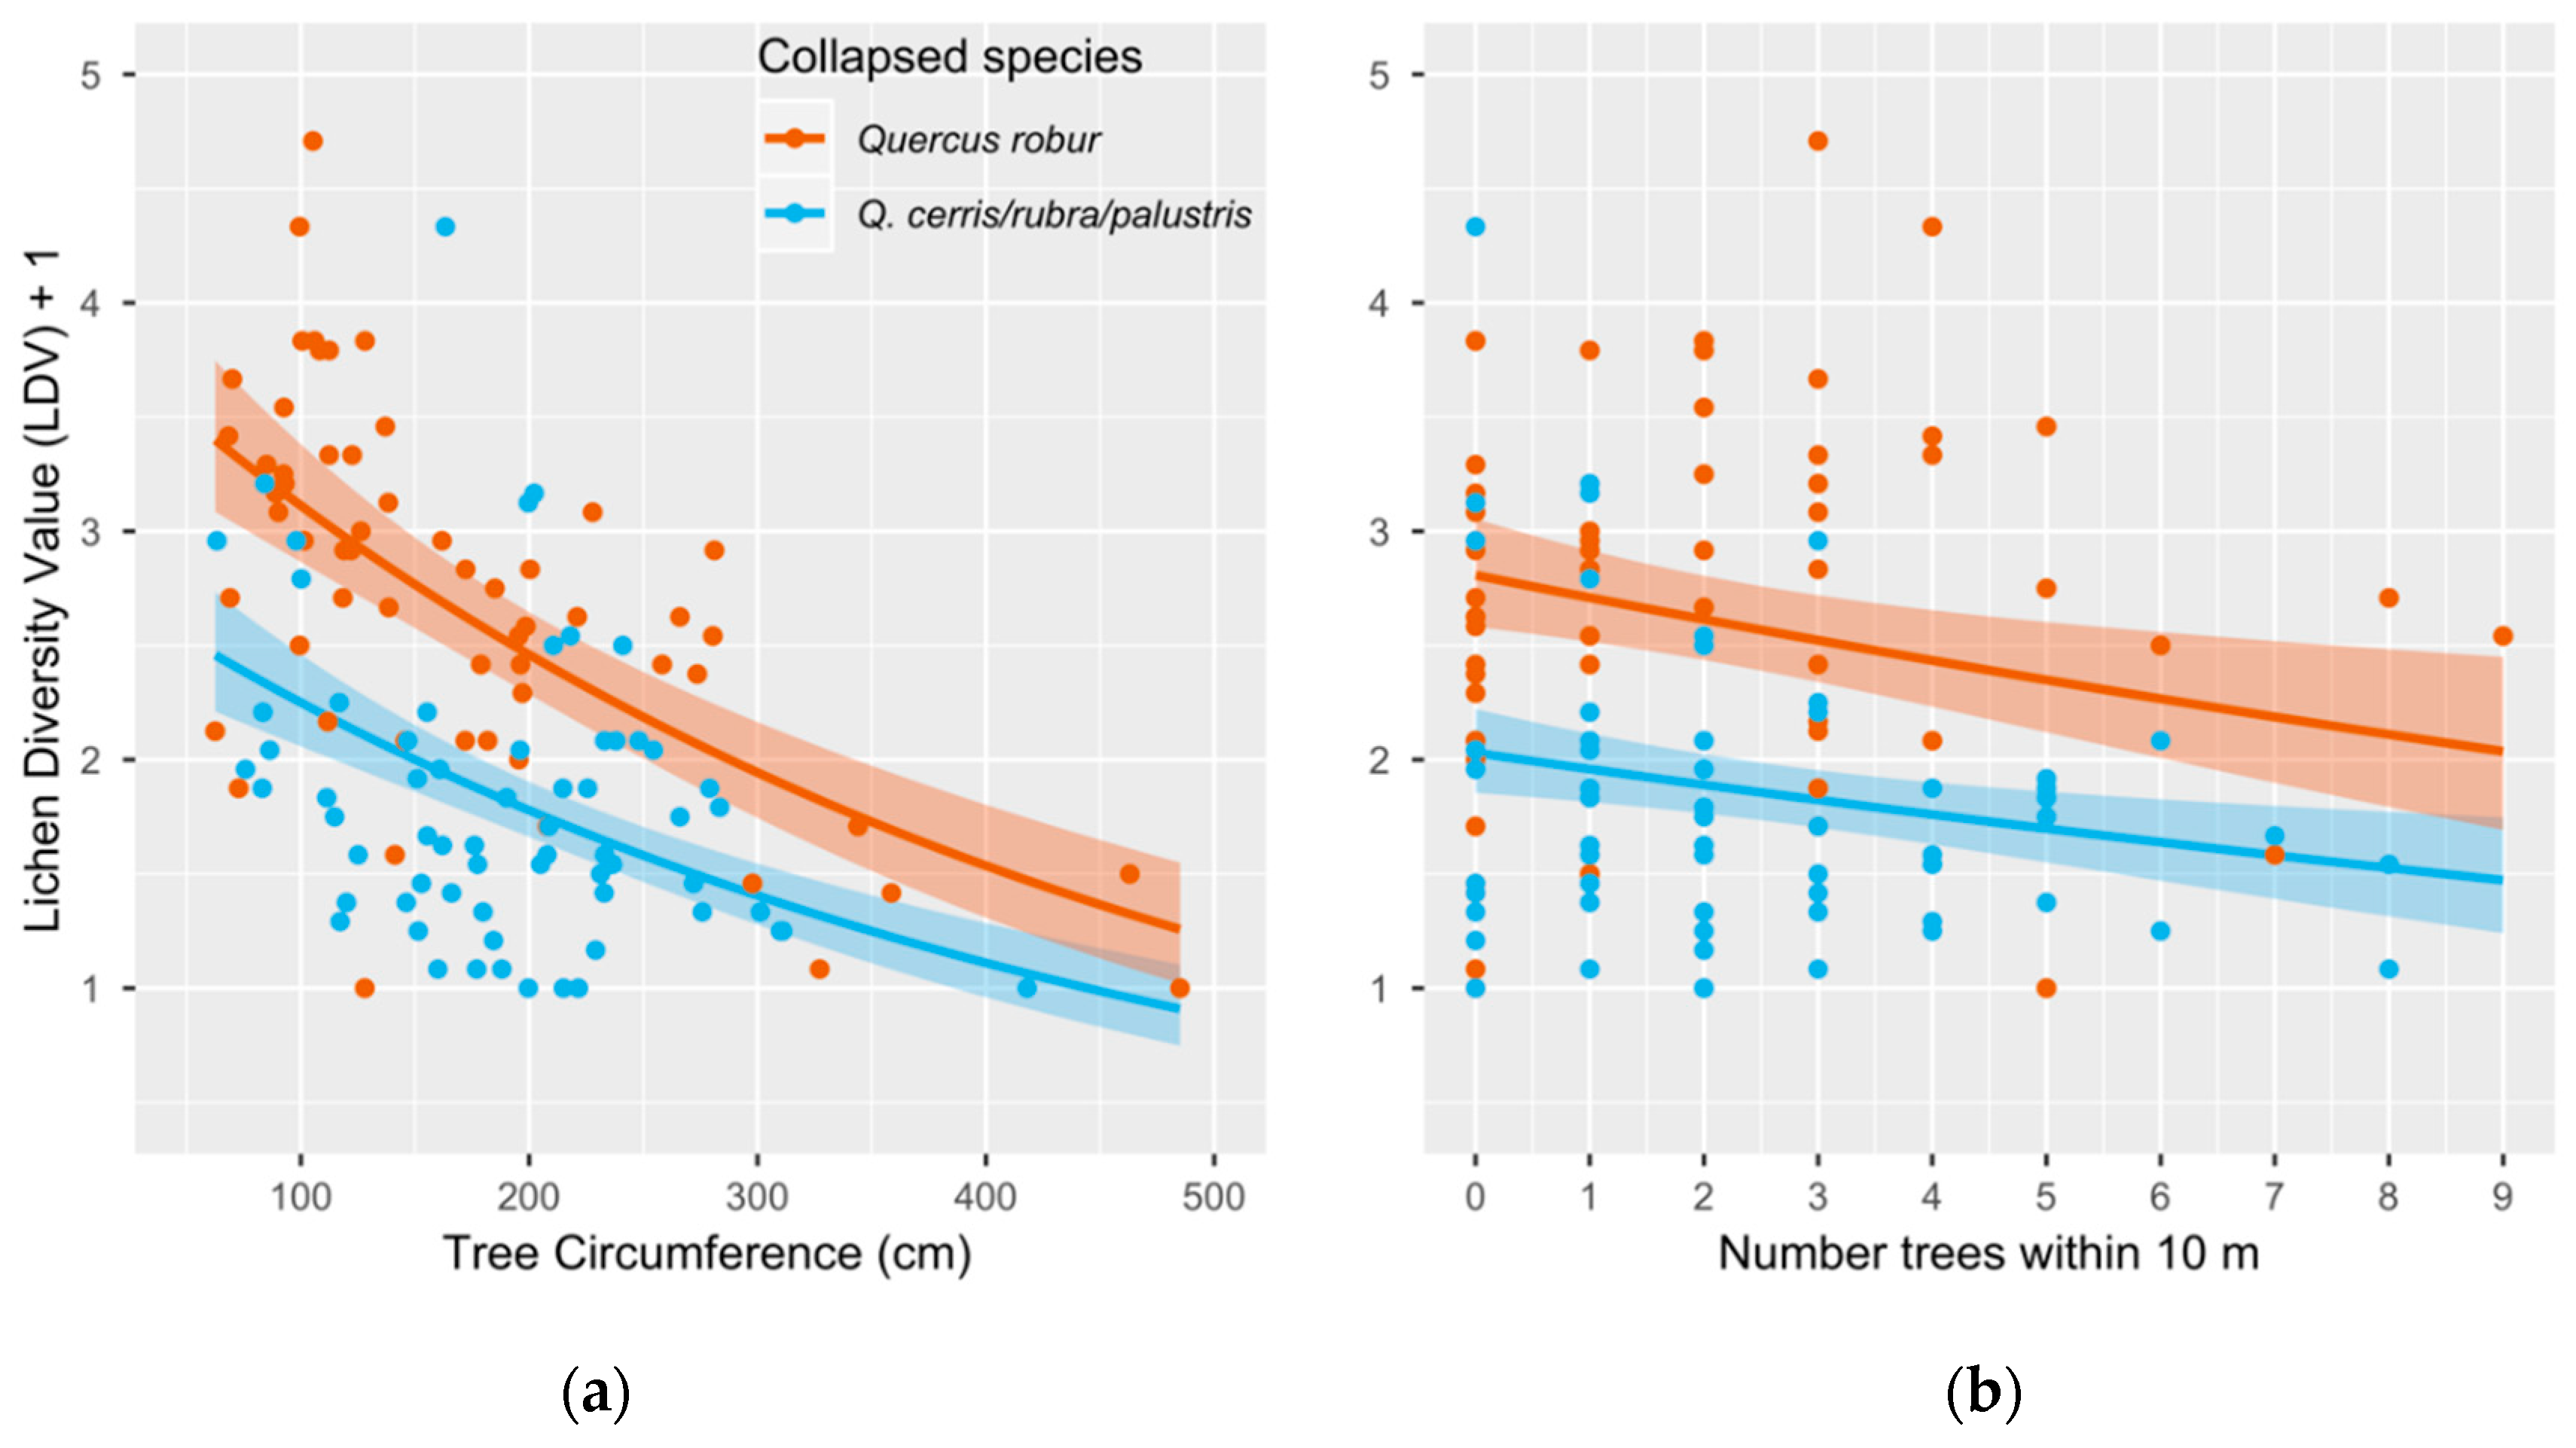
3.1.1. Lichen Diversity Value (LDV)

The partial F-test of the full model showed bark rugosity, all of the proxies for tree isolation and all the interaction terms to be non-significant at a p < 0.05 significance level (Table S2). The non-significant terms were removed from the model in a stepwise fashion, removing the variable with the highest non-significant p-value and rerunning the model until only significant variables remained. This process showed that the variable Park was also non-significant. This resulted in a final model containing three significant explanatory variables: tree circumference, tree species and number of trees within 10 m. All three variables had a statistically significant effect on LDV independent of their order in the model. This was shown using partial F-tests, again at a p < 0.05 significance level (circumference: F1121 = 45.140, p = 6.84 × 10⁻¹⁰, species: F3117 = 13.570, p < 1.14 × 10⁻⁷, No. trees 10 m: F1121 = 8.044, p = 0.005).
There appeared to be no significant difference in LDV between some of the factor levels of tree species (see t-test p-values between Q. cerris (Intercept), Q. rubra and Q. palustris in Table S3). Q. cerris, Q. rubra and Q. palustris were therefore collapsed into a single factor level. An ANOVA showed no significant difference in the explanatory power between the collapsed model and the non-collapsed model (F118,120 = 0.118, p = 0.889, see Table S4 for a full ANOVA table). The collapsed model therefore became our minimum adequate model with tree species having two factor levels Quercus robur and Quercus cerris/rubra/palustris.
Diagnostic plots showed no violation of the model assumptions (see Figure S3) and variance inflation factors (vifs) showed no significant collinearity between variables (all vifs were below critical value of 5; circumference = 1.082, species = 1.035, number trees within 10 m = 1.078). The final model had a Nagelkerke-R2 of 0.546 and a Cox and Snell R2 of 0.496. Model statistics are shown in Table 1.
Figure 3 visually depicts the results of the generalized linear model and shows that LDV declined significantly with increasing host tree circumference (Figure 3a) and number of trees within 10 m (Figure 3b). The same relationship was observed for all host species. Figure 3 also shows the significant effect of species with Q. robur supporting higher lichen diversity than Q. cerris/rubra/palustris.

3.1.2. Functional Trait Analysis

We found no significant effects between environmental variables and the CWMs of the functional traits reproduction type and pH preference (Tables S5 and S6).

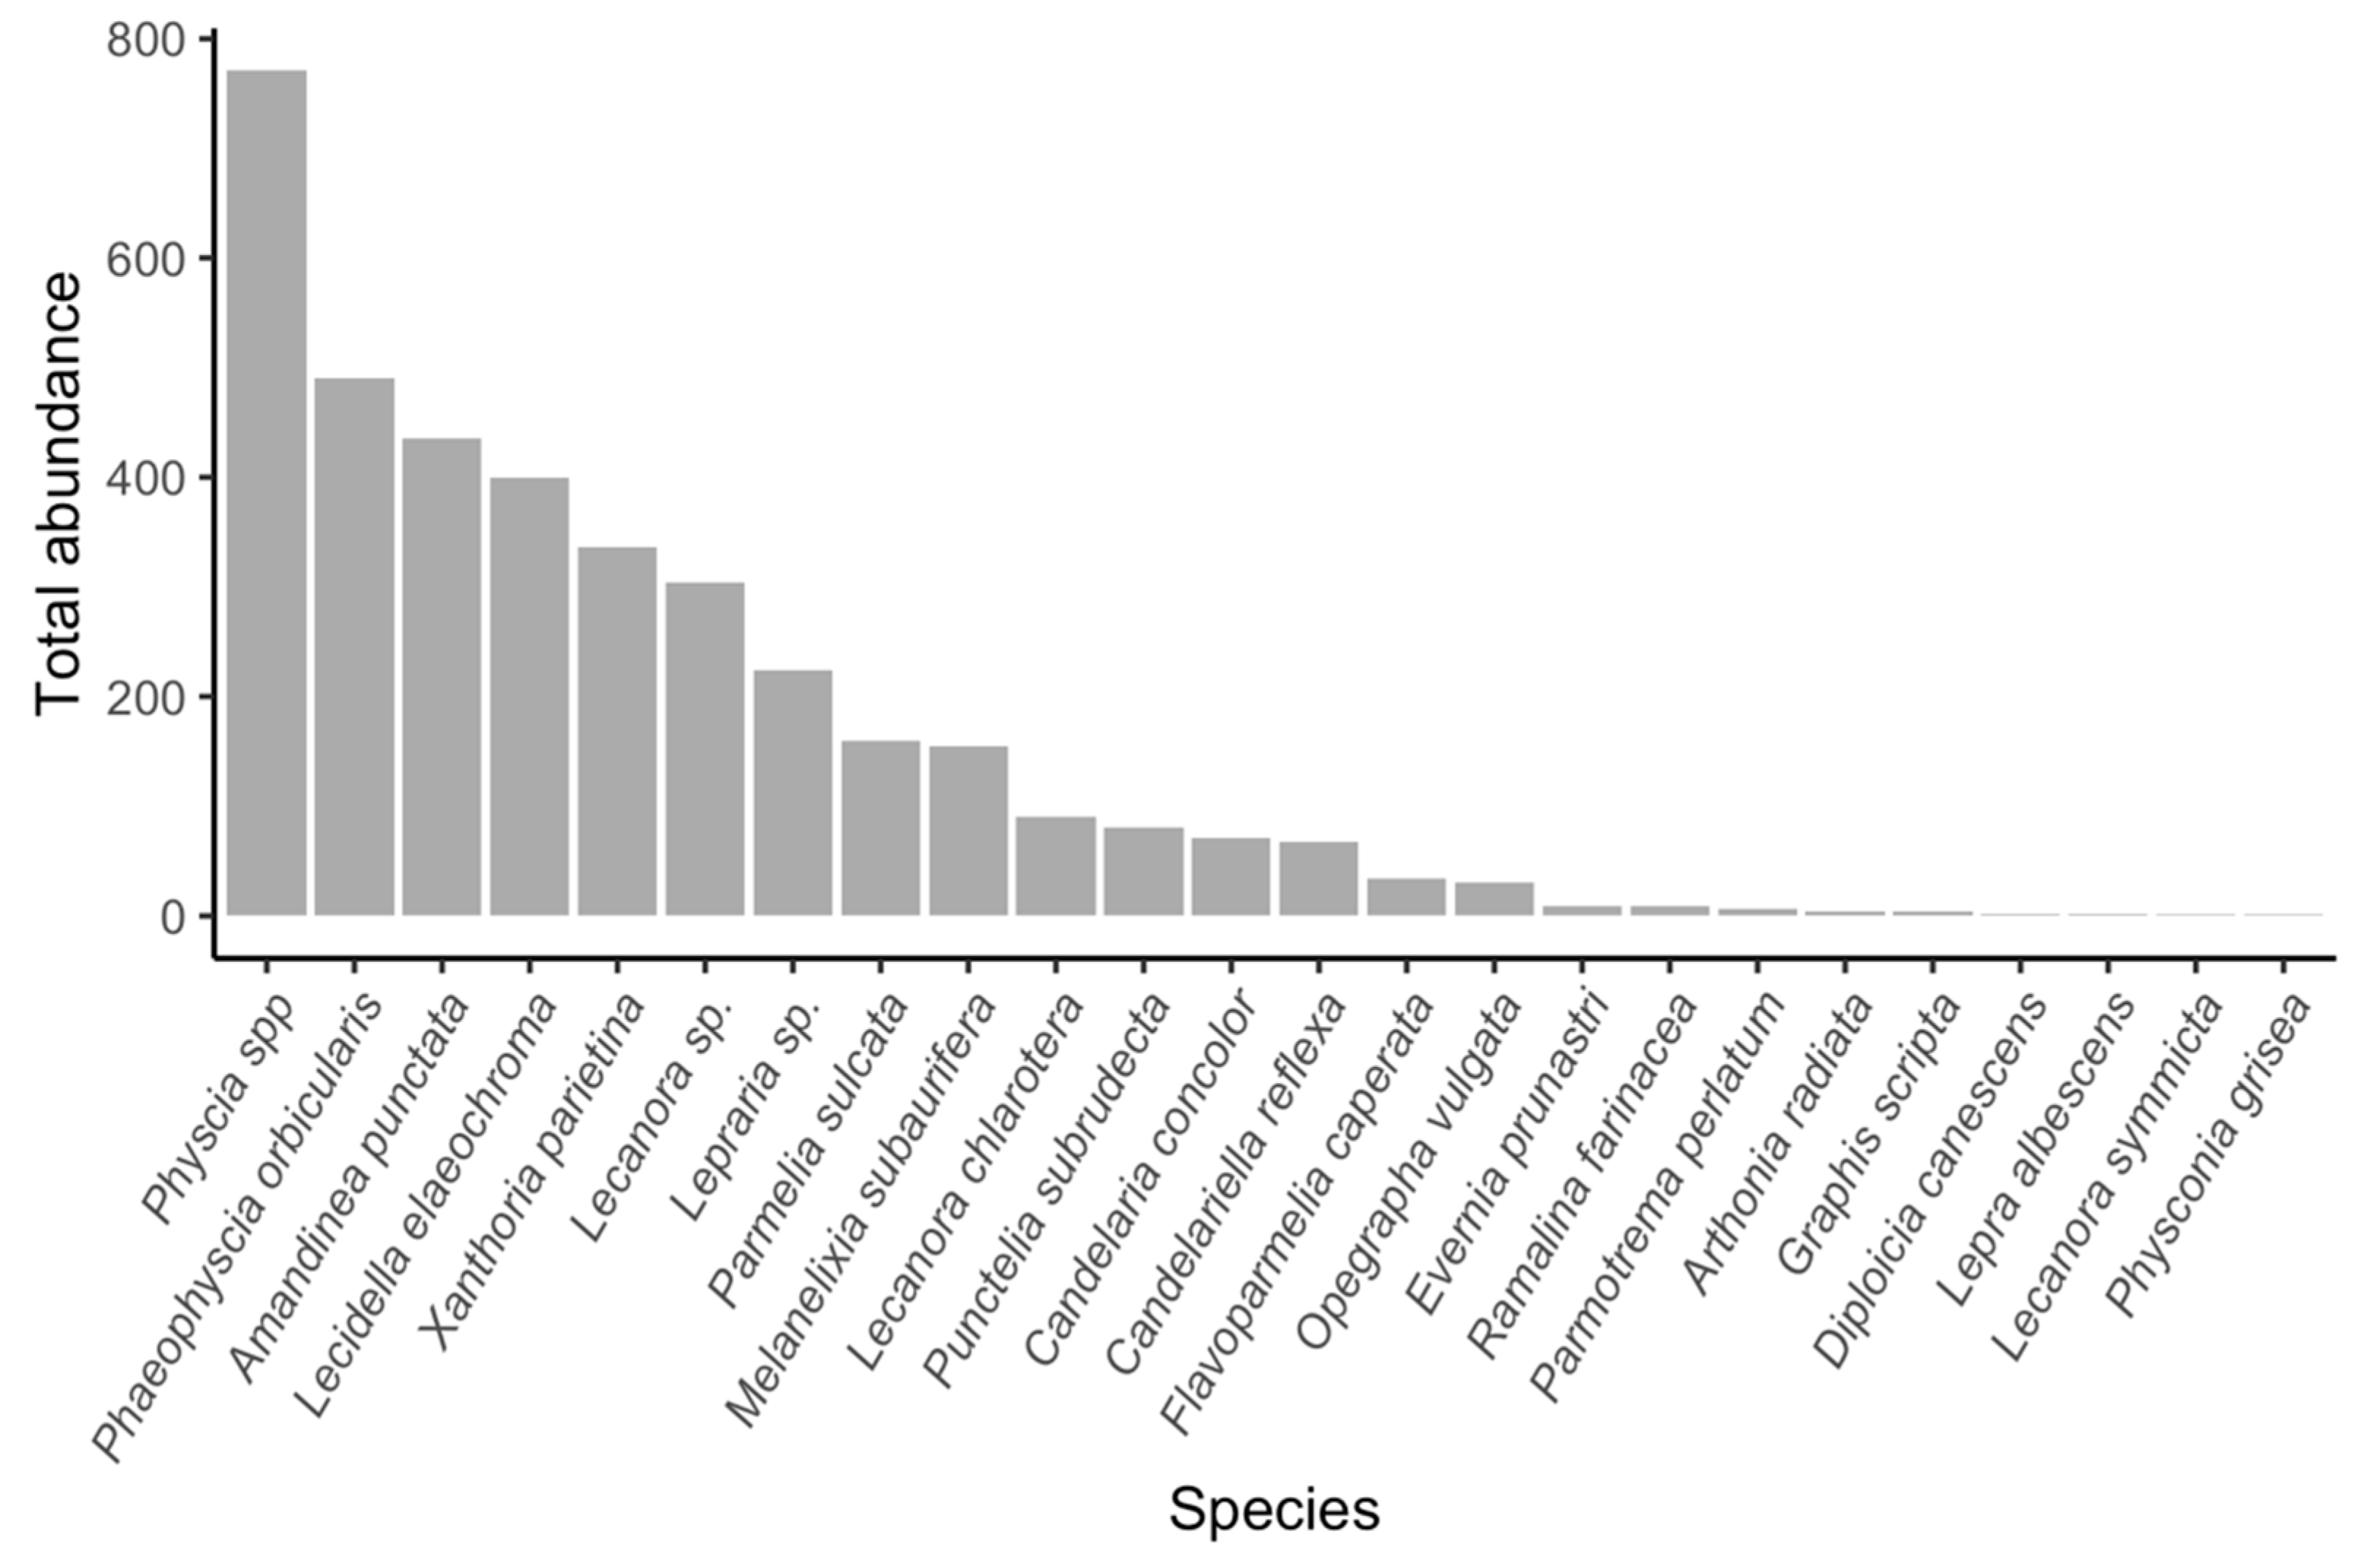
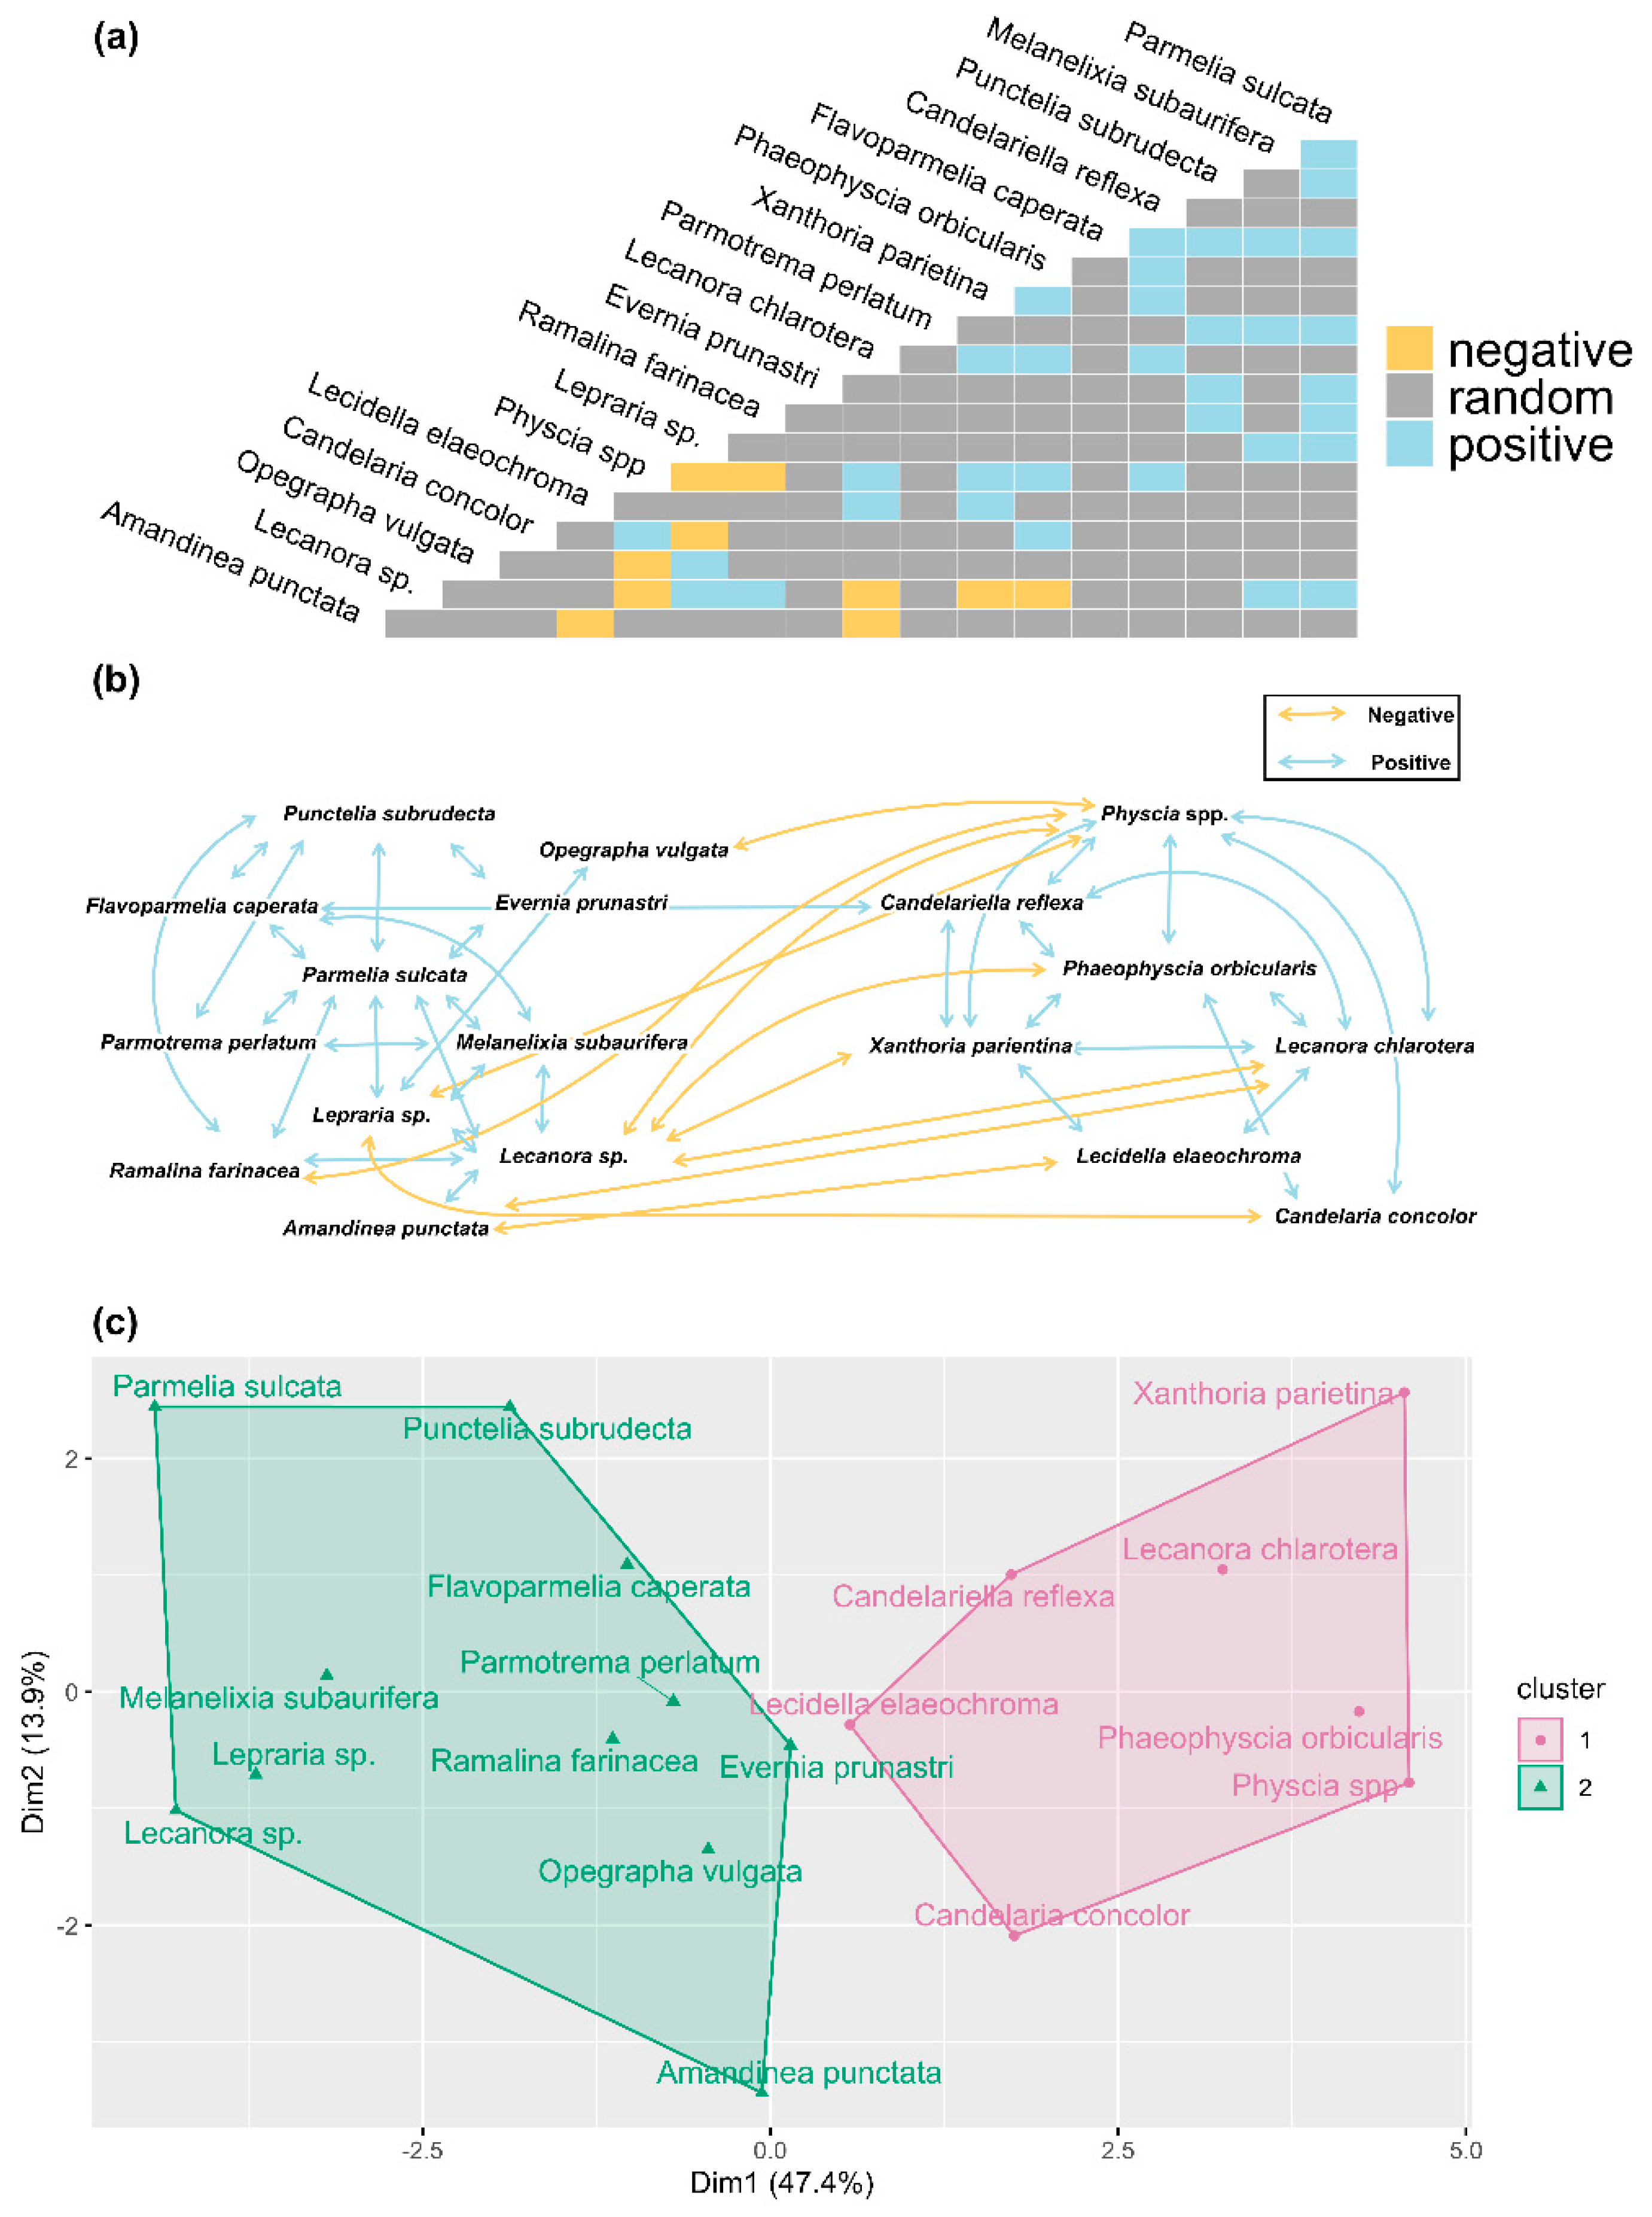
3.2. Species Co-Occurrence and Community Detection

Of the 276 possible species pairs, 123 were removed as the expected co-occurrence fell below the cooccur threshold of 1 due to one or both species being very rare. Across the remaining 153 species pairs we found 10 significant negative co-occurrences, 34 positive co-occurrences and 109 random co-occurrences (p < 0.025). These results are summarised in the species co-occurrence matrix in Figure 4a, which trims out any species with no significant positive or negative co-occurrences. From the results, two separate communities were identified visually with positive co-occurrences appearing within the communities and negative co-occurrences between the communities (Figure 4b). The community on the left of Figure 4b will from here on be informally referred to as Parmelion, and the community on the right as Xanthorion. Partitioning around the medoid analysis supported the presence of these two communities when k was set to two (Figure 4c). Cluster 1 in Figure 4c (pink) matched the Xanthorion community of Figure 4b and cluster 2 (green) matched the Parmelion community. Dimension one of the cluster plot explained 47.4% of the variance and dimension two a further 13.9%.

4. Discussion

Here we focussed on lichen epiphytic diversity in a large, historically well-recorded capital city that has undergone an improvement in atmospheric pollution levels over the last few decades. Overall, and in agreement with most other studies, we found that tree species and tree circumference at breast height (a proxy for tree size and age) explained the majority of the variation in host tree lichen diversity. We found a significant negative relationship between tree circumference and lichen diversity, meaning large, older trees are a lesser used niche by lichens. Local tree crowding, measured via a number of trees within 10 m, also explained a significant proportion of the variation in lichen diversity, with less crowded trees hosting a higher diversity. In contrast, neither distance to the nearest tree, locality or bark rugosity could explain any significant variation in tree host lichen diversity. Finally, our species co-occurrence analyses led to the detection of two distinct lichen communities (Xanthorion and Parmelion), both of which relate to early-successional communities, and as we discuss below, these could be important indicators of why London park-based lichen community diversity was negatively related to host tree circumference.

4.1. Lichen Diversity Is Significantly Affected by Host Tree Circumference, Tree Species and Local Crowding

The relationship between host tree size and epiphytic lichen diversity is a complex one that seems to vary depending on the system under study. Examples of both linear positive [38,39,40,41,42,83] and negative correlations [50,51] have been reported, as well as no correlation at all [28,52,53,54,55]. In some cases, a unimodal relationship has been observed, with lichen diversity increasing up to a point and then subsequently plateauing or even decreasing with very large tree sizes [44,48,49]. Various factors correlate with tree size including tree age, bark chemistry and structure, and crown size, which may obscure a clear relationship between tree size and epiphytic lichen richness [14]. The relationship may also depend on the tree species and age/size range being studied, as well as the climatic, edaphic and atmospheric conditions of the site. It is therefore difficult to generalise this relationship and demonstrates the importance of site-specific studies when investigating patterns in lichen diversity.
In urban systems, it is important to consider how atmospheric pollution may interact with the effect of tree size. Though current atmospheric sulphur dioxide (SO2) levels in London are reasonably low, larger older trees have lived through past high pollution level environments, and this is still being reflected in their bark chemistry [27,84,85]. Such an effect is expected to be especially pronounced in long-lived, non-exfoliating trees like oak [85]. In addition, given that nitrogen pollution is still high in London [86], larger oaks may have had more time to accumulate these pollutants in their bark. The legacy effect of pollution on large trees has already been discussed in relation to initial lichen colonisation [27,31,84,85,87,88], with studies showing that following a drop in atmospheric pollution levels, small trees are often the first to be colonised by lichens. Therefore, the bark on the trunks of small oak trees in London may currently provide a chemically more favourable substrate for lichen establishment and growth than that of mature oaks. Whether substrate suitability in this system is due to pH, cations, heavy metals or nitrogen and other pollutants in the bark cannot be elucidated in this study and will require further testing. Besides pollutant effects, another difference between older and younger trees is that younger bark normally absorbs less water [89] and is more structurally stable/less likely to disintegrate [90]; both of these factors have been shown to benefit epiphytic lichen communities and may be contributing alongside the chemical properties to increase the suitability of young bark for lichen growth.
Light intensity is another factor that may contribute to the higher suitability of young trees for lichen growth. Larger trees tend to have denser canopies meaning that less light reaches the trunk [91,92]. Specialist, climax indicator lichen taxa, including Peltigera, Usnea and Lobaria species, are usually inhibited by high light intensities and are hence found predominantly in dense forests or on large trees [91]. Generalist, pollution-tolerant taxa such as species from the Xanthorion parietinae favour well-lit situations and are common in exposed areas [93]. As the species pool in this study comes largely from these more generalist communities, it follows that a higher diversity is found on the smaller trees where individuals receive more light. Light intensity may also explain the negative effect of local crowding we see in Figure 3b. Increased local crowding may reduce the amount of light reaching the tree boles, which could inhibit establishment and growth of the dominant London communities, which favour well-lit situations. It should be noted, however, that a recent study by Giordani and Malaspina (2016) using hierarchical partitioning of variance and generalized linear mixed models found light intensity had little to no effect on lichen functional diversity in a highly polluted system [28].
The significant effect of tree species on epiphytic lichen diversity has been observed previously [41,50,52,64,94]. The fact that we were able to see this in our study, using only four species of a single genus, shows how important tree species can be for understanding epiphytic lichen diversity. The differences in lichen diversity found amongst the Quercus species in our study could be due to various bark-related factors (pH, water retention and cation concentration) and further characterization of the microhabitats of each Quercus species is needed to understand why Q. robur hosts a higher diversity.
In contrast to tree host species, tree circumference and local crowding, we could not detect any effect of bark rugosity, tree isolation or geographic location (park) on lichen diversity. It is likely that the effects of rugosity are already included in the tree circumference and species factors, even though we did not find any evidence for its relevance even when these factors were not included in the analysis. The difficulty of separating the effects of bark-related variables such as rugosity, water-retention and bark thickness was highlighted by McDonald et al. (2017) who observed a similar pattern with little to no effect of bark fissuring on lichen community composition [57].
Whilst we did use a number of proxies for tree isolation, it may be the case that we did not estimate isolation at the best scale as we only considered very localized (within 10 m radius) isolation metrics surrounding the host tree. However, the parks are all relatively large and well populated with trees, and given lichen spores can travel long distances on the wind, it may be the case that dispersal limitation is not a significant factor, even in a large urban site. None-the-less future work should investigate the population genetic structure of the communities, both within and between parks as this might uncover more information about the level of lichen dispersal in an urban context. Recent research combining genetic information into a hierarchical Bayesian model has concluded that, at least for Lobaria pulmonaria, a species found in old growth forests, spore dispersal may occur over several hundred metres to kilometres [95].
The lack of an effect of a park can be explained by previous work from Larsen et al. (2007). In an attempt to study the lichen and bryophyte distribution on oak in Central London in relation to air pollution and bark acidity, the authors identified four distinct biogeographic zones for the different epiphyte communities based on lichen and bryophyte frequencies [31]. The parks included in our study all fall within the same zone (Group D2) according to Larsen et al. and should therefore not be expected to differ significantly in their diversity and species composition.
Finally, contrary to our hypothesis 2 in the introduction, we found no significant effects of host tree-related factors on the functional trait diversity measures. This was unexpected as previous studies have shown strong correlations between lichen functional traits and tree-related factors such host age/size; for example, lichen epiphyte communities on various trees species in Scotland show a clear shift from sexual crustose communities to asexual foliose ones as tree size/age increases [49,65,66,67]. Species diversity in this study is considerably lower than in the previously mentioned studies, which in turn signifies lower functional trait diversity. This lack of variation in functional traits suggests that all the lichen species may be occupying a similar niche (discussed more below) and the functional groups that would benefit from tree-related factors like tree size are simply not present. Giordani and Malaspina (2016) observed a similar pattern in a highly polluted area of northwest Italy where the abundance of nitrophytic and oligotrophic functional groups showed little to no response to tree-related environmental predictors like tree size, bark pH and light. The authors showed that functional group abundance was much more strongly related to levels of atmospheric pollutants, mainly nitrogen compounds.

4.2. Species Co-Occurrence Reveals Two Distinct Early Successional Lichen Communities

Although the search for species co-occurrence patterns has a long history in ecology [96], it is only recently that they have been used to infer subcommunities, which may relate to key habitat types [97] or possibly successional stages. The two lichen communities that emerge from the co-occurrence analysis show clear negative associations between each other suggesting they are indeed separate communities, each requiring slightly different environmental conditions.
Previous work on UK lichen communities supports the two communities presented here: Parmelion and Xanthorion. The Xanthorion community (right of Figure 4b, cluster 1 in Figure 4c) shares four of its seven species with the Physcietum ascendentis association within the Xanthorion parietinae alliance described by James, Hawksworth and Rose (1977) [93]. Physcietum ascendentis consists of species adapted to nutrient-enriched substrates and high light intensities [93]. The Parmelion community (left of Figure 4b, cluster 2 in Figure 4c) shares six of its eleven species with the Parmelietum revolutae association within the Parmelion perlatae alliance [93]. This alliance occurs mainly on well-lit bark of Fraxinus, Quercus and Larix trees and appears more pollution-sensitive than the Physcietum ascendentis [93]. The Xanthorion and Parmelion communities discussed here also overlap with the communities described by Ellis et al. (2015). The species within Xanthorion most frequently occur in Ellis et al.’s community A, a pioneer community found on smooth-barked young trees. In contrast, the species within Parmelion occur most frequently in their community D, another early successional community associated with mesotrophic habitats. Ellis et al.’s communities A and D have also been linked to James, Hawksworth and Rose’s Xanthorion parietinae and Parmelion perlatae, respectively [98]. Our community analysis shows that despite vast improvements in the pollution level in London, the lichen biota is still dominated by pollution-tolerant communities.
Our co-occurrence analysis therefore only uncovers the generalist, early successional lichen communities. Results suggest the negative relationship observed between tree DBH and lichen diversity may, in part, be driven by a preference of these communities for the well-lit, exposed substrates of young trees and an absence of late-successional epiphytes that tend to occupy the niches of larger trees. The lack of late-successional lichen species, and their associated functional traits, is also likely to be an important factor behind our inability to detect a relationship between functional diversity and any of the variables we sampled.
Large trees provide important microhabitats for many lichen species and are important refuges for sensitive climax communities [99,100], yet we believe the current crop of older and larger trees in London could be carrying the legacy of previously high levels SO2 pollution and have had a longer exposure time to nitrogen pollution, which still remains high. It is also possible that the trees are indeed suitable for colonisation by late-successional species, but that dispersal in from regions outside London has not yet occurred. However, we feel this is unlikely given recent evidence for long-distance dispersal [95].

5. Conclusions

Lichens make up a large proportion of the diversity of many ecosystems and form an integral part of trophic webs [14]. Understanding the factors that control their diversity is therefore vital in the conservation of all species. The ecology and conservation of epiphytic lichen communities is especially relevant in cities where green spaces rely heavily on trees to encourage wildlife. This study shows that assessing community structure and successional stage can be key to understanding diversity patterns in urban ecosystems. This will subsequently help best determine the optimum conditions that may facilitate biodiversity increase within cities. Though recent data suggest average occupancy of UK lichens has increased since 1970 [101], atmospheric pollution needs to be targeted in order for urban communities to recover to a preindustrial state. Due to the heritage effects of SO2 emissions and current nitrogen pollution and particulates it may be many years before the bark of larger trees becomes hospitable for lichens and urban lichen communities may remain at a pioneer stage. This successional stasis limits the overall species and functional diversity, which may also lead to more vulnerable communities (a pattern that has already been observed in Italian lichen communities [102]). Recovery of London’s epiphytic lichen communities is therefore dependent upon decreasing atmospheric pollutants followed by potentially subsequent dispersal events from neighbouring rural communities. Until this occurs, we expect trees with suitable sizes for more stable communities to remain devoid of lichens and their high potential microhabitats will remain empty. As it stands, these trees are unexploited niches.

Supplementary Materials

The following are available online at https://www.mdpi.com/1424-2818/12/9/330/s1, Figure S1: Maps showing the locations of the trees sampled in this study, Figure S2: Rarefaction curves showing the accumulative number of species found when increasing the number of sites (trees) sampled, Figure S3: Diagnostic plots of minimum adequate model LDV~Circumference + Species + Number trees within 10 m, Table S1: List of identified species in this study including their assigned species number by the British Lichen Society and functional trait groups, Table S2: Results of partial F-test of generalized linear model: LDV + 1 = Circumference + Species + Park + Species × Circumference + Species × Rugosity + Circumference × Rugosity + Distance to nearest tree + Distance to nearest Quercus + Number trees within 10 m, Table S3: Summary table of generalized linear model: LDV + 1 = Circumference + Species + Number trees within 10 m, Table S4: ANOVA table comparing the non-collapsed (Model 1) and collapsed (Model 2) generalized linear model, Table S5: Results of χ2 test of generalized linear model: CWM sexual reproduction = Circumference + Species + Park + Distance to nearest tree + Distance to nearest Quercus + Number trees within 10 m + Species × Rugosity + Circumference × Rugosity, Table S6: Results of χ2 test of generalized linear model: CWM acidophilous pH preference = Circumference + Species + Park + Distance to nearest tree + Distance to nearest Quercus + Number trees within 10 m + Species × Rugosity + Circumference × Rugosity, Dataset 1: Measured host tree variables, lichen species abundances, and Lichen Diversity Values (LDV) for each sampled tree, Dataset 2: Functional trait groups for all lichen species identified in this study, Computer Code: Computer code for all statistical analyses in R.

Author Contributions

Conceptualization, T.L. and D.J.M.; methodology, T.L., E.G. and D.J.M.; formal analysis, T.L.; investigation, T.L.; resources, D.J.M.; data curation, T.L.; writing—original draft preparation, T.L., E.G. and D.J.M.; writing—review and editing, T.L., E.G. and D.J.M.; visualization, T.L.; supervision, D.J.M.; project administration, D.J.M.; funding acquisition, T.L. All authors have read and agreed to the published version of the manuscript.

Funding

Part of this research was funded by the Natural Environment Research Council (NERC) studentship NE/S007415/1 to T.L.

Acknowledgments

We thank members of the British Lichen Society who assisted with identification of some of the lichen species. We also thank William Purvis for his helpful insights into lichen communities in London and the four anonymous reviewers whose comments helped improve an earlier version of the manuscript.

Conflicts of Interest

The authors declare no conflict of interest. The funders had no role in the design of the study; in the collection, analyses, or interpretation of data; in the writing of the manuscript, or in the decision to publish the results.

References

  1. Grimm, N.B.; Faeth, S.H.; Golubiewski, N.E.; Redman, C.L.; Wu, J.; Bai, X.; Briggs, J.M. Global change and the ecology of cities. Science 2008, 319, 756–760. [Google Scholar] [CrossRef] [PubMed] [Green Version]
  2. Kaye, J.P.; Groffman, P.M.; Grimm, N.B.; Baker, L.A.; Pouyat, R.V. A distinct urban biogeochemistry? Trends Ecol. Evol. 2006, 21, 192–199. [Google Scholar] [CrossRef] [PubMed]
  3. Niemelä, J. Is there a need for a theory of urban ecology? Urban Ecosyst. 1999, 3, 57–65. [Google Scholar] [CrossRef]
  4. Drinnan, I.N. The search for fragmentation thresholds in a Southern Sydney Suburb. Biol. Conserv. 2005, 124, 339–349. [Google Scholar] [CrossRef]
  5. Gledhill, D.G.; James, P.; Davies, D.H. Pond density as a determinant of aquatic species richness in an urban landscape. Landsc. Ecol. 2008, 23, 1219–1230. [Google Scholar] [CrossRef]
  6. Turrini, T.; Knop, E. A landscape ecology approach identifies important drivers of urban biodiversity. Glob. Chang. Biol. 2015, 21, 1652–1667. [Google Scholar] [CrossRef]
  7. Ferenc, M.; Sedláček, O.; Fuchs, R.; Dinetti, M.; Fraissinet, M.; Storch, D. Are cities different? Patterns of species richness and beta diversity of urban bird communities and regional species assemblages in Europe. Glob. Ecol. Biogeogr. 2014, 23, 479–489. [Google Scholar] [CrossRef]
  8. Jumpponen, A.; Jones, K.L.; Mattox, J.D.; Yaege, C. Massively parallel 454-sequencing of fungal communities in Quercus spp. ectomycorrhizas indicates seasonal dynamics in urban and rural sites. Mol. Ecol. 2010, 19, 41–53. [Google Scholar] [CrossRef]
  9. Niemelä, J.; Kotze, D.J.; Venn, S.; Penev, L.; Stoyanov, I.; Spence, J.; Hartley, D.; Montes de Oca, E. Carabid beetle assemblages (Coleoptera, Carabidae) across urban-rural gradients: An international comparison. Landsc. Ecol. 2002, 17, 387–401. [Google Scholar] [CrossRef]
  10. Pavao-Zuckerman, M.A.; Coleman, D.C. Urbanization alters the functional composition, but not taxonomic diversity, of the soil nematode community. Appl. Soil Ecol. 2007, 35, 329–339. [Google Scholar] [CrossRef]
  11. Bates, S.T.; Cropsey, G.W.G.; Caporaso, J.G.; Knight, R.; Fierer, N. Bacterial communities associated with the lichen symbiosis. Appl. Environ. Microbiol. 2011, 77, 1309–1314. [Google Scholar] [CrossRef] [PubMed] [Green Version]
  12. Spribille, T.; Tuovinen, V.; Resl, P.; Vanderpool, D.; Wolinski, H.; Aime, M.C.; Schneider, K.; Stabentheiner, E.; Toome-Heller, M.; Thor, G.; et al. Basidiomycete yeasts in the cortex of ascomycete macrolichens. Science 2016, 353, 488–492. [Google Scholar] [CrossRef] [PubMed] [Green Version]
  13. Vieira, J.; Matos, P.; Mexia, T.; Silva, P.; Lopes, N.; Freitas, C.; Correia, O.; Santos-Reis, M.; Branquinho, C.; Pinho, P. Green spaces are not all the same for the provision of air purification and climate regulation services: The case of urban parks. Environ. Res. 2018, 160, 306–313. [Google Scholar] [CrossRef] [PubMed]
  14. Ellis, C.J. Lichen epiphyte diversity: A species, community and trait-based review. Perspect. Plant Ecol. Evol. Syst. 2012, 14, 131–152. [Google Scholar] [CrossRef]
  15. Henriksson, E.; Simu, B. Nitrogen fixation by lichens. Oikos 2012, 22, 119–121. [Google Scholar] [CrossRef]
  16. Gunnarsson, B.; Hake, M.; Hultengren, S. A functional relationship between species richness of spiders and lichens in spruce. Biodivers. Conserv. 2004, 13, 685–693. [Google Scholar] [CrossRef]
  17. Pettersson, R.B.; Ball, J.P.; Renhorn, K.E.; Esseen, P.A.; Sjöberg, K. Invertebrate communities in boreal forest canopies as influenced by forestry and lichens with implications for passerine birds. Biol. Conserv. 1995, 74, 57–63. [Google Scholar] [CrossRef]
  18. Lücking, R.; Hodkinson, B.P.; Leavitt, S.D. The 2016 classification of lichenized fungi in the Ascomycota and Basidiomycota—Approaching one thousand genera. Bryologist 2017, 119, 361–416. [Google Scholar] [CrossRef]
  19. Nash, T. Lichen Biology; Cambridge University Press: Cambridge, UK, 2008; ISBN 9780874216561. [Google Scholar]
  20. Purvis, O.W.; Chimonides, J.; Din, V.; Erotokritou, L.; Jeffries, T.; Jones, G.C.; Louwhoff, S.; Read, H.; Spiro, B. Which factors are responsible for the changing lichen floras of London? Sci. Total Environ. 2003, 310, 179–189. [Google Scholar] [CrossRef]
  21. Lisowska, M. Lichen recolonisation in an urban-industrial area of southern Poland as a result of air quality improvement. Environ. Monit. Assess. 2011, 179, 177–190. [Google Scholar] [CrossRef] [Green Version]
  22. McMullin, R.T.; Bennett, L.L.; Bjorgan, O.J.; Bourque, D.A.; Burke, C.J.; Clarke, M.A.; Gutgesell, M.K.; Krawiec, P.L.; Malyon, R.; Mantione, A.; et al. Relationships between air pollution, population density, and lichen biodiversity in the Niagara Escarpment World Biosphere Reserve. Lichenologist 2016, 48, 593–605. [Google Scholar] [CrossRef]
  23. Nascimbene, J.; Tretiach, M.; Corana, F.; Lo Schiavo, F.; Kodnik, D.; Dainese, M.; Mannucci, B. Patterns of traffic polycyclic aromatic hydrocarbon pollution in mountain areas can be revealed by lichen biomonitoring: A case study in the Dolomites (Eastern Italian Alps). Sci. Total Environ. 2014, 475, 90–96. [Google Scholar] [CrossRef]
  24. Cislaghi, C.; Nimis, P.L. Lichens, air pollution and lung cancer. Nature 1997, 387, 463–464. [Google Scholar] [CrossRef] [PubMed]
  25. Llop, E.; Pinho, P.; Matos, P.; Pereira, M.J.; Branquinho, C. The use of lichen functional groups as indicators of air quality in a Mediterranean urban environment. Ecol. Indic. 2012, 13, 215–221. [Google Scholar] [CrossRef]
  26. Koch, N.M.; Matos, P.; Branquinho, C.; Pinho, P.; Lucheta, F.; Martins, S.M.d.A.; Vargas, V.M.F. Selecting lichen functional traits as ecological indicators of the effects of urban environment. Sci. Total Environ. 2019, 654, 705–713. [Google Scholar] [CrossRef] [PubMed]
  27. Gadsdon, S.R.; Dagley, J.R.; Wolseley, P.A.; Power, S.A. Relationships between lichen community composition and concentrations of NO2 and NH3. Environ. Pollut. 2010, 158, 2553–2560. [Google Scholar] [CrossRef] [PubMed]
  28. Giordani, P.; Malaspina, P. Do tree-related factors mediate the response of lichen functional groups to eutrophication? Plant Biosyst. 2016, 151, 1062–1072. [Google Scholar] [CrossRef]
  29. Laundon, J.R. A study of the lichen flora of London. Lichenologist 1967, 3, 277–327. [Google Scholar] [CrossRef]
  30. Rose, C.I.; Hawksworth, D.L. Lichen recolonization in London’s cleaner air. Nature 1981, 289, 289–292. [Google Scholar] [CrossRef]
  31. Larsen, R.S.; Bell, J.N.B.; James, P.W.; Chimonides, P.J.; Rumsey, F.J.; Tremper, A.; Purvis, O.W. Lichen and bryophyte distribution on oak in London in relation to air pollution and bark acidity. Environ. Pollut. 2007, 146, 332–340. [Google Scholar] [CrossRef]
  32. Sernander, R. Stockholms Natur; Almqvist & Wiksell: Uppsala, Sweden, 1926. [Google Scholar]
  33. Laundon, J.R. London’s lichens. Lond. Nat. 1970, 49, 20–69. [Google Scholar]
  34. Davies, L.; James, P.W.; Chimonides, J.H.; Purvis, O.W. Part 1: Corticolous lichens in London. In Effects of NOx and NH3 on Lichen Communities and Urban Ecosystems: A Pilot Study; Technical Report; The Natural History Museum and Imperial College of Science, Technology and Medicine: London, UK, 2002; pp. 8–29. [Google Scholar]
  35. Jovan, S.; Riddell, J.; Padgett, P.E.; Nash, T.H. Eutrophic lichens respond to multiple forms of N: Implications for critical levels and critical loads research. Ecol. Appl. 2012, 22, 1910–1922. [Google Scholar] [CrossRef] [PubMed]
  36. Davies, L.; Bates, J.W.; Bell, J.N.B.; James, P.W.; Purvis, O.W. Diversity and sensitivity of epiphytes to oxides of nitrogen in London. Environ. Pollut. 2007, 146, 299–310. [Google Scholar] [CrossRef]
  37. Welden, N.A.; Wolseley, P.A.; Ashmore, M.R. Citizen science identifies the effects of nitrogen deposition, climate and tree species on epiphytic lichens across the UK. Environ. Pollut. 2017, 232, 80–89. [Google Scholar] [CrossRef] [PubMed]
  38. Buckley, H.L. Isolation affects tree-scale epiphytic lichen community structure on New Zealand mountain beech trees. J. Veg. Sci. 2011, 22, 1062–1071. [Google Scholar] [CrossRef]
  39. Nascimbene, J.; Marini, L.; Motta, R.; Nimis, P.L. Influence of tree age, tree size and crown structure on lichen communities in mature Alpine spruce forests. Biodivers. Conserv. 2009, 18, 1509–1522. [Google Scholar] [CrossRef]
  40. Reynolds, C.L.; Er, O.A.H.; Winder, L.; Blanchon, D.J. Distribution and community composition of lichens on mature mangroves (Avicennia marina subsp. australasica (Walp.) J.Everett) in New Zealand. PLoS ONE 2017, 12. [Google Scholar] [CrossRef] [Green Version]
  41. Thor, G.; Johansson, P.; Jönsson, M.T. Lichen diversity and red-listed lichen species relationships with tree species and diameter in wooded meadows. Biodivers. Conserv. 2010, 19, 2307–2328. [Google Scholar] [CrossRef]
  42. Lie, M.H.; Arup, U.; Grytnes, J.A.; Ohlson, M. The importance of host tree age, size and growth rate as determinants of epiphytic lichen diversity in boreal spruce forests. Biodivers. Conserv. 2009, 18, 3579–3596. [Google Scholar] [CrossRef]
  43. Ranius, T.; Johansson, P.; Berg, N.; Niklasson, M. The influence of tree age and microhabitat quality on the occurrence of crustose lichens associated with old oaks. J. Veg. Sci. 2008, 19, 653–662. [Google Scholar] [CrossRef]
  44. Johansson, P.; Rydin, H.; Thor, G. Tree age relationships with epiphytic lichen diversity and lichen life history traits on ash in southern Sweden. Ecoscience 2007, 14, 81–91. [Google Scholar] [CrossRef]
  45. Fritz, Ö.; Brunet, J.; Caldiz, M. Interacting effects of tree characteristics on the occurrence of rare epiphytes in a Swedish beech forest area. Bryologist 2009, 112, 488–505. [Google Scholar] [CrossRef]
  46. Fritz, Ö.; Niklasson, M.; Churski, M. Tree age is a key factor for the conservation of epiphytic lichens and bryophytes in beech forests. Appl. Veg. Sci. 2009, 12, 93–106. [Google Scholar] [CrossRef]
  47. Mežaka, A.; Brūmelis, G.; Piterāns, A. Tree and stand-scale factors affecting richness and composition of epiphytic bryophytes and lichens in deciduous woodland key habitats. Biodivers. Conserv. 2012, 21, 3221–3241. [Google Scholar] [CrossRef]
  48. Adams, D.B.; Risser, P.G. Some factors influencing the frequency of bark lichens in north central Oklahoma. Am. J. Bot. 1971, 58, 752. [Google Scholar] [CrossRef]
  49. Ellis, C.J.; Ellis, S.C. Signatures of autogenic epiphyte succession for an aspen chronosequence. J. Veg. Sci. 2013, 24, 688–701. [Google Scholar] [CrossRef]
  50. Sales, K.; Kerr, L.; Gardner, J. Factors influencing epiphytic moss and lichen distribution within killarney national park. Biosci. Horiz. 2016, 9. [Google Scholar] [CrossRef]
  51. Jüriado, I.; Liira, J.; Paal, J.; Suija, A. Tree and stand level variables influencing diversity of lichens on temperate broad-leaved trees in boreo-nemoral floodplain forests. Biodivers. Conserv. 2009, 18, 105–125. [Google Scholar] [CrossRef]
  52. Culberson, W.L. The corticolous communities of lichens and bryophytes in the upland forests of northern Wisconsin. Source Ecol. Monogr. 1955, 25, 215–231. [Google Scholar] [CrossRef]
  53. Gauslaa, Y. The ecology of Lobarion pulmonariae and Parmelion caperatae in Quercus dominated forests in south-west Norway. Lichenologist 1985, 17, 117–140. [Google Scholar] [CrossRef]
  54. Bates, J.W. Influence of chemical and physical factors on Quercus and Fraxinus epiphytes at Loch Sunart, western Scotland: A multivariate analysis. J. Ecol. 1992, 80, 163–179. [Google Scholar] [CrossRef]
  55. Löbel, S.; Snäll, T.; Rydin, H. Species richness patterns and metapopulation processes—Evidence from epiphyte communities in boreo-nemoral forests. Ecography 2006, 29, 169–182. [Google Scholar] [CrossRef]
  56. Degtjarenko, P.; Matos, P.; Marmor, L.; Branquinho, C.; Randlane, T. Functional traits of epiphytic lichens respond to alkaline dust pollution. Fungal Ecol. 2018, 36, 81–88. [Google Scholar] [CrossRef]
  57. McDonald, L.; Van Woudenberg, M.; Dorin, B.; Adcock, A.M.; McMullin, R.T.; Cottenie, K. The effects of bark quality on corticolous lichen community composition in urban parks of southern Ontario. Botany 2017, 95, 1141–1149. [Google Scholar] [CrossRef]
  58. Van Herk, C.M. Bark pH and susceptibility to toxic air pollutants as independent causes of changes in epiphytic lichen composition in space and time. Lichenologist 2001, 33, 419–441. [Google Scholar] [CrossRef]
  59. Van Herk, C.M. Mapping of ammonia pollution with epiphytic lichens in the Netherlands. Lichenologist 1999, 31, 9–20. [Google Scholar] [CrossRef]
  60. Nimis, P.L.; Martellos, S. ITALIC—The Information System on Italian Lichens Version 5.0. University of Trieste, Dept. of Biology, 2017. Available online: http://dryades.units.it/italic (accessed on 19 December 2018).
  61. LeBlanc, F.; Barkman, J.J. Phytosociology and ecology of cryptogamic epiphytes. Bryologist 1971, 74, 407. [Google Scholar] [CrossRef]
  62. Cleavitt, N.L.; Dibble, A.C.; Werier, D.A. Influence of tree composition upon epiphytic macrolichens and bryophytes in old forests of Acadia National Park, Maine. Bryologist 2009, 112, 467–487. [Google Scholar] [CrossRef]
  63. Király, I.; Ódor, P. The effect of stand structure and tree species composition on epiphytic bryophytes in mixed deciduous-coniferous forests of Western Hungary. Biol. Conserv. 2010, 143, 2063–2069. [Google Scholar] [CrossRef]
  64. Spier, L.; Van Dobben, H.; Van Dort, K. Is bark pH more important than tree species in determining the composition of nitrophytic or acidophytic lichen floras? Environ. Pollut. 2010, 158, 3607–3611. [Google Scholar] [CrossRef]
  65. Ellis, C.J.; Coppins, B.J. Contrasting functional traits maintain lichen epiphyte diversity in response to climate and autogenic succession. J. Biogeogr. 2006, 33, 1643–1656. [Google Scholar] [CrossRef]
  66. Ellis, C.J.; Coppins, B.J. Reproductive strategy and the compositional dynamics of crustose lichen communities on aspen (Populus tremula L.) in Scotland. Lichenologist 2007, 39, 377–391. [Google Scholar] [CrossRef]
  67. Lewis, J.E.J.; Ellis, C.J. Taxon- compared with trait-based analysis of epiphytes, and the role of tree species and tree age in community composition. Plant Ecol. Divers. 2010, 3, 203–210. [Google Scholar] [CrossRef]
  68. Dettki, H.; Klintberg, P.; Esseen, P.A. Are epiphytic lichens in young forests limited by local dispersal? Ecoscience 2000, 7, 317–325. [Google Scholar] [CrossRef]
  69. Öckinger, E.; Niklasson, M.; Nilsson, S.G. Is local distribution of the epiphytic lichen Lobaria pulmonaria limited by dispersal capacity or habitat quality? Biodivers. Conserv. 2005, 14, 759–773. [Google Scholar] [CrossRef]
  70. Kalwij, J.M.; Wagner, H.H.; Scheidegger, C. Effects of stand-level disturbances on the spatial distribution of a lichen indicator. Ecol. Appl. 2005, 15, 2015–2024. [Google Scholar] [CrossRef] [Green Version]
  71. Sillett, S.C.; McCune, B.; Peck, J.E.; Rambo, T.R.; Ruchty, A. Dispersal limitations of epiphytic lichens result in species dependent on old-growth forests. Ecol. Appl. 2000, 10, 789–799. [Google Scholar] [CrossRef]
  72. Greater London Authority London Atmospheric Emissions (LAEI) 2016, London Datastore. Available online: https://data.london.gov.uk/dataset/london-atmospheric-emissions-inventory--laei--2016 (accessed on 8 April 2018).
  73. Zandbergen, P.A.; Barbeau, S.J. Positional accuracy of assisted GPS data from high-sensitivity GPS-enabled mobile phones. J. Navig. 2011, 64, 381–399. [Google Scholar] [CrossRef] [Green Version]
  74. Asta, J.; Erhardt, W.; Ferretti, M.; Fornasier, F. Mapping lichen diversity as an indicator of environmental quality. In Monitoring with Lichens—Monitoring Lichens; Nimis, P.L., Scheidegger, C., Wolseley, P.A., Eds.; Springer: Dordrecht, The Netherlands, 2002; Volume 7, pp. 273–279. ISBN 978-94-010-0423-7. [Google Scholar]
  75. Seed, L.; Wolseley, P.; Gosling, L.; Davies, L.; Power, S.A. Modelling relationships between lichen bioindicators, air quality and climate on a national scale: Results from the UK OPAL air survey. Environ. Pollut. 2013, 182, 437–447. [Google Scholar] [CrossRef]
  76. Dobson, F.S. Lichens: An Illustrated Guide to the British and Irish Species, 6th ed.; Richmond Publishing: Slough, UK, 2011; ISBN 978-0-85546-315-1. [Google Scholar]
  77. R Core Team. R: A Language and Environment for Statistical Computing; R Foundation for Statistical Computing: Vienna, Austria, 2019; Available online: https://www.r-project.org/ (accessed on 16 October 2019).
  78. Lavorel, S.; Grigulis, K.; McIntyre, S.; Williams, N.S.G.; Garden, D.; Dorrough, J.; Berman, S.; Quétier, F.; Thébault, A.; Bonis, A. Assessing functional diversity in the field—Methodology matters! Funct. Ecol. 2008, 22, 134–147. [Google Scholar] [CrossRef]
  79. Laliberte, E.; Legendre, P. A distance-based framework for measuring functional diversity from multiple traits. Ecology 2010, 91, 299–305. [Google Scholar] [CrossRef]
  80. Veech, J.A. A probabilistic model for analysing species co-occurrence. Glob. Ecol. Biogeogr. 2013, 22, 252–260. [Google Scholar] [CrossRef]
  81. Griffith, D.M.; Veech, J.A.; Marsh, C.J. Cooccur: Probabilistic species co-occurrence analysis in R. J. Stat. Softw. 2016, 69, 1–7. [Google Scholar] [CrossRef]
  82. Maechler, M.; Rousseeuw, P.; Struyf, A.; Hubert, M.; Hornik, K.; Studer, M.; Roudier, P.; Gonzalez, J.; Kozlowski, K. Cluster: Cluster analysis basics and extensions. 2018. R Package Version 2.0.7-1. Available online: https://CRAN.R-project.org/package=cluster (accessed on 30 January 2020).
  83. Hedenaås, H.; Ericson, L. Epiphytic macrolichens as conservation indicators: Successional sequence in Populus tremula stands. Biol. Conserv. 2000, 93, 43–53. [Google Scholar] [CrossRef]
  84. Wolseley, P.A.; James, P.W.; Theobald, M.R.; Sutton, M.A. Detecting changes in epiphytic lichen communities at sites affected by atmospheric ammonia from agricultural sources. Lichenologist 2006, 38, 161–176. [Google Scholar] [CrossRef]
  85. Batty, K.; Bates, J.W.; Bell, J.N.B. A transplant experiment on the factors preventing lichen colonization of oak bark in southeast England under declining SO2 pollution. Can. J. Bot. 2003, 81, 439–451. [Google Scholar] [CrossRef]
  86. London Air Quality Network (LAQN). London Air Quality Network—Summary Report 2018; Techinal Report Environmental Research Group, King’s College London: London, UK, 2018; Available online: https://www.londonair.org.uk/london/reports/2018_LAQN_report.pdf (accessed on 11 August 2020).
  87. Hawksworth, D. Lichens: Changes in the lichen flora on trees in Epping Forest through periods of increasing and then ameliorating sulphur dioxide air pollution. In Epping Forest Through the Eye of the Naturalist; Hanson, M.W., Ed.; Essex Naturalist, Essex Field Club: London, UK, 1992; pp. 92–101. ISBN 090563716X. [Google Scholar]
  88. Guest, J. Further recolonisation of Cheshire by epiphytic lichens. Brit. Lichen Soc. Bull. 1989, 64, 29–31. [Google Scholar]
  89. Hauck, M.; Jung, R.; Runge, M. Does water-holding capacity of bark have an influence on lichen performance in dieback-affected spuce forests? Lichenologist 2000, 32, 407–409. [Google Scholar] [CrossRef]
  90. Hyvärinen, M.; Halonen, P.; Kauppi, M. Influence of stand age and structure on the epiphytic lichen vegetation in the middle-boreal forests of Finland. Lichenologist 1992, 24, 165–180. [Google Scholar] [CrossRef]
  91. Gauslaa, Y.; Solhaug, K.A. Differences in the susceptibility to light stress between epiphytic lichens of ancient and young boreal forest stands. Funct. Ecol. 1996, 10, 344–354. [Google Scholar] [CrossRef]
  92. Jönsson, M.T.; Thor, G.; Johansson, P. Environmental and historical effects on lichen diversity in managed and unmanaged wooded meadows. Appl. Veg. Sci. 2011, 14, 120–131. [Google Scholar] [CrossRef]
  93. James, P.W.; Hawksworth, D.L.; Rose, F. Lichen communities in the British Isles: A preliminary conspectus. In Lichen Ecology; Seaward, M.R.D., Ed.; Academic Press: London, UK, 1977; pp. 295–413. [Google Scholar]
  94. Nascimbene, J.; Marini, L.; Nimis, P.L. Influence of tree species on epiphytic macrolichens in temperate mixed forests of northern Italy. Can. J. For. Res. 2009, 39, 785–791. [Google Scholar] [CrossRef]
  95. Ronnås, C.; Werth, S.; Ovaskainen, O.; Várkonyi, G.; Scheidegger, C.; Snäll, T. Discovery of long-distance gamete dispersal in a lichen-forming ascomycete. New Phytol. 2017, 216, 216–226. [Google Scholar] [CrossRef] [PubMed] [Green Version]
  96. Diamond, J.M. Distributional ecology of New Guinea birds. Science 1973, 179, 759–769. [Google Scholar] [CrossRef]
  97. Flügge, A.J.; Olhede, S.C.; Murrell, D.J. A method to detect subcommunities from multivariate spatial associations. Methods Ecol. Evol. 2014, 5, 1214–1224. [Google Scholar] [CrossRef] [Green Version]
  98. Ellis, C.J.; Eaton, S.; Theodoropoulos, M.; Elliot, K. Epiphyte Communities and Indicator Species. An Ecological Guide for Scotland’s Woodlands; Royal Botanic Gardens Edinburgh: Edinburgh, UK, 2015; ISBN 978-1-910877-01-2. [Google Scholar]
  99. Rose, F. Ancient British woodlands and their epiphytes. Br. Wildl. 1993, 5, 83–93. [Google Scholar]
  100. Paltto, H.; Nordberg, A.; Nordén, B.; Snäll, T. Development of secondary woodland in oak wood pastures reduces the richness of rare epiphytic lichens. PLoS ONE 2011, 6, e24675. [Google Scholar] [CrossRef]
  101. Outhwaite, C.L.; Gregory, R.D.; Chandler, R.E.; Collen, B.; Isaac, N.J.B. Complex long-term biodiversity change among invertebrates, bryophytes and lichens. Nat. Ecol. Evol. 2020, 4, 384–392. [Google Scholar] [CrossRef]
  102. Giordani, P.; Malaspina, P.; Benesperi, R.; Incerti, G.; Nascimbene, J. Functional over-redundancy and vulnerability of lichen communities decouple across spatial scales and environmental severity. Sci. Total Environ. 2019, 666, 22–30. [Google Scholar] [CrossRef] [Green Version]
Figure 1. A map of London with the three parks surveyed outlined in bold. (1) Richmond Park, (2) Regent’s Park and (3) Victoria Park. Inset shows the location of London (bold outline) within the UK. Map produced with QGIS v.3.10.
Diversity 12 00330 g001
Figure 2. Histogram showing the total abundance of all 24 lichen species across all parks. Total abundance represents the total number of quadrats occupied on all trees. Physcia spp. represents Physcia adscendens and P. tenella combined.
Diversity 12 00330 g002
Figure 3. Scatterplots showing the relationship between epiphytic lichen diversity (LDV) and host Quercus circumference, number of trees within 10 metres and Quercus species. Quercus cerris, Q. rubra and Q. palustris were collapsed into one factor level (blue) due to a lack of significant difference between them. (a) Lichen diversity (LDV + 1) significantly decreased with increasing tree circumference; (b) LDV significantly decreased with increasing number of trees within 10 metres. Tree species significantly affects LDV with Q. robur (red) hosting higher lichen diversity than the collapsed group of Q. cerris, Q. rubra and Q. palustris (blue). No significant interaction is seen between tree circumference, number of trees within 10 m and tree species. Fitted regression lines and 95% confidence intervals (coloured boxes around regression lines) were predicted using the minimum adequate model shown in Table 1.
Diversity 12 00330 g003
Figure 4. Epiphytic lichen communities from paired species co-occurrence probabilities calculated via the Veech et al. (2013) method. (a) Species co-occurrence matrix showing significant positive (blue), negative (yellow) and random (grey) co-occurrences (p < 0.025); (b) visual representation of matrix in (a) showing the emergence of two separate lichen communities, with positive co-occurrences within communities and negative between and (c) result of partitioned around medoids clustering analysis using cooccur effect sizes of paired-species co-occurrences and grouping species pairs in to k = 2 clusters.
Diversity 12 00330 g004
Table 1. Estimated regression parameters, 95% confidence intervals, standard errors, t values and p-values for the minimum adequate Gamma distributed model. Nagelkerke’s R2 = 0.546, Cox and Snell’s R2 = 0.496. Intercept = combined factor levels of Quercus cerris/rubra/palustris.
Estimate95% CIsStd. Errort Valuep-Value
Intercept1.1180.959–1.2770.08113.818<2 × 10⁻¹⁶
Circumference−0.002−0.003–−0.0020.000−7.4012.04 × 10−11
Quercus Robur0.3240.225–0.4230.0516.422.85 × 10−9
No. Trees 10 m−0.036−0.059–−0.0120.012−2.9030.004

