Article

The Legacy of the Past Logging: How Forest Structure Affects Different Facets of Understory Plant Diversity in Abandoned Coppice Forests

1
School of Biosciences and Veterinary Medicine, University of Camerino, Via Pontoni 5, I-62032 Camerino, MC, Italy
2
Department of Sciences, University of RomaTre Roma, V.le Marconi 446, I-00146 Rome, Italy
*
Author to whom correspondence should be addressed.
Diversity 2020, 12(3), 109; https://doi.org/10.3390/d12030109
Submission received: 31 January 2020 / Revised: 18 March 2020 / Accepted: 19 March 2020 / Published: 20 March 2020

Abstract

:
Predicting how biodiversity affects ecosystem functioning requires a multifaceted approach based on the partitioning of diversity into its taxonomic and functional facets and thus redundancy. Here, we investigated how species richness (S), functional diversity (FD) and functional redundancy (FR) are affected by forest structure. Sixty-eight abandoned coppice-with-standards plots were selected in two mountain areas of the Apennine chain. We performed linear models to quantify the influence of structural parameters on S, FD and FR of clonal traits. Each diversity facet was affected differently by structural parameters, suggesting a complex interweaving of processes that influence the understory layer. Namely, tree layer density influences S, the height of the standards affects the lateral spread and persistence of clonal growth organs, and diameter of standards affects the FD of the number of clonal offspring. Opposite relationships compared to FD was found for the FR, suggesting how clonal traits play a key role in species assemblage. The observation that structural parameters exert opposite impact on FR seems to indicate a counterbalance effect on ecosystem stability. Multifaceted approaches yield a better understanding of relationship between forest structure and understory, and this knowledge can be exploited to formulate indications for more sustainable management practices.

1. Introduction

The continual loss of biodiversity induced by human-driven global changes is one of the major concerns of ecologists [1,2,3], and the challenge of predicting how biodiversity changes may affect ecosystem functioning has yet to be resolved [4]. For many years, the number of species (species richness) has been considered the only measure able to link biodiversity to ecosystem functioning [5,6], and it was assumed that the lack of niche complementarity is a prerequisite for species coexistence. This assumption led to the widespread concept that an increase in ecosystem functioning should be mirrored by an increase in the number of species [5]. However, evidence about such a relationship is scarce and contradictory [7]. In the last two decades, a growing body of evidence has indicated that species affect ecosystem functions via their traits [8,9,10]; these reports were summarized in review papers e.g., [11,12]. The fact that coexisting species with similar traits are present in a given assemblage indicates that there is not a general relationship between species richness and ecosystem functions, and thus it is impossible to attribute variations in ecosystem function exclusively to taxonomic causes [7,8,13,14]. Indeed, the decreasing number of species will not necessarily affect a given ecosystem function, if the persistence of other species having the same strategies is ensured. On the contrary, the loss of some species bearing unique trait values is expected to alter the ecosystem functions dramatically [7,8,15]. The maintenance of ecosystem functioning under species loss is known as functional redundancy [16]. A community with high functional redundancy may be marked by greater temporal stability (that is, greater “resilience”) than one with low functional redundancy and be protected against the loss of such ecosystem functions as biomass productivity or nutrient fluxes (that is, it may have greater “resistance”) [17,18,19]. Knowledge of the functional redundancy level of communities is essential for conservation planning to prevent alterations in ecosystem functioning, as well as for evaluating the sustainability of management practices.
Among the global changes, land use is widely considered one of the main drivers leading to biodiversity loss [1]. Starting in the 19th century, many European temperate and Mediterranean forests were managed prevalently with a practice defined as “coppice-with-standards” (hereafter “CWS”), mainly to obtain firewood and charcoal, and to provide grazing areas for livestock [20,21,22]. In a CWS system, young shoots are logged on a short rotation and new shoots re-sprout vegetatively from dormant buds on the cut stumps, while a variable number of trees are left uncut (hereafter “standards”) for one or more rotation cycles, in order to ensure seed production [23]. In addition, standards can be used as timber woods [24]. After felling, non-linear phases occur and lead from the initial open habitat to a dense and patchy shrub layer. Over time, a complex tree stand with vertical and horizontal heterogeneity is formed as standards grow and new shoots are formed through agamic propagation [22].
This management practice is particularly widespread along the Apennine chain in Italy [22,25]. Silvicultural management that sustains biodiversity and also ecosystem processes has become a major challenge for the forestry industry [26]. In this context, the understory vegetation is a key element for judging the effectiveness of forest management practices [22,27]. In fact, forest-floor plant communities influence nutrient cycles and are sensitive to environmental and dynamic changes [28,29,30]. It has been suggested that old coppice forest conditions generate a highly selective environment that shapes understory communities [31,32]. In fact, the main ecological drivers affecting the understory are the closure of canopy cover and the parallel decrease in light availability, together with the increase in spatial heterogeneity of soil nutrients and water [22,33]. Under these conditions, only species bearing specific traits can persist [32,34]. As a result, old coppice forests generally have lower levels of understory species diversity and richness than recently logged forests [22,33]. Furthermore, old coppice forests are characterized by plants with similar functional strategies (functional convergence) to cope with reduced light conditions and increased spatial heterogeneity of resources [32].
It should be noted that these observations are the outcome of the comparison of different studies or the use of each diversity metric individually. Instead, there is a dearth of studies that have combined both taxonomic and functional diversity in the single metric of functional redundancy. Functional investigations examined mainly aboveground traits related to leaves, stems and seeds [35], or belowground traits related to fine-roots and mycorrhizal associations [36]. These traits capture functions related to resource (asymmetric) competition and growth rate, but fail to explain other key functional dimensions such as space occupancy and on-spot persistence [37,38,39]. Clonal traits are the best candidate for capturing these dimensions [40,41]. In fact, clonal traits of herbaceous species are fundamental in forest ecosystems [38,42,43,44] and a number of studies have documented the increasing importance of clonal strategies in coppice forests [34,43,45]. This importance could be mainly linked to the reduction in sexual reproduction under closed canopy and the need to cope with the high spatial heterogeneity of resources [42,43,46].
Most of our knowledge on the functioning of forest ecosystems derives from studies comparing the effect of different management practices on the aboveground functional dimension of the understory e.g., [27,34,47,48] or focusing on changes over time (i.e., chronosequences) e.g., [22,30,45,49]. However, marginal mountain regions are experiencing ongoing processes of abandonment of traditional management practices begun after World War II, and large areas that were once traditionally managed as coppice-with-standards are now left to spontaneous vegetation re-growth [34,50,51]. These abandoned CWS stands that are over their turn are currently called “old CWS” [23,34]. Researchers have set out on a new quest to understand how the structural parameters deriving from past management practices (e.g., the height and diameter of standards; tree layer cover, etc.) affect the current understory vegetation: this objective is all the more compelling because of the need to identify economically acceptable and sustainable management practices, in the light of a potential revival in coppice management practices.
The present study investigated the effect of forest structure on different facets of understory plant diversity, focusing on clonal traits, in abandoned Apennine beech (Fagus sylvatica) forests previously managed as CWS. Specifically, we assessed whether stand structural parameters affect differently: (1) taxonomic diversity, (2) functional diversity, and (3) functional redundancy. Moreover, we sought to ascertain whether the relationships between these facets of diversity and stand structure are consistent with study areas characterized by different floristic composition.

2. Materials and Methods
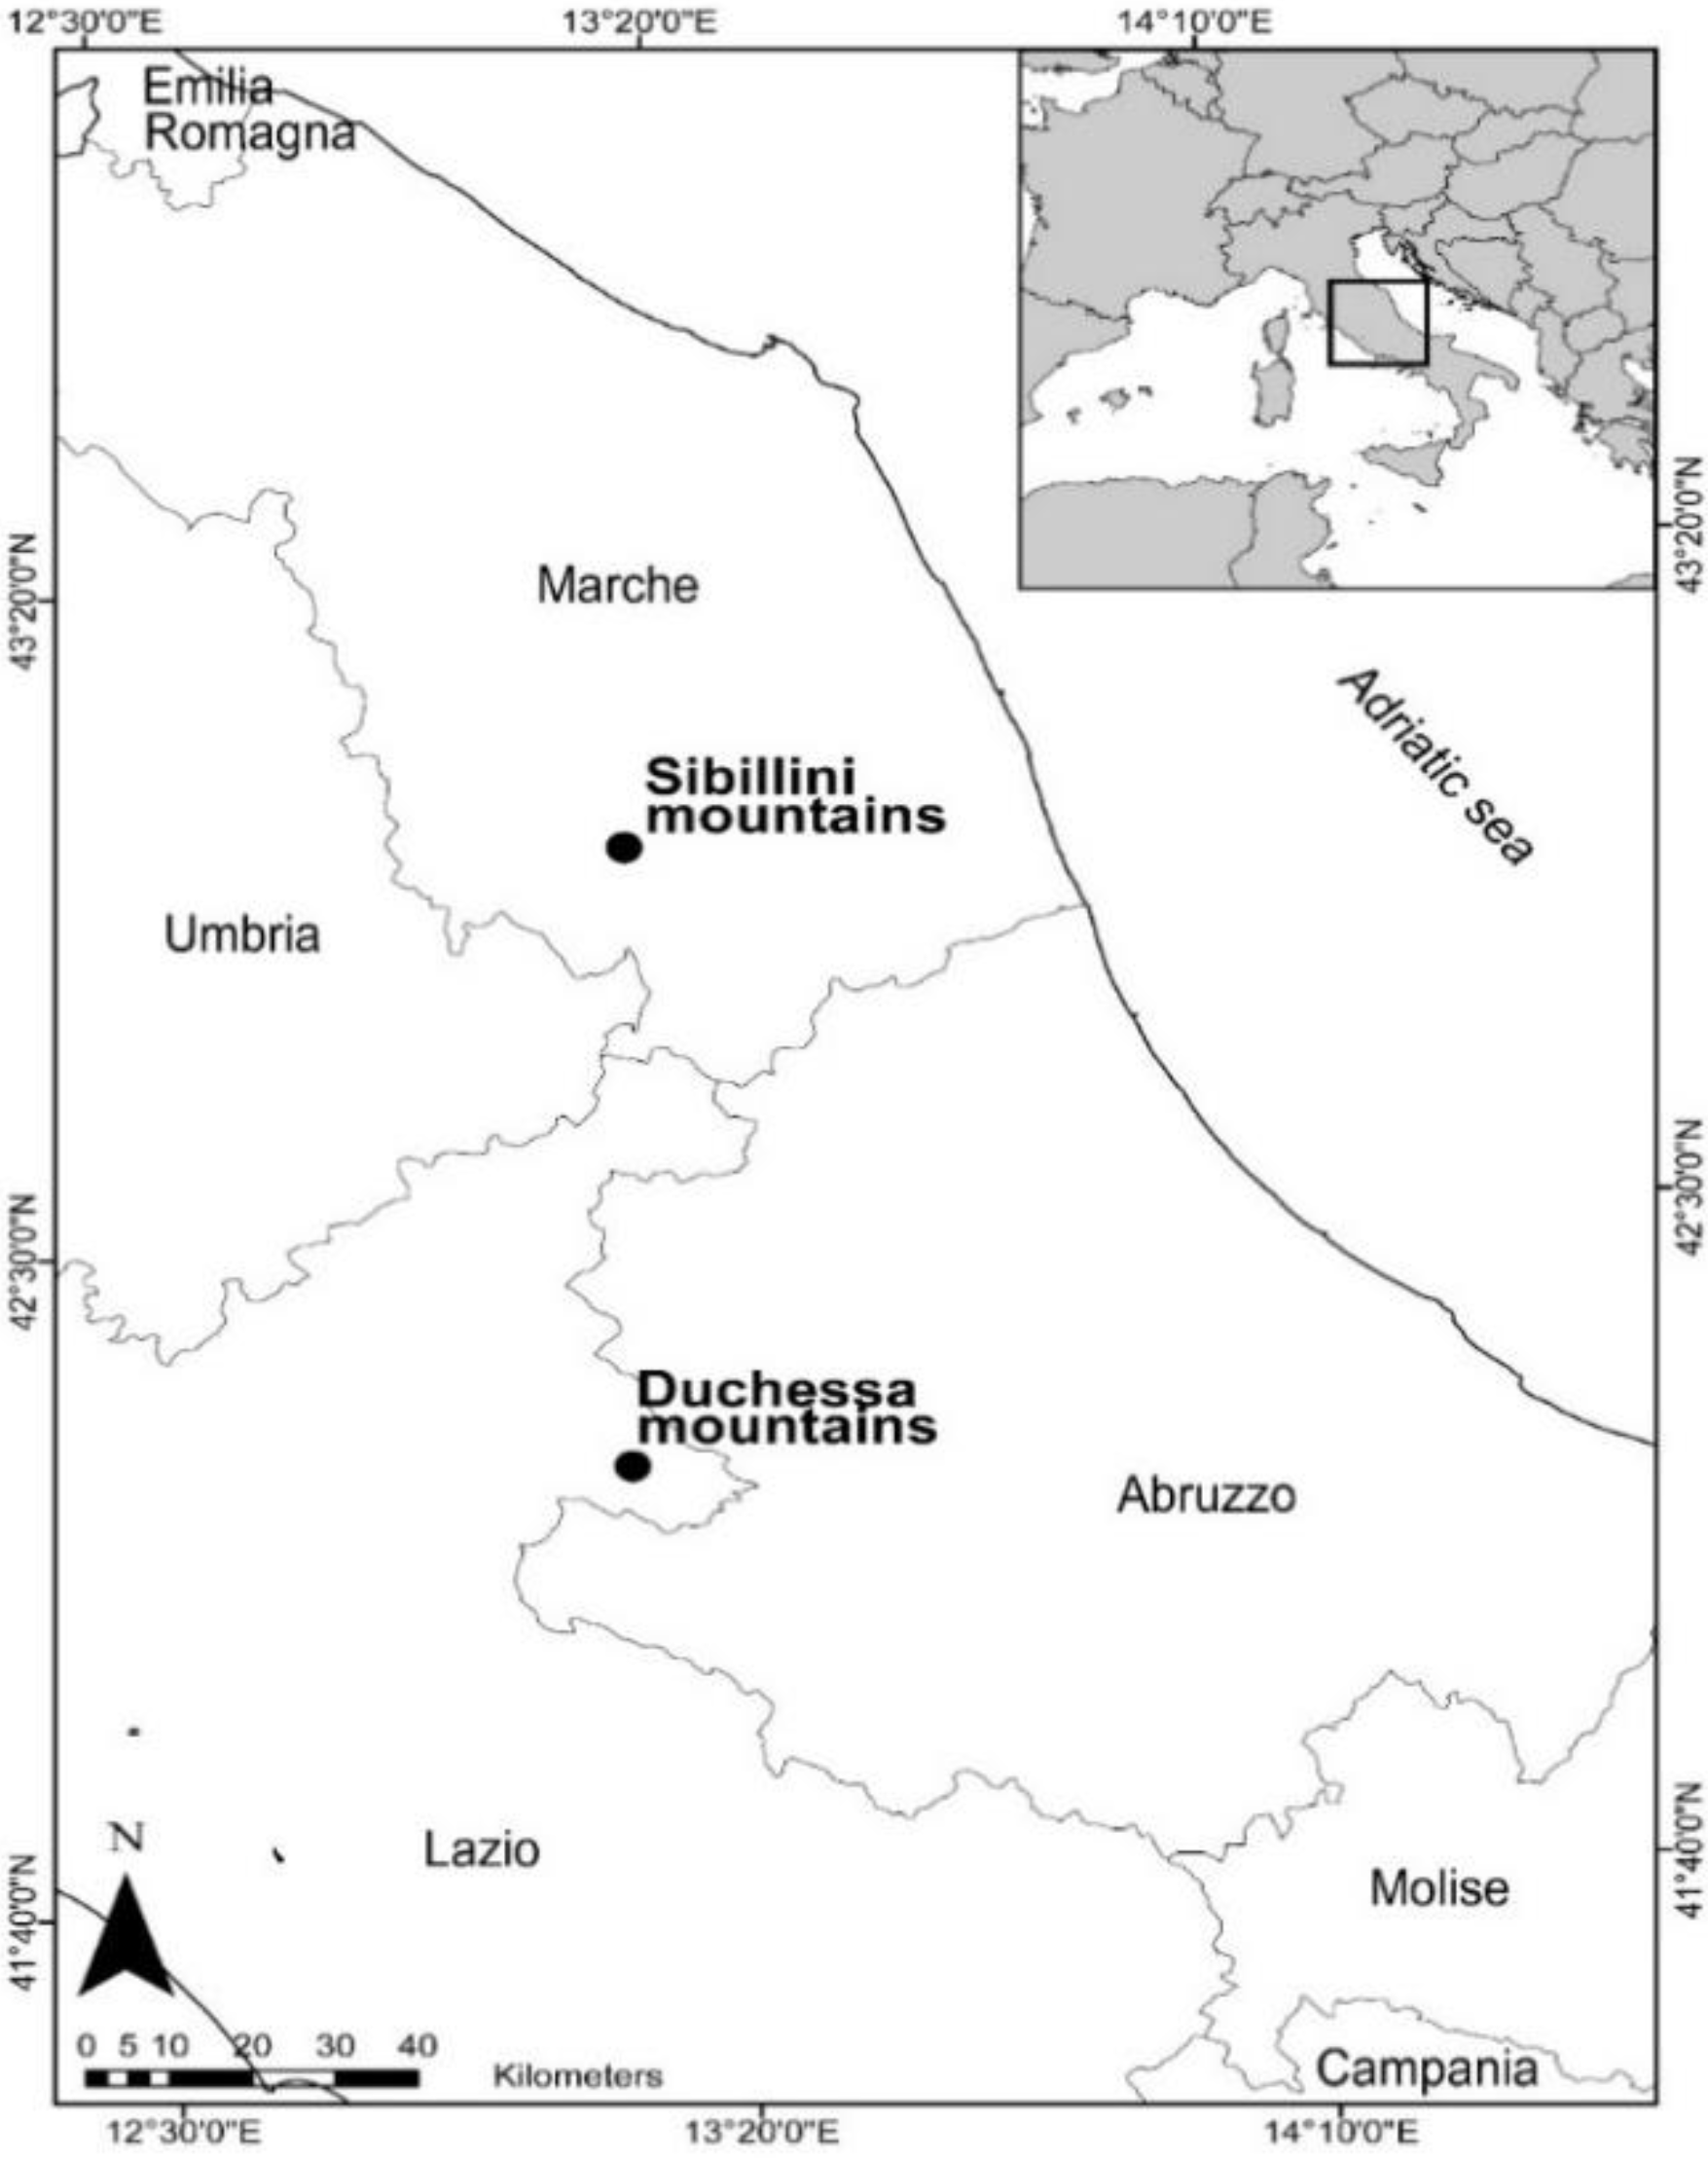
2.1. Study Area

We studied the vascular plants in the understory vegetation of two montane beech forest areas, both located in the Central Apennines (Central Italy), namely, the Montagne della Duchessa (in the western part of the Velino-Sirente chain in the Lazio Region), and the Monti Sibillini chain (in the southern part of the Marche Region) (Figure 1). The Central Apennines are characterized by a sub-Mediterranean climate and a limestone substrate [30,34]. In both areas examined, the forests landscape is dominated by beech belonging to the Fagion sylvatica alliance, but some are the microthermal form (Cardamino kitaibelii-Fagetum sylvaticae association) and others the thermophylous form (Lathyro veneti-Fagetum sylvaticae association) [52,53,54]. Nevertheless, the localities differ in their floristic composition (Table S1). Traditionally, these Apennine forests were managed as coppice-with-standard (CWS) for the production of charcoal and timber [55,56], but with the significant rural exodus that began after World War II and has persisted over time, traditional land use has declined drastically [51], with the result being that most of the previously CWS managed forest stands have been left unexploited [22], becoming “old CWS” (>38 years for the Lazio Region and >40 years for the Marche Region, according to regional laws) [23,34]. As the Central Apennines are characterized by similar climate, geology and land-use history (CWS), these selected beech forest areas could be considered representative of the montane beech forest system of Central Italy. Moreover, many beech forests included in the study area belong to the 9210* Habitat (Apennine beech forests with Taxus and Ilex EU 92/43 Directive) of the Natura 2000 Network [34].

2.2. Vegetation Data

From a pool of 160 beech forest plots (80 in each region) [23,34], we selected only those plots characterized by similar past forest management and age groups (old CWS) sensu [42], with similar environmental conditions in terms of bedrock (limestone) [54] and canopy closure cover (>90%). In total, we considered 68 plots (20 m × 20 m) of old CWS, 30 for the Lazio Region and 38 for the Marche Region. Vegetation data consist of cover-abundance values of the plant species of the herbaceous layer (visual estimates in percentage scale). A total of 210 species were recorded in the study areas. In each plot, all trees with a diameter at breast height (1.3 m above ground level) ≥ 2.5 cm were censused. Trees were then classified and grouped according to the three physiognomic forest layers, termed emergent trees (standards; individuals with crown emerging from the canopy), dominant trees (trees composing the crown dominant layer), and subordinate trees (trees with crown totally or partially dominated by the upper canopies) [53]. Several structural parameters were then calculated, including the total number of trees in 400 m2 (total density), the number of standards in 400 m2 (emergent density), the number of dominant trees on 400 m2 (dominant density) and the number of subordinate trees in 400 m2 (subordinate density). In addition, we retrieved the height (m, measured with a laser rangefinder) and diameter (cm, at breast height) of the standards [23,34].

2.3. Trait Data

We retrieved data on clonal traits (lateral spread, clonal offspring and persistence of clonal growth organ) from an available database [41] (Table 1). Lateral spread (LS, cm/year) is the distance a clonal organism spreads each year; the number of clonal offspring (NCO, n/year) is defined as the number of offspring shoots per parent shoot per year. The persistence of clonal growth organs (PCGO, year) is the lifespan of the physical connection between parental and clonal shoots. Compared to traits referred to the leaf-height-seed (LHS) scheme, clonal traits capture different functional dimensions that have received less attention but that affect plant persistence, such as space occupancy, resource foraging and sharing, and ability to recover after injury [37]. Values for clonal traits were available for all those species whose relative cumulative cover reached 80% of the total cover of all species. This trait sampling approach is suggested for areas where there is a low turnover of species (i.e., beta diversity) [57,58] as is the case in our study (β diversity values of 7.6 expressed as β = γ/mean α, considering Jost correction as recommended by de Bello et al. [59].

2.4. Calculation of Indices

We calculated two structural diversity indices to quantify the vertical and horizontal structure heterogeneity (heights and diameters) of the old CWS standards. The Shannon index (Sh) was applied to the proportion of standards in each size class after dividing standard diameters into 12 classes of 8 cm (ShDBH) and standard height into 11 classes of 3 m (ShH) according to the following formula:
S h = ( l n p i ) p i
where pi is the relative abundance of standards in the ith size class [60]. To calculate the Shannon index, we used the natural logarithm [61].
To assess the community stability and recovery we followed the framework proposed by Ricotta et al. [14]. This approach involves the use of a common methodological measure, Rao’s quadratic entropy, for calculating different facets of biodiversity [59]. The Rao index is defined as the expected dissimilarity between two individuals of a given assemblage selected at random with replacement:
Q = i , j S   d i j p i p j
where S is the number of species, dij is the distance or dissimilarity between the i-th and j-th species, pi and pj are the proportions of i-th or j-th species in the sampling unit, so that pi pj is the product of the species’ relative abundances (if all species are equally abundant pi = 1/S). Taxonomic diversity assumes that the dissimilarity distance between species is fixed (dij = 1 for all pairs of species) unless i = j (dij = 0), and this index represents the well-known Simpson index of dominance (D). Instead, in the calculation of functional diversity (FD), the parameter dij may vary between 0 (two species have exactly the same trait values) and 1 (two species have completely different trait values). Consequently, the Simpson index represents the upper limit that functional diversity may achieve [14]. Having calculated the Q and D for each plot, we are able to quantify the functional redundancy (FR), defined as:
R = 1 Q D
As stated above, since D represents the maximum values that Q may achieve, the R index is unaffected by species richness. The calculation of D, Q and R was performed at plot level with the uniqueness function provided by Ricotta et al. [14], using unweighted species data, while the Gower distance was used as a measure of distance (dij). However, since we focused on presence absence data, we considered species richness (S) as a measure of taxonomic diversity [61].

2.5. Data Analysis

To assess the effect of different structural parameters on the different components of diversity (species richness, functional diversity and functional redundancy) for each clonal trait, we used the approach proposed by Zuur et al. [62]. Firstly, we selected the explanatory variables that most contributed to the model. Secondly, we used the Akaike information criterion (AIC) approach to compare the linear model with the mixed model, selecting the location as the random effect. For the final best model with two or more predictors, we checked their multicollinearity and we removed the predictor or predictors showing high multicollinearity (i.e., values > 10 according to the variance inflation factor). Model assumptions (normality, homoschedasticity and independence of the residuals) were evaluated in graphs. We used this procedure for each component of diversity (species richness, functional diversity, and functional redundancy) of each clonal trait. Before computing all the analyses, predictors were standardized with the decostand function, selecting the “standardize” method to obtain comparable coefficients. However, since functional diversity may be affected by species diversity, we calculated the standardized effect size (SES) by shuffling the species traits 999 times [58,63]. Positive SES means higher FD observed values compared to random expectation (functional divergence), while negative SES means lower FD values compared to random expectation (functional convergence) [64]. We used both observed FD and SES-FD in these statistical analyses. All the analyses were done in the R environment (R Foundation for Statistical Computing, Vienna, Austria. http://www.R-project.org). Explanatory variables were selected using the glmulti function in the MuMin package, and the mixed model was run with the lme function, while the non-mixed model was run with the gls function, both in the nlme package. Model comparison was performed with anova function (stat package), while multicollinearity was checked with vif function (car package). As the linear models performed with the gls and lm functions (stat package) gave similar results (i.e., the same coefficient values of explanatory variables), we re-fitted the final non-mixed model with the lm function to obtain the R2, since the gls function did not provide it.

3. Results

3.1. Taxonomic Diversity

Concerning the species richness (S), we found that the best fitting model was related to the subordinate density of the trees on 400 m2 (R2 = 19%; AIC = 440; Table 2), with a negative effect.

3.2. Functional Diversity

Since the results of SES-FD are qualitatively the same as the results of non-standardized FD (Table S2; Figure S1), we report and describe here only the non-standardized FD values. For the functional diversity (FD), we found a preferential relationship with the structural parameters of the standards, namely mean diameter and mean height. In detail, the mean height of the standards positively affected both lateral spread (R2 = 7%; AIC = −230; Table 2) and persistence of clonal growth organs (R2 = 7%; AIC = −163; Table 2). The mean diameter of standards and the diversity of these diameters negatively affected the functional diversity of the number of clonal offspring, albeit not significantly in the latter case.

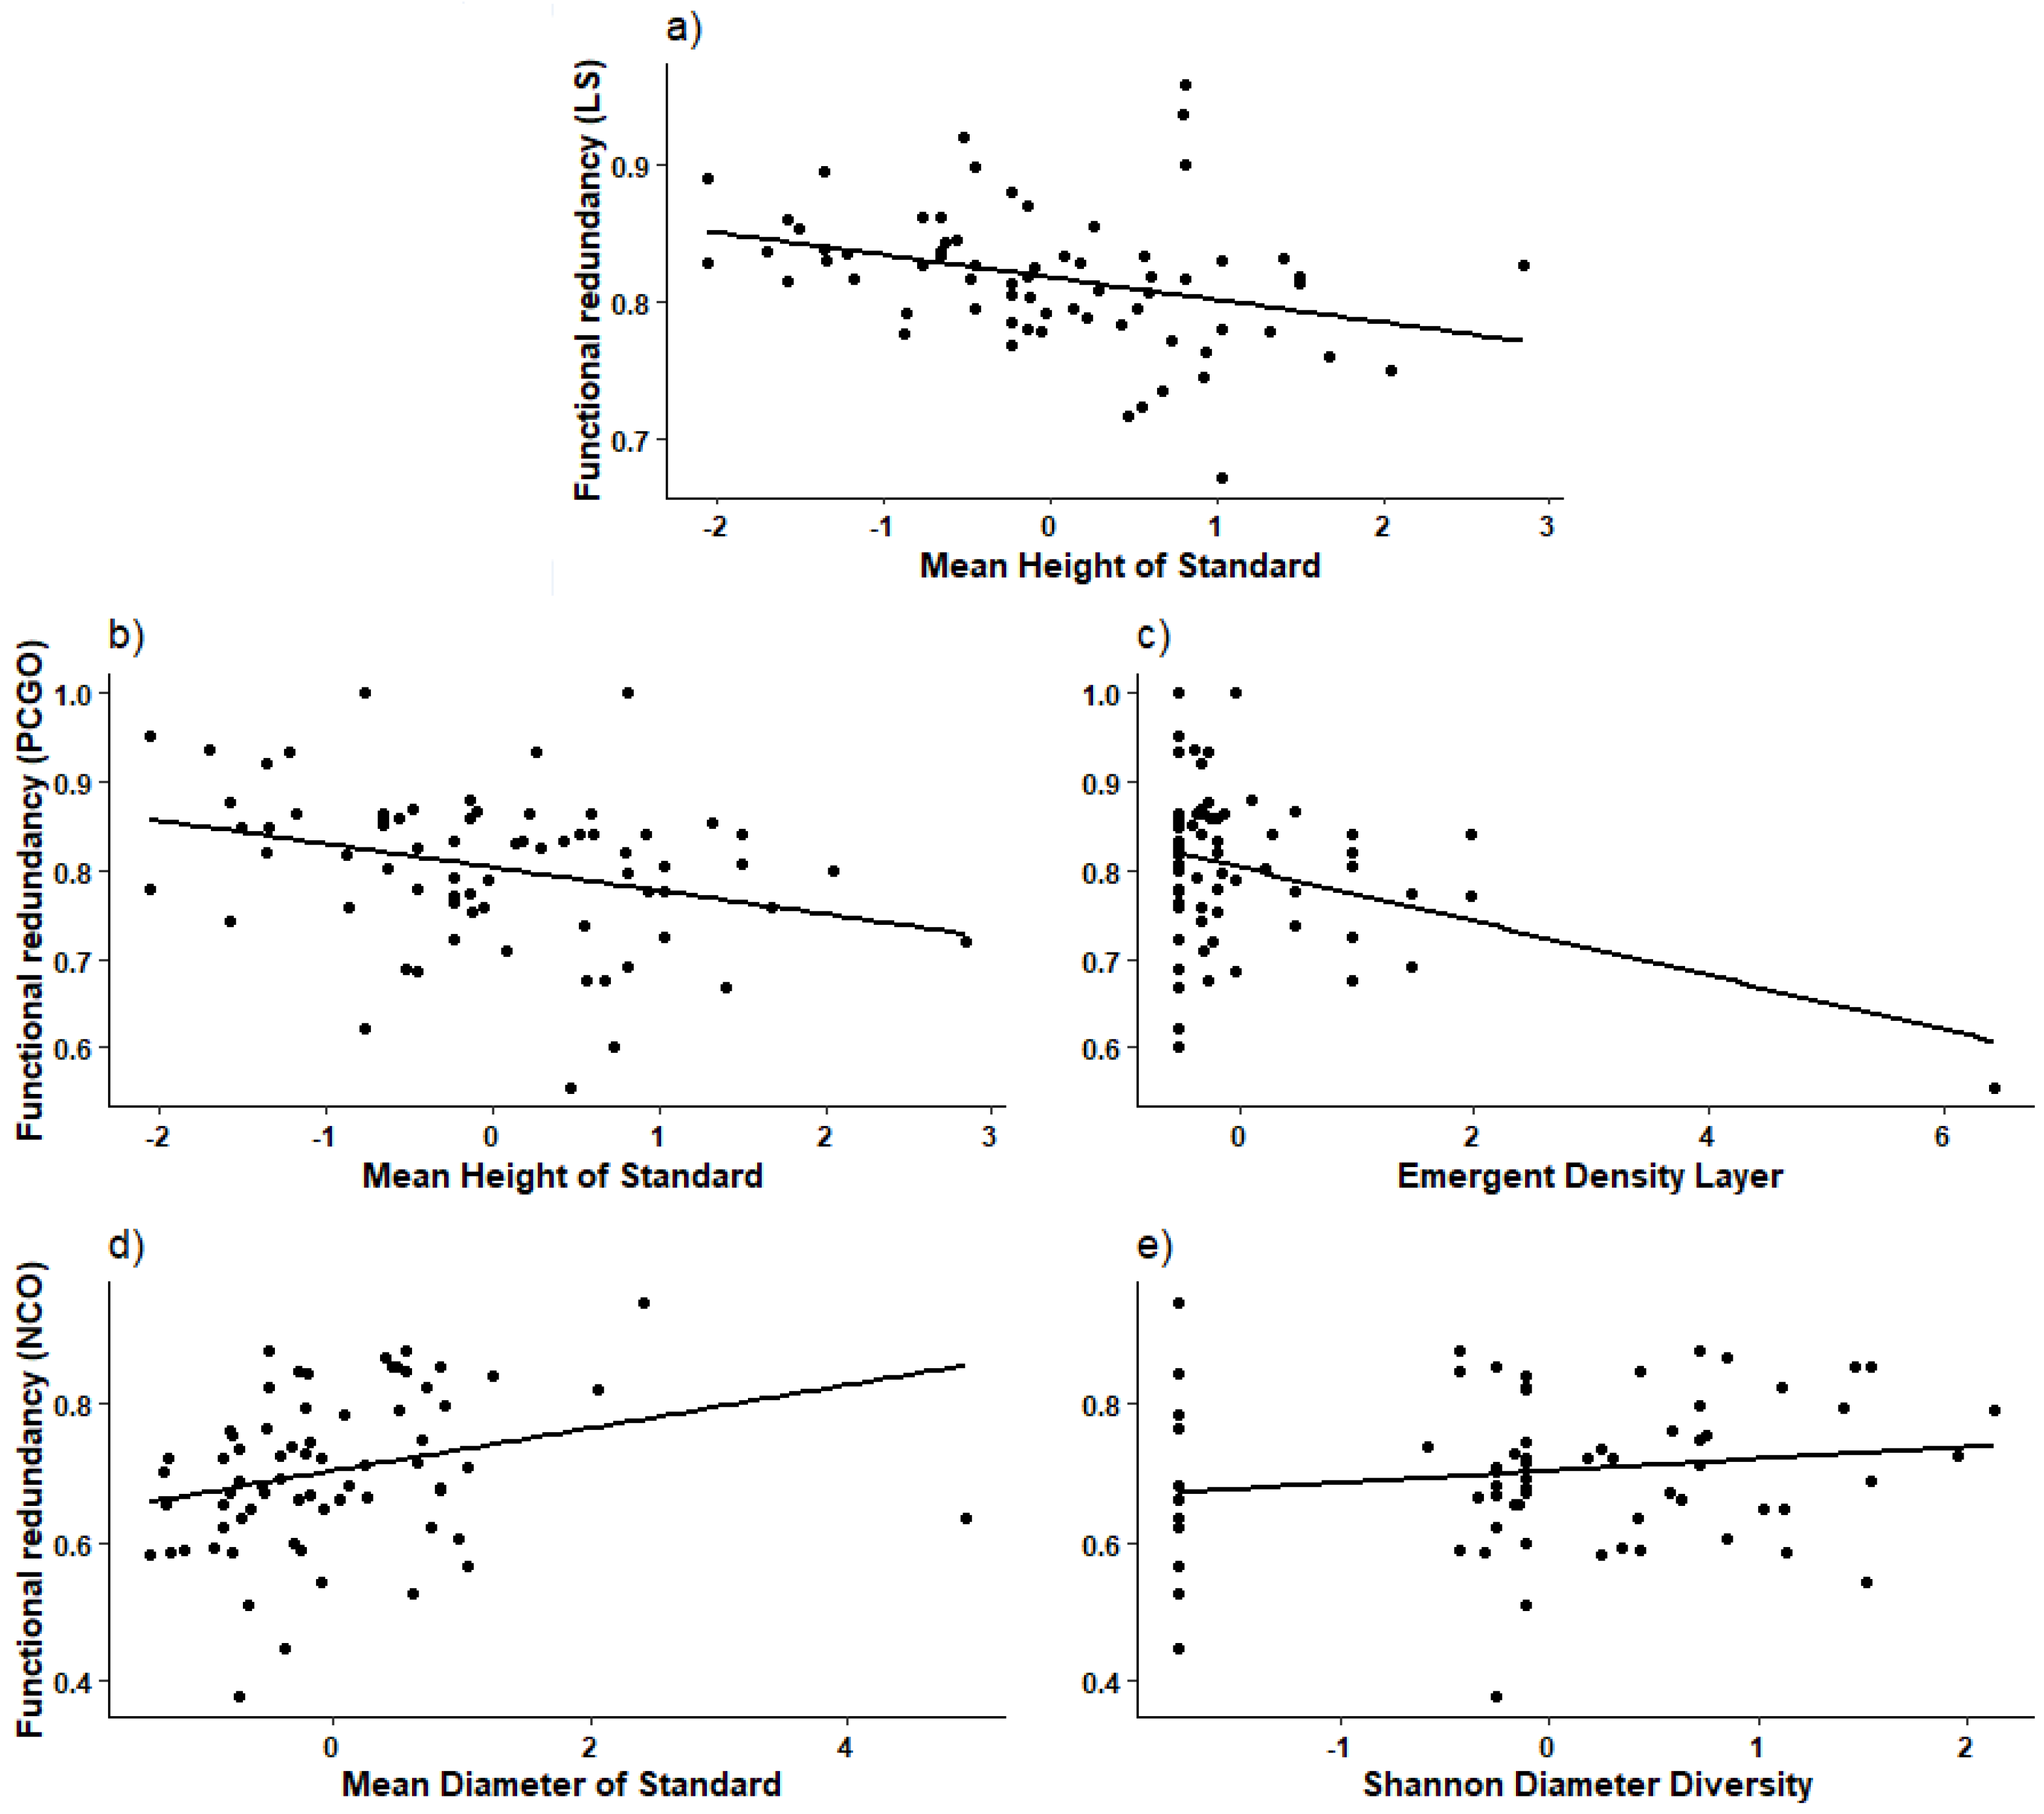
3.3. Functional Redundancy

Regarding functional redundancy, we found that the indices and functional diversity responded to the structural parameters in quite a similar way. Indeed, functional redundancy of lateral spread proved to be negatively affected by the mean height of the standards (Figure 2a) and by subdominant density of the trees on 400 m2, albeit not significantly (R2 = 13%; AIC = −218; Table 2). The index of functional redundancy of persistent clonal growth organs, like its functional diversity counterpart, was affected by mean height of standards, but in this case the association was negative (Figure 2b); similarly, this index was also affected negatively by emergent density of trees on 400 m2 (Figure 2c) (R2 = 16%; AIC = −146; Table 2). Functional redundancy of the number of clonal offspring showed positive relationships with structural features related to the diameter of standards (mean and diversity of diameters), unlike the negative relationships with these parameters seen in the aspect of functional diversity (Figure 2d–e) (R2 = 11%; AIC = −109; Table 2). Finally, for each response variable, the non-mixed model showed better performance compared to the mixed model, i.e., the relationships between diversity indices and structural parameters were consistent in both the Duchessa study area and the Sibillini study area, which have different floristic compositions.

4. Discussion

In this study, we investigated how different facets of understory plant diversity are affected by structural parameters deriving from past management practices (height and diameters of standards; cover of tree layers, etc.). Overall, we found that each facet of understory plant diversity was affected by a different set of structural parameters. In detail, the functional diversity and functional redundancy of clonal traits were mainly affected by the height and diameter of standards, while species richness was influenced only by the density of the tree layers. One of our most interesting results is related to the pattern of functional diversity, and suggests that clonal traits may drive species coexistence in forest ecosystems.
Finally, our results in the Montagne della Duchessa chain are consistent with those in the Monti Sibillini chain, even though the two areas have different floristic composition; in both locations, the relationships between each component of diversity and the significant predictor did not differ.

4.1. Taxonomic Diversity

Our results show a strong decline in species richness with the increase in subdominant tree density in our study areas. Overall, tree density is widely considered a proxy of canopy cover and strongly influences the light regime of the understory layer. High values of canopy cover generate highly selective environments for light capture that filter for shade-tolerant understory species [30,32]. This results in lower values of species richness under closed canopy conditions [22,65]. However, we were surprised to find a negative relationship between species richness and the density of the subdominant tree layer only. This unexpected result highlights the complexity of processes influencing the understory layer. The horizontal distribution of tree stems and the vertical organization of canopies of the subordinate tree layer probably play a role in determining patterns of light quality (the red and infrared spectra of light) and sun flecks, which in turn influence understory species richness [66,67]. However, there is a need for further studies to assess the relationship between light spatial arrangement and understory species richness.

4.2. Functional Diversity

As previously stated, the understory of old coppice forest is generally characterized by the phenomenon of functional convergence, by which species with similar functional strategies cope with the high level of stress conditions under the canopy [32]. In this sense, a key role may be played by taller standards with higher diameters. These standards, by sustaining a well-developed canopy, may increase the recovery of the canopy after logging [Table S3] and therefore impose strong ecological constraints in terms of light penetration and litter amount, for example, on the local understories [45,49]. Our results show that height and diameter of the standards may affect species assemblages differently, according to different plant functions. Standards with greater diameter select for understory species with similar clonal multiplication rate (i.e., functional convergence of number of clonal offspring). On the contrary, taller standards (with very emergent and possibly wider crowns) enhance the variability of understory strategies related to resource foraging (i.e., functional divergence of lateral spread) and sharing (i.e., functional divergence of persistence of clonal organ).
The role these functions may play in species assemblage is still poorly investigated, in particular in forest ecosystems. However, different plant traits capture different aspects of the ecological niche of the species [68]. Therefore, we hypothesize that while some particular traits may be subjected to a filtering effect in forest ecosystems [32], other traits may diverge [69], enhancing the spectrum of community functional strategies. Overall, patterns of functional divergence have been widely linked to the effect of competitive processes (i.e., limiting similarity) [70] and it is likely that the presence of functionally dissimilar species may also be the result of competition occurring within the plots. On the other hand, some authors have recently proposed that functional divergence may also be the result of micro-environmental heterogeneity. Indeed, variation in soil features may enhance functional differentiation, since functionally different species might occupy different micro-habitats within the studied assemblage [71,72]. In the studied forest ecosystems, the patterns of functional divergence may be more connected to the heterogeneous distribution of resources [33]. This concept seems to be supported by the fact that competitive processes take place on a very small scale [70], while for a plot size of several meters, environmental features overcome the role of competitive processes [39,40]. Finally, our approach based on the use of presence/absence data may minimize the role of biotic interaction [39]. Further fine-scale investigations are needed to assess the reasons behind functional divergence for some clonal traits in our old coppice forest understories.

4.3. Functional Redundancy

While the literature offers a variety of studies of taxonomic and functional diversity, there is a dearth of works on functional redundancy based on this method of calculation (i.e., Rao’s quadratic entropy) [14], and thus we lack the opportunity to compare the patterns detected in our study with those observed by others. Overall, we found that functional redundancy and functional diversity had opposite trends. This may be explained by our observation of decreased functional diversity uncoupled from a variation in the species number (Table 2), such that, in a process of species turnover, the number of species that disappear is counterbalanced by the number of new species entering the community. Moreover, these new species showed a decrease in functional diversity in relation to number of clonal offspring, and an increase in functional diversity in relation to lateral spread and persistence of clonal growth organs, and thus the functional redundancy tends to increase and decrease, respectively. Functional redundancy is widely associated with ecosystem stability: variation in the functional redundancy reflects variation in the stability of those ecosystem processes provided by such traits, mainly carbon sequestration and soil fixation [73]. Therefore, the observation that structural parameters have opposite impacts on these ecosystem processes seems to suggest, at least in part, that they exert counterbalanced effects on the carbon sequestration and soil fixation provided by forest-floor species (Table 2).

5. Conclusions

A clear understanding of how understory plant communities respond to forest structure is essential for the development of suitable management practices. In this study, we emphasized that this insight could be achieved by analyzing the taxonomic and functional facets of diversity, not only singly, but also in combination (i.e., functional redundancy). Indeed, this approach makes it possible to assess the effects that biotic and abiotic features may have on each aspect of diversity, as well as on the stability of the ecosystem [14]. Indeed, we found that while tree density influenced species richness only, the features of the standards (in terms of height and diameter) affected the understories functioning. Thus, in sight of a possible renewal of coppicing, we suggest that in their efforts to maintain the functioning of the ecosystem, forest managers and planners should take into consideration the structural parameters of the standards and their spatial heterogeneity. Also, in assessing the effects of their management practices on plant diversity, we suggest they should simultaneously evaluate a variety of measurements of diversity, instead of relying exclusively on taxonomic metrics [22,74]. In this study, we also stressed the role that clonal traits may play in promoting species coexistence in the forest understory.
A possible limitation of this study lies in the fact that it used (a) presence/absence data and (b) plant functional traits related to a restricted (but largely unexplored) spectrum of functions, namely, clonal traits. Further investigations considering species abundance data, and including a larger spectrum of plant traits, such as plant height, specific leaf area and seed mass, are needed to have a better understanding of the effect of forest structure (including standards) on the understory plant diversity in old coppice forests.

Supplementary Materials

The following are available online at https://www.mdpi.com/1424-2818/12/3/109/s1, Figure S1: Relationship between standardized effect size of functional diversity of clonal traits and structural parameters. Table S1: Comparison of the floristic composition of the two locations. Table S2: Comparison between functional diversity and standardized functional diversity. Table S3: Correlation analysis between structural parameters of standards and canopy cover at the stand level.

Author Contributions

Conceptualization, A.B. and S.C.; methodology, A.B.; formal analysis, A.B.; writing—original draft preparation, A.B., S.C.; writing—review and editing, A.B., S.C., R.C., M.C.; supervision, M.C. and R.C. All authors have read and agreed to the published version of the manuscript.

Funding

This research received no external funding.

Acknowledgments

The authors would like to thank Carlo Ricotta for his valuable methodological advice, Flavio Marzialetti for the figure of the study area, Sheila Beatty for editing the English usage in the manuscript, Andrea Scolastri and Marco Cervellini for the data collection, and the anonymous reviewers for their valuable input.

Conflicts of Interest

The authors declare no conflict of interest

References

  1. Sala, O.E.; Chapin, F.S.; Armesto, J.J.; Leemans, R. Global biodiversity scenarios for the year 2100. Science 2000, 287, 1770–1774. [Google Scholar] [CrossRef]
  2. Hoegh-Guldberg, O.; Hughes, L.; McIntyre, S.; Thomas, C.D. Assisted colonization and rapid climate change. Science 2008, 321, 345–346. [Google Scholar] [CrossRef] [PubMed]
  3. Barnosky, A.D.; Matzke, N.; Tomiya, S.; Mersey, B. Has the Earth’s sixth mass extinction already arrived? Nature 2011, 471, 51. [Google Scholar] [CrossRef] [PubMed]
  4. Shipley, B.; De Bello, F.; Cornelissen, J.H.C.; Reich, P.B. Reinforcing loose foundation stones in trait-based plant ecology. Oecologia 2016, 180, 923–931. [Google Scholar] [CrossRef] [PubMed]
  5. Díaz, S.; Cabido, M. Vive la difference: Plant functional diversity matters to ecosystem processes. Trends Ecol. Evol. 2001, 16, 646–655. [Google Scholar] [CrossRef]
  6. Balvanera, P.; Pfisterer, A.B.; Buchmann, N.; Schmid, B. Quantifying the evidence for biodiversity effects on ecosystem functioning and services. Ecol. Lett. 2006, 9, 1146–1156. [Google Scholar] [CrossRef] [PubMed] [Green Version]
  7. Carmona, C.P.; Azcárate, F.M.; de Bello, F.; Peco, B. Taxonomical and functional diversity turnover in Mediterranean grasslands: Interactions between grazing, habitat type and rainfall. J. Appl. Ecol. 2012, 49, 1084–1093. [Google Scholar] [CrossRef]
  8. de Bello, F.; Buchmann, N.; Casals, P.; Lepš, J.; Sebastià, M.T. Relating plant species and functional diversity to community δ 13 C in NE Spain pastures. Agric. Ecosyst. Environ. 2009, 131, 303–307. [Google Scholar] [CrossRef]
  9. Pérez-Harguindeguy, N.; Diaz, S.; Gamier, E.; Urcelay, C. New handbook for stand-ardised measurement of plant functional traits worldwide. Aust. J. Bot. 2013, 61, 167–234. [Google Scholar] [CrossRef]
  10. Stanisci, A.; Bricca, A.; Calabrese, V.; Cutini, M.; Pauli, H.; Steinbauer, K.; Carranza, M.L. Functional composition and diversity of leaf traits in subalpine versus alpine vegetation in the Apennines. AoB Plants 2020. [Google Scholar] [CrossRef] [Green Version]
  11. Funk, J.L.; Larson, J.E.; Ames, G.M.; Wright, J. Revisiting the Holy Grail: Using plant functional traits to understand ecological processes. Biol. Rev. 2017, 92, 1156–1173. [Google Scholar] [CrossRef] [PubMed]
  12. Chelli, S.; Marignani, M.; Barni, E.; Chiarucci, A. Plant–environment interactions through a functional traits perspective: A review of Italian studies. Plant Biosyst. 2019, 153, 853–869. [Google Scholar] [CrossRef]
  13. de Bello, F.; Lavorel, S.; Díaz, S.; da Silva, P.M. Towards an assessment of multiple ecosystem processes and services via functional traits. Biodivers. Conserv. 2010, 19, 2873–2893. [Google Scholar] [CrossRef]
  14. Ricotta, C.; de Bello, F.; Moretti, M.; Caccianiga, M.; Cerabolini, B.E.; Pavoine, S. Measuring the functional redundancy of biological communities: A quantitative guide. Methods Ecol. Evol. 2016, 7, 1386–1395. [Google Scholar] [CrossRef] [Green Version]
  15. Laliberté, E.; Wells, J.A.; De Clerck, F.; McNamara, S. Land-use intensification reduces functional redundancy and response diversity in plant communities. Ecol. Lett. 2010, 13, 76–86. [Google Scholar] [CrossRef]
  16. Naeem, S. Species redundancy and ecosystem reliability. Conserv. Biol. 1998, 12, 39–45. [Google Scholar] [CrossRef]
  17. Yachi, S.; Loreau, M. Biodiversity and ecosystem productivity in a fluctuating environment: The insurance hypothesis. Proc. Natl. Acad. Sci. USA 1999, 96, 1463–1468. [Google Scholar] [CrossRef] [Green Version]
  18. Fonseca, C.R.; Ganade, G. Species functional redundancy, random extinctions and the stability of ecosystems. J. Ecol. 2001, 89, 118–125. [Google Scholar] [CrossRef] [Green Version]
  19. Pillar, V.D.; Blanco, C.C.; Müller, S.C.; Duarte, L.D. Functional redundancy and stability in plant communities. J. Veg. Sci. 2013, 24, 963–974. [Google Scholar] [CrossRef]
  20. Oldeman, R.A.A. Forests: Elements of Silvology; Springer: Berlin, Germany, 1990. [Google Scholar]
  21. Decocq, G.; Aubert, M.; Dupont, F.; Bardat, J. Plant diversity in a managed temperate deciduous forest: Understorey response to two silvicultural systems. J. Appl. Ecol. 2004, 41, 1065–1079. [Google Scholar] [CrossRef]
  22. Bartha, S.; Merolli, A.; Campetella, G.; Canullo, R. Changes of vascular plant diversity along a chronosequence of beech coppice stands, central Apennines, Italy. Plant Biosyst. 2008, 142, 572–583. [Google Scholar] [CrossRef]
  23. Cervellini, M.; Fiorini, S.; Cavicchi, A.; Gimona, A. Relationships between understory specialist species and local management practices in coppiced forests–Evidence from the Italian Apennines. For. Ecol. Manag. 2017, 385, 35–45. [Google Scholar] [CrossRef]
  24. Warde, P. Fear of Wood Shortage and the Reality of the Woodland in Europe, c. 1450–1850. In History Workshop Journal; Oxford University Press: Oxford, UK, 2006; pp. 28–57. [Google Scholar]
  25. Nocentini, S. Structure and management of beech (Fagus sylvatica L.) forests in Italy. iFOREST 2009, 2, 105. [Google Scholar] [CrossRef] [Green Version]
  26. Bengtsson, J.; Nilsson, S.G.; Franc, A.; Menozzi, P. Biodiversity, disturbances, ecosystem function and management of European forests. For. Ecol. Manag. 2000, 132, 39–50. [Google Scholar] [CrossRef]
  27. Sabatini, F.M.; Burton, J.I.; Scheller, R.M.; Amatangelo, K.L.; Mladenoff, D.J. Functional diversity of ground-layer plant communities in old-growth and managed northern hardwood forests. Appl. Veg. Sci. 2014, 17, 398–407. [Google Scholar] [CrossRef]
  28. Royo, A.A.; Carson, W.P. On the formation of dense understory layers in forests worldwide: Consequences and implications for forest dynamics, biodiversity, and succession. Can. J. For. Res. 2006, 36, 1345–1362. [Google Scholar] [CrossRef]
  29. Gilliam, F.S. The ecological significance of the herbaceous layer in temperate forest ecosystems. BioScience 2007, 57, 845–858. [Google Scholar] [CrossRef]
  30. Campetella, G.; Botta-Dukát, Z.; Wellstein, C.; Bartha, S. Patterns of plant trait–environment relationships along a forest succession chronosequence. Agric. Ecosyst. Environ. 2011, 145, 38–48. [Google Scholar] [CrossRef]
  31. Lohbeck, M.; Poorter, L.; Lebrija-Trejos, E.; Bongers, F. Successional changes in functional composition contrast for dry and wet tropical forest. Ecology 2013, 94, 1211–1216. [Google Scholar] [CrossRef]
  32. Ottaviani, G.; Götzenberger, L.; Bacaro, G.; Chiarucci, A.; de Bello, F.; Marcantonio, M. A multifaceted approach for beech forest conservation: Environmental drivers of understorey plant diversity. Flora 2019, 256, 85–91. [Google Scholar] [CrossRef]
  33. Bartels, S.F.; Chen, H.Y.H. Is understory plant species diversity driven by resource quantity or resource heterogeneity? Ecology 2010, 91, 1931–1938. [Google Scholar] [CrossRef] [PubMed]
  34. Scolastri, A.; Bricca, A.; Cancellieri, L.; Cutini, M. Understory functional response to different management strategies in Mediterranean beech forests (central Apennines, Italy). For. Ecol. Manag. 2017, 400, 665–676. [Google Scholar] [CrossRef]
  35. Díaz, S.; Kattge, J.; Cornelissen, J.H.; Garnier, E. The global spectrum of plant form and function. Nature 2016, 529, 167. [Google Scholar] [CrossRef] [PubMed]
  36. Laliberté, E. Below-ground frontiers in trait-based plant ecology. New Phytol. 2017, 213, 1597–1603. [Google Scholar] [CrossRef]
  37. Klimešová, J.; Martínková, J.; Ottaviani, G. Belowground plant functional ecology: Towards an integrated perspective. Funct. Ecol. 2018, 32, 2115–2126. [Google Scholar] [CrossRef]
  38. Chelli, S.; Ottaviani, G.; Simonetti, E.; Campetella, G. Climate is the main driver of clonal and bud bank traits in Italian forest understories. Perspect. Plant Ecol. Evol. Syst. 2019, 40, 125478. [Google Scholar] [CrossRef] [Green Version]
  39. Vojktó, A.-E.; Freitag, M.; Bricca, A.; Götzenberger, L. Clonal vs leaf-height-seed (LHS) traits: Which are filtered more strongly across habitats? Folia Geobat. 2017, 52, 269–281. [Google Scholar]
  40. Klimešová, J.; Herben, T. Clonal and bud bank traits: Patterns across temperate plant communities. J. Veg. Sci. 2015, 26, 243–253. [Google Scholar] [CrossRef]
  41. Klimešová, J.; Danihelka, J.; Chrtek, J.; de Bello, F.; Herben, T. CLO-PLA: A database of clonal and bud-bank traits of the Central European flora. Ecology 2017, 98, 1179. [Google Scholar] [CrossRef] [Green Version]
  42. Grime, J.P. Plant Strategies, Vegetation Processes, and Ecosystem Properties; John Wiley & Sons: Hoboken, NJ, USA, 2006. [Google Scholar]
  43. Canullo, R.; Campetella, G.; Mucina, L.; Chelli, S.; Wellstein, C.; Bartha, S. Patterns of clonal growth modes along a chronosequence of post-coppice forest regeneration in beech forests of Central Italy. Folia Geobot. 2011, 46, 271–288. [Google Scholar] [CrossRef]
  44. Canullo, R.; Simonetti, E.; Cervellini, M.; Campetella, G. Unravelling mechanisms of short-term vegetation dynamics in complex coppice forest systems. Folia Geobot. 2017, 52, 71–81. [Google Scholar] [CrossRef]
  45. Catorci, A.; Vitanzi, A.; Tardella, F.M.; Hrsak, V. Regeneration of Ostrya carpinifolia Scop. Forest after coppicing: Modelling of changes in species diversity and composition. Pol. J. Ecol. 2011, 59, 483–494. [Google Scholar]
  46. Song, M.; Dong, M.; Jiang, G. Importance of clonal plants and plant species diversity in the Northeast China Transect. Ecol. Res. 2002, 17, 705–716. [Google Scholar] [CrossRef]
  47. Graae, B.J.; Sunde, P.B. The impact of forest continuity and management on forest floor vegetation evaluated by species traits. Ecography 2000, 23, 720–731. [Google Scholar] [CrossRef]
  48. Aubin, I.; Gachet, S.; Messier, C.; Bouchard, A. How resilient are northern hardwood forests to human disturbance? An evaluation using a plant functional group approach. Ecoscience 2007, 14, 259–271. [Google Scholar] [CrossRef]
  49. Aubin, I.; Ouellette, M.H.; Legendre, P.; Messier, C.; Bouchard, A. Comparison of two plant functional approaches to evaluate natural restoration along an old-field–deciduous forest chronosequence. J. Veg. Sci. 2009, 20, 185–198. [Google Scholar] [CrossRef]
  50. Malavasi, M.; Carranza, M.L.; Moravec, D.; Cutini, M. Reforestation dynamics after land abandonment: A trajectory analysis in Mediterranean mountain landscapes. Reg. Environ. Chang. 2018, 18, 2459–2469. [Google Scholar] [CrossRef]
  51. Bracchetti, L.; Carotenuto, L.; Catorci, A. Land-cover changes in a remote area of central Apennines (Italy) and management directions. Landsc. Urban Plan. 2012, 104, 157–170. [Google Scholar] [CrossRef]
  52. Scolastri, A.; Cancellieri, L.; Iocchi, M.; Cutini, M. Patterns of floristic variation on a montane beech forest in the central Apennines (central Italy). Plant Sociol. 2014, 51, 69–82. [Google Scholar]
  53. Campetella, G.; Canullo, R.; Gimona, A.; Bartha, S. Scale-dependent effects of coppicing on the species pool of late successional beech forests in the central Apennines, Italy. Appl. Veg. Sci. 2016, 19, 474–485. [Google Scholar] [CrossRef] [Green Version]
  54. Mucina, L.; Bültmann, H.; Dierßen, K.; Chytrý, M. Vegetation of Europe: Hierarchical floristic classification system of vascular plant, bryophyte, lichen, and algal communities. Appl. Veg. Sci. 2016, 19, 3–264. [Google Scholar] [CrossRef]
  55. Scolatri, A.; Cancellieri, L.; Iocchi, M.; Cutini, M. Old coppice versus high forest: The impact of beech forest management on plant species diversity in central Apennines (Italy). J. Plant Ecol. 2017, 10, 271–280. [Google Scholar]
  56. Ciancio, O.; Corona, P.; Lamonaca, A.; Portoghesi, L.; Travaglini, D. Conversion of clearcut beech coppices into high forests with continuous cover: A case study in central Italy. For. Ecol. Manag. 2006, 224, 235–240. [Google Scholar] [CrossRef]
  57. Swenson, N.G.; Anglada-Cordero, P.; Barone, J.A. Deterministic tropical tree community turnover: Evidence from patterns of functional beta diversity along an elevational gradient. Proc. R. Soc. B 2011, 278, 877–884. [Google Scholar] [CrossRef] [PubMed] [Green Version]
  58. Bricca, A.; Conti, L.; Tardella, M.F.; Cutini, M. Community assembly processes along a sub-Mediterranean elevation gradient: Analyzing the interdependence of trait community weighted mean and functional diversity. Plant Ecol. 2019, 220, 1139–1151. [Google Scholar] [CrossRef]
  59. de Bello, F.; Lavergne, S.; Meynard, C.N.; Lepš, J.; Thuiller, W. The partitioning of diversity: Showing Theseus a way out of the labyrinth. J. Veg. Sci. 2010, 21, 992–1000. [Google Scholar] [CrossRef]
  60. Bacaro, G.; Ricotta, C.; Marignani, M.; Torri, D.; Chiarucci, A. Using Shannon’s recursivity to summarize forest structural diversity. For. Trees Livelihoods 2014, 23, 211–216. [Google Scholar] [CrossRef]
  61. Daly, A.J.; Baetens, J.M.; De Baets, B. Ecological diversity: Measuring the unmeasurable. Mathematics 2018, 6, 119. [Google Scholar] [CrossRef] [Green Version]
  62. Zuur, A.; Ieno, E.N.; Walker, N.; Saveliev, A.A.; Smith, G.M. Mixed Effects Models and Extensions in Ecology with R; Springer Science & Business Media: Berlin, Germany, 2009; pp. 121–122. [Google Scholar]
  63. Botta-Dukát, Z.; Czúcz, B. Testing the ability of functional diversity indices to detect trait convergence and divergence using individual-based simulation. Methods Ecol. Evol. 2016, 7, 114–126. [Google Scholar] [CrossRef]
  64. de Bello, F. The quest for trait convergence and divergence in community assembly: Are null-models the magic wand? Glob. Ecol. Biogeogr. 2012, 21, 312–317. [Google Scholar] [CrossRef]
  65. Landuyt, D.; Perring, M.P.; Seidl, R.; Taubert, F.; Verbeeck, H.; Verheyen, K. Modelling understorey dynamics in temperate forests under global change–Challenges and perspectives. Perspect. Plant Ecol. Evol. Syst. 2018, 31, 44–54. [Google Scholar] [CrossRef] [PubMed] [Green Version]
  66. Lieffers, V.J.; Messier, C.; Stadt, K.J.; Gendron, F.; Comeau, P.G. Predicting and managing light in the understory of boreal forests. Can. J. For. Res. 1999, 29, 796–811. [Google Scholar] [CrossRef]
  67. Way, D.A.; Pearcy, R.W. Sunflecks in trees and forests: From photosynthetic physiology to global change biology. Tree Physiol. 2012, 32, 1066–1081. [Google Scholar] [CrossRef] [PubMed] [Green Version]
  68. Thuiller, W.; Albert, C.H.; Dubuis, A.; Randin, C.; Guisan, A. Variation in habitat suitability does not always relate to variation in species’ plant functional traits. Biol. Lett. 2009, 6, 120–123. [Google Scholar] [CrossRef]
  69. Kermavnar, J.; Kutnar, L. Patterns of Understory Community Assembly and Plant Trait-Environment Relationships in Temperate SE European Forests. Diversity 2020, 12, 91. [Google Scholar] [CrossRef] [Green Version]
  70. MacArthur, R.; Levins, R. The limiting similarity, convergence, and divergence of coexisting species. Am. Nat. 1967, 101, 377–385. [Google Scholar] [CrossRef]
  71. Conti, L.; de Bello, F.; Lepš, J.; Acosta, A.T.R.; Carboni, M. Environmental gradients and micro-heterogeneity shape fine-scale plant community assembly on coastal dunes. J. Veg. Sci. 2017, 28, 762–773. [Google Scholar] [CrossRef]
  72. de Bello, F.; Vandewalle, M.; Reitalu, T.; Sykes, M.T. Evidence for scale-and disturbance-dependent trait assembly patterns in dry semi-natural grasslands. J. Ecol. 2013, 101, 1237–1244. [Google Scholar] [CrossRef]
  73. Klimešová, J.; Martínková, J.; Pausas, J.G.; Altman, J. Handbook of standardized protocols for collecting plant modularity traits. Perspect. Plant Ecol. Evol. Syst. 2019, 40, 125485. [Google Scholar] [CrossRef]
  74. Chiarucci, A.; Bonini, I. Quantitative floristics as a tool for the assessment of plant diversity in Tuscan forests. For. Ecol. Manag. 2005, 212, 160–170. [Google Scholar] [CrossRef]
Figure 1. Location of the two montane beech forest in the Apennines in Central Italy: Sibillini (Marche Region) and Duchessa (Lazio Region).
Diversity 12 00109 g001
Figure 2. Multiple linear regression between structural parameters and functional redundancy for the Sibillini and Duchessa montane beech forests in the Apennines in Central Italy. (a) Lateral spread (LS) with mean height of standards; (b) persistent clonal growth organ (PCGO) with mean height of standards; (c) PCGO and emergent density layer; (d) number of clonal offspring (NCO) and mean diameter of standards; (e) NCO and Shannon diameter diversity.
Diversity 12 00109 g002
Table 1. List of plant clonal traits considered in this study, their codes and definitions present in CLOPLA3 [41].
TraitTrait CodeTrait Definition
Lateral spreadLSDistance between parental and offspring shoots (cm/year)
Persistence of clonal growth organsPCGOLifespan of the physical connection between mother and daughter shoots (year)
Clonal offspringCONumber of offspring shoots produced per parent shoot per year (n/year)
Table 2. Relationship between the different facets of biodiversity (TD = taxonomic diversity; FD = functional diversity; R= functional redundancy) and the structural features analysed for the Sibillini and Duchessa montane beech forests in the Central Apennines in Italy. Species richness (S) is the measure of taxonomic diversity (TD); Rao’s quadratic entropy raw (Q) is the measure of functional diversity (FD), while combined with Simpson (R) is the measure of functional redundancy (FR) for the clonal traits considered in this study (LS: lateral spread; PCGO: persistence of clonal growth organs; NCO: number of clonal offspring). We report the results of multiple regression models, the coefficient values, the significance of each predictor, the R2 values and AIC of each model.
Diversity’ FacetTraitIndexDBHShDBHHShHEm.d.Sub.d.Dom.d.Tot.d.R2AICModel Type
TD S −1.97 *−1.34 n.s. 19%440non-mixed
FDLSQ 0.013 * 7%−230non-mixed
PCGOQ 0.02 * 7%−163non-mixed
NCOQ−0.033 **−0.02 n.s. 10%−124non-mixed
FRLSR −0.014 * −0.1 n.s. 13%−218non-mixed
PCGOR −0.02 * −0.03 ** 16%−146non-mixed
NCOR0.04 **0.03 * 11%−109non-mixed
DBH = mean diameter of standards; H = mean height of standards; ShDBH = diversity of the diameters of standards; ShH = diversity of the height of standards; Em.d. = emergent density layer; Sub.d. = subordinate density layer; Dom.d. = dominant density; Tot.d. = total density layer. ** p < 0.01; * p < 0.05; n.s. not significant. Significant results are represented in bold. Model type refers to the model that emerges from the comparison between non-mixed and mixed models according to the AIC criterion.

