Abstract
Rare or endangered tree species are important components of forest ecosystems and play a crucial role in management and conservation. Understanding what influences their presence is critical for managers, conservationists and planners. This study presents results of a comprehensive inventory of the tree species and site characteristics in the Vietnamese Cat Ba National Park (CBNP). An adaptive cluster sampling technique was applied to study the effect of human disturbance, soil properties, and terrain conditions on the presence of IUCN Red List tree species (all individuals > 5 cm diameter at breast height) in three strictly protected areas in CBNP, which have varying levels of isolation. Data from 239 sample plots (500 m2 each) were analyzed. Tree species recorded during the inventory were assigned to two categories: IUCN Red List and other. Our results showed that site characteristics differed in the three protected areas along with the presence of IUCN Red List tree species. IUCN Red List tree species were more frequently found on less favorable soils (low soil depth) and in terrain with more pronounced slopes and with a higher rock surface area (%). However, there is no indication from existing information on the autecology of the different Red List species that the site conditions hosting the species are the ones favored by the species, even on the contrary for some. Although direct signs of human activity (paths, animal traps) could not be related to the presence of Red List tree species, the data suggest that the accessibility of the sites is a strong negative driver for the presence of Red List tree species. We conclude that protection of the forests of the Cat Ba Island should be stricter to allow the IUCN Red List tree species to grow under more appropriate conditions, which then would allow studying their ecology in more detail. This would further allow deriving more precise recommendations for their future protection.
1. Introduction
Protection of Red List tree species is an important aspect of biodiversity conservation and management [1,2,3]. Red List tree species are key components of protected areas and/or national parks and often a major reason for the protection of a certain area. Their presence increases the conservational value and uniqueness of ecosystems. Hence, protected areas and national parks also play an important role in maintaining populations of Red List tree species [4,5,6,7,8]. However, understanding the ecology of Red List tree species and reasons for their presence patterns within particular protected areas needs more case-specific research [9,10,11,12].
Site conditions have often been found to be the driving force for the presence of tree species [13,14,15,16,17]. This is true not only for managed forests, where the selection of site-adapted tree species is one of the most important management decisions in close-to-nature forest systems (CTNF) [18] (for details on CTNF comp. [19,20]), but especially for unmanaged and protected forest ecosystems. For example, Lan et al. showed that elevation and convexity most strongly affected tree species presence in a tropical seasonal rain forest in China [13]. Grell et al. found that elevation was correlated with soil factors, and also that tree species diversity indices increased with elevation in southern Arkansas forests [21]. Topographic factors and soil properties were closely related to tree species presence in Ben En National Park, Vietnam [17]. However, although the examples underscore the importance of site conditions, they also show that there are different patterns which need to be studied firstly regionally and then individually to adequately manage and protect different tree species in different regions [22,23], especially in view of Red List tree species presence.
Regardless of their protection status, some national parks and protected areas around the world suffer from unregulated human impacts, which often detrimentally affect the presence of threatened tree species [24]. Illegal activities such as poaching, logging, and fuelwood gathering still go on in many national parks and forest ecosystems [25,26], resulting in biodiversity and habitat loss [26,27,28]. Thus, not only environmental factors but also the different levels of human disturbance need to be evaluated and quantified in specific areas, if the presence of Red List tree species are to be understood for an improved protection.
The biological diversity of Vietnam is considered among the highest in the world [22,29]. According to Pham [30] 10,500 plant species are found in Vietnam. Of these, 464 plant species are included on the Red List of Vietnam (also included in the IUCN red list tree species with different degrees of endangerment) [31]. To date, 30 national parks have been established in Vietnam with the intention of providing habitats for threatened, endemic, and endangered species [29,32]. The success of these efforts is crucial if sustainable management and preservation of these species is to be achieved.
To understand in more detail how site characteristics as well as human disturbance are linked to the presence of IUCN Red List tree species, we conducted an inventory in the north-western Vietnamese Cat Ba National Park (CBNP), which is one of the biodiversity hot spots of Vietnam [32,33,34]. CBNP has an estimated number of 29 IUCN Red List tree species which are considered in need of management and protection [33,34]. To date, only a few studies on animal species and general species identification have been conducted in CBNP [34]. In fact, not a lot is known about the detailed presence of IUCN Red List tree species, and even less about the relationship between presence and site conditions or human activities. Against this background, the purpose of this study was to answer the following questions: (1) How present are IUCN Red List tree species in three strictly protected areas of the CBNP, which differ in their individual level of isolation? (2) Which are the most important site characteristics affecting the presence of IUCN Red List tree species?
2. Materials and Methods
2.1. Study Site
The CBNP is located in Vietnam, on Cat Ba Island in the Tonkin Gulf. It is located approximately 45 km east of Haiphong City, 25 km south of Halong City, and 150 km south-east of Hanoi Capital. The geographical coordinates are 20°44′ to 20°55′ N, 106°54′ to 107°10′ E (Figure 1).
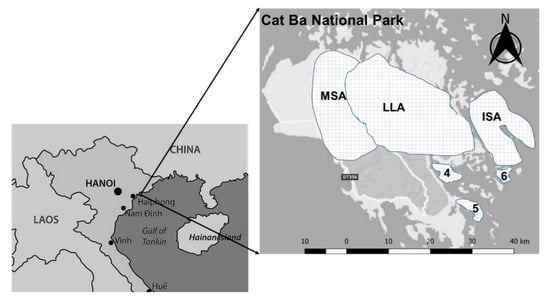
Figure 1.
Location of the Cat Ba National Park (CBNP), Haiphong, Vietnam. MSA, mid-slope area; LLA, low land area; ISA, isolated area in CBNP; 4, 5 and 6 are the other restricted areas in CBNP.
CBNP was established on a limestone archipelago of Cat Ba Island, Northern Gulf, Vietnam, which consists of 366 islands and islets [35,36]. The total area of CBNP is 16,197 ha—of which, approximately 10,932 ha are terrestrial islands, and 5265 ha are marine [34,36]. The average elevation of the Cat Ba islands lies between 100 and 150 m above sea level; the highest peak is 331 m above sea level. The topography of CBNP is extremely heterogeneous and slopes range from 15° to 35° [37]. Annual precipitation ranges from 1500 to 2000 mm. There are two distinct climatic seasons: the rainy season (from May to October) and the dry season (from November to April). Average annual temperature is 23 °C. Average air humidity is approximately 86% [33,36].
Many different ecosystems can be found in Cat Ba National Park: evergreen forests on limestone, wetland forest ecosystems in the high mountains, mangrove forests, coral reefs, and cave systems [33,36]. The following forest ecosystems can be found in the CBNP: primary (undisturbed by direct human activity) evergreen broadleaf tropical rain forests [38], secondary (previously disturbed by human activity) evergreen broadleaf tropical forests [38] in the lowlands and limestone mountains, secondary moist evergreen restoration forests on limestone mountains and valleys, restored bamboo forests, wetland forests in the limestone valleys, mangrove forests, and plantation forests [34,38].
The biodiversity of CBNP is reflected by an extremely rich fauna and flora, for which Cat Ba Island was officially recognized as a biosphere reserve by UNESCO in 2004 [36]. The flora of CBNP comprises 1561 vascular plant species belonging to 842 genera, 186 families, and 5 different groups of species (408 timber species, 661 medicinal species, 196 edible species, 203 ornamental species, and 93 other species) [34,39]. According to the CBNP report [34] and Tuan [33], CBNP determined 29 IUCN Red List tree species so far.
CBNP is divided into six strictly protected areas totaling 4915 ha, with the goal of protecting the natural development of the ecosystem with its plant and animal species (Figure 1). This means no management activities take place. This study focused on three of these six areas (Figure 1), where the main objective is to conserve primary and secondary forest ecosystems. These three areas represent a gradient of accessibility. The first area (1916.4 ha) is located in the center of the park and represents the lowland area (LLA) and is most easily accessed of the three. The second area (600 ha) lies in the north-western part of the park, and represents the mid-slope area (MSA), and the third area (1557.8 ha) lies on a separate island in the eastern part of the park, more strongly isolated than LLA and MSA, and hence represents the isolated area (ISA).
2.2. Sampling Design
An adaptive cluster sampling design was used for data collection (Figure 2). This sampling procedure was specifically designed to investigate the presence of rare objects [40,41,42,43,44]. The approach is based on a randomly selected initial sample plot from a finite population. Whenever an observation in the initial unit meets a predefined criterion or condition (e.g., the presence of at least one red list tree species), additional units in its neighborhood are added to the sample plot, which then becomes extended to the north, east, south, and west. This procedure is continued until no more plots that fulfil the predefined condition can be found in the periphery of the subplot cluster. The number of units in a network is the so-called network size or cluster. Accordingly, a sampling unit with no target observations of the predefined criterion is considered as a network of size one [40,42,45,46,47].
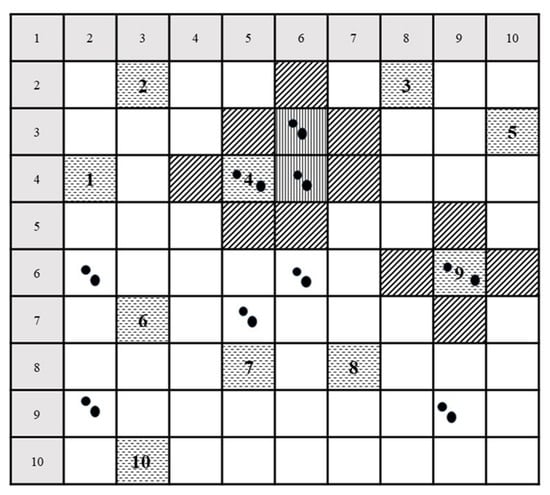
Figure 2.
Example of adaptive cluster sampling. From a sample grid with 10 × 10 strips, 10 initial units (1–10) were selected randomly without replacement (dashed horizontal). Black bold dots are the objects of interest. Squares with vertical lines mark extended plots that also contain an object of interest. The plots were established after a target object in the initial sample plot (dashed horizontal) was found. Squares with diagonal lines mark extended plots established after a target object in the initial sample plot (dashed horizontal) or extended plot (vertical lines) was found, but which did not yield a target object.
2.3. Data Collection
Each selected plot had a size of 500 m2 (20 m × 25 m). The number of sampled initial plots was 30 for each of the three protected areas (LLA, MSA, and ISA) (Figure 1), resulting in a total of 90 initial plots. The 90 sampled initial plots were supplemented by 149 extended plots (LLA had 70, MSA had 42, and ISA had 37 extended plots), resulting in a total of 239 sample plots.
2.3.1. Standing Tree Layer
Within each plot, all standing trees with diameter at breast height (DBH) > 5 cm were recorded and their height (F_Ht) measured. Each individual was identified to the species level with help from botanists of the Northeast College of Agriculture and Forest (AFC) and from the Cat Ba National Park. Individuals that could not be identified in the field or at the herbarium of the AFC were classified by genus or family.
According to the IUCN Red List, species can be assigned to nine different categories related to endangerment and information available (IUCN, 2017) [48]. The recorded tree species were initially assigned to the categories found, which were IUCN high-risk species (including subcategories such as Vulnerable (VU), Endangered (EN), Critically Endangered (CE)), and IUCN low-risk species (including Data Deficient (DD), Least Concern (LC), and Near Threatened (NT)) [48,49,50,51]. For the final data analysis, the recorded tree species were grouped into two categories, either belonging to the IUCN Red List or not, because of the overall low presence of IUCN Red List tree species in CBNP.
2.3.2. Growth Site Characteristics
Growth site characteristics were recorded and distinguished by factors related to terrain (T), chemical and physical soil conditions (S), and human disturbances (H).
Terrain Data
Topographic terrain measurements on each plot included slope (T_Slope), elevation (T_Elev), and estimation of percentage of rock surface area (T_Rsf). Plot slope was measured with an inclinometer in the center of each sample plot. Longitude, latitude, and elevation were measured with a Garmin GPSMAP 64st device at the center of each sample plot. Rock surface area (T_Rsf) per plot (%) was estimated visually as a mean value of rock exposure across 5 subplots, which were established in the center and four corners of each plot. Each of these subplots had an area of 25 m2 (5 m × 5 m).
Soil Conditions
Chemical soil conditions were assessed with soil sample analyses. Soil samples were collected from the center of each plot, using a soil auger (diameter 10 cm) to sample the top soil layer from 0 to 20 cm. In total, we took 90 soil samples—30 soil samples for each study site—which is considered the most important source of nutrients for plants in this region [17]. Absolute soil moisture content (S_Moisture), soil humus content (S_Humus), base saturation (S_BS), pH (S_pH), hydrolytic acidity (S_HA), and total cation exchange capacity (S_CEC) were determined in the soil laboratory of the Vietnam National University of Forestry.
Soil samples were air dried at room temperature, pooled at the plot level, thoroughly mixed, and passively sieved through a 2 mm screen to remove rocks and large particles of organic material. After being air dried at room temperature, soil samples were dried in an oven at 105 °C from 6–8 h to calculate soil absolute moisture content (S_Moisture). Soil absolute moisture content was calculated as the difference between the pre- and post-drying weights divided by the pre-drying weight. Soil humus content (S_Humus) was determined oxidatively by Mohr salt (K2Cr2O7) (Walkley and Black method) [52,53,54,55,56]. NaOH was used to determine hydrolytic acidity (S_HA) (Kappen method) [52,53,54,55,56]. Ammonium acetate (NH4CH3COOH) was used to analyze cation exchange capacity (S_CEC) (CEC = K+ + Ca2+ + Mg2+ + Na+ + NH4+ + H+ + Al3+). The CEC is usually comprised of Ca2+, Mg2+, K+, Na+, Al3+, and protons (Kjendhal method) [52,53,54,55,56]. Base saturation (S_BS) is defined as the ratio of the quantity of exchangeable bases to the cation exchange capacity. Exchangeable bases (Ca2+, Mg2+, K+ and Na+) predominate in most soils [52].
Soil physical conditions, such as soil depth (S_SD), were measured with a steel rod, averaging the depth from five measurements per plot. Soil texture (S_Sand, S_Silt, S_Clay) and percentage of rocks in a soil sample (S_Rock) were measured from the soil samples. The Bouyoucos hydrometer method was used to determine soil texture and calculate the percentages of sand, silt, and clay [57]. Percentage of rocks in the soil sample was determined by taking a 1/10th subsample from each soil sample (collected with the soil auger) and sieving this subsample into gravel and rock material components (diameter ≥ 2 mm). The volumetric relation was used as percentage of rock and gravel in soil.
Human Impact
Before its establishment in 1986, Cat Ba Island was not a national park, and so people had lived in the area for several generations. Their activities included wood logging, hunting, slash and burn, and fishing, resulting in significant impacts on the forests [33,36]. Since the establishment of the national park, much effort has been to reduce human impact on the restricted zones by relocating people outside the core zones, but there are still villages in close proximity to CBNP, and so human impacts such as illegal logging and poaching remain severe problems to date. To consider the impact of humans, we used proxies of human impacts by recording the number of footpaths (H_Fps), stumps from harvests (H_Stps), and animal traps (H_Trs) on each plot.
2.4. Data Analysis
All descriptive statistics and statistical analyses were conducted using the statistical software R version 3.4.2 [58]. General forest structure and single tree dimensions such as diameter at breast height (DBH, cm), tree height (Ht, m), basal area (BA, m2), volume (V, m3), tree density (N ha−1), species richness (Spe), and Shannon index (H’) were determined and presented with mean and standard deviation (± sd) for the three study sites. BA per hectare was calculated by using the following equation: BA = πr2 = 3.142 × (DBH/200)2 × (10,000/plot area), where r = radius (cm). Volume = BA × H × f1.3, where f1.3 is the tree form factor. Species richness was the total number of tree species in each plot. The Shannon index accounts for both abundance and evenness of the species present and is calculated as H’ = −∑(pi × lnpi), relating the abundance of species i (ni) to the total number of species (N) (pi = ni/N) and then multiplying it with its natural logarithm (lnpi) [27]. Shannon index was calculated from the species-site matrix, and using the “vegan” package [59]. The “multicomp” package was used to calculate differences between the three study sites [60]. The multiple factor analysis (MFA) was used to summarize and visualize the relationships of tree species categories, study sites, soil properties, environmental factors, and human activities. The MFA was based on principal component analysis (PCA) and multiple correspondence analysis (MCA) [61,62]. The MFA was conducted with the “FactorMinorR” and “factorextra” packages in R [62,63,64,65,66,67]. The input data for the MFA included the two tree species categories (IUCN Red List, other) and the seventeen explanatory variables describing the soil physical and chemical properties, the terrain factors and the human activities for all 239 sample plots. The interpretations of MFA results is based on [61,62,64]. The correlation between the single factors and the presence of IUCN tree species and other categorical variables were calculated using the “global PCA” feature of the R packages mentioned above.
3. Results
3.1. Site Characteristics and Forest Structural Characteristics
Terrain and topographic conditions at the three study sites differed from one another (Table 1). The average slope in ISA (22.69° ± 9.57°) was twice as steep as in LLA (11.25° ± 8.11°). Accordingly, soil depth in LLA (82.46 cm ± 36.07 cm) was significantly deeper than in ISA (42.54 cm ± 30.32 cm). MSA took an intermediate position between the other two areas. Further, with respect to forest structural traits, LLA significantly differed from the other areas. Tree density, mean diameter at breast height, mean basal area, and mean stand volume were highest in LLA (Table 1). As expected, signs of human disturbance (footpath, stumps, animal traps) were more frequent in LLA and MSA compared to the more isolated ISA (Table 1). The LLA also was higher in species richness and Shannon index than MSA and ISA (Table 1).

Table 1.
Overview of inventory data on forest structure, site characteristics (terrain, soil), and human impacts in the three areas of the Cat Ba National Park (LLA, MSA, and ISA). The values for each variable are the mean and standard deviation. Small letters indicate significant differences at p ≤ 0.05 between the three areas.
3.2. IUCN Red List Tree Species Identification
A total of 170 tree species were identified during the inventory. The presence of nine IUCN Red List tree species could be confirmed—of which, three species belonged to the IUCN low-risk category, and six species to the IUCN high-risk category (Table 2).
Table 2.
Overview of IUCN Red List tree species that were identified and recorded during the inventory in the Cat Ba National Park with individual risk category.
3.3. Site Characteristics and Human Activities in Relationship to Abundances of the Red List Tree Species
The MFA ordination results revealed a clear distinction among the three study areas (LLA, MSA, ISA), based on their site characteristics. The ordination map (Figure 3) mainly separates the areas along the first axis (PC1) of the MFA, explaining 21% of the data variation. The greatest difference in site properties was found between LLA and ISA. The coordinates of mean spatial point of ISA (1.13, −0.02) were opposite to those of LLA (−0.88, 0.13). Similarly, the two tree species categories (IUCN, Other) are mainly distinguishable along the first axis. While the other species are found at the intersection of the two axes (PC1, PC2), the threatened species of the IUCN Red List are found towards the right. The detailed values for the correlation with the first three ordination axes can be found in Table 3.
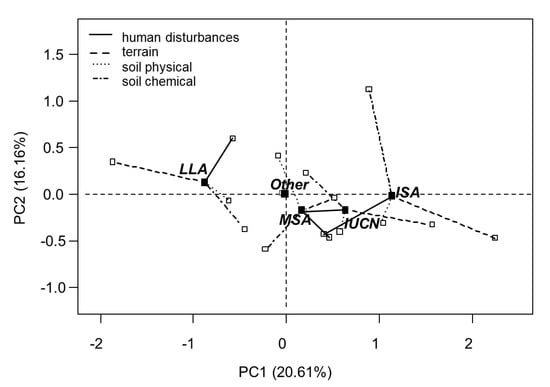
Figure 3.
Spatial distribution of two species groups (IUCN, IUCN Red List tree species; other, tree species that do not belong to the IUCN red list) and three study sites in Cat Ba National Park (MSA, mid-slope area; LLA, low land area; ISA, isolated area) in the Cat Ba National Park. Spatial points close together and in the same quadrant display more homogeneous conditions and positive correlation to one another. The length of the line refers to the weight of factor groups. The direction of each line depicts the correlation of each group and the axes.
Table 3.
Correlation coefficient estimates and respective p-values (in brackets) for the study sites (MSA, mid-slope area; LLA, low land area; ISA, isolated area) and species categories (IUCN, IUCN Red List tree species; other, tree species that do not belong to the IUCN red list) in relation to the first three principal components of the MFA.
These first three principal components (PCs) alone explained 51.7% of the variation in the data set (Table 4), with eigenvalues above 1.0, indicating the amount of variation retained by each PC (Table 4). Therefore, only the first three principal components were further used to explain the following MFA results.
Table 4.
Eigenvalues of the first three principal components of the MFA, of a total of 17 principal components, with their percentage of variance (variance percent) and cumulative percent of variances (cumulative variance percent).
The correlation of the factor groups with the PCs is visualized by the direction of the lines in Figure 3. The direction of the lines shows that the first axis is most strongly associated with the terrain factors (Figure 3, dashed lines), whereas the second axis represents the soil chemical properties more strongly (Figure 3, dashed dot lines). According to Figure 3, the human impacts appear to take an intermediate position between both axes (Figure 3, solid lines), which is confirmed by the values presented in Table 5, showing that human impacts load strongly on the third axis (PC3) of the MFA. The soil physical factors also seem to strongly load onto the second axis (Figure 3, round dot lines), but Table 5 shows that the correlation values are actually also very high with the first and the third axis (PC1, PC3), revealing they load strongly onto all three axes.
Table 5.
Correlation values (r values) for the main factor groups (H, T, S) with the first three principal components (PC1, PC2, PC3) of the MFA. H, human impacts; T, terrain; S, soil.
More specifically, the terrain factors (rock surface and slope) were the two factors which showed the strongest positive correlation with PC1. Soil depth was negatively correlated with PC1 (r = −0.72) and soil moisture positively correlated with PC2 (r = 0.67) (Table 6, see Figure A1). The soil chemical factors cation exchange capacity (S_CEC), base saturation (S_BS) and soil humus content (S_Humus) were positively correlated with the second principal component (PC2) (Table 6, see Figure A1). Variables of soil texture differed in the way they were correlated with the third principal component (PC3). While the percentage of sand was positively correlated with PC3 (r = 0.78), the percentages of clay and silt were negatively correlated to PC3 with r = −0.61 and r = −0.64, respectively (Table 6). The human impact factors generally had low correlation values with all three principal components. Among these, human footpaths and stumps with r = 0.56 and r = 0.51 had the highest correlation values with PC3 (Table 6).
Table 6.
Correlation (r) of specific factors with the first three principal components (PC1, PC2, and PC3) of the MFA at their significance levels (p-value ≤ 0.05). The factor column shows the site condition factors. H, human impacts; T, terrain; S, soil.
As indicated by Table 3 and Figure 3, the number of threatened species was positively correlated with the terrain factors. The correlations with rock surface and slope (r = 0.57, r = 0.48) were strongest (Table 7). In addition, the number of IUCN Red List tree species was also significantly negatively correlated with the soil physical factor soil depth (r = −0.49). Weak, but significant correlations were also found with the percentage of rocks in the soil (r = 0.23) and, as a soil chemical factor, the soil pH (r = 0.21) (Table 7). No significant correlations could be found with indications of human impacts (human footpaths, traps, stumps). The significant correlations of the number of threatened species with rock surface, slope and soil depth are directly transferable to the isolated area (ISA). In the low-land area (LLA) the values for the same factors show inverse trends.
Table 7.
Correlation (r-value) between single factor variables (H, human impacts; T, terrain; S, soil; and chemical factors) and species groups (IUCN, other) as well as study sites (MSA, mid-slope area; LLA, low land area; ISA, isolated area). Significant correlations at p ≤ 0.05 are presented in bold.
4. Discussion
4.1. Site Characteristics of the Three Study Areas
Site characteristics differed strongly between the three study areas (LLA, MSA, ISA; see Table 1 and Figure 3). The high variation of site characteristics in the region is well known from other studies [17,68] and is related to the topographic diversity and limestone as dominating parental material [68]. Many limestone ridges can be found in study areas LLA and MSA. The differences in topography are closely related to differences in soil properties [13,14,68]. In our case, the most pronounced differences between the three study sites were attributable to the factors ‘slope’, ‘rock surface percentage’ and ‘rock material in the soil’, which increased from LLA to MSA and ISA; ‘soil depth’ decreased accordingly (Table 1, Figure 3). Less distinct differences between the three study areas were found in the soil chemical properties (Table 1).
4.2. Distribution and Abundance of IUCN Red List Tree Species in Relation to Site Characteristics
We found a total of nine IUCN Red List tree species. Based on an inventory in the Central Highlands of Vietnam, Do et al. [69] reported 15 Red List tree species. They found six IUCN Red List tree species in highland floodplains and six IUCN Red List tree species in lowland mixed dry-evergreen areas. Twelve Red List tree species were found by Hoang et al. [22] in a study in the Ba Be National Park, Vietnam. Our results showed that the IUCN Red List species were more abundant in ISA and MSA than in the LLA (Figure 3), and the presence and distribution of IUCN Red List tree species was more strongly related to site characteristics than to signs of human impacts. In particular, factors related to the terrain, such as rock surface (r = 0.57) and slope (r = 0.48), were strong explanatory variables, but this is also true for factors related to soil physical conditions, especially soil depth (r = −0.49), and, with a lower correlation, also soil rock percentage (S_Rock r = 0.23) (Table 7). All other factors, including soil chemical properties (of which only pH was significant) and human impacts (footpaths, traps, stumps) could not be significantly related to the presence of IUCN Red List tree species (Table 7).
However, the fact that we could establish strong links of tree species occurrence to specific factors does not conclusively answer whether the recorded species prefer such sites or whether the sites were simply less accessible to humans, and the trees therefore more protected. Considering the information available on the species ecology (see Appendix Table A1), there is nearly no indication that these conditions are the preferred habitats of these species. On the contrary, many are reported to favor deep, moist, or well-drained soils (see Appendix Table A1). For example, the IUCN high-risk species (Bursera tonkinen, Canthium dicoccum, Erythrophleum fordii, Hydnocarpus hainanensis, and Tsoongiodendron odorum)—with one exception (Goniothalamus macrocalyx)—are known to grow on deep soils with high clay content (Appendix Table A1), even though they can also grow on more shallow soils. In the same way, all three tree species that belong to the IUCN low-risk species category (Aglaia spectabilis, Chukrasia tabularis, and Sindora tonkinensis) are reported to be well adapted to humid, well-drained soils and some of these were also recorded on the hillsides of LLA and MSA. However, soil depth was lowest in ISA, where most of the IUCN Red List species were found. Against this background, the explanation of higher presence of the IUCN red list tree species through reduced accessibility seems plausible. The latter explanation is supported by Hoang et al. [22], who also found that threatened and endemic tree species were present in higher numbers in an impassable terrain of limestone forests or hard to access areas. Since we found negative but not significant correlation values with human impacts (H_Stps r = −0.15, H_Trs r = −0.09), we could not link our measures of human impact to the presence of IUCN Red List tree species (Table 7). Other studies were able to do so. For example, Hoang et al. [26] found that footpaths and stumps, representing human activity, had a strong negative effect on the presence of valuable plants and important timber and Red List tree species. Zhang et al. [70] also reported that human activity reduced the presence of tree species.
A further reason supporting the assumption that human activities might be related to the presence of these species is that humans would probably have harvested high-risk species, like Erythrophleum fordii, Goniothalamus macrocalyx, Bursera tonkinen, and Erythrophleum fordii, which are all known to have timber of high economic value. Further, all three species of the low-risk category have high economic value, and could, therefore, have been targets for local illegal logging.
A historic fact is also worth mentioning. The presence of IUCN Red List tree species across the CBNP may also be explained by the logging history of CBNP before 1986. After the Vietnam war, the Vietnamese government established many forestry enterprises to increase wood harvest to aid economic recovery, including hitherto untouched forests [29,36,71]. One of these forest enterprises also harvested on the Cat Ba Islands [36]. At that time, many big trees and, most likely, Red List tree species, were felled. Therefore, Red List tree species were likely lost in lowlands and more easily accessible areas [36].
Summarizing these considerations, we conclude that the correlations found most likely do not represent the environmental conditions that the species prefer but rather the opposite: they point towards more isolated, and harder to access habitats, where species compositions could develop less disturbed through human activities.
5. Conclusions
By using an adaptive cluster sampling design and a multiple factor analysis, we found that the tree species at risk according to the IUCN Red List were present in higher numbers in areas that are more isolated and harder to access by humans, even though those areas are not considered to be the preferred ecological habitats of the species. Our findings have important implications for conservation management, since they indicate a negative impact of humans on the IUCN Red List tree species found. To protect these species, and to possibly increase their presence, an increase in protection efforts in the forests of the Cat Ba Island might be required. The general number of IUCN Red List tree species was low, and their presence restricted to less favorable sites. Both factors could most likely be improved through better protection—increasing the general number of IUCN Red List tree species and allowing them to grow under more optimal conditions. Once this is the case, future studies can further focus on the individual requirements of the different species and develop management recommendations for a further improvement of their protection. Moreover, this study also shows the high value of hard to access areas within protected areas. Increasing the difficulty in accessing a certain area can hence be used as management strategy.
Author Contributions
Conceptualization, V.V.P., C.A., and P.A.; methodology, V.V.P., C.A., and P.A.; formal analysis, V.V.P., C.A., and P.A.; investigation, V.V.P.; writing—original draft preparation, V.V.P.; writing—review and editing, V.V.P., C.A., and P.A.; visualization, V.V.P., C.A., and P.A.; supervision C.A. and P.A. All authors have read and agreed to the published version of the manuscript.
Funding
This research was funded by the Vietnamese Government Scholarship (Decision No.911), and the Rufford Foundation (RSG No 21165-1). The APC was funded by the Open Access Publication Funds of the Georg-August-University Göttingen.
Acknowledgments
We owe my thanks to the board of directors of Cat Ba National Park, Hai Phong, Vietnam, for supporting V.V. Pham during fieldwork. We especially want to thank Hoang Van Thap, Doan Ngoc Son, Hoang Van Cau, Nguyen Van Khu, Nguyen Van Luc, Nguyen Van Thiep, and Nguyen Van Tu for their assistance during different phases of the fieldwork. We thank Pham Ba Su and Doan Ngoc Son for helping with tree identification and Tran Thi Hang for her help in analyzing the soil samples. We are grateful to Peter Schall and Martin Ehbrecht for their help and recommendations in analyzing the data and Kathleen Regan (USA) for linguistic corrections. We acknowledge the support by the Open Access Publication Funds of the Göttingen University.
Conflicts of Interest
The authors declare no conflict of interest.
Appendix A

Figure A1.
Correlation of each quantitative variable dependent on their main factor group with PC1 and PC2. The length of each arrow in relation to the radius of the circle indicates the correlation strength of each variable. Arrows in the same quadrant are positively correlated to each other. Negatively correlated variables are in opposite quadrants. The distance of the arrows to each dimension shows how closely they are correlated to the dimensions PC1 and PC2. The meanings of the variable acronyms are showed in Table 1.
Table A1.
Summary of the biological traits of IUCN Red List tree species [34,36,48,49,50,51].
Table A1.
Summary of the biological traits of IUCN Red List tree species [34,36,48,49,50,51].
| Name | Vietnamese Name | Family | Light Requirement Mature Trees | Fruit Type | Distribution | Light Requirement Regeneration | Habitat | Regener-Ation Status | Main Use | Type of Rarity | Rare Species Categories | Area Distribution | Site Position |
|---|---|---|---|---|---|---|---|---|---|---|---|---|---|
| Aglaia spectabilis (Miq.) Jain and Bennet | Gội nếp | Meliaceae | Light demanding | spherical or invert-oval | Endemic tree of Vietnam, below 800 m elevation | shade tolerant | deep clay, medium humid, well-drained soil | Good under forest cover | well wood, furniture, construction | Heavy exploitation, loss habitat | IUCN low risk | LLA | Foot |
| Chukrasia tabularis A. Juss | Lát hoa | Meliaceae | Light demanding | spherical | Vietnam, China, Laos, India | slightly shade demanding | primary forest, moist forest, valley in limestone forest | Moderate, narrow | precious and beautiful wood, furniture | Heavy exploitation, loss habitat | IUCN low risk | Mostly in LLA | Almost in foot, and a few in middle |
| Sindora tonkinensis A. Chev. ex K. S. Larsen | Gụ lau | Caesalpiniaceae | Light demanding | flat legume, lignified, subrounded or oval | Endemic tree of Vietnam, below 600 m elevation | slightly shade demanding | deep soil, moist, well-drained soil, slightly slope | Sparely | furniture, fine art, beautiful polish | High habitat specificity, heavy exploitation. | IUCN low risk | LLA | Half in top, the rest in foot and middle |
| Canthium dicoccum (Gaertn.) Teysm. and Binn | Xương cá | Rubiaceae | Humid and light demanding | drupe, ovate | Vietnam, China | slightly shade demanding | deep soil, coastal region | Good | construction, furniture-making, medicine, carving | High habitat specificity, heavy exploitation. | IUCN high risk | MSA | Top |
| Hydnocarpus hainanensis (Merr.) Sleum | Nang trứng hải nam | Flacourtiaceae | Shade tolerant | globose berry | Vietnam, China, Laos; below 700 m elevation | shade tolerant | wet, deep soil | Poor and sparely | for vehicles, agricultural tools, pit props, medicine | High habitat specificity, heavy exploitation. | IUCN high risk | Mostly in MSA and ISA | Mostly in middle and top |
| Goniothalamus macrocalyx Ban | Màu cau trắng | Annonaceae | Shade tolerant | berry | Endemic species of Vietnam, below 300 m elevation | shade tolerant | humidity, deep soil | Sparely | Furniture, clogs-making, box-packaging | High habitat specificity, heavy exploitation. | IUCN high risk | LLA | Top |
| Tsoongiodendron odorum Chun | Giổi thơm | Magnoliaceae | Light demanding | oval fruit | Vietnam, China | shade tolerant | sparse in primary forest, humid soil, well-drained, rich humus, form 300 m to 1000 m | Moderate, narrow | Precious wood, construction, furniture | Heavy exploitation, loss habitat | IUCN high risk | Mostly in MSA and ISA | Mostly in middle and top |
| Bursera tonkinensis Guillaum | Rẫm | Burseraceae | Light demanding | pyriform, dry | Vietnam | shade tolerant | limestone soil | Moderate, narrow | sparse and household utensils, housing-pillars | High habitat specificity, heavy exploitation. | IUCN high risk | Mostly in LLA and MSA | Foot and middle |
| Erythrophleum fordii Oliv | Lim xanh | Caesalpiniaceae | Light demanding | legumes, long oval shape | Vietnam, China | shade tolerant | primary rain forest, thick clay, humid soil | Good | Precious wood, construction, famous hardwood, resin use for dyeing | Heavy exploitation, loss habitat | IUCN high risk | Mostly in MSA and ISA | Middle and top |
References
- Ruprecht, H.; Dhar, A.; Aigner, B.; Oitzinger, G.; Klumpp, R.; Vacik, H. Structural diversity of English yew (Taxus baccata L.) populations. Eur. J. For. Res. 2010, 129, 189–198. [Google Scholar] [CrossRef]
- Pacifici, K.; Reich, B.J.; M.Dorazio, R.J.; Conroy, M. Occupancy estimation for rare species using a spatially-adaptive sampling design. Methods Ecol. Evol. 2016, 7, 285–293. [Google Scholar] [CrossRef]
- Neuenschwander, P.; Bown, D.; Hedegbetan, G.C.; Adomou, A. Long-term conservation and rehabilitation of threatened rain forest patches under different human population pressures in West Africa. Nat. Conserv.-Bulgaria 2015, 13, 21–46. [Google Scholar] [CrossRef]
- Honkanen, M.; Roberge, J.M.; Rajasarkka, A.; Monkkonen, M. Disentangling the effects of area, energy and habitat heterogeneity on boreal forest bird species richness in protected areas. Glob. Ecol. Biogeogr. 2010, 19, 61–71. [Google Scholar] [CrossRef]
- McNicol, I.M.; Ryan, C.M.; Dexter, K.G.; Ball, S.M.J.; Williams, M. Aboveground Carbon Storage and Its Links to Stand Structure, Tree Diversity and Floristic Composition in South-Eastern Tanzania. Ecosystems 2018, 21, 740–754. [Google Scholar] [CrossRef]
- Calvache, M.F.; Prados, M.J.; Lourenco, J.M. Assessment of National Parks affected by naturbanization processes in Southern Europe. J. Environ. Manag. 2016, 59, 1629–1655. [Google Scholar] [CrossRef]
- Naughton-Treves, L.; Holland, M.B.; Brandon, K. The role of protected areas in conserving biodiversity and sustaining local livelihoods. Annu. Rev. Environ. Resour. 2005, 30, 219–252. [Google Scholar] [CrossRef]
- Zamora-Marin, J.M.; Gutierrez-Canovas, C.; Abellan, P.; Millan, A. The role of protected areas in representing aquatic biodiversity: A test using alpha, beta and gamma diversity of water beetles from the Segura River Basin (SE Spain). Limnetica 2016, 35, 179–192. [Google Scholar]
- Attorre, F.; Alfo, M.; Sanctis, M.D.; Francesconi, F.; Valenti, R.; Vitale, M.; Bruno, F. Evaluating the effects of climate change on tree species abundance and distribution in the Italian peninsula. Appl. Veg. Sci. 2011, 14, 242–255. [Google Scholar] [CrossRef]
- Bachelot, B.; Uriarte, M.; Thompson, J.; Zimmerman, J.K. The advantage of the extremes: Tree seedlings at intermediate abundance in a tropical forest have the highest richness of above-ground enemies and suffer the most damage. J. Ecol. 2016, 104, 90–103. [Google Scholar] [CrossRef]
- Kubota, Y.; Kusumoto, B.; Shiono, T.; Ulrich, W.; Jabot, F. Non-neutrality in forest communities: Evolutionary and ecological determinants of tree species abundance distributions. Oikos 2016, 125, 237–244. [Google Scholar] [CrossRef]
- Reyes, G.P.; Kneeshaw, D.; Grandpre, L.D.; Le, D.A. Changes in woody vegetation abundance and diversity after natural disturbances causing different levels of mortality. J. Veg. Sci. 2010, 21, 406–417. [Google Scholar] [CrossRef]
- Lan, G.Y.; Hu, Y.H.; Cao, M.; Zhu, H. Topography related spatial distribution of dominant tree species in a tropical seasonal rain forest in China. For. Ecol. Manag. 2011, 262, 1507–1513. [Google Scholar] [CrossRef]
- Liu, J.; Tan, Y.H.; Slik, J.W.F. Topography related habitat associations of tree species traits, composition and diversity in a Chinese tropical forest. For. Ecol. Manag. 2014, 330, 75–81. [Google Scholar] [CrossRef]
- Poulos, H.M.; Camp, A.E. Topographic influences on vegetation mosaics and tree diversity in the Chihuahuan Desert Borderlands. Ecology 2010, 91, 1140–1151. [Google Scholar] [CrossRef] [PubMed]
- Roland, C.A.; Schmidt, J.H.; Nicklen, E.F. Landscape-scale patterns in tree occupancy and abundance in subarctic Alaska. Ecol. Monogr. 2013, 83, 19–48. [Google Scholar] [CrossRef]
- Nguyen, T.V.; Mitlohner, R.; Nguyen, V.B.; Tran, V.D. Environmental Factors Affecting the Abundance and Presence of Tree Species in a Tropical Lowland Limestone and Non-limestone Forest in Ben En National Park, Vietnam. J. For. Environ. Sci. 2015, 31, 177–191. [Google Scholar] [CrossRef]
- Schall, P.; Ammer, C. How to quantify forest management intensity in Central European forests. Eur. J. For. Res. 2013, 132, 379–396. [Google Scholar] [CrossRef]
- PRO_SILVA. Prof Silva Forestry Principles; 2012; p. 69. Available online: https://www.prosilva.org/close-to-nature-forestry/ (accessed on 19 May 2018).
- Larsen, J.B. Close-to-Nature Forest Management: The Danish Approach to Sustainable Forestry. Available online: http://www.intechopen.com/books/sustainable-forest-management-current-research/sustainable-forestry-through-close-to-nature-management (accessed on 15 October 2017).
- Grell, A.G.; Shelton, M.G.; Heitzman, E. Changes in plant species composition along an elevation gradient in an old-growth bottomland hardwood-Pinus taeda forest in southern Arkansas. J. Torrey Bot. Soc. 2005, 132, 72–89. [Google Scholar] [CrossRef]
- Hoang, V.H. Evaluation of the Conservation Status and Risks for Some Endangered Plant Species in Ba Be National Park, Backan Province, Vietnam. Ph.D. Thesis, University of Technology, Sydney, Australia, September 2010. [Google Scholar]
- Ceschin, S.; Salerno, G.; Bisceglie, S.; Kumbaric, A. Temporal floristic variations as indicator of environmental changes in the Tiber River in Rome. Aquat. Ecol. 2010, 44, 93–100. [Google Scholar] [CrossRef]
- Bleher, B.; Uster, D.; Bergsdorf, T. Assessment of threat status and management effectiveness in Kakamega forest, Kenya. Biodivers. Conserv. 2006, 15, 1159–1177. [Google Scholar] [CrossRef]
- Dao, T.H.H.; Hölscher, D. Red-listed tree species abundance in montane forest areas with differing levels of statutory protection in north-western Vietnam. Trop. Conserv. Sci. 2015, 8, 479–490. [Google Scholar]
- Hoang, V.S.; Baas, P.; Kessler, P.J.A.; Slik, J.W.F.; Steege, H.T.; Raes, N. Human and Environmental Influences on Plant Diversity and Composition in Ben En National Park, Vietnam. J. Trop. For. Sci. 2011, 23, 328–337. [Google Scholar]
- Shannon, G.; Cordes, L.S.; Hardy, A.R.; Angeloni, L.M.; Crooks, K.R. Behavioral Responses Associated with a Human-Mediated Predator Shelter. PLoS ONE 2014, 9, e94630. [Google Scholar] [CrossRef] [PubMed]
- Wiersma, Y.F.; Nudds, T.D.; Rivard, D.H. Models to distinguish effects of landscape patterns and human population pressures associated with species loss in Canadian national parks. Landsc. Ecol. 2004, 19, 773–786. [Google Scholar] [CrossRef]
- Chien, P.D. Demography of Threatened Tree Species in Vietnam; Utrecht University: Utrecht, The Netherlands, 2006; p. 157. [Google Scholar]
- Pham, H.H. An Illustrated Flora of Vietnam; Young Publisher: Hanoi, Vietnam, 1999. [Google Scholar]
- Dao, T.H.H.; Hölscher, D. Fujian cypress and two other threatened tree species in three conservation zones of a nature reserve in north-western Vietnam. For. Ecosyst. 2017, 4, 1–11. [Google Scholar] [CrossRef]
- Pham, V.T.; Nguyen, D.A. Biodiversity and Conservation Vietnam. Available online: http://www.biodivn.com/2014/08/cac-vuon-quoc-gia-va-khu-bao-ton-thien-nhien-viet-nam.html (accessed on 20 May 2018).
- Le, M.T. Flora in Cat Ba National Park; Forest Inventory and Planning Institute: Hanoi, Vietnam, 2006; p. 17. [Google Scholar]
- CatBa, N.P. Biodiversity Information of Cat Ba National Park, Vietnam; Institute of Ecology and Resources: Haiphong, Vietnam, 2007. [Google Scholar]
- VACNE (Vietnam Association for Conservation of Nature and Environment). Cat Ba National Park. Available online: http://www.vacne.org.vn/vuon-quoc-gia-cat-ba/2842.html (accessed on 15 May 2018).
- CatBa, N.P. Inventory and Planning for Cat Ba National Park from 2006 to 2010 and Vision to 2020; Cat Ba National Park: Haiphong, Vietnam, 2005; p. 123. [Google Scholar]
- Hoang, V.T. Research on the Current Status of Poor Secondary Forest and Restoration Activities in Cat Ba National Park; Cat Ba National Park: Haiphong, Vietnam, 2018. [Google Scholar]
- Carle, J.; Holmgren, P. Definitions Related to Planted Forests. Forest Resources Assessment WP 79. 2003, p. 16. Available online: http://www.fao.org/3/ae347e/AE347E00.htm#TopOfPage (accessed on 20 May 2019).
- Le, M.C.; Le, T.H. Resulting from Investigating Plant Components in Cat Ba National Park; Vietnam Forestry University: Hanoi, Vietnam, 2000. [Google Scholar]
- Kleinn, C. Forest Inventory; Georg-August-Universität-Geottingen: Göttingen, Germany, 2009; p. 189. [Google Scholar]
- Abrahamson, I.L.; Nelson, C.R.; Affleck, D.L.R. Assessing the performance of sampling designs for measuring the abundance of understory plants. Ecol. Appl. 2011, 21, 452–464. [Google Scholar] [CrossRef]
- Brown, J.A. Designing an efficient adaptive cluster sample. Environ. Ecol. Stat. 2003, 10, 95–105. [Google Scholar] [CrossRef]
- Philippi, T. Adaptive cluster sampling for estimation of abundances within local populations of low-abundance plants. Ecology 2005, 86, 1091–1100. [Google Scholar] [CrossRef]
- Yang, H.J.; Kleinn, C.; Fehrmann, L.; Tang, S.Z.; Magnussen, S. A new design for sampling with adaptive sample plots. Environ. Ecol. Stat. 2011, 18, 223–237. [Google Scholar] [CrossRef]
- Brown, J.A. Comparison of two adaptive sampling designs. Aust. N. Z. J. Stat. 1999, 41, 395–403. [Google Scholar] [CrossRef]
- Gattone, S.A.; Esha, M.; Mwangi, J.W. Application of Adaptive Cluster Sampling with a Data-Driven Stopping Rule to Plant Disease Incidence. J. Phytopathol. 2013, 161, 632–641. [Google Scholar] [CrossRef]
- Thompson, S.K. Adaptive web sampling in ecology. Stat. Methods Appt. 2013, 22, 33–43. [Google Scholar] [CrossRef]
- IUCN. The IUCN Red List of Threatened Species. Available online: http://www.iucnredlist.org/ (accessed on 20 October 2017).
- Phung, M.T.; Nguyen, Q.T.; Nguyen, T.L.P.; Do, X.C.; Vo, S.N.; Nguyen, T.B. Vietnam Forest Creatures. Available online: http://www.vncreatures.net/e_tracuu.php (accessed on 28 May 2018).
- Vu, A.T.; Ngo, T.G.; Tran, T.H.; Nguyen, T.T.; Ngo, D.P.; Hoang, G.T.; Nguyen, Q.N.; Nguyen, A.D.; Bui, V.T.; Can, M.H. Vietnam Plant Data Center. Available online: http://www.botanyvn.com/?lg=en (accessed on 20 May 2017).
- Nguyen, T.B.; Tran, D.L.; Nguyen, T.; Vu, V.D.; Nguyen, N.T.; Nguyen, V.T.; Nguyen, K.K. Vietnam Red Data Book—Part II. In Plant Vietnam Red Data Book, Vol. II; Publisher of Science and Technology: Hanoi, Vietnam, 2007; p. 612. [Google Scholar]
- Delgado, A.; Gómez, J.A. Chapter 2 The Soil. Physical, Chemical and Biological Properties. In Principles of Agronomy for Sustainable Agriculture; Springer: Cham, Switzerland, 2016; pp. 13–26. [Google Scholar] [CrossRef]
- Le, V.D. Soil Science; Nong Lam University: Ho Chi Minh City, Vietnam, 2009; p. 151. [Google Scholar]
- Carter, M.R.; Gregorich, E.G. Soil Sampling and Methods of Analysis, 2nd ed.; Taylor & Francis Group: Abingdon, UK, 2006; p. 1240. [Google Scholar]
- Le, T.B. Soil Science; University of Agriculture and Forestry, Hue University: Hue, Vietnam, 2009; p. 151. [Google Scholar]
- Ha, Q.K. Forest Soil Science; Vietnam National University of Forestry: Hanoi, Vietnam, 2002; p. 319. [Google Scholar]
- Beretta, A.N.; Silbermann, A.V.; Musselli, R.; Paladino, L.; Torres, D.; Bassahun, D.; Musselli, R.; García-Lamohte, A. Soil texture analyses using a hydrometer: Modification of the Bouyoucos method. Cien. Inv. Agric. 2014, 41, 263–271. [Google Scholar] [CrossRef]
- R Core Team. R: A language and Environment for Statistical Computing. R Foundation for Statistical Computing. 2017. Available online: http://www.R-project.org (accessed on 28 September 2017).
- Oksanen, J.; Blanchet, F.G.; Friendly, M.; Kindt, R.; Legendre, P.; McGlinn, D.; Minchin, P.R.; O’Hara, R.B.; Simpson, G.L.; Solymos, P.; et al. Community Ecology Package. 2019. Available online: https://cran.r-project.org, https://github.com/vegandevs/vegan (accessed on 14 April 2018).
- Hothorn, T.; Bretz, F.; Westfall, P. Simultaneous Inference in General Parametric Models. Biom. J. 2008, 50, 346–363. [Google Scholar] [CrossRef] [PubMed]
- Abdi, H.; Williams, L.J. Principal component analysis. Wiley Interdiscip. Rev. 2010, 2, 433–459. [Google Scholar] [CrossRef]
- Kassambara, A. Principal Component Methods in R: Practical Guide. 2018. Available online: http://www.sthda.com/english/articles/31-principal-component-methods-in-r-practical-guide/ (accessed on 16 April 2018).
- Husson, F.; Josse, J.; Le, S.; Mazet, J. Package ‘FactoMineR’. 2017. Available online: http://factominer.free.fr (accessed on 10 November 2017). [CrossRef]
- Abdi, H.; Williams, L.J.; Valentin, D. Multiple factor analysis: Principal component analysis for multitable and multiblock data sets. Wiley Interdiscip. Rev. Comput. Stat. 2013, 5, 149–179. [Google Scholar] [CrossRef]
- Pagès, J. Multiple Factor Analysis: Main features and application to sensory data. Revista Colombiana de Estad’ıstica 2004, 27, 1–26. [Google Scholar]
- Pagès, J. Multiple Factor Analysis by Example Using R; Agrocampus-Ouest Rennes: Rennes, France; Taylor & Francis Group: Abingdon, UK, 2014; p. 268. [Google Scholar]
- Sieben, E.J.J. Plant functional composition and ecosystem properties: The case of peatlands in South Africa. Plant Ecol. 2012, 213, 809–820. [Google Scholar] [CrossRef]
- Guo, Y.; Wang, B.; Li, D.; Mallik, A.U.; Xiang, W.; Ding, T.; Wen, S.; Lu, S.; Huang, F.; He, Y.; et al. Effects of topography and spatial processes on structuring tree species composition in a diverse heterogeneous tropical karst seasonal rainforest. Flora 2017, 231, 21–28. [Google Scholar] [CrossRef]
- Do, H.T.T.; Grant, J.C.; Trinh, B.N.; Zimmer, H.C.; Nichols, J.D. Diversity depends on scale in the forests of the Central Highlands of Vietnam. J. ASIA-PAC Biodivers. 2017, 10, 472–488. [Google Scholar] [CrossRef]
- Zhang, J.T.; Xu, B.; Li, M. Vegetation Patterns and Species Diversity Along Elevational and Disturbance Gradients in the Baihua Mountain Reserve, Beijing, China. Mt. Res. Dev. 2013, 33, 170–178. [Google Scholar] [CrossRef]
- Cochard, R.; Ngo, D.T.; Waeber, P. Extent and causes of forest cover changes in Vietnam’s provinces 1993–2013: A review and analysis of official data. Environ. Rev. 2017, 25, 199–217. [Google Scholar] [CrossRef]
© 2020 by the authors. Licensee MDPI, Basel, Switzerland. This article is an open access article distributed under the terms and conditions of the Creative Commons Attribution (CC BY) license (http://creativecommons.org/licenses/by/4.0/).