
Differential Effects of Sphingolipids on Cell Death and Antioxidant Defenses in Type 1 and Type 2 Endometrial Cancer Cells

 ,
,  ,
,
Abstract
1. Introduction
2. Results
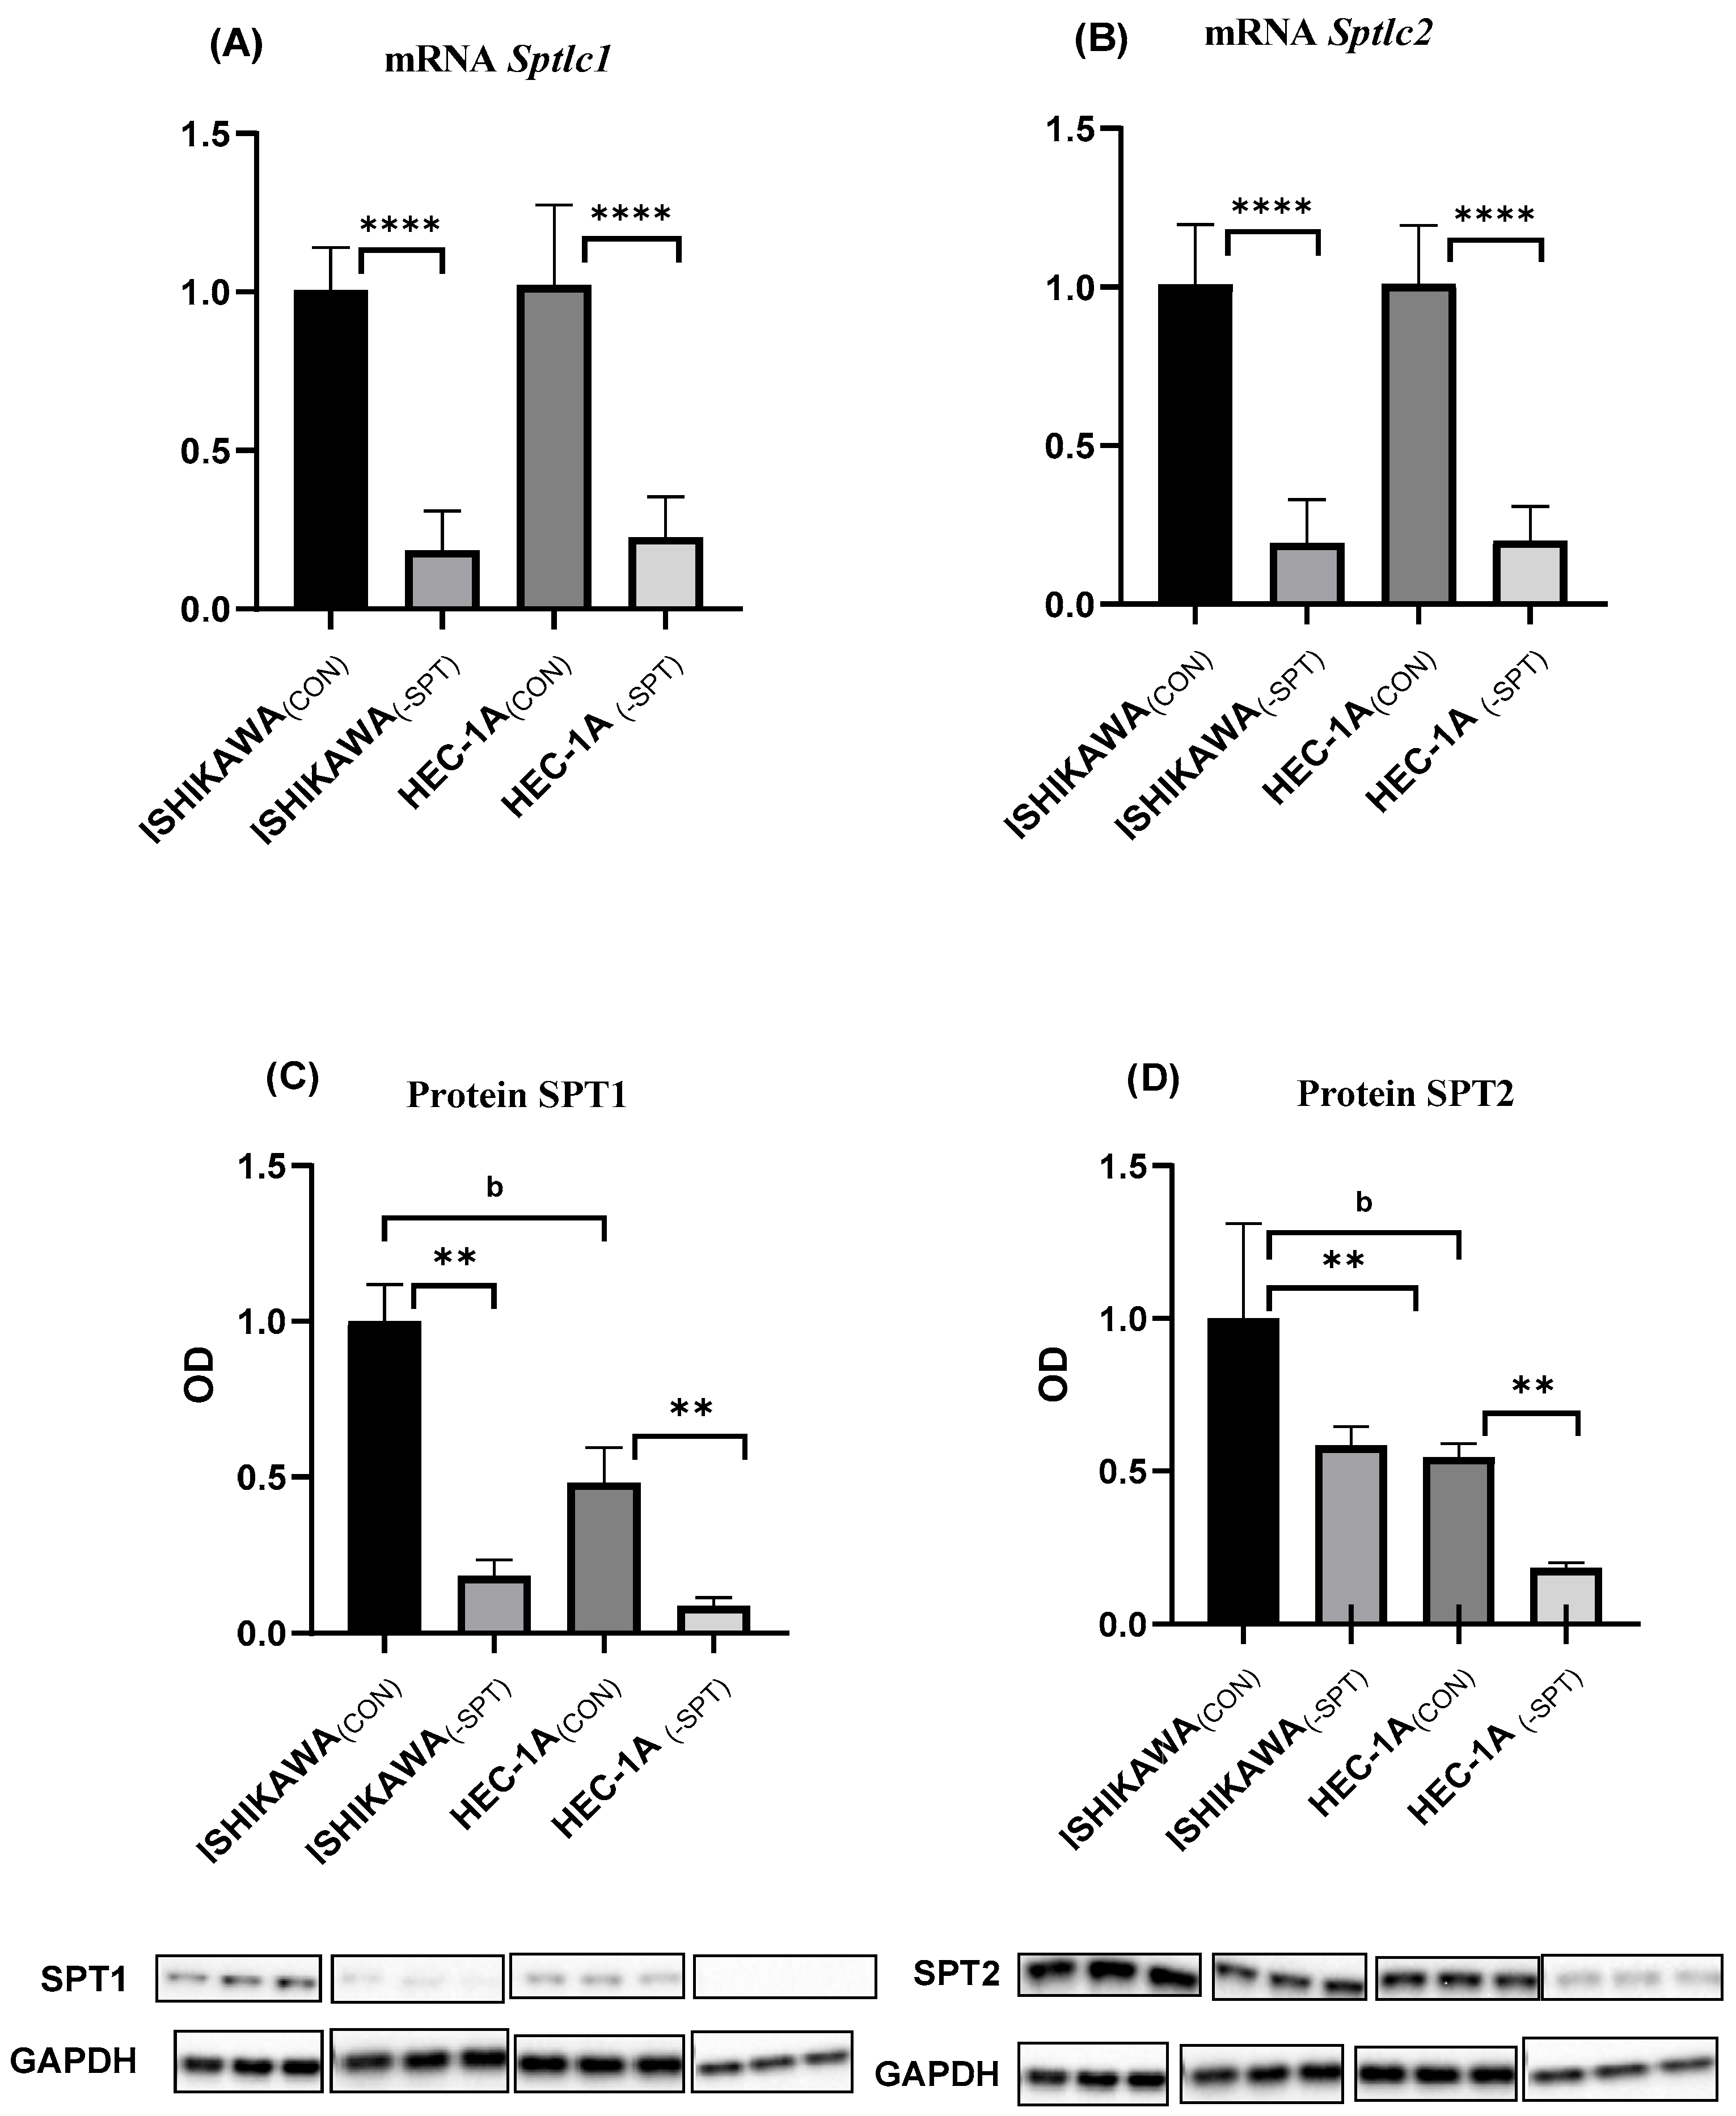
2.1. Gene Silencing
2.2. Sphingolipids Content and Sphingolipid Rheostat
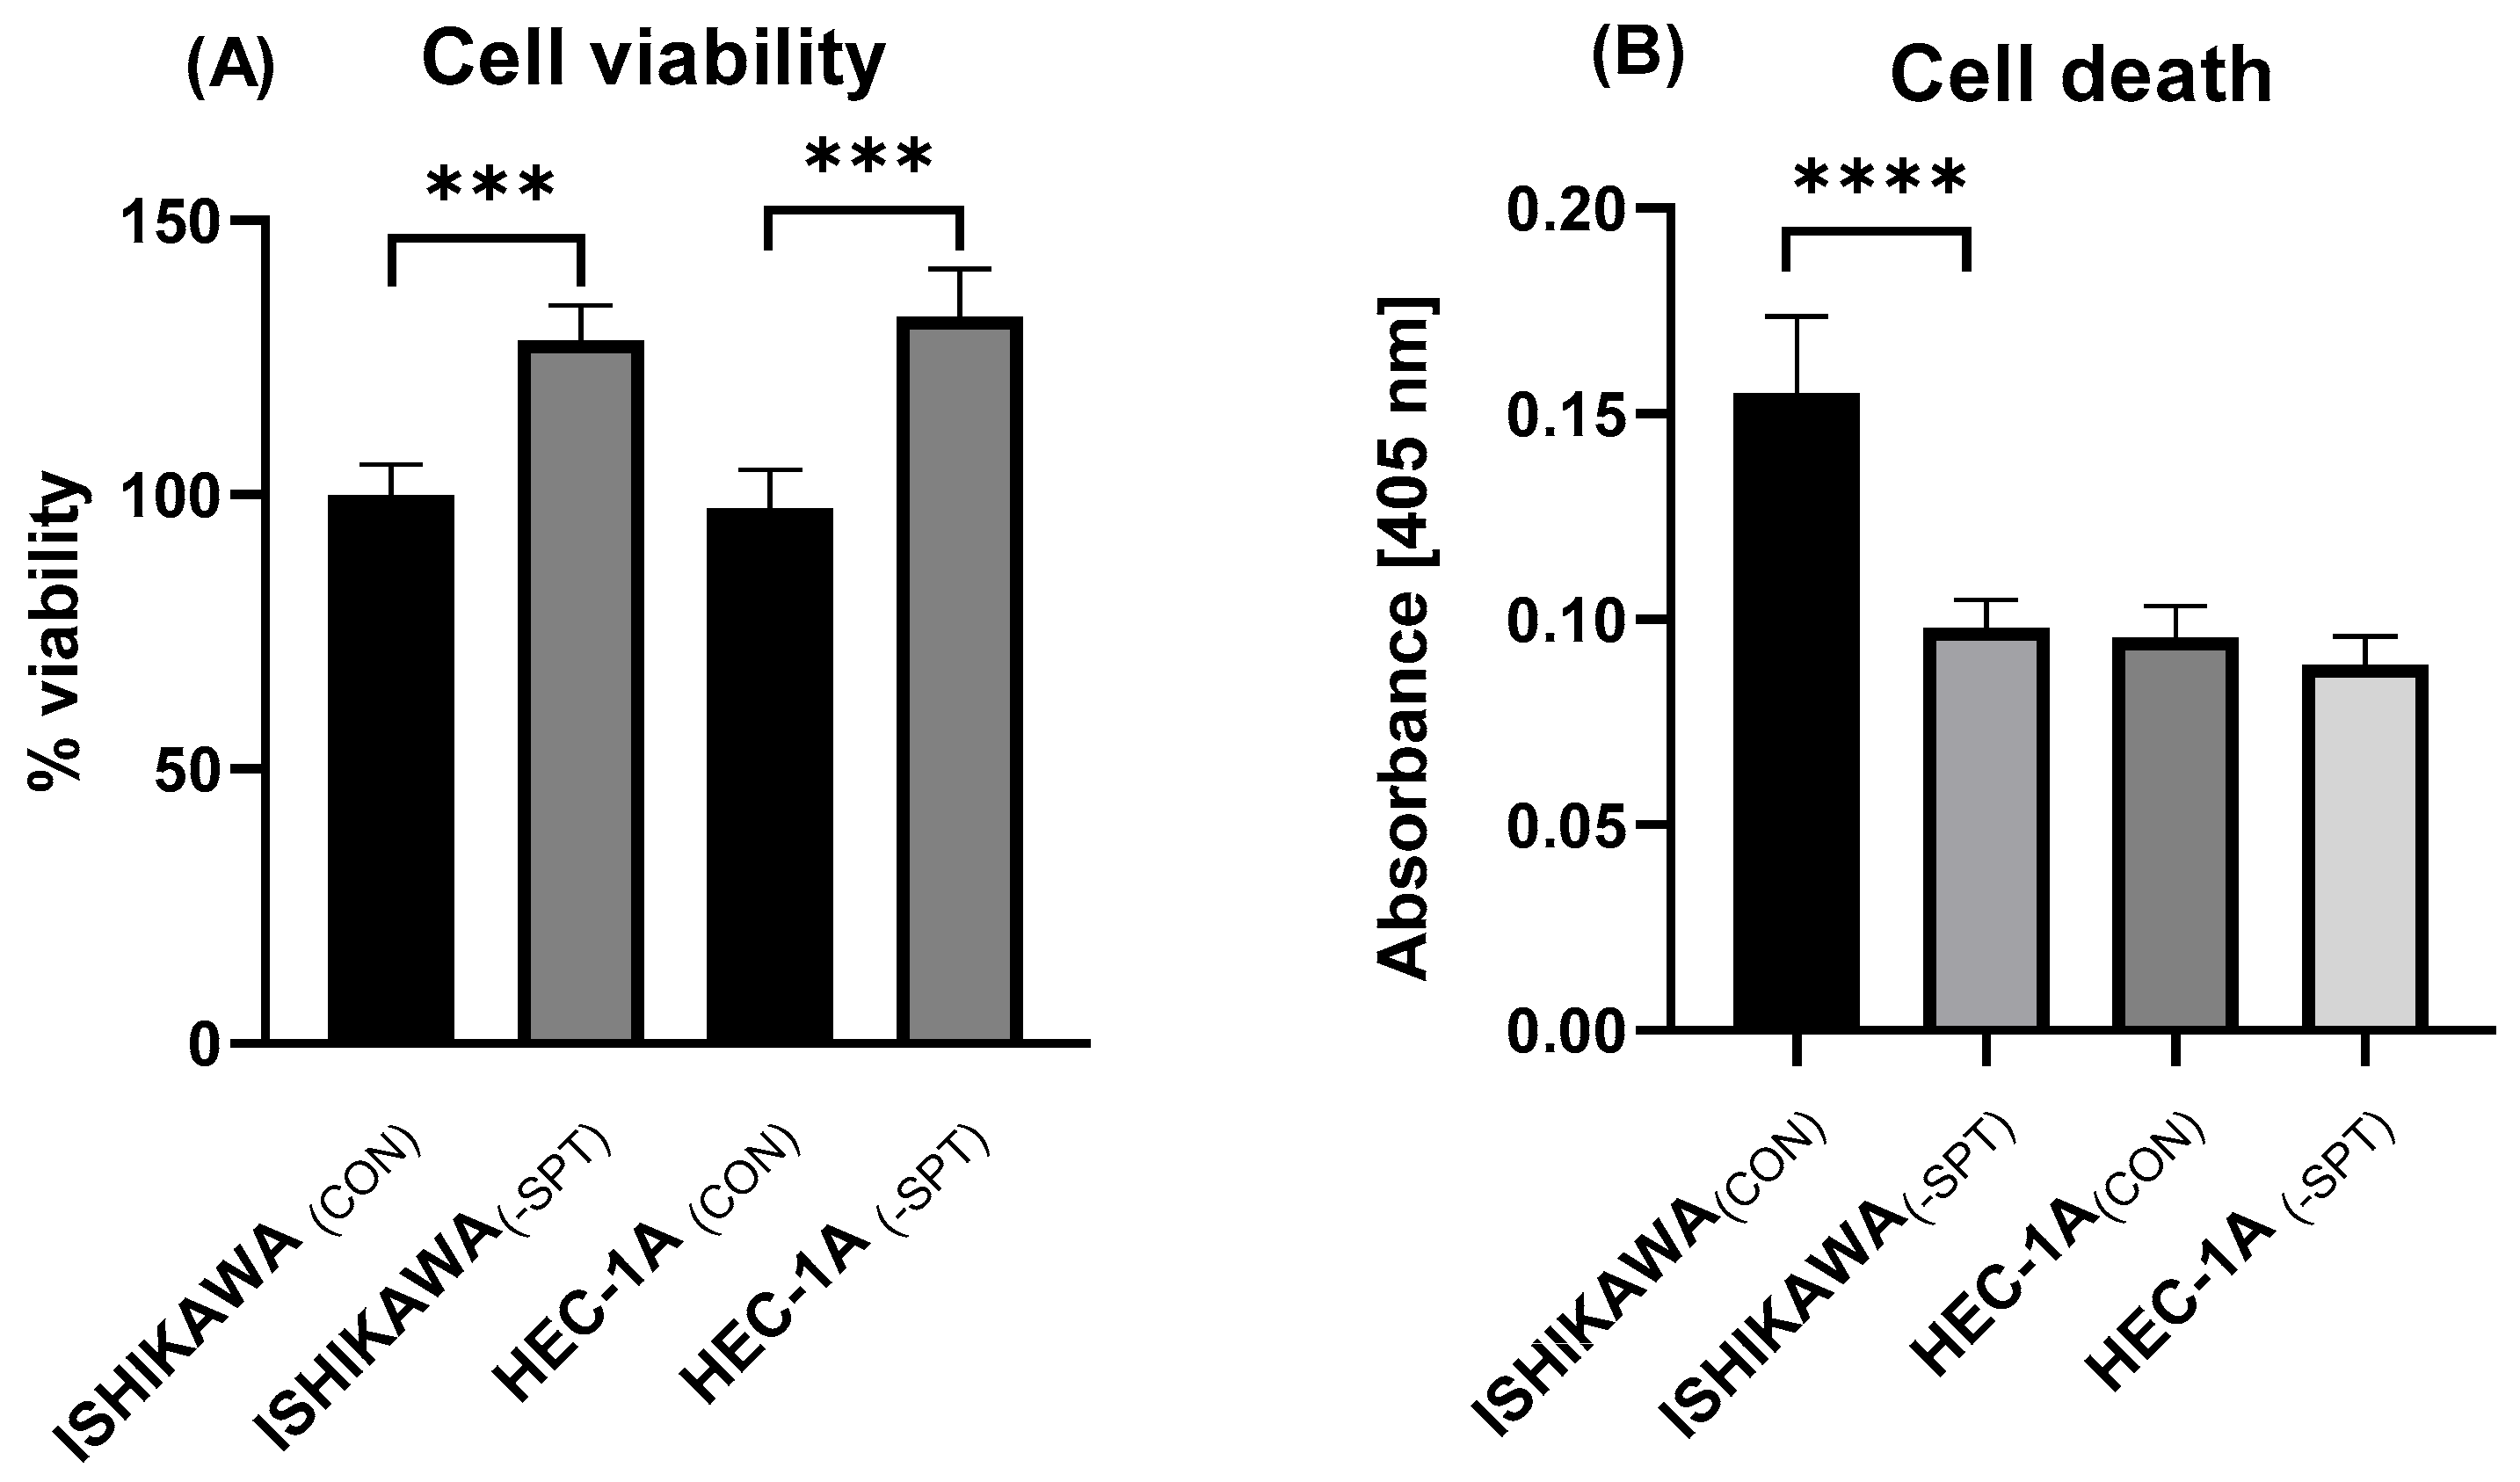
2.3. Cell Viability and Death
2.4. Correlation Between the Shingolipid Rheostate and Cell Death
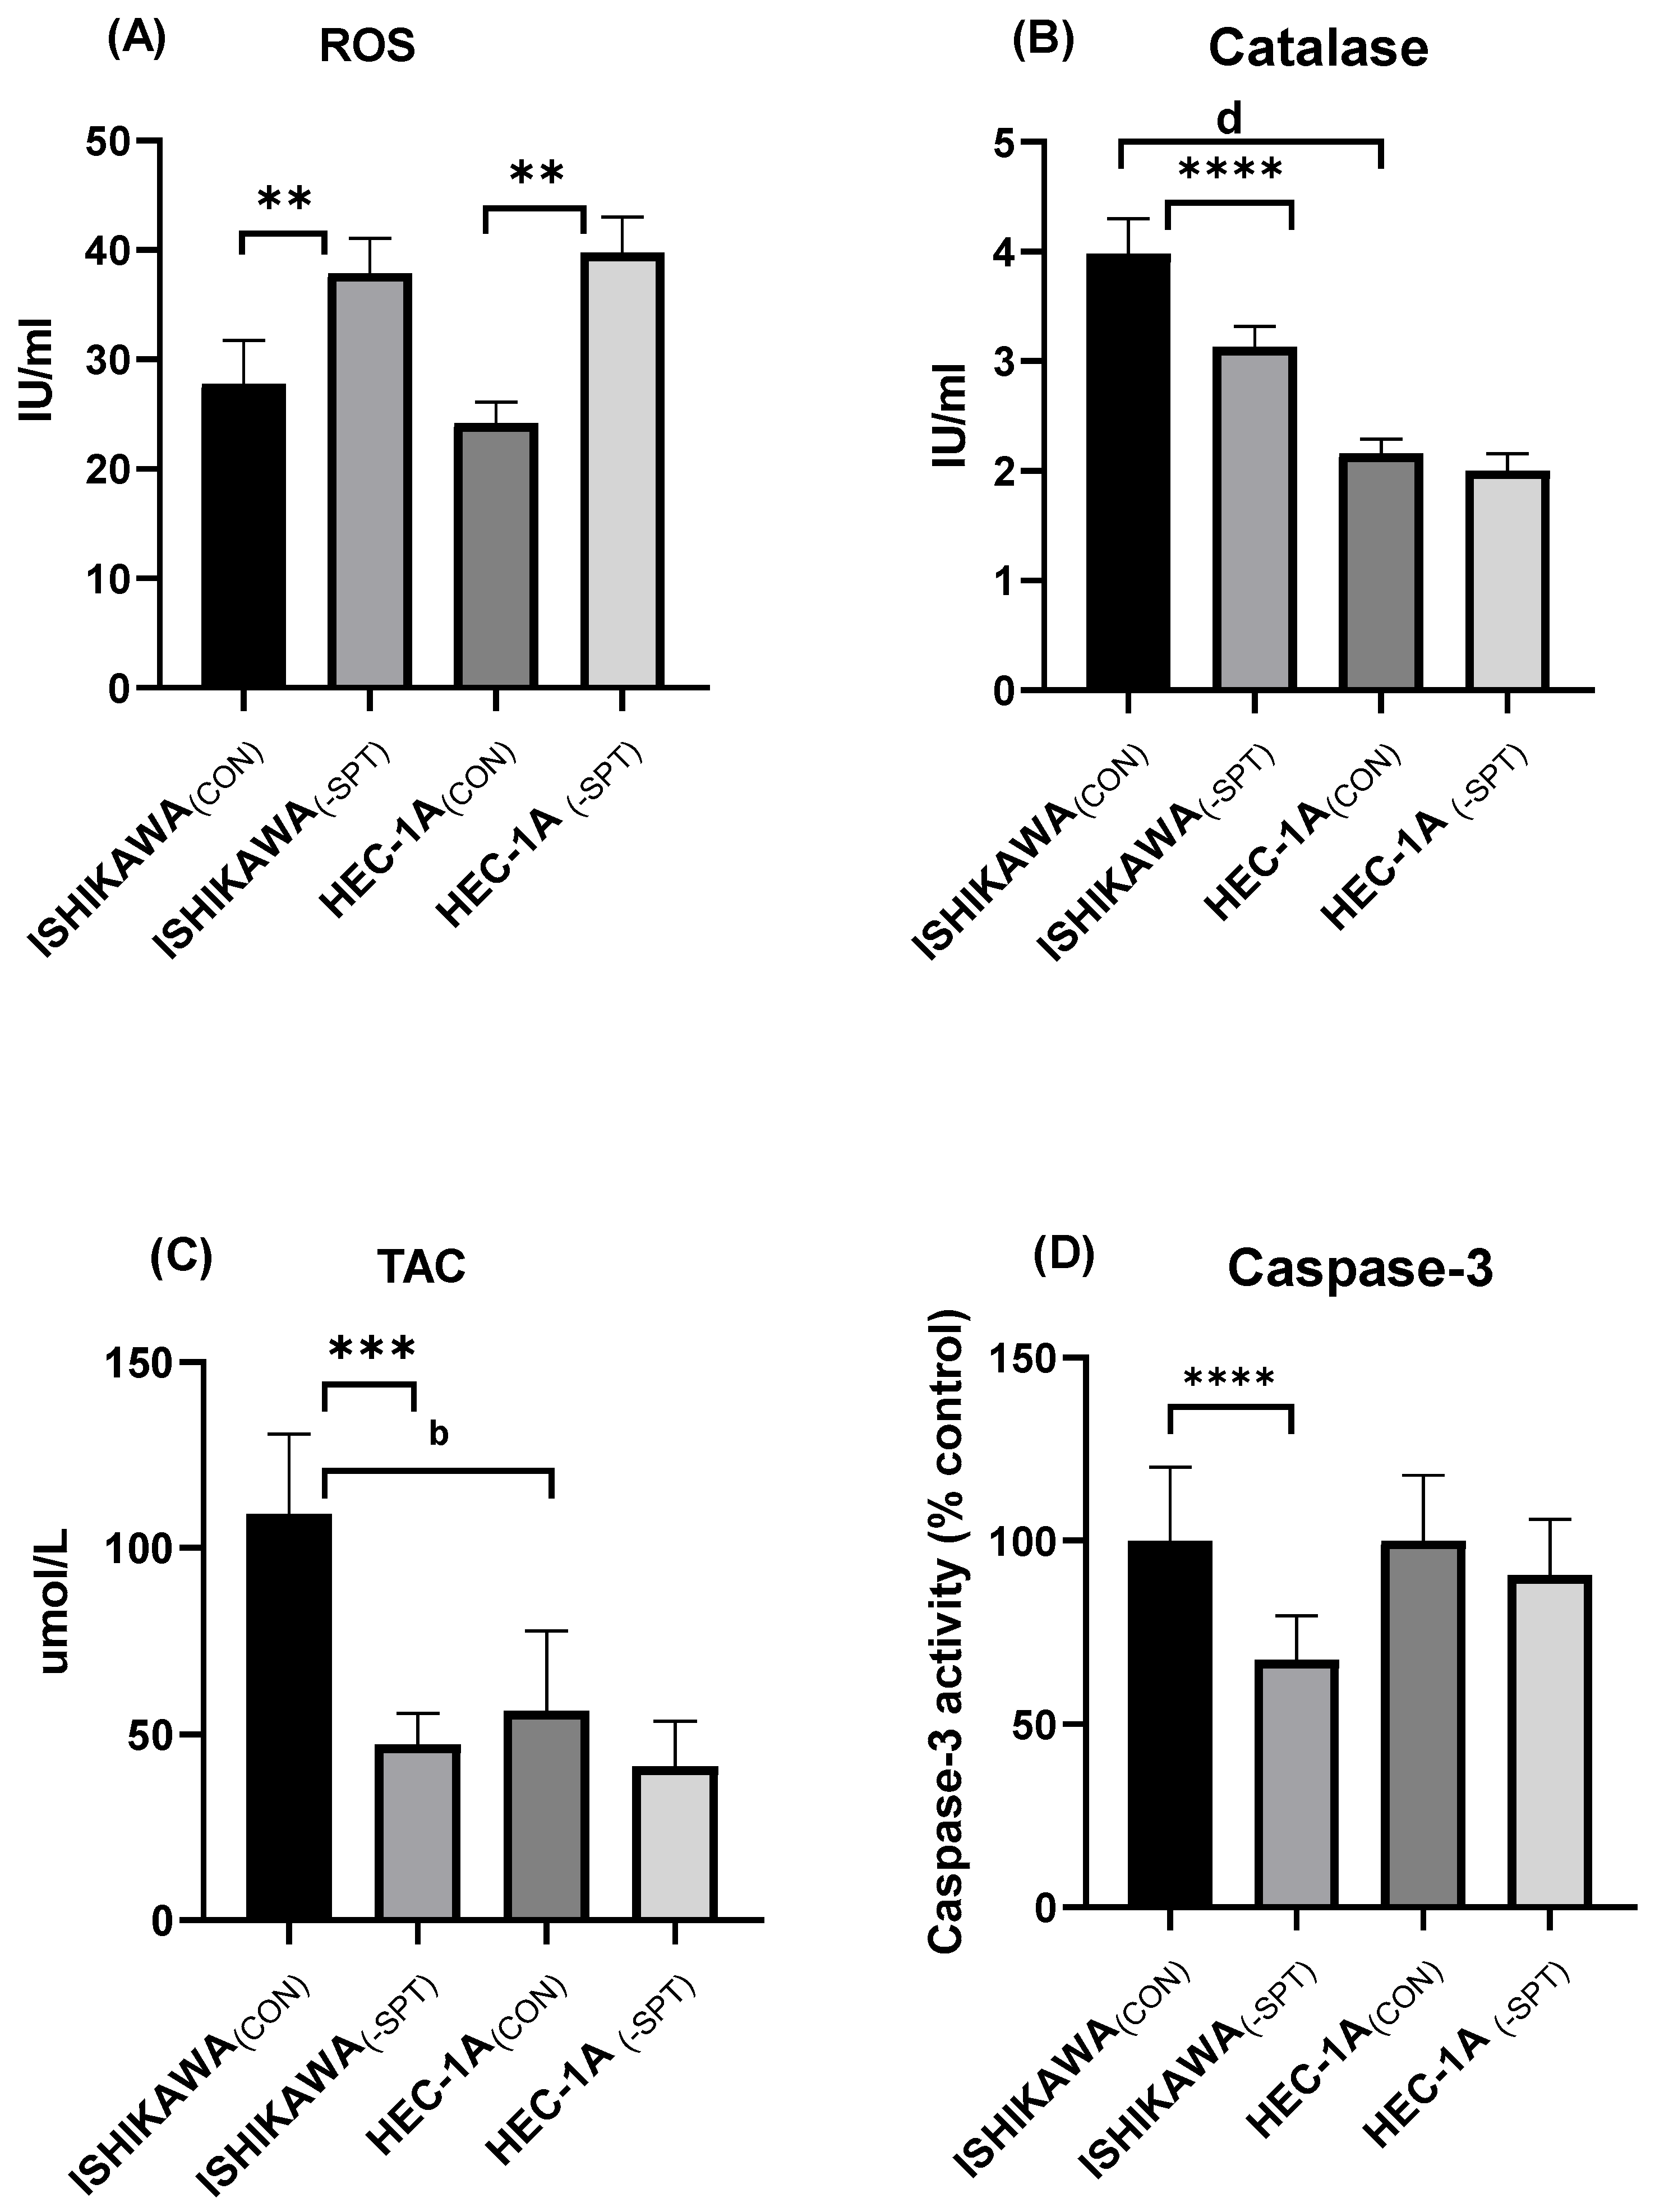
2.5. Reactive Oxygen Species (ROS) Levels, Catalase Activity, and Total Antioxidant Capacity (TAC)
2.6. Caspase-3 Activity and Mitochondrial Potential
3. Discussion
4. Materials and Methods
4.1. Cell Culture Experiments
4.2. Evaluation of Cell Death
4.3. Evaluation of Cell Viability
4.4. Real-Time PCR
4.5. Western Blotting
4.6. Sphingolipid Measurements
4.7. Caspase-3 Assay
4.8. Mitochondrial Membrane Potential Assay
4.9. Catalase Activity Assay
4.10. ROS Concentration
4.11. Antioxidant Capacity (TAC)
4.12. Statistical Analyses
5. Conclusions
Author Contributions
Funding
Institutional Review Board Statement
Informed Consent Statement
Data Availability Statement
Conflicts of Interest
Abbreviations
| EC | Endometrial cancer |
| ELISA | Enzyme-Linked Immunosorbent Assay |
| GAPDH | Glyceraldehyde-3-phosphate dehydrogenase |
| RIPA buffer | Radioimmunoprecipitation buffer |
| ROS | Reactive oxygen species |
| S1P | Sphingosine-1-phosphate |
| SPT | Serine palmitoyltransferase |
| Sptlc1 | Gene encoding serine palmitoyltransferase, long chain base subunit-1 |
| Sptlc2 | Gene encoding serine palmitoyltransferase, long chain base subunit-2 |
| TAC | Total antioxidant capacity |
| UHPLC/MS/MS | Ultra-high-performance liquid chromatography tandem mass spectrometry |
References
- Sung, H.; Ferlay, J.; Siegel, R.L.; Laversanne, M.; Soerjomataram, I.; Jemal, A.; Bray, F. Global Cancer Statistics 2020: GLOBOCAN Estimates of Incidence and Mortality Worldwide for 36 Cancers in 185 Countries. CA Cancer J. Clin. 2021, 71, 209–249. [Google Scholar] [CrossRef] [PubMed]
- Bokhman, J.V. Two pathogenetic types of endometrial carcinoma. Gynecol. Oncol. 1983, 15, 10–17. [Google Scholar] [CrossRef] [PubMed]
- Setiawan, V.W.; Yang, H.P.; Pike, M.C.; McCann, S.E.; Yu, H.; Xiang, Y.B.; Wolk, A.; Wentzensen, N.; Weiss, N.S.; Webb, P.M.; et al. Type I and II endometrial cancers: Have they different risk factors? J. Clin. Oncol. 2013, 31, 2607–2618. [Google Scholar] [CrossRef] [PubMed]
- Hamilton, C.A.; Cheung, M.K.; Osann, K.; Chen, L.; Teng, N.N.; Longacre, T.A.; Powell, M.A.; Hendrickson, M.R.; Kapp, D.S.; Chan, J.K. Uterine papillary serous and clear cell carcinomas predict for poorer survival compared to grade 3 endometrioid corpus cancers. Br. J. Cancer 2006, 94, 642–646. [Google Scholar] [CrossRef]
- Hannun, Y.A.; Obeid, L.M. Sphingolipids and their metabolism in physiology and disease. Nat. Rev. Mol. Cell Biol. 2018, 19, 175–191. [Google Scholar] [CrossRef]
- Ogretmen, B. Sphingolipid metabolism in cancer signalling and therapy. Nat. Rev. Cancer 2018, 18, 33–50. [Google Scholar] [CrossRef]
- Novgorodov, S.A.; Szulc, Z.M.; Luberto, C.; Jones, J.A.; Bielawski, J.; Bielawska, A.; Hannun, Y.A.; Obeid, L.M. Positively charged ceramide is a potent inducer of mitochondrial permeabilization. J. Biol. Chem. 2005, 280, 16096–16105. [Google Scholar] [CrossRef]
- Gentil, B.; Grimot, F.; Riva, C. Commitment to apoptosis by ceramides depends on mitochondrial respiratory function, cytochrome c release and caspase-3 activation in Hep-G2 cells. Mol. Cell Biochem. 2003, 254, 203–210. [Google Scholar] [CrossRef]
- Green, D.R.; Kroemer, G. The pathophysiology of mitochondrial cell death. Science 2004, 305, 626–629. [Google Scholar] [CrossRef]
- Pyne, N.J.; Pyne, S. Sphingosine 1-phosphate and cancer. Nat. Rev. Cancer 2010, 10, 489–503. [Google Scholar] [CrossRef]
- Morad, S.A.; Cabot, M.C. Ceramide-orchestrated signalling in cancer cells. Nat. Rev. Cancer 2013, 13, 51–65. [Google Scholar] [CrossRef] [PubMed]
- Hanada, K. Serine palmitoyltransferase, a key enzyme of sphingolipid metabolism. Biochim. Biophys. Acta 2003, 1632, 16–30. [Google Scholar] [CrossRef] [PubMed]
- Trachootham, D.; Alexandre, J.; Huang, P. Targeting cancer cells by ROS-mediated mechanisms: A radical therapeutic approach? Nat. Rev. Drug Discov. 2009, 8, 579–591. [Google Scholar] [CrossRef] [PubMed]
- Schieber, M.; Chandel, N.S. ROS function in redox signaling and oxidative stress. Curr. Biol. 2014, 24, R453–R462. [Google Scholar] [CrossRef]
- Valko, M.; Leibfritz, D.; Moncol, J.; Cronin, M.T.; Mazur, M.; Telser, J. Free radicals and antioxidants in normal physiological functions and human disease. Int. J. Biochem. Cell Biol. 2007, 39, 44–84. [Google Scholar] [CrossRef]
- Selvaraj, N.R.; Nandan, D.; Nair, B.G.; Nair, V.A.; Venugopal, P.; Aradhya, R. Oxidative Stress and Redox Imbalance: Common Mechanisms in Cancer Stem Cells and Neurodegenerative Diseases. Cells 2025, 14, 511. [Google Scholar] [CrossRef]
- Li, W.; Xu, Y.; Zeng, X.; Tan, J.; Wang, Y.; Wu, H.; Li, M.; Yi, C. Etiological relationship between lipid metabolism and endometrial carcinoma. Lipids Health Dis. 2023, 22, 116. [Google Scholar] [CrossRef]
- Błachnio-Zabielska, A.U.; Sadowska, P.; Zdrodowski, M.; Laudański, P.; Szamatowicz, J.; Kuźmicki, M. The Interplay between Oxidative Stress and Sphingolipid Metabolism in Endometrial Cancer. Int. J. Mol. Sci. 2024, 25, 10243. [Google Scholar] [CrossRef]
- Knapp, P.; Baranowski, M.; Knapp, M.; Zabielski, P.; Błachnio-Zabielska, A.U.; Górski, J. Altered sphingolipid metabolism in human endometrial cancer. Prostaglandins Other Lipid Mediat. 2010, 92, 62–66. [Google Scholar] [CrossRef]
- Knapp, P.; Chomicz, K.; Świderska, M.; Chabowski, A.; Jach, R. Unique Roles of Sphingolipids in Selected Malignant and Nonmalignant Lesions of Female Reproductive System. Biomed. Res. Int. 2019, 2019, 4376583. [Google Scholar] [CrossRef]
- Janneh, A.H.; Ogretmen, B. Targeting Sphingolipid Metabolism as a Therapeutic Strategy in Cancer Treatment. Cancers 2022, 14, 2183. [Google Scholar] [CrossRef] [PubMed]
- Bataller, M.; Sánchez-García, A.; Garcia-Mayea, Y.; Mir, C.; Rodriguez, I.; LLeonart, M.E. The Role of Sphingolipids Metabolism in Cancer Drug Resistance. Front. Oncol. 2021, 11, 807636. [Google Scholar] [CrossRef] [PubMed]
- Dowdy, T.; Zhang, L.; Celiku, O.; Movva, S.; Lita, A.; Ruiz-Rodado, V.; Gilbert, M.R.; Larion, M. Sphingolipid Pathway as a Source of Vulnerability in IDH1. Cancers 2020, 12, 2910. [Google Scholar] [CrossRef] [PubMed]
- Abuhusain, H.J.; Matin, A.; Qiao, Q.; Shen, H.; Kain, N.; Day, B.W.; Stringer, B.W.; Daniels, B.; Laaksonen, M.A.; Teo, C.; et al. A metabolic shift favoring sphingosine 1-phosphate at the expense of ceramide controls glioblastoma angiogenesis. J. Biol. Chem. 2013, 288, 37355–37364. [Google Scholar] [CrossRef]
- Marfia, G.; Campanella, R.; Navone, S.E.; Di Vito, C.; Riccitelli, E.; Hadi, L.A.; Bornati, A.; de Rezende, G.; Giussani, P.; Tringali, C.; et al. Autocrine/paracrine sphingosine-1-phosphate fuels proliferative and stemness qualities of glioblastoma stem cells. Glia 2014, 62, 1968–1981. [Google Scholar] [CrossRef]
- Riboni, L.; Campanella, R.; Bassi, R.; Villani, R.; Gaini, S.M.; Martinelli-Boneschi, F.; Viani, P.; Tettamanti, G. Ceramide levels are inversely associated with malignant progression of human glial tumors. Glia 2002, 39, 105–113. [Google Scholar] [CrossRef]
- Knapp, P.; Bodnar, L.; Błachnio-Zabielska, A.; Świderska, M.; Chabowski, A. Plasma and ovarian tissue sphingolipids profiling in patients with advanced ovarian cancer. Gynecol. Oncol. 2017, 147, 139–144. [Google Scholar] [CrossRef]
- Selzner, M.; Bielawska, A.; Morse, M.A.; Rüdiger, H.A.; Sindram, D.; Hannun, Y.A.; Clavien, P.A. Induction of apoptotic cell death and prevention of tumor growth by ceramide analogues in metastatic human colon cancer. Cancer Res. 2001, 61, 1233–1240. [Google Scholar]
- Schiffmann, S.; Sandner, J.; Birod, K.; Wobst, I.; Angioni, C.; Ruckhäberle, E.; Kaufmann, M.; Ackermann, H.; Lötsch, J.; Schmidt, H.; et al. Ceramide synthases and ceramide levels are increased in breast cancer tissue. Carcinogenesis 2009, 30, 745–752. [Google Scholar] [CrossRef]
- Moro, K.; Kawaguchi, T.; Tsuchida, J.; Gabriel, E.; Qi, Q.; Yan, L.; Wakai, T.; Takabe, K.; Nagahashi, M. Ceramide species are elevated in human breast cancer and are associated with less aggressiveness. Oncotarget 2018, 9, 19874–19890. [Google Scholar] [CrossRef]
- Jiang, Y.; DiVittore, N.A.; Young, M.M.; Jia, Z.; Xie, K.; Ritty, T.M.; Kester, M.; Fox, T.E. Altered sphingolipid metabolism in patients with metastatic pancreatic cancer. Biomolecules 2013, 3, 435–448. [Google Scholar] [CrossRef] [PubMed]
- Karahatay, S.; Thomas, K.; Koybasi, S.; Senkal, C.E.; Elojeimy, S.; Liu, X.; Bielawski, J.; Day, T.A.; Gillespie, M.B.; Sinha, D.; et al. Clinical relevance of ceramide metabolism in the pathogenesis of human head and neck squamous cell carcinoma (HNSCC): Attenuation of C(18)-ceramide in HNSCC tumors correlates with lymphovascular invasion and nodal metastasis. Cancer Lett. 2007, 256, 101–111. [Google Scholar] [CrossRef] [PubMed]
- Senkal, C.E.; Ponnusamy, S.; Rossi, M.J.; Bialewski, J.; Sinha, D.; Jiang, J.C.; Jazwinski, S.M.; Hannun, Y.A.; Ogretmen, B. Role of human longevity assurance gene 1 and C18-ceramide in chemotherapy-induced cell death in human head and neck squamous cell carcinomas. Mol. Cancer Ther. 2007, 6, 712–722. [Google Scholar] [CrossRef] [PubMed]
- Senkal, C.E.; Ponnusamy, S.; Bielawski, J.; Hannun, Y.A.; Ogretmen, B. Antiapoptotic roles of ceramide-synthase-6-generated C16-ceramide via selective regulation of the ATF6/CHOP arm of ER-stress-response pathways. FASEB J. 2010, 24, 296–308. [Google Scholar] [CrossRef]
- Wajapeyee, N.; Beamon, T.C.; Gupta, R. Roles and therapeutic targeting of ceramide metabolism in cancer. Mol. Metab. 2024, 83, 101936. [Google Scholar] [CrossRef]
- Saddoughi, S.A.; Ogretmen, B. Diverse functions of ceramide in cancer cell death and proliferation. Adv. Cancer Res. 2013, 117, 37–58. [Google Scholar] [CrossRef]
- Harayama, T.; Riezman, H. Understanding the diversity of membrane lipid composition. Nat. Rev. Mol. Cell Biol. 2018, 19, 281–296. [Google Scholar] [CrossRef]
- Sezgin, E.; Levental, I.; Mayor, S.; Eggeling, C. The mystery of membrane organization: Composition, regulation and roles of lipid rafts. Nat. Rev. Mol. Cell Biol. 2017, 18, 361–374. [Google Scholar] [CrossRef]
- Gault, C.R.; Obeid, L.M.; Hannun, Y.A. An overview of sphingolipid metabolism: From synthesis to breakdown. Adv. Exp. Med. Biol. 2010, 688, 1–23. [Google Scholar]
- Hannun, Y.A.; Obeid, L.M. Principles of bioactive lipid signalling: Lessons from sphingolipids. Nat. Rev. Mol. Cell Biol. 2008, 9, 139–150. [Google Scholar] [CrossRef]
- Holthuis, J.C.; Menon, A.K. Lipid landscapes and pipelines in membrane homeostasis. Nature 2014, 510, 48–57. [Google Scholar] [CrossRef] [PubMed]
- Castro, B.M.; Silva, L.C.; Fedorov, A.; de Almeida, R.F.; Prieto, M. Cholesterol-rich fluid membranes solubilize ceramide domains: Implications for the structure and dynamics of mammalian intracellular and plasma membranes. J. Biol. Chem. 2009, 284, 22978–22987. [Google Scholar] [CrossRef] [PubMed]
- Megha; London, E. Ceramide selectively displaces cholesterol from ordered lipid domains (rafts): Implications for lipid raft structure and function. J. Biol. Chem. 2004, 279, 9997–10004. [Google Scholar] [CrossRef]
- Futerman, A.H.; Hannun, Y.A. The complex life of simple sphingolipids. EMBO Rep. 2004, 5, 777–782. [Google Scholar] [CrossRef]
- Alkafaas, S.S.; Elsalahaty, M.I.; Ismail, D.F.; Radwan, M.A.; Elkafas, S.S.; Loutfy, S.A.; Elshazli, R.M.; Baazaoui, N.; Ahmed, A.E.; Hafez, W.; et al. The emerging roles of sphingosine 1-phosphate and SphK1 in cancer resistance: A promising therapeutic target. Cancer Cell Int. 2024, 24, 89. [Google Scholar] [CrossRef]
- Juratli, T.A.; Kirsch, M.; Robel, K.; Soucek, S.; Geiger, K.; von Kummer, R.; Schackert, G.; Krex, D. IDH mutations as an early and consistent marker in low-grade astrocytomas WHO grade II and their consecutive secondary high-grade gliomas. J. Neurooncol. 2012, 108, 403–410. [Google Scholar] [CrossRef]
- Gorrini, C.; Harris, I.S.; Mak, T.W. Modulation of oxidative stress as an anticancer strategy. Nat. Rev. Drug Discov. 2013, 12, 931–947. [Google Scholar] [CrossRef]
- Perillo, B.; Di Donato, M.; Pezone, A.; Di Zazzo, E.; Giovannelli, P.; Galasso, G.; Castoria, G.; Migliaccio, A. ROS in cancer therapy: The bright side of the moon. Exp. Mol. Med. 2020, 52, 192–203. [Google Scholar] [CrossRef]
- Chen, H.Y.; Cheng, W.P.; Chiang, Y.F.; Hong, Y.H.; Ali, M.; Huang, T.C.; Wang, K.L.; Shieh, T.M.; Chang, H.Y.; Hsia, S.M. Hinokitiol Exhibits Antitumor Properties through Induction of ROS-Mediated Apoptosis and p53-Driven Cell-Cycle Arrest in Endometrial Cancer Cell Lines (Ishikawa, HEC-1A, KLE). Int. J. Mol. Sci. 2021, 22, 8268. [Google Scholar] [CrossRef]
- Nakamura, H.; Takada, K. Reactive oxygen species in cancer: Current findings and future directions. Cancer Sci. 2021, 112, 3945–3952. [Google Scholar] [CrossRef]
- Pilátová, M.B.; Solárová, Z.; Mezencev, R.; Solár, P. Ceramides and their roles in programmed cell death. Adv. Med. Sci. 2023, 68, 417–425. [Google Scholar] [CrossRef] [PubMed]
- Stith, J.L.; Velazquez, F.N.; Obeid, L.M. Advances in determining signaling mechanisms of ceramide and role in disease. J. Lipid Res. 2019, 60, 913–918. [Google Scholar] [CrossRef] [PubMed]
- Kandoth, C.; Schultz, N.; Cherniack, A.D.; Akbani, R.; Liu, Y.; Shen, H.; Robertson, A.G.; Pashtan, I.; Shen, R.; Benz, C.C.; et al. Integrated genomic characterization of endometrial carcinoma. Nature 2013, 497, 67–73. [Google Scholar] [CrossRef] [PubMed]
- Blachnio-Zabielska, A.U.; Persson, X.M.; Koutsari, C.; Zabielski, P.; Jensen, M.D. A liquid chromatography/tandem mass spectrometry method for measuring the in vivo incorporation of plasma free fatty acids into intramyocellular ceramides in humans. Rapid Commun. Mass. Spectrom. 2012, 26, 1134–1140. [Google Scholar] [CrossRef]
- Erel, O. A novel automated direct measurement method for total antioxidant capacity using a new generation, more stable ABTS radical cation. Clin. Biochem. 2004, 37, 277–285. [Google Scholar] [CrossRef]

| ISHIKAWA(CON) | ISHIKAWA(–SPT) | HEC-1A(CON) | HEC-1A(–SPT_) | |
|---|---|---|---|---|
| Me (Q1–Q3) [pmol/mg] | Me (Q1–Q3) [pmol/mg] | Me (Q1–Q3) [pmol/mg] | Me (Q1–Q3) [pmol/mg] | |
| Sph | 18.0 (14.04–22.12) | 4.4 (3.8–4.8) **** | 8.5 (7.8–9.2) d | 2.5 (2.0–2.9) **** |
| SPA | 46.4 (34.7–53.0) | 25.3 (21.9–29.4) **** | 27.2 (26.1–32.8) d | 19.2(17.4–20.5) **** |
| S1P | 14.8 (13.4–16.5) | 9.3 (8.5–10.2) **** | 25.7 (23.5–27.2) d | 20.5(19.8–21.6) *** |
| C14:0-Cer | 14.1 (13.3–14.6) | 13.8 (12.6–15.1) | 13.5 (11.9–13.9) | 12.1(9.7–13.8) |
| C16:0-Cer | 310.6 (286.6–327.7) | 245.8 (238.7–269.4) **** | 423.2 (361.9–442.4) c | 275.2 (253.8–288.3) **** |
| C18:1-Cer | 9.5 (9.2–10.6) | 5.3 (5.1–6.1) **** | 5.2 (5.0–6.3) d | 4.4 (3.9–4.7) *** |
| C18:0-Cer | 53.1 (51.4–54.6) | 26.5 (24.5–31.0) **** | 30.1 (29.3–32.2) d | 19.3 (17.8–20.5) **** |
| C20:0-Cer | 21.1 (19.1–22.9) | 21.5 (21.0–25.5) | 20.3 (18.0–21.0) | 22.5 (19.4–23.5) * |
| C22:0-Cer | 18.0 (13.8–21.9) | 16.5 (14.9–19.2) | 20.5 (17.0–22.1) | 28.7 (24.1–32.5) ** |
| C24:1-Cer | 314.5 (305.8–327.1) | 184.4 (175.0–197.5) **** | 99.8 (92.2–107.3) d | 51.11 (49.1–53.9) **** |
| C24:0-Cer | 97.4 (90.3–107.1) | 36.9 (34.1–39.8) *** | 26.8 (25.3–28.4) d | 21.1 (18.4–22.7) **** |
| Total-Cer | 845.6 (807.2–861.6) | 551.3 (548.2–580.3) **** | 641.8 (585.2–654.1) d | 426.2 (413.0–443.9) **** |
| ISHIKAWA(CON) | ISHIKAWA(–SPT) | HEC-1A(CON) | HEC-1A(–SPT_) | |
|---|---|---|---|---|
| Me (Q1–Q3) [pmol/mg] | Me (Q1–Q3) [pmol/mg] | Me (Q1–Q3) [pmol/mg] | Me (Q1–Q3) [pmol/mg] | |
| C14:0-Cer | 1.06 (0.97–1.19) | 0.64 (0.61–0.72) **** | 1.94 (1.79–2.13) d | 1.76 (1.49–2.14) |
| C16:0-Cer | 0.048 (0.045–0.053) | 0.062 (0.055–0.073) ** | 0.037 (0.033–0.043) c | 0.078 (0.072–0.082) ** |
| C18:1-Cer | 1.559 (1.412–1.686) | 1.721 (1.621–1.818) * | 4.499 (4.188–4.985) d | 4.599 (4.459–5.302) |
| C18:0-Cer | 0.272 (0.254–0.310) | 0.345 (0.281–0.411) * | 0.816 (0.765–0.890) d | 1.117 (0.964–1.202) *** |
| C20:0-Cer | 0.675 (0.637–0.824) | 0.408 (0.371–0.455) **** | 1.280 (1.190–1.419) d | 0.909 (0.850–1.093) **** |
| C22:0-Cer | 0.820 (0.744–0.977) | 0.562 (0.531–0.584) **** | 1.246 (1.189–1.299) d | 0.740 (0.668–0.819) **** |
| C24:1-Cer | 0.047 (0.042–0.052) | 0.053 (0.044–0.056) | 0.254 (0.225–0.297) d | 0.392 (0.384–0.438) **** |
| C24:0-Cer | 0.149 (0.140–0.172) | 0.249 (0.232–0.269) **** | 0.958 (0.880–1.030) d | 0.962 (0.902–1.151) |
| Total-Cer | 0.018 (0.016–0.019) | 0.017 (0.015–0.019) | 0.043 (0.036–0.044) d | 0.049 (0.045–0.050) |
| ISHIKAWA | HEC-1A | |
|---|---|---|
| S1P/C14:0-Cer | r = 0.61 p = 0.0076 ** | r = −0.0002 p = 0.9995 |
| S1P/C16:0-Cer | r = 0.47 p = 0.0491 * | r = −0.07 p = 0.7943 |
| S1P/C18:1-Cer | r = −0.71 p = 0.0011 ** | r = −0.004 p = 0.9861 |
| S1P/C18:0-Cer | r = −0.61 p = 0.0079 ** | r= −0.45 p = 0.0623 |
| S1P/C20:0-Cer | r = 0.50 p = 0.0357 * | r = 0.38 p = 0.1190 |
| S1P/C22:0-Cer | r = 0.57 p = 0.0133 * | r = 0.50 p = 0.0350 * |
| S1P/C24:1-Cer | r = −0.40 p = 0.0997 | r = −0.43 p = 0.0745 |
| S1P/C24:0-Cer | r = −0.86 p = <0.0001 **** | r = −0.29 p = 0.2466 |
| S1P/Tota-Cer | r = 0.002 p = 0.9930 | r = −0.15 p = 0.4725 |
| ISHIKAWA (CON) | ISHIKAWA (–SPT) | p-Value | HEC-1A (CON) | HEC-1A (–SPT_) | p-Value | |
|---|---|---|---|---|---|---|
| Me (Q1–Q3) [pmol/mg] | Me (Q1–Q3) [pmol/mg] | Me (Q1–Q3) [pmol/mg] | Me (Q1–Q3) [pmol/mg] | |||
| Depolarized/ Live (LL) | 17.50 (16.95–19.65) | 15.55 (15.10–17.95) * | 0.049 | 19.00 (17.30–21.95) | 17.65 (14,20–19.10) | 0.087 |
| Depolarized/ Dead (UL) | 26.20 (25.10–28.52) | 15.35 (14.75–16.30) **** | <0.0001 | 14.50 (13.85–15.80) | 12.47 (11.55–13.15) * | 0.021 |
| Total Depolarized | 45.80 (42.05–46.10) | 31.40 (30.50–33.25) **** | <0.0001 | 34.80 (31.60–36.80) | 28.46 (27.35–30.65) ** | 0.003 |
Disclaimer/Publisher’s Note: The statements, opinions and data contained in all publications are solely those of the individual author(s) and contributor(s) and not of MDPI and/or the editor(s). MDPI and/or the editor(s) disclaim responsibility for any injury to people or property resulting from any ideas, methods, instructions or products referred to in the content. |
© 2025 by the authors. Licensee MDPI, Basel, Switzerland. This article is an open access article distributed under the terms and conditions of the Creative Commons Attribution (CC BY) license (https://creativecommons.org/licenses/by/4.0/).
Share and Cite
Błachnio-Zabielska, A.U.; Sadowska, P.; Chlabicz, U.; Pogodzińska, K.; Le Stunff, H.; Laudański, P.; Szamatowicz, J.; Kuźmicki, M. Differential Effects of Sphingolipids on Cell Death and Antioxidant Defenses in Type 1 and Type 2 Endometrial Cancer Cells. Int. J. Mol. Sci. 2025, 26, 4472. https://doi.org/10.3390/ijms26104472
Błachnio-Zabielska AU, Sadowska P, Chlabicz U, Pogodzińska K, Le Stunff H, Laudański P, Szamatowicz J, Kuźmicki M. Differential Effects of Sphingolipids on Cell Death and Antioxidant Defenses in Type 1 and Type 2 Endometrial Cancer Cells. International Journal of Molecular Sciences. 2025; 26(10):4472. https://doi.org/10.3390/ijms26104472
Chicago/Turabian StyleBłachnio-Zabielska, Agnieszka U., Patrycja Sadowska, Urszula Chlabicz, Karolina Pogodzińska, Hervé Le Stunff, Piotr Laudański, Jacek Szamatowicz, and Mariusz Kuźmicki. 2025. "Differential Effects of Sphingolipids on Cell Death and Antioxidant Defenses in Type 1 and Type 2 Endometrial Cancer Cells" International Journal of Molecular Sciences 26, no. 10: 4472. https://doi.org/10.3390/ijms26104472
APA StyleBłachnio-Zabielska, A. U., Sadowska, P., Chlabicz, U., Pogodzińska, K., Le Stunff, H., Laudański, P., Szamatowicz, J., & Kuźmicki, M. (2025). Differential Effects of Sphingolipids on Cell Death and Antioxidant Defenses in Type 1 and Type 2 Endometrial Cancer Cells. International Journal of Molecular Sciences, 26(10), 4472. https://doi.org/10.3390/ijms26104472