
Cognitive Impairment in Nonagenarians: Potential Metabolic Mechanisms Revealed by the Synergy of In Silico Gene Expression Modeling and Pathway Enrichment Analysis

 , , , , , add
Show full author list
, , , , , add
Show full author list
Abstract
1. Introduction
2. Results
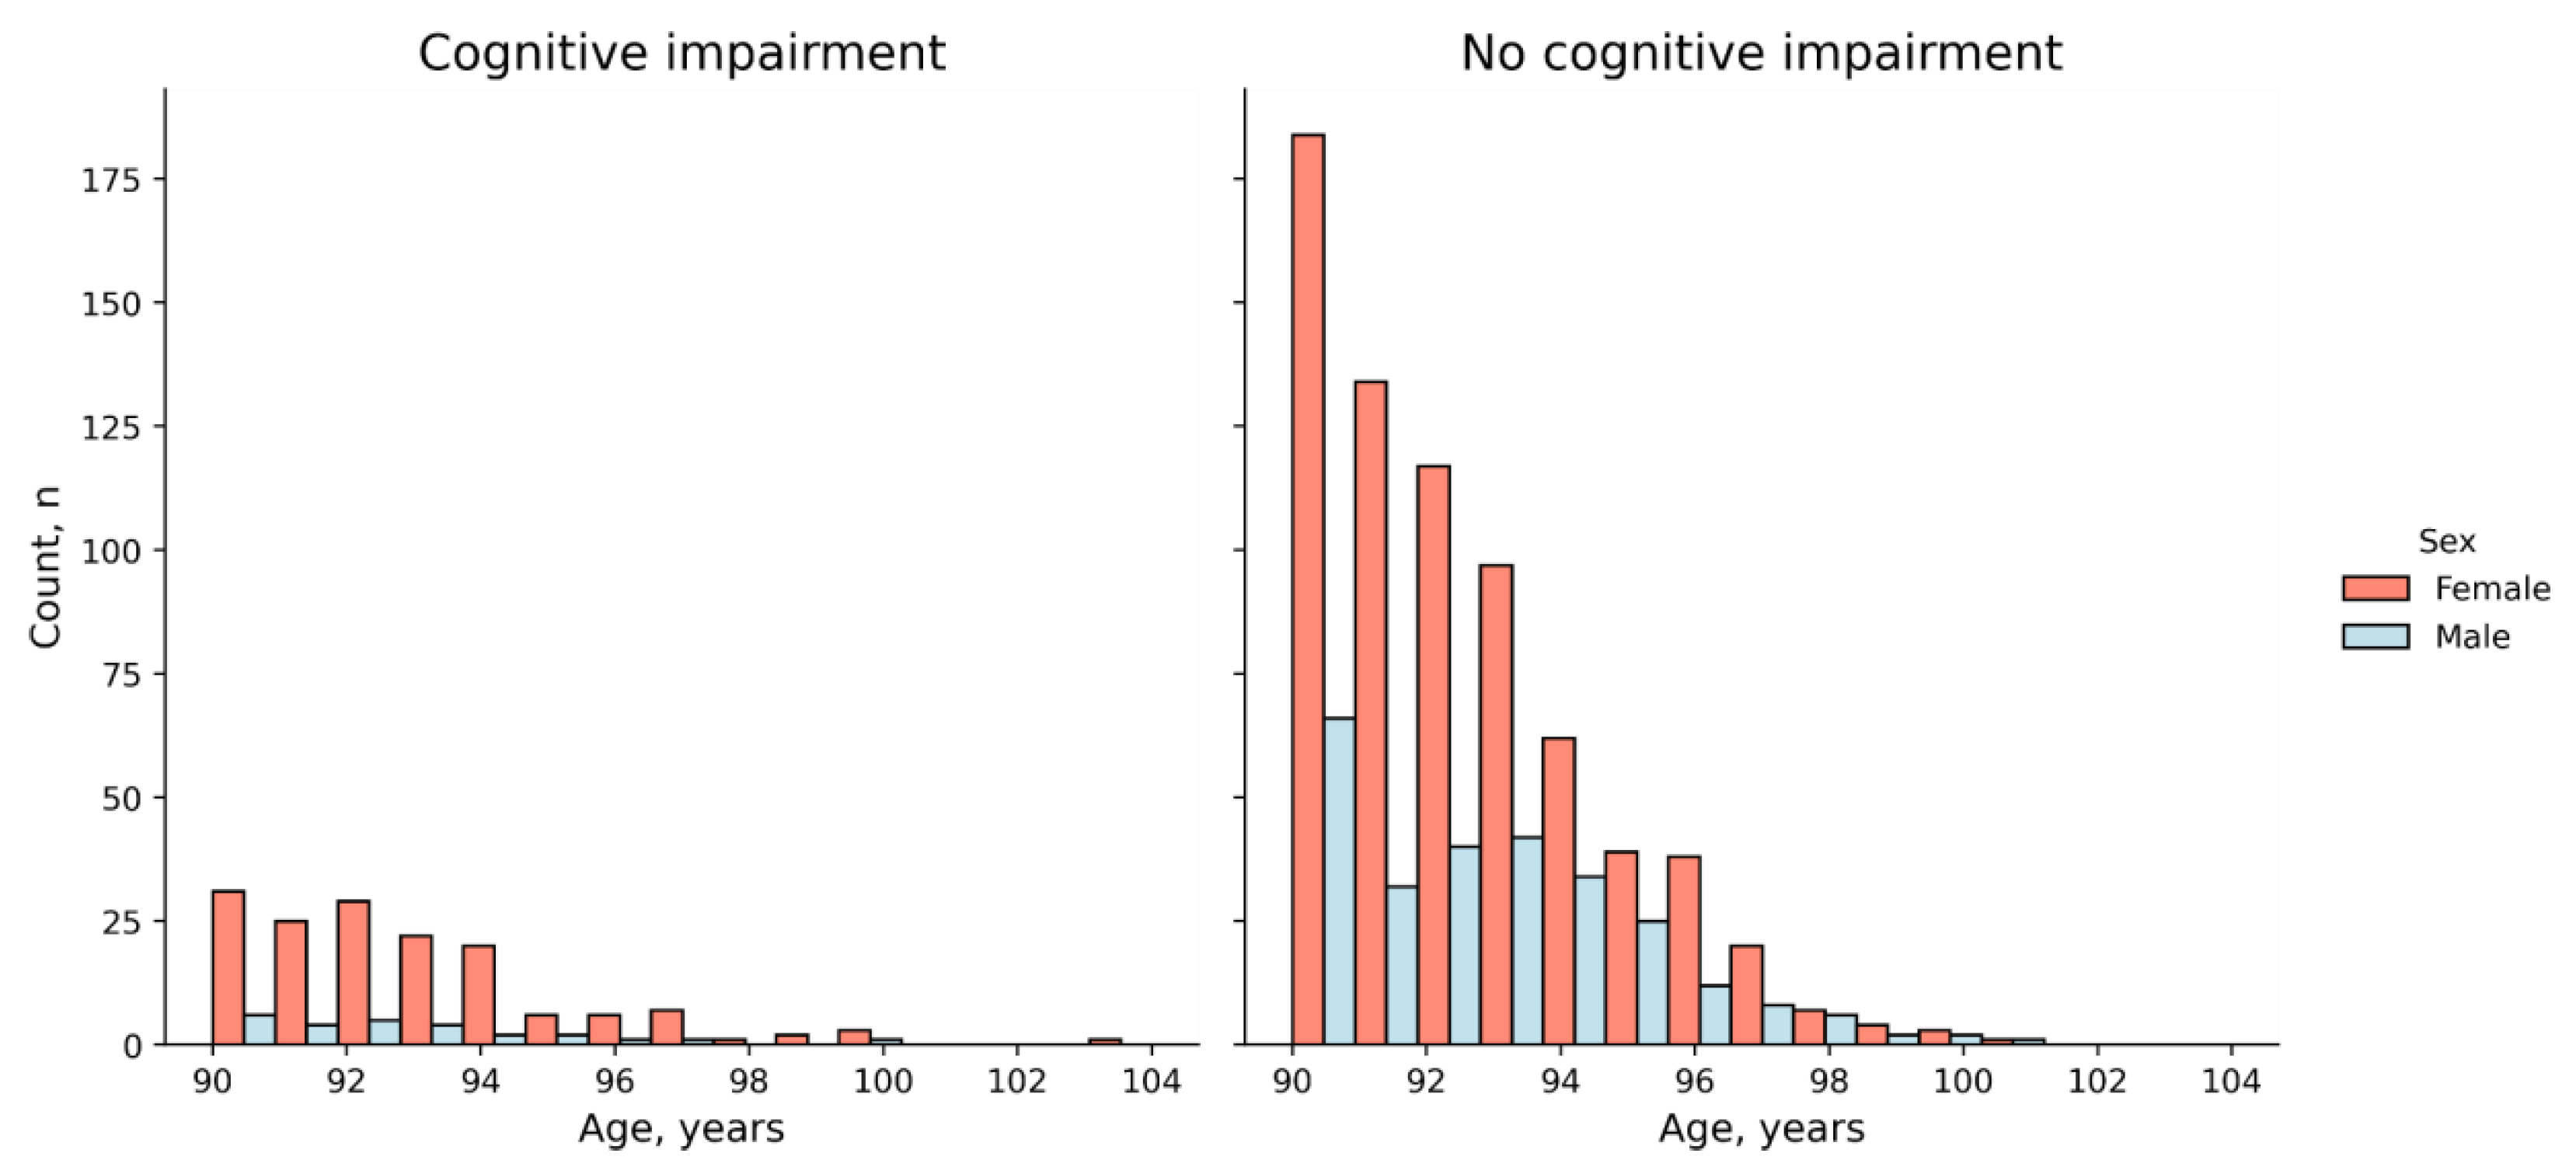
2.1. The Cohort
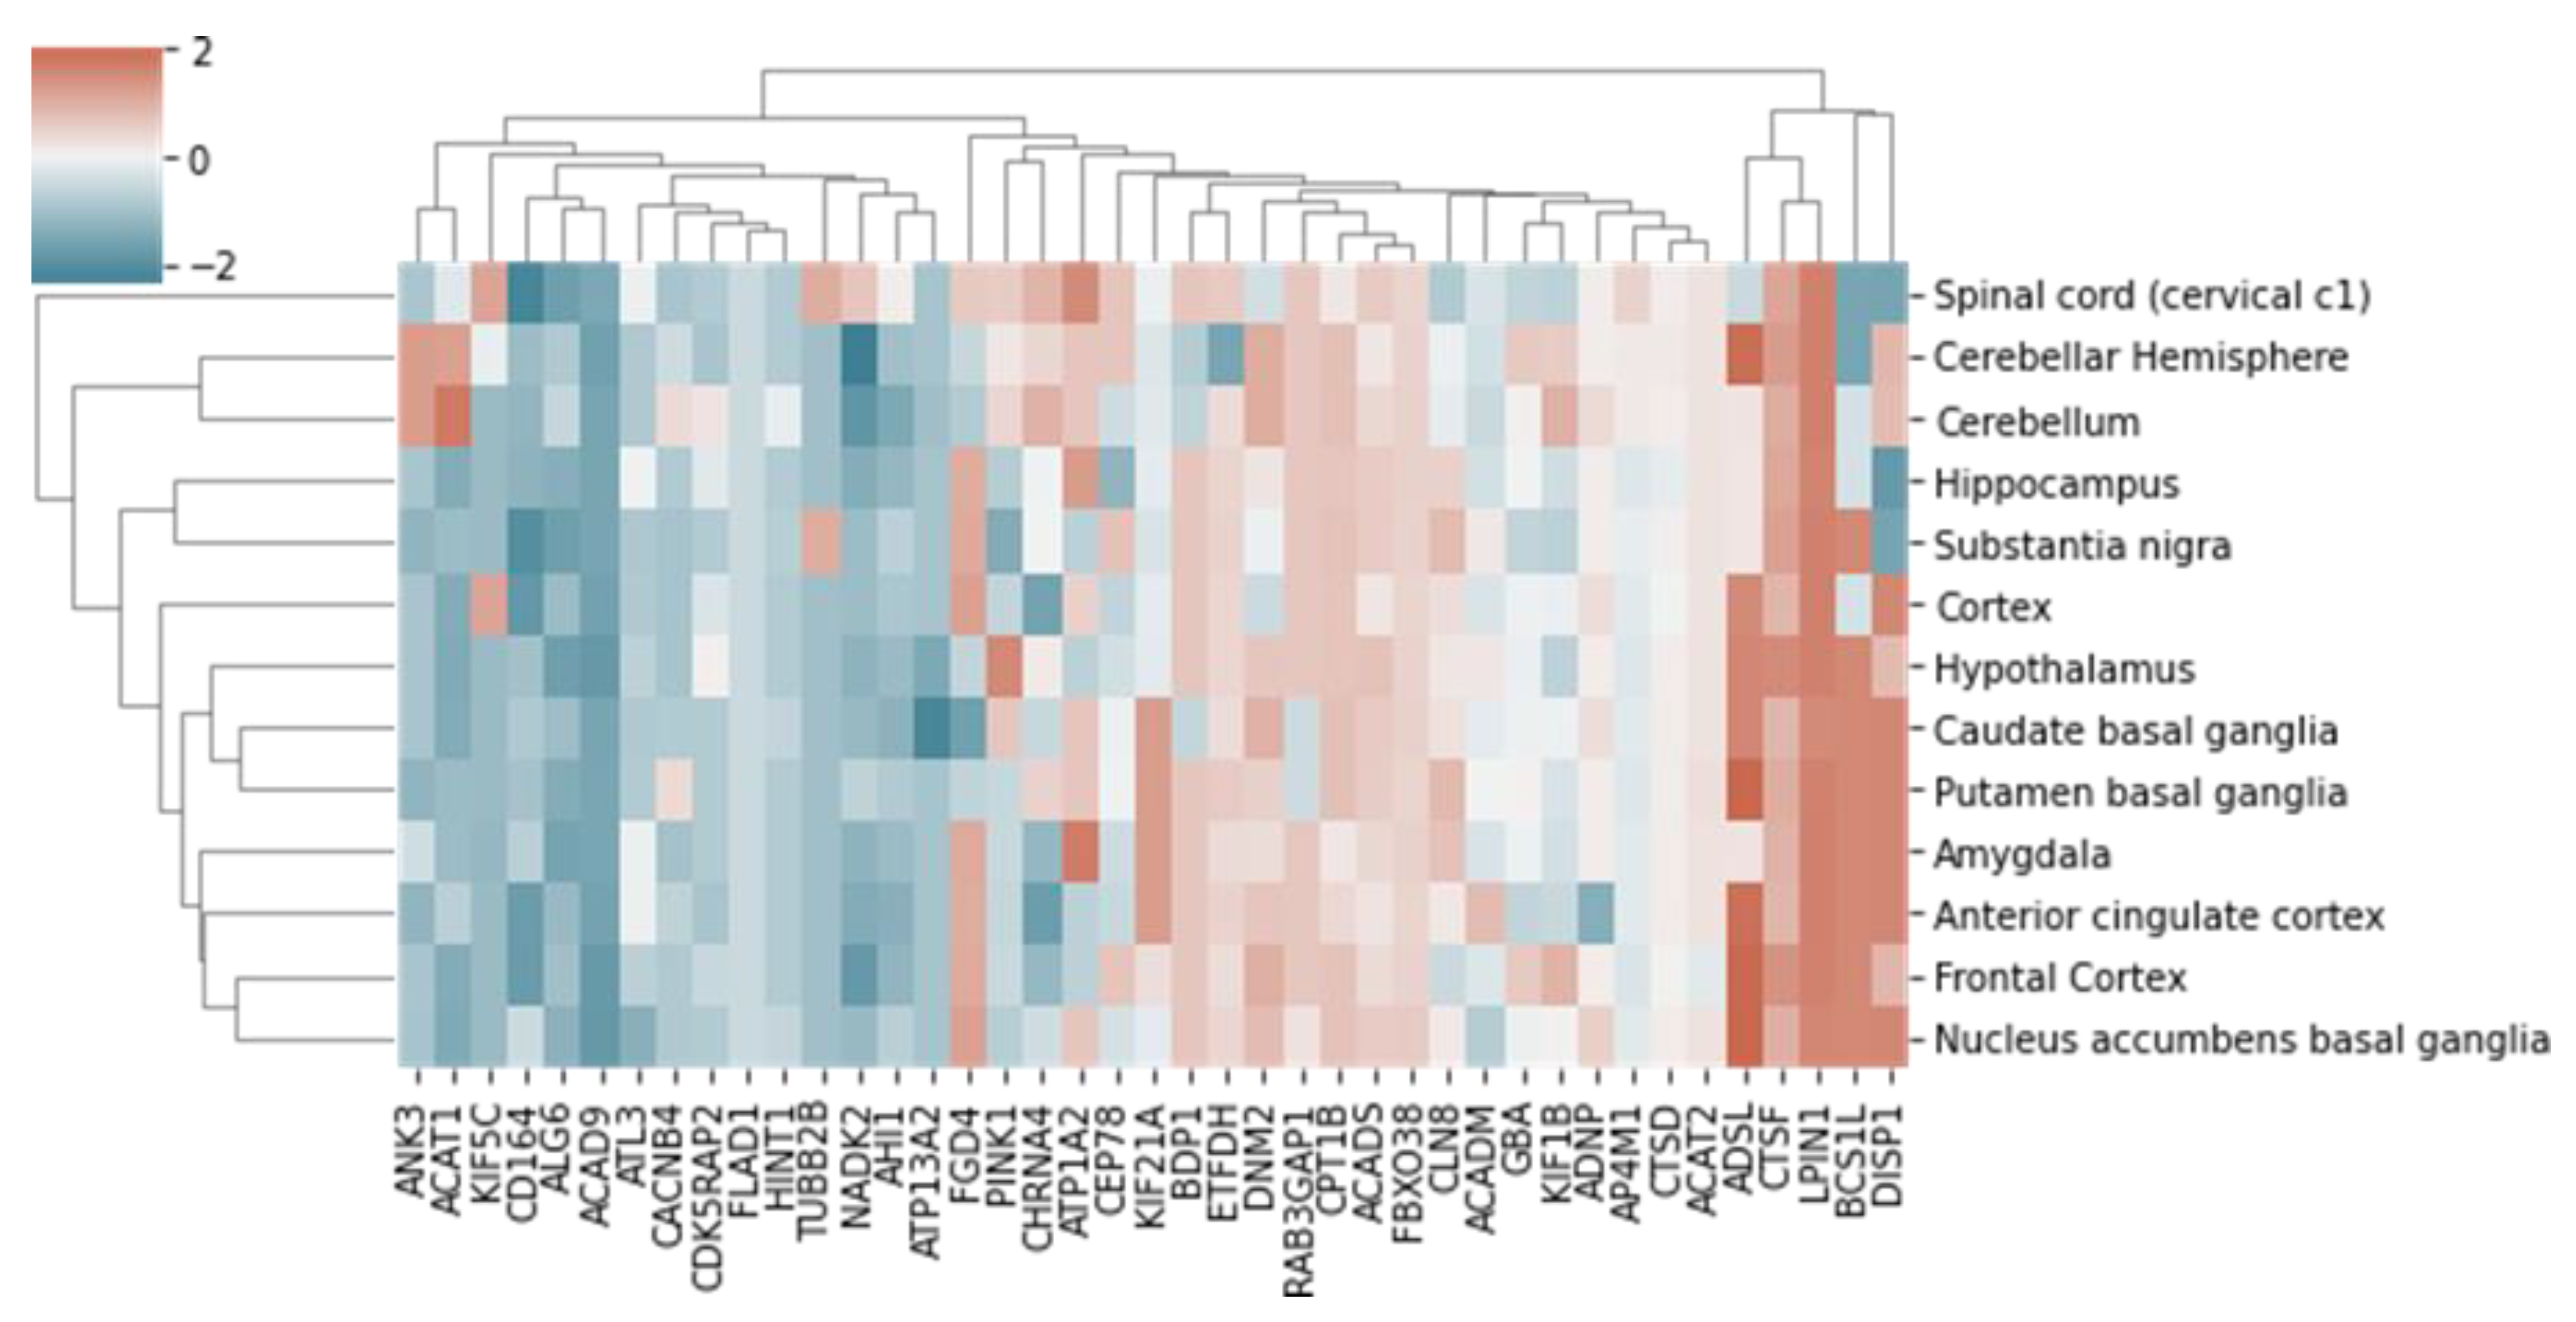
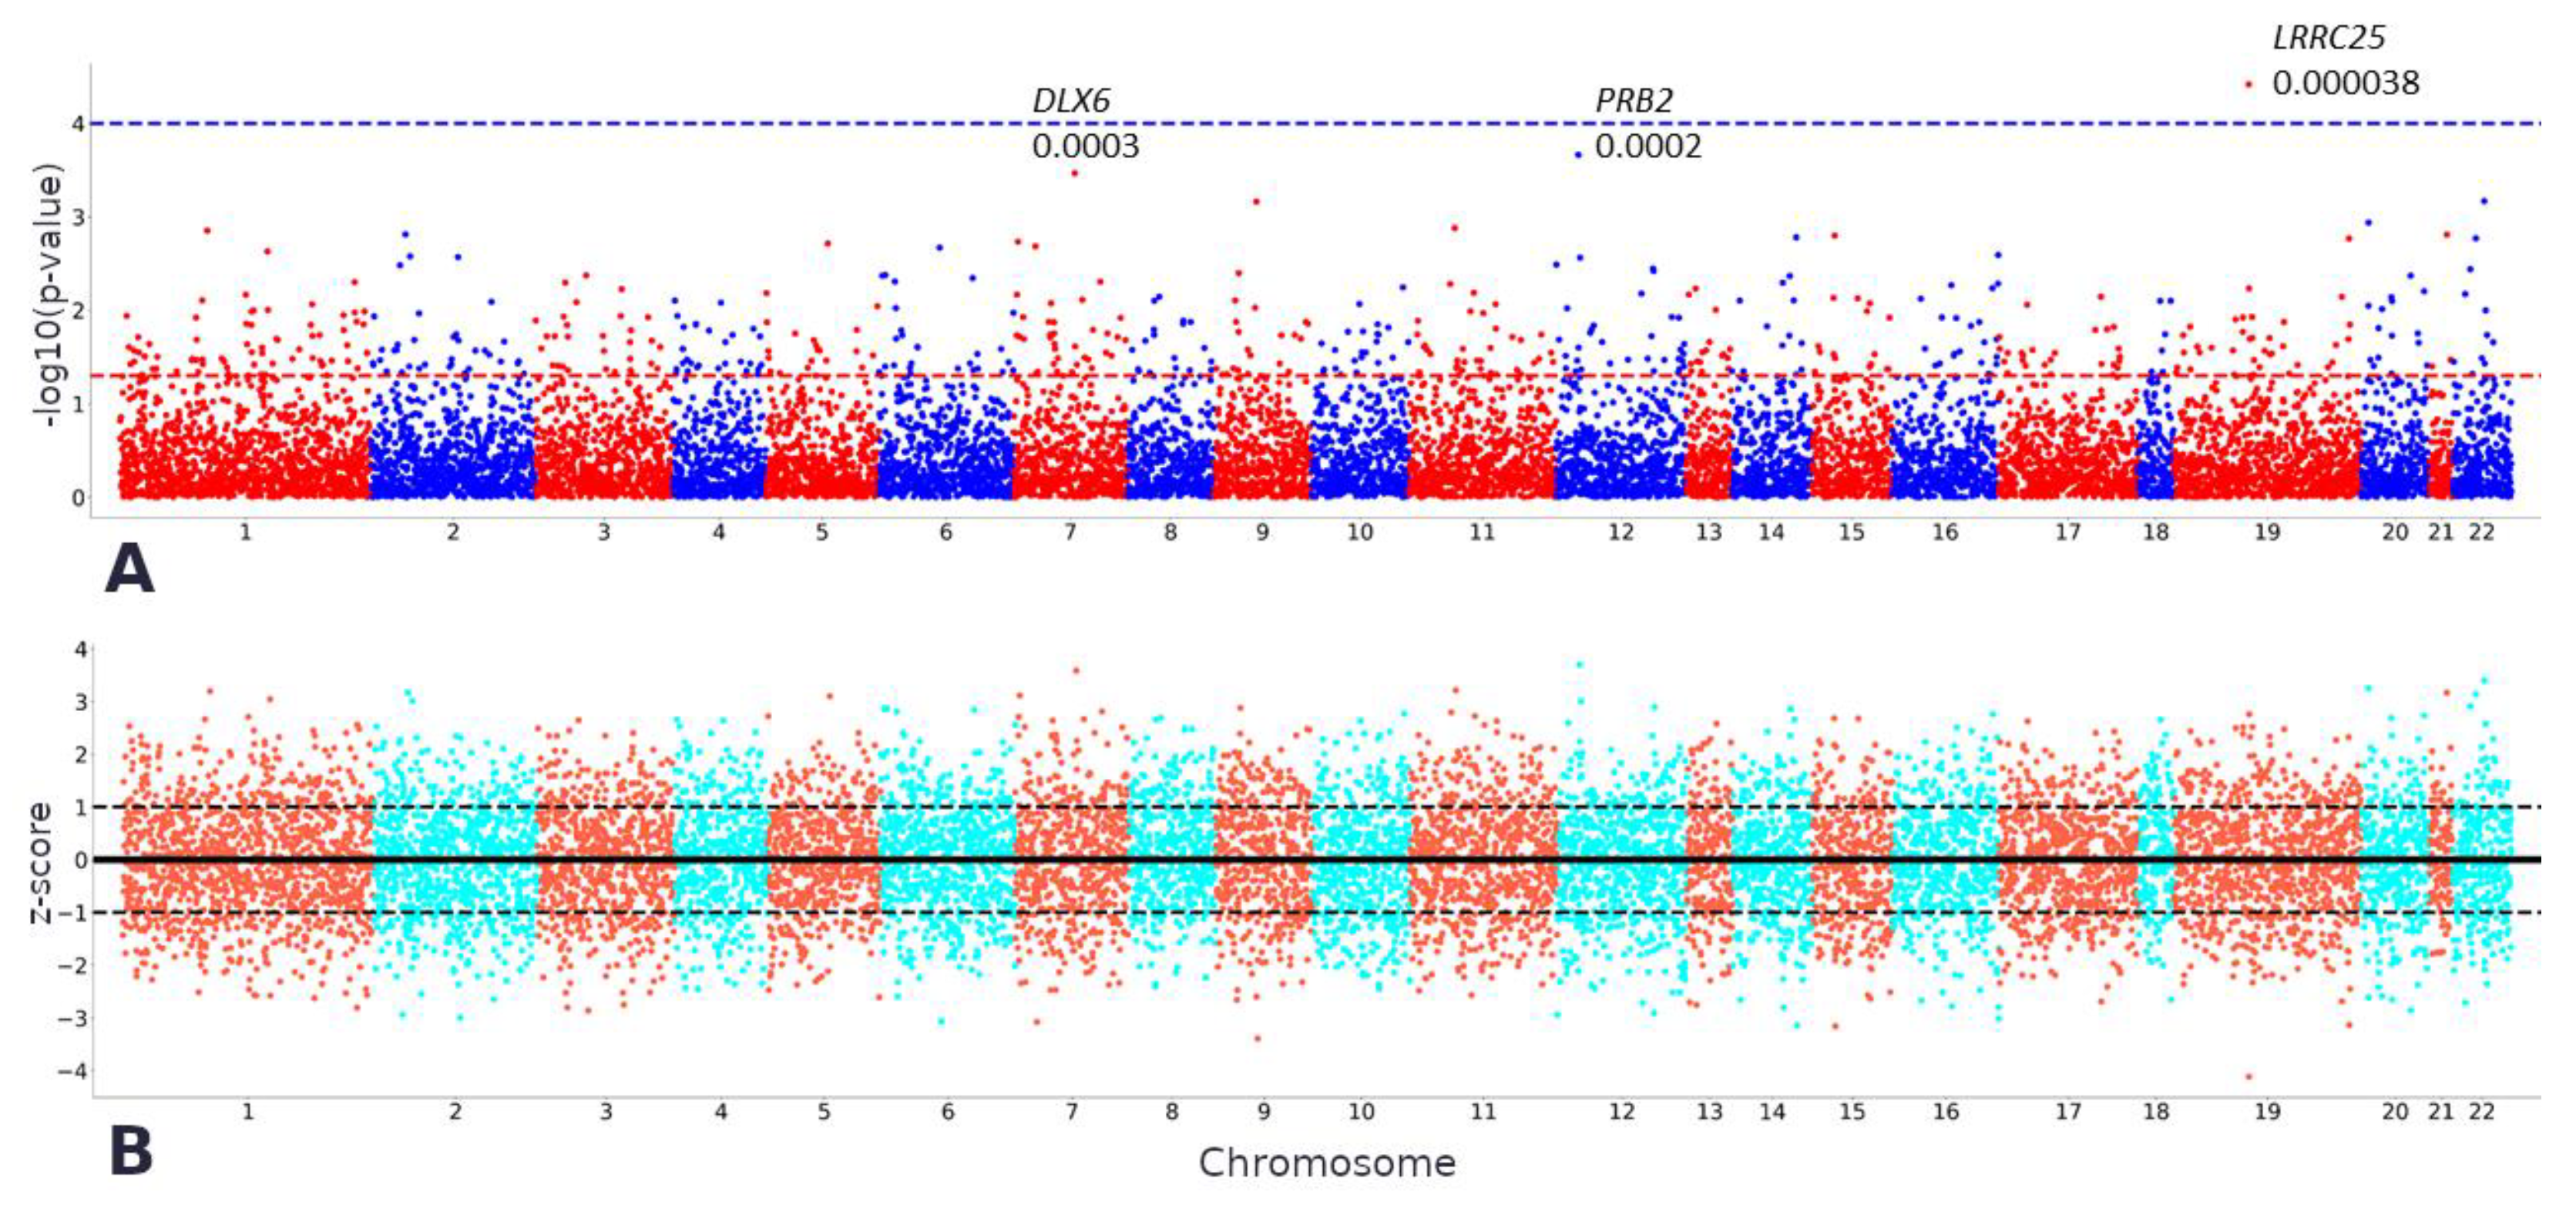
2.2. TWAS
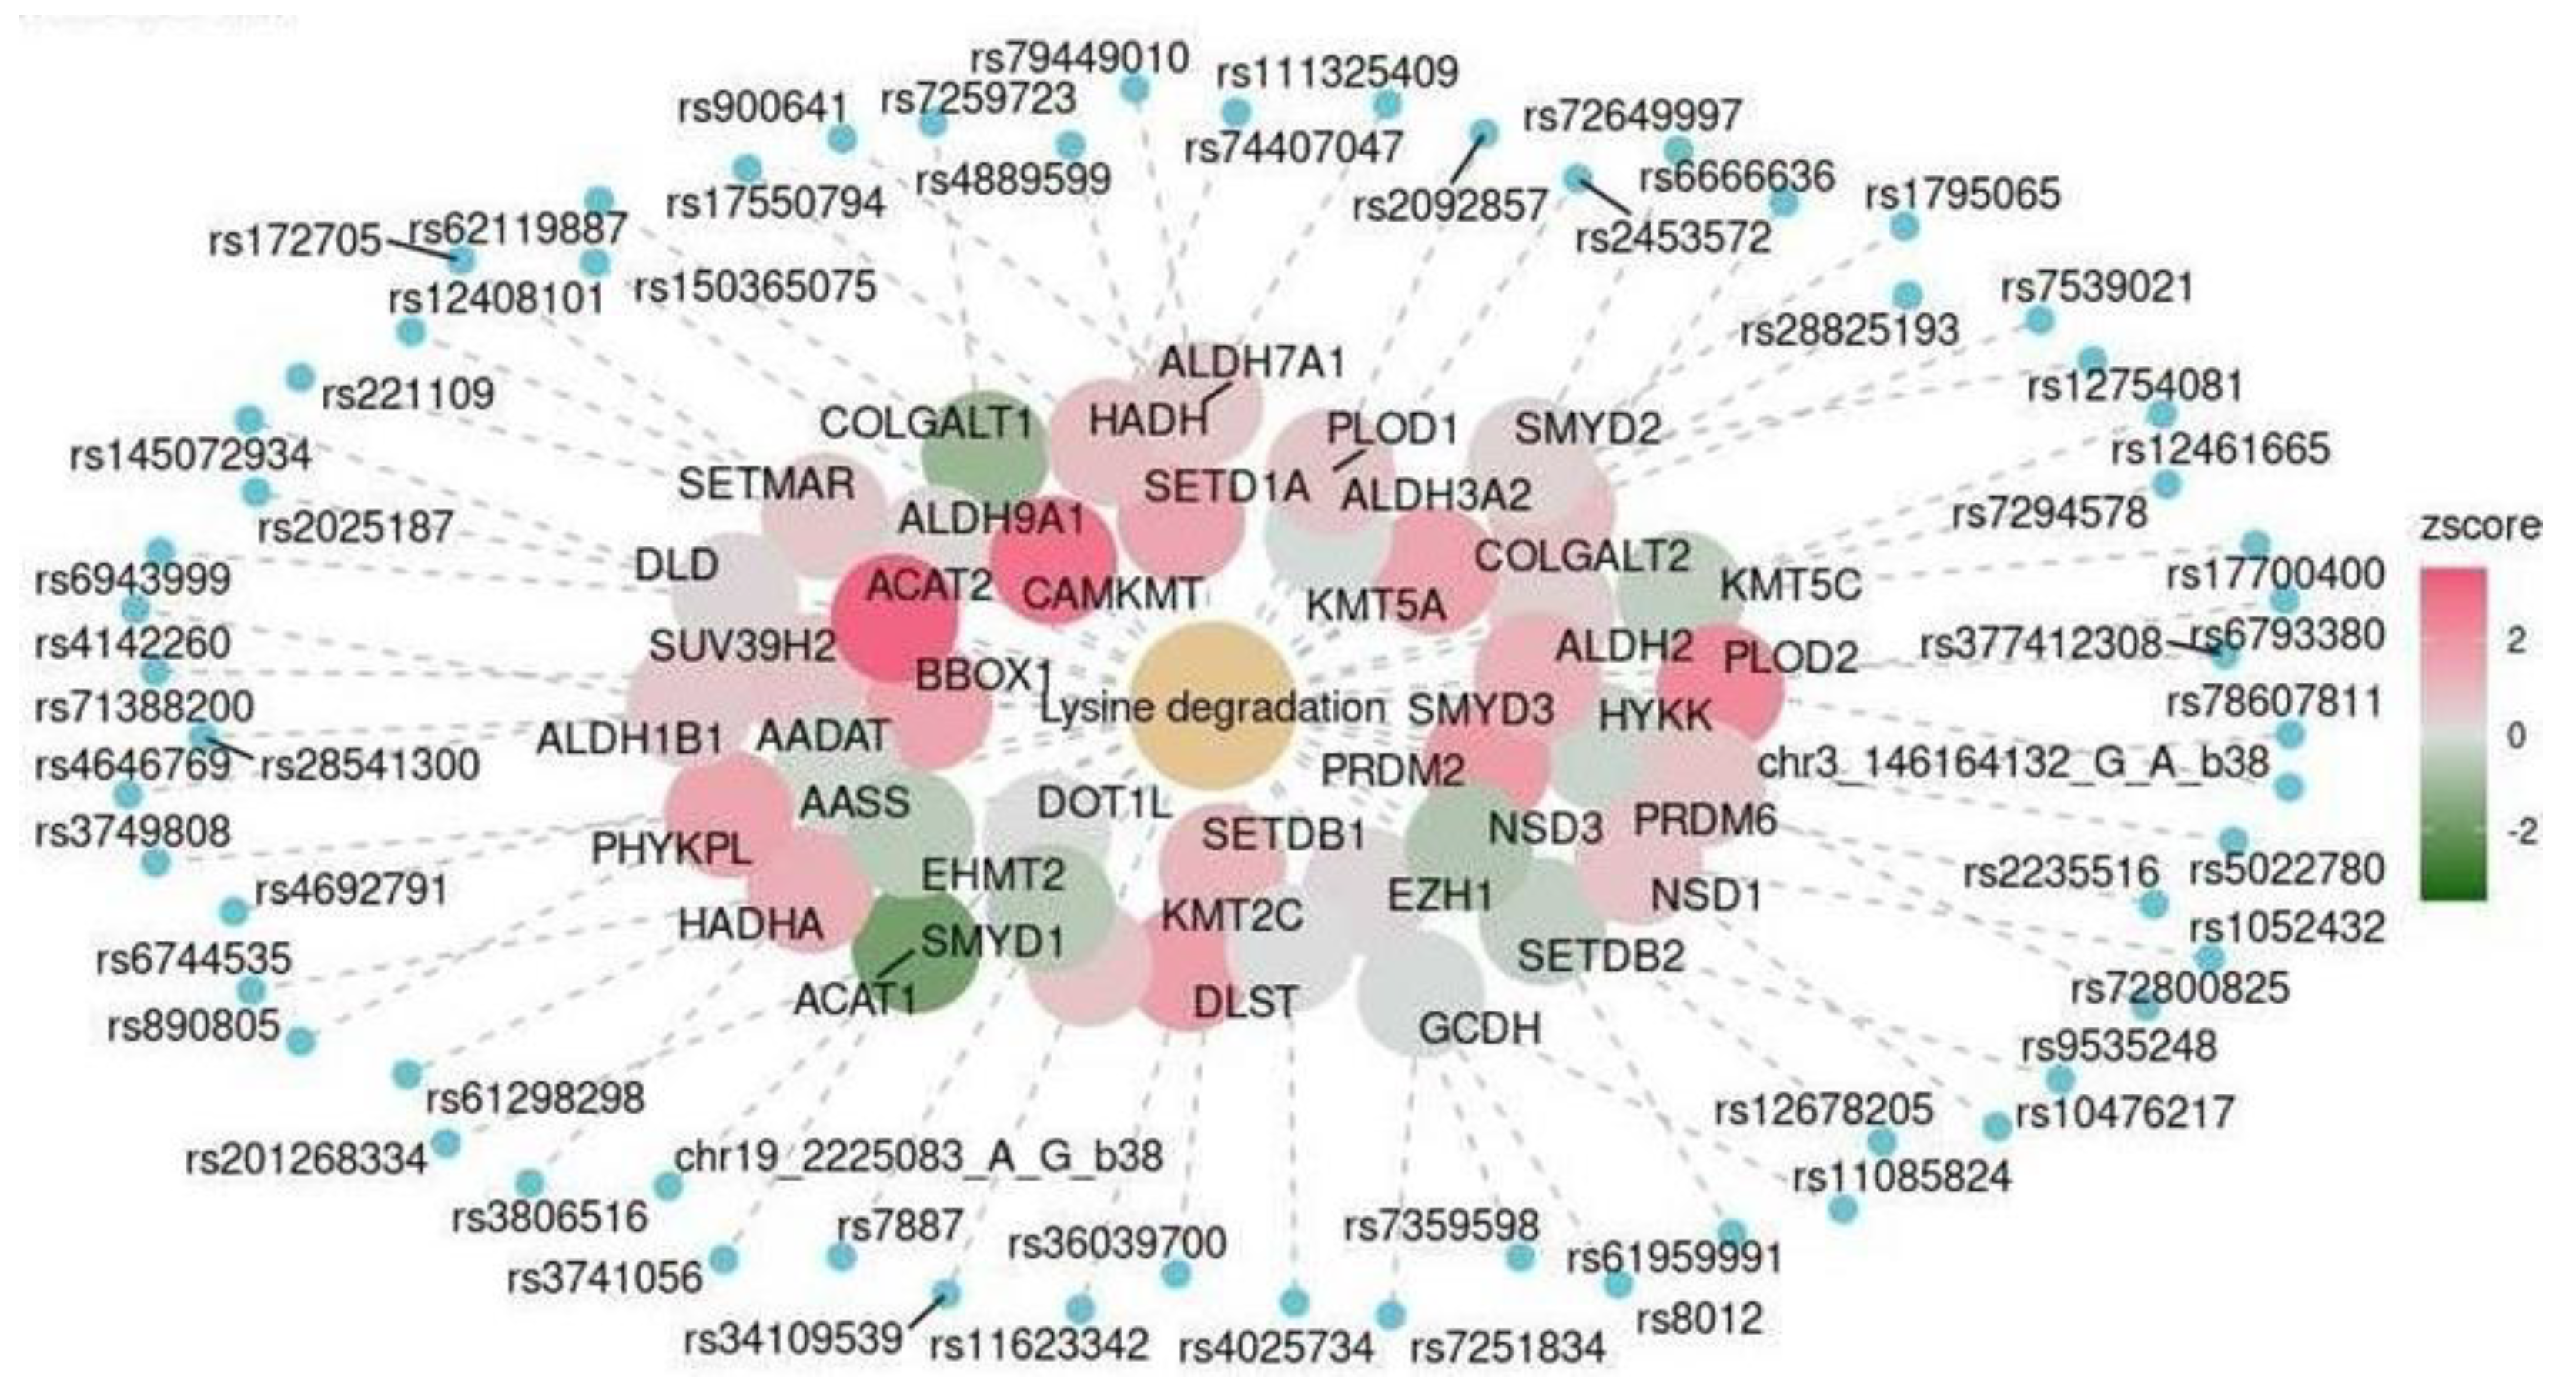
2.3. Functional Analysis
3. Discussion
4. Materials and Methods
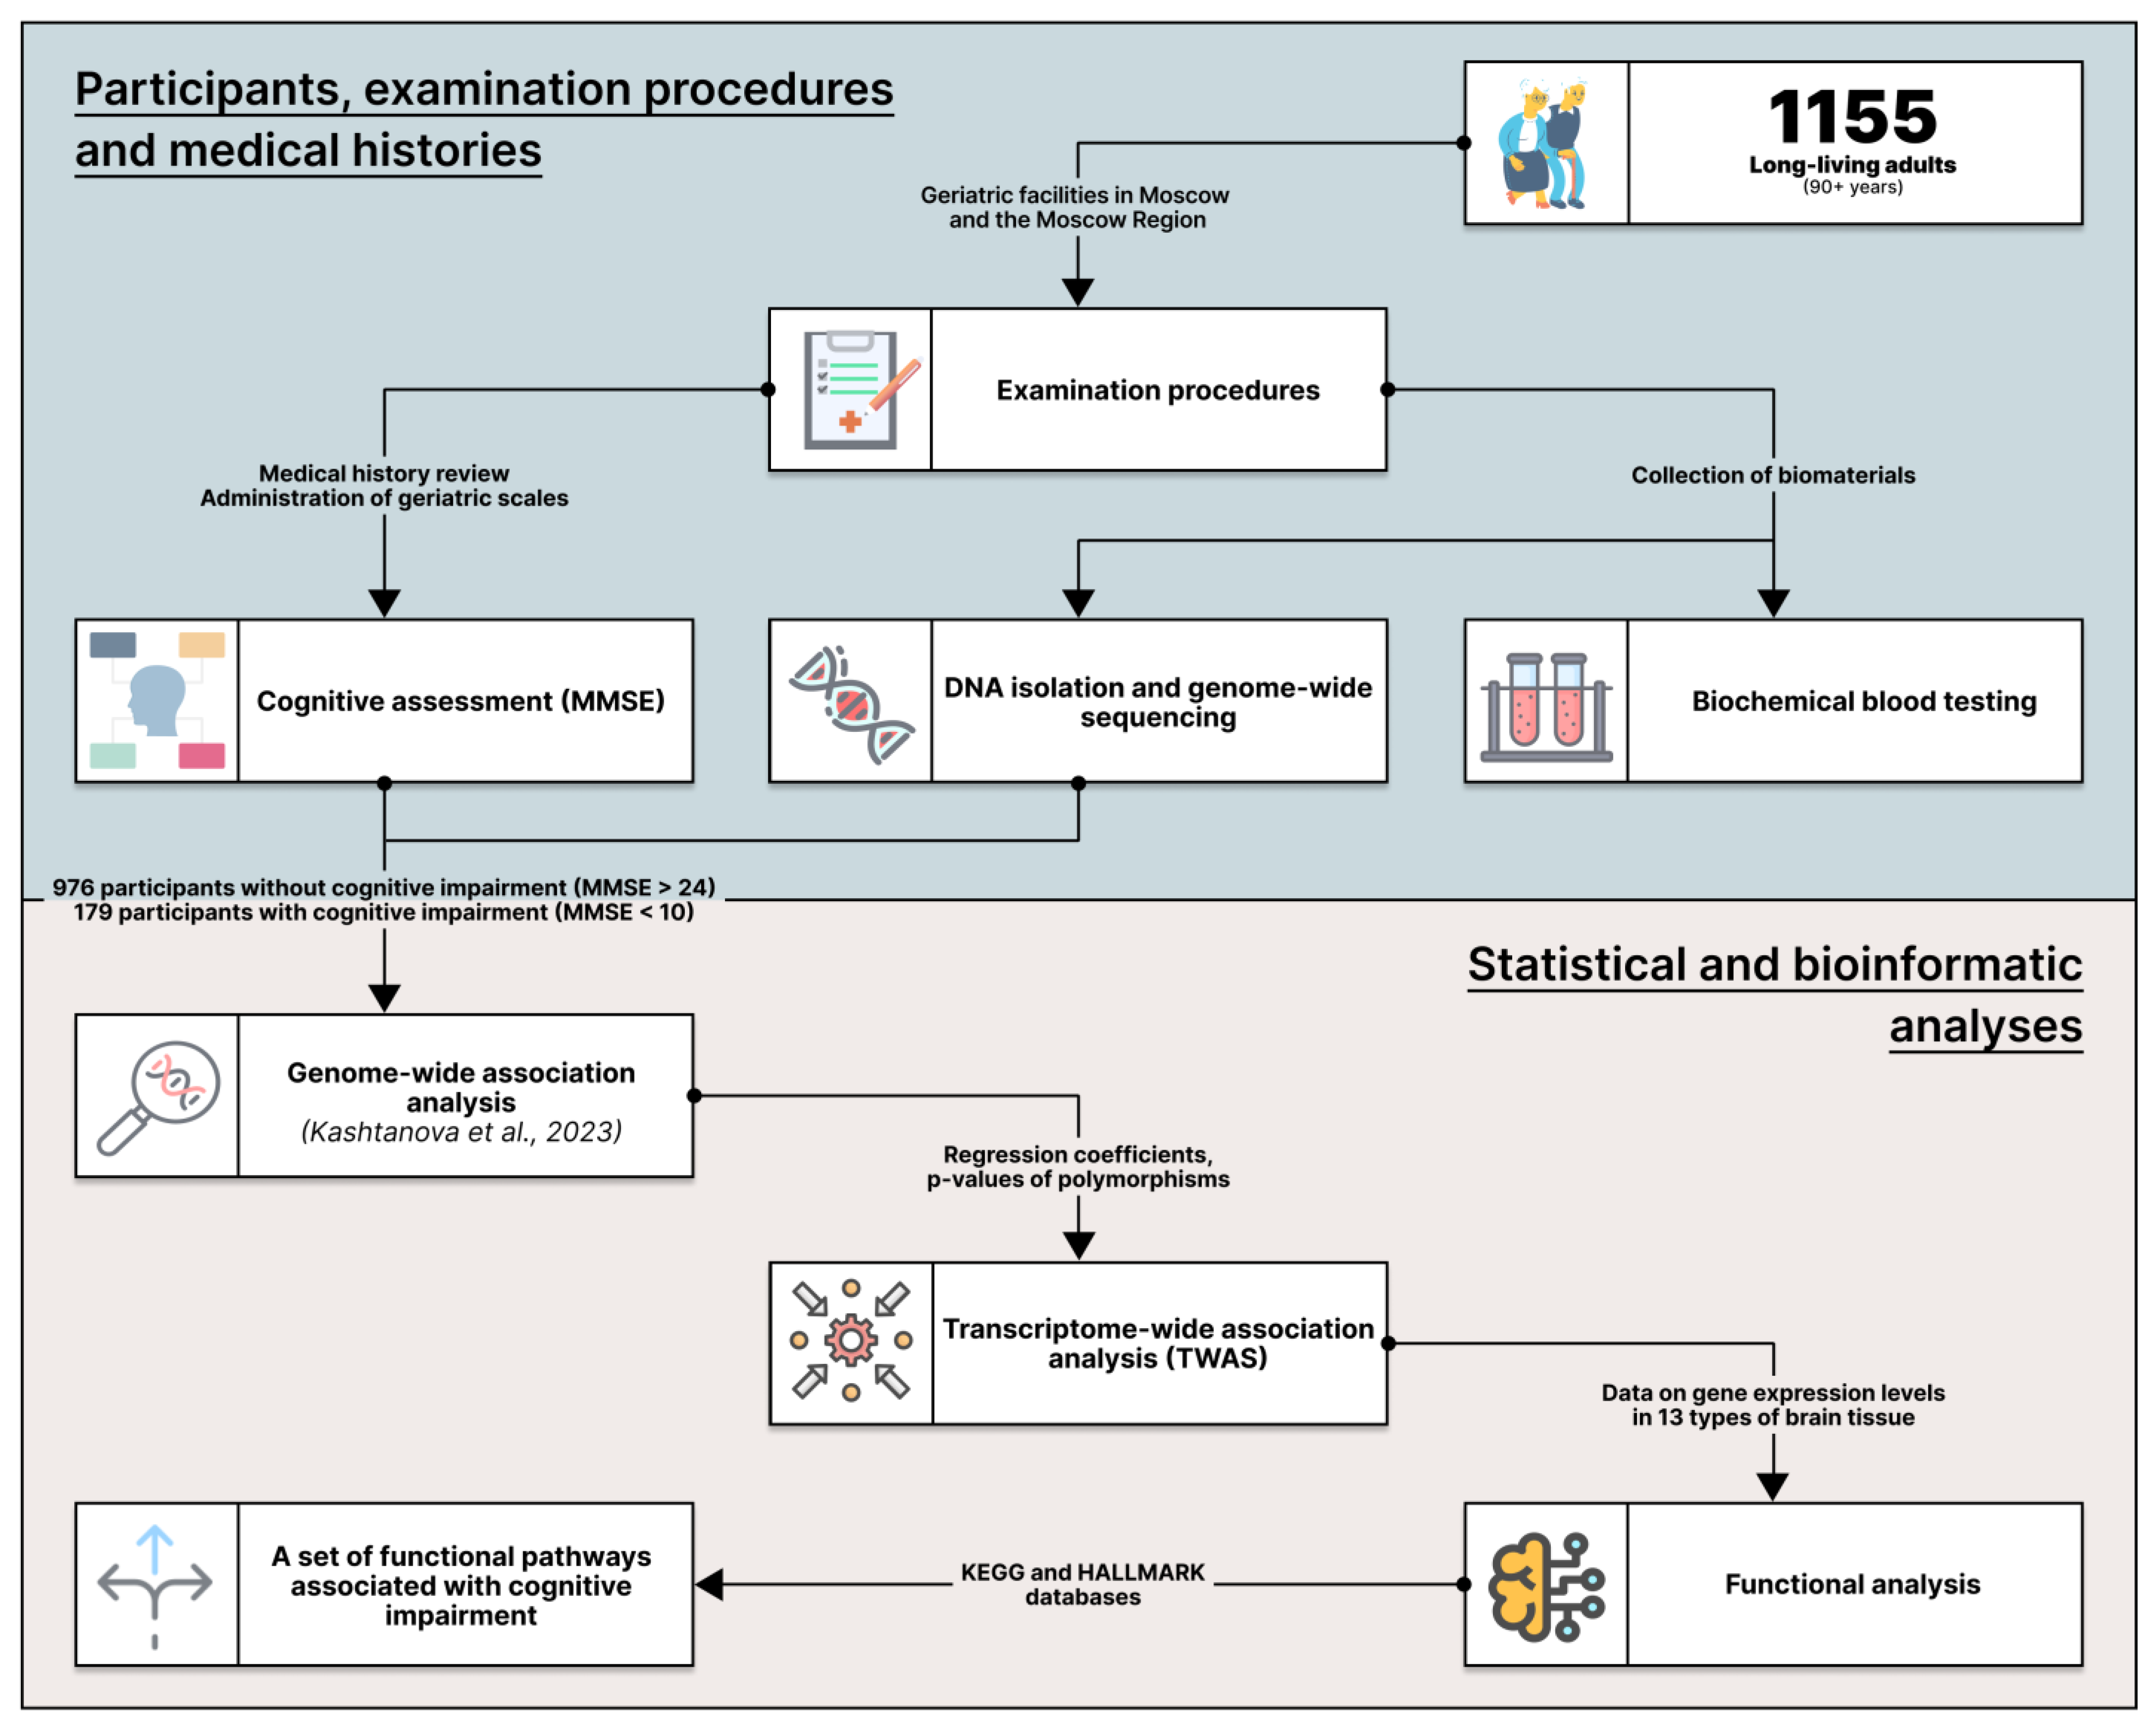
4.1. Participants and Examination Procedures
4.2. Statistical Analysis
4.3. Transcriptome-Wide Association Study (TWAS)
4.4. Functional Analysis
5. Conclusions
6. Limitations
Supplementary Materials
Author Contributions
Funding
Institutional Review Board Statement
Informed Consent Statement
Data Availability Statement
Conflicts of Interest
References
- Liu, C.-C.; Liu, C.-C.; Kanekiyo, T.; Xu, H.; Bu, G. Apolipoprotein E and Alzheimer disease: Risk, mechanisms and therapy. Nat. Rev. Neurol. 2013, 9, 106–118. [Google Scholar] [CrossRef]
- Chuang, Y.F.; Hayden, K.M.; Norton, M.C.; Tschanz, J.; Breitner, J.C.; Welsh-Bohmer, K.A.; Zandi, P.P.; Cache County Investigators. Association between APOE ε4 Allele and Vascular Dementia: The Cache County Study. Dement. Geriatr. Cogn. Disord. 2010, 29, 248–253. [Google Scholar] [CrossRef]
- Bernardi, L.; Maletta, R.G.; Tomaino, C.; Smirne, N.; Di Natale, M.; Perri, M.; Longo, T.; Colao, R.; Curcio, S.A.M.; Puccio, G.; et al. The effects of APOE and tau gene variability on risk of frontotemporal dementia. Neurobiol. Aging 2006, 27, 702–709. [Google Scholar] [CrossRef]
- Mirza, S.S.; Saeed, U.; Knight, J.; Ramirez, J.; Stuss, D.T.; Keith, J.; Nestor, S.M.; Yu, D.; Swardfager, W.; Rogaeva, E.; et al. APOE ε4, white matter hyperintensities, and cognition in Alzheimer and Lewy body dementia. Neurology 2019, 93, e1807–e1819. [Google Scholar] [CrossRef]
- Kashtanova, D.A.; Mamchur, A.A.; Dzhumaniyazova, I.H.; Ivanov, M.V.; Erema, V.V.; Zelenova, E.A.; Yakovchik, A.Y.; Gusakova, M.S.; Rumyantseva, A.M.; Terekhov, M.V.; et al. Cognitive impairment in long-living adults: A genome-wide association study, polygenic risk score model and molecular modeling of the APOE protein. Front. Aging Neurosci. 2023, 15, 1273825. [Google Scholar] [CrossRef]
- Barbeira, A.N.; Dickinson, S.P.; Bonazzola, R.; Zheng, J.; Wheeler, H.E.; Torres, J.M.; Torstenson, E.S.; Shah, K.P.; Garcia, T.; Edwards, T.L.; et al. Exploring the phenotypic consequences of tissue specific gene expression variation inferred from GWAS summary statistics. Nat. Commun. 2018, 9, 1825. [Google Scholar] [CrossRef] [PubMed]
- He, X.; Fuller, C.K.; Song, Y.; Meng, Q.; Zhang, B.; Yang, X.; Li, H. Sherlock: Detecting Gene-Disease Associations by Matching Patterns of Expression QTL and GWAS. Am. J. Hum. Genet. 2013, 92, 667–680. [Google Scholar] [CrossRef] [PubMed]
- Wen, X.; Pique-Regi, R.; Luca, F. Integrating molecular QTL data into genome- wide genetic association analysis: Probabilistic assessment of enrichment and colocalization. PLoS Genet. 2017, 13, e1006646. [Google Scholar] [CrossRef] [PubMed]
- Sun, Y.; Zhu, J.; Zhou, D.; Canchi, S.; Wu, C.; Cox, N.J.; Rissman, R.A.; Gamazon, E.R.; Wu, L. A transcriptome-wide association study of Alzheimer’s disease using prediction models of relevant tissues identifies novel candidate susceptibility genes. Genome Med. 2021, 13, 141. [Google Scholar] [CrossRef] [PubMed]
- Kramarz, B.; Lovering, R.C. Gene Ontology: A Resource for Analysis and Interpretation of Alzheimer’s Disease Data. In Alzheimer’s Disease; Wisniewski, T., Ed.; Codon Publications: Brisbane, Australia, 2019. [Google Scholar]
- Chouliaras, L.; Pishva, E.; Haapakoski, R.; Zsoldos, E.; Mahmood, A.; Filippini, N.; Burrage, J.; Mill, J.; Kivimäki, M.; Lunnon, K.; et al. Peripheral DNA methylation, cognitive decline and brain aging: Pilot findings from the Whitehall II imaging study. Epigenomics 2018, 10, 585–595. [Google Scholar] [CrossRef] [PubMed]
- Feng, Y.; Duan, T.; Du, Y.; Jin, S.; Wang, M.; Cui, J.; Wang, R.F. LRRC25 Functions as an Inhibitor of NF-κB Signaling Pathway by Promoting p65/RelA for Autophagic Degradation. Sci. Rep. 2017, 7, 13448. [Google Scholar] [CrossRef]
- Sun, E.; Motolani, A.; Campos, L.; Lu, T. The Pivotal Role of NF-kB in the Pathogenesis and Therapeutics of Alzheimer’s Disease. Int. J. Mol. Sci. 2022, 23, 8972. [Google Scholar] [CrossRef]
- Kosoy, R.; Fullard, J.F.; Zeng, B.; Bendl, J.; Dong, P.; Rahman, S.; Kleopoulos, S.P.; Shao, Z.; Girdhar, K.; Humphrey, J.; et al. Genetics of the human microglia regulome refines Alzheimer’s disease risk loci. Nat Genet. 2022, 54, 1145–1154. [Google Scholar] [CrossRef]
- Xiong, L.L.; Xue, L.L.; Al-Hawwas, M.; Huang, J.; Niu, R.Z.; Tan, Y.X.; Xu, Y.; Su, Y.Y.; Liu, J.; Wang, T.H. Single-nucleotide polymorphism screening and RNA sequencing of key messenger RNAs associated with neonatal hypoxic-ischemia brain damage. Neural Regen. Res. 2020, 15, 86. [Google Scholar]
- Sharma, V.K.; Singh, T.G.; Singh, S.; Garg, N.; Dhiman, S. Apoptotic Pathways and Alzheimer’s Disease: Probing Therapeutic Potential. Neurochem. Res. 2021, 46, 3103–3122. [Google Scholar] [CrossRef]
- Erekat, N.S. Apoptosis and its therapeutic implications in neurodegenerative diseases. Clin. Anat. 2022, 35, 65–78. [Google Scholar] [CrossRef]
- Falah, M.; Najafi, M.; Houshmand, M.; Farhadi, M. Expression levels of the BAK1 and BCL2 genes highlight the role of apoptosis in age-related hearing impairment. Clin. Interv. Aging 2016, 11, 1003. [Google Scholar] [CrossRef]
- Mangalmurti, A.; Lukens, J.R. How neurons die in Alzheimer’s disease: Implications for neuroinflammation. Curr. Opin. Neurobiol. 2022, 75, 102575. [Google Scholar] [CrossRef] [PubMed]
- Fransen, M.; Nordgren, M.; Wang, B.; Apanasets, O. Role of peroxisomes in ROS/RNS-metabolism: Implications for human disease. Biochim. Biophys. Acta (BBA)—Mol. Basis Dis. 2012, 1822, 1363–1373. [Google Scholar] [CrossRef] [PubMed]
- Fanelli, F.; Sepe, S.; D’Amelio, M.; Bernardi, C.; Cristiano, L.; Cimini, A.; Cecconi, F.; Ceru’, M.P.; Moreno, S. Age-dependent roles of peroxisomes in the hippocampus of a transgenic mouse model of Alzheimer’s disease. Mol. Neurodegener. 2013, 8, 8. [Google Scholar] [CrossRef] [PubMed]
- Bennett, S.; Grant, M.M.; Aldred, S. Oxidative stress in vascular dementia and Alzheimer’s disease: A common pathology. J. Alzheimers Dis. 2009, 17, 245–257. [Google Scholar] [CrossRef] [PubMed]
- Fontaine, E. Metformin-Induced Mitochondrial Complex I Inhibition: Facts, Uncertainties, and Consequences. Front. Endocrinol. 2018, 9, 753. [Google Scholar] [CrossRef] [PubMed]
- Campbell, J.M.; Bellman, S.M.; Stephenson, M.D.; Lisy, K. Metformin reduces all-cause mortality and diseases of ageing independent of its effect on diabetes control: A systematic review and meta-analysis. Ageing Res. Rev. 2017, 40, 31–44. [Google Scholar] [CrossRef] [PubMed]
- Trushina, E.; Trushin, S.; Hasan, M.F. Mitochondrial complex I as a therapeutic target for Alzheimer’s disease. Acta Pharm. Sin. B. 2022, 12, 483–495. [Google Scholar] [CrossRef] [PubMed]
- Cai, Z.; Li, H. An Updated Review: Androgens and Cognitive Impairment in Older Men. Front. Endocrinol. 2020, 11, 586909. [Google Scholar] [CrossRef] [PubMed]
- Mokhtari, Z.; Hekmatdoost, A.; Nourian, M. Antioxidant efficacy of vitamin D. J. Parathyr. Dis. 2016, 5, 11–16. [Google Scholar]
- Tagliaferri, S.; Porri, D.; De Giuseppe, R.; Manuelli, M.; Alessio, F.; Cena, H. The controversial role of vitamin D as an antioxidant: Results from randomised controlled trials. Nutr. Res. Rev. 2019, 32, 99–105. [Google Scholar] [CrossRef] [PubMed]
- Baranowska-Bik, A.; Bik, W. Insulin and brain aging. Menopause Rev./Przegląd Menopauzalny 2017, 16, 44–46. [Google Scholar] [CrossRef]
- Hoyos, C.M.; Colagiuri, S.; Turner, A.; Ireland, C.; Naismith, S.L.; Duffy, S.L. Brain oxidative stress and cognitive function in older adults with diabetes and pre-diabetes who are at risk for dementia. Diabetes Res. Clin. Pract. 2022, 184, 109178. [Google Scholar] [CrossRef]
- Zhang, Y.-L.; Huang, C.-Q.; Li, Y.; Dong, B.-R. Association of fasting serum insulin and fasting serum glucose levels with cognitive impairment in Chinese nonagenarians/centenarians. Age 2014, 36, 427–434. [Google Scholar]
- Huang, C.Q.; Dong, B.R.; Wu, H.M.; Zhang, Y.L.; Wu, J.H.; Lu, Z.C.; Flaherty, J.H. Association of cognitive impairment with serum lipid/lipoprotein among Chinese nonagenarians and centenarians. Dement. Geriatr. Cogn. Disord. 2009, 27, 111–116. [Google Scholar] [CrossRef]
- Frater, J.; Lie, D.; Bartlett, P.; McGrath, J.J. Insulin-like Growth Factor 1 (IGF-1) as a marker of cognitive decline in normal ageing: A review. Ageing Res. Rev. 2018, 42, 14–27. [Google Scholar] [CrossRef]
- Heck, S.; Lezoualc’h, F.; Engert, S.; Behl, C. Insulin-like Growth Factor-1-mediated Neuroprotection against Oxidative Stress Is Associated with Activation of Nuclear Factor κB. J. Biol. Chem. 1999, 274, 9828–9835. [Google Scholar] [CrossRef]
- Kooijman, R. Regulation of apoptosis by insulin-like growth factor (IGF)-I. Cytokine Growth Factor Rev. 2006, 17, 305–323. [Google Scholar] [CrossRef]
- Yu, L.; Huo, Z.; Yang, J.; Palma-Gudiel, H.; Boyle, P.A.; Schneider, J.A.; Bennett, D.A.; Zhao, J. Human Brain and Blood N-Glycome Profiling in Alzheimer’s Disease and Alzheimer’s Disease-Related Dementias. Front. Aging Neurosci. 2021, 13, 765259. [Google Scholar] [CrossRef]
- Baudot, A.D.; Wang, V.M.Y.; Leach, J.D.; O’Prey, J.; Long, J.S.; Paulus-Hock, V.; Lilla, S.; Thomson, D.M.; Greenhorn, J.; Ghaffar, F.; et al. Glycan degradation promotes macroautophagy. Proc. Natl. Acad. Sci. USA 2022, 119, e2111506119. [Google Scholar] [CrossRef]
- Castellazzi, M.; Patergnani, S.; Donadio, M.; Giorgi, C.; Bonora, M.; Bosi, C.; Brombo, G.; Pugliatti, M.; Seripa, D.; Zuliani, G.; et al. Autophagy and mitophagy biomarkers are reduced in sera of patients with Alzheimer’s disease and mild cognitive impairment. Sci. Rep. 2019, 9, 20009. [Google Scholar] [CrossRef] [PubMed]
- Bouchereau, J.; Schiff, M. Inherited Disorders of Lysine Metabolism: A Review. J. Nutr. 2020, 150, 2556S–2560S. [Google Scholar] [CrossRef] [PubMed]
- Leandro, J.; Houten, S.M. The lysine degradation pathway: Subcellular compartmentalization and enzyme deficiencies. Mol. Genet. Metab. 2020, 131, 14–22. [Google Scholar] [CrossRef] [PubMed]
- Griffin, J.W.D.; Bradshaw, P.C. Amino acid catabolism in Alzheimer’s disease brain: Friend or foe? Oxid. Med. Cell. Longev. 2017, 2017, 5472792. [Google Scholar] [CrossRef] [PubMed]
- Kashtanova, D.A.; Taraskina, A.N.; Erema, V.V.; Akopyan, A.A.; Ivanov, M.V.; Strazhesko, I.D.; Akinshina, A.I.; Yudin, V.S.; Makarov, V.V.; Kraevoy, S.A.; et al. Analyzing Successful Aging and Longevity: Risk Factors and Health Promoters in 2020 Older Adults. Int. J. Environ. Res. Public Health 2022, 19, 8187. [Google Scholar] [CrossRef] [PubMed]
- Folstein, M.F.; Folstein, S.E.; McHugh, P.R. “Mini-mental state”. A practical method for grading the cognitive state of patients for the clinician. J. Psychiatr. Res. 1975, 12, 189–198. [Google Scholar] [CrossRef] [PubMed]
- Upton, J. Mini-Mental State Examination. In Encyclopedia of Behavioral Medicine; Springer New York: New York, NY, USA, 2013; pp. 1248–1249. [Google Scholar]
- Seabold, S.; Perktold, J. Statsmodels: Econometric and Statistical Modeling with Python. In Proceedings of the 9th Python in Science Conference, Austin, TX, USA, 28 June–3 July 2010. [Google Scholar] [CrossRef]
- Waskom, M. seaborn: Statistical data visualization. J. Open Source Softw. 2021, 6, 3021. [Google Scholar] [CrossRef]
- Rehm, H.L.; Berg, J.S.; Brooks, L.D.; Bustamante, C.D.; Evans, J.P.; Landrum, M.J.; Ledbetter, D.H.; Maglott, D.R.; Martin, C.L.; Nussbaum, R.L.; et al. ClinGen—The Clinical Genome Resource. N. Engl. J. Med. 2015, 372, 2235–2242. [Google Scholar] [CrossRef]
- Lonsdale, J.; Thomas, J.; Salvatore, M.; Phillips, R.; Lo, E.; Shad, S.; Hasz, R.; Walters, G.; Garcia, F.; Young, N.; et al. The Genotype-Tissue Expression (GTEx) project. Nat. Genet. 2013, 45, 580–585. [Google Scholar] [CrossRef]
- Wu, T.; Hu, E.; Xu, S.; Chen, M.; Guo, P.; Dai, Z.; Feng, T.; Zhou, L.; Tang, W.; Zhan, L.I.; et al. clusterProfiler 4.0: A universal enrichment tool for interpreting omics data. Innovation 2021, 2, 100141. [Google Scholar] [CrossRef]
- Kanehisa, M.; Goto, S. KEGG: Kyoto Encyclopedia of Genes and Genomes. Nucleic Acids Res. 2000, 28, 27–30. [Google Scholar] [CrossRef]


| Marker | OR (CI) | p-Value (Adjusted for Multiple Testing) |
|---|---|---|
| Glucose, µmol/L | 0.90 (0.77; 1.06) | 1 |
| Insulin, μIU/mL | 0.94 (0.91; 0.97) | 0.008956 |
| Apolipoprotein A, mg/dL | 0.97 (0.96; 0.98) | 1.91 × 10⁻¹⁴ |
| Apolipoprotein B, mg/dL | 0.996 (0.990; 1.003) | 1 |
| Total cholesterol, µmol/L | 0.86 (0.74; 0.997) | 0.73916 |
| LDL, µmol/L | 1.01 (0.85; 1.2) | 1 |
| HDL, µmol/L | 0.22 (0.12; 0.37) | 5.76 × 10⁻⁷ |
| IGF-1, ng/mL | 0.99 (0.985; 0.995) | 0.000763 |
| Cortisol, nmol/L | 1.0003 (0.9995; 1.001) | 1 |
| 25(OH) D, ng/mL | 0.89 (0.86; 0.93) | 7.74 × 10⁻⁷ |
| Brain Region | Functional Pathway | p-Value (Adjusted for Multiple Testing) | ||
|---|---|---|---|---|
| Database | Name | ID | ||
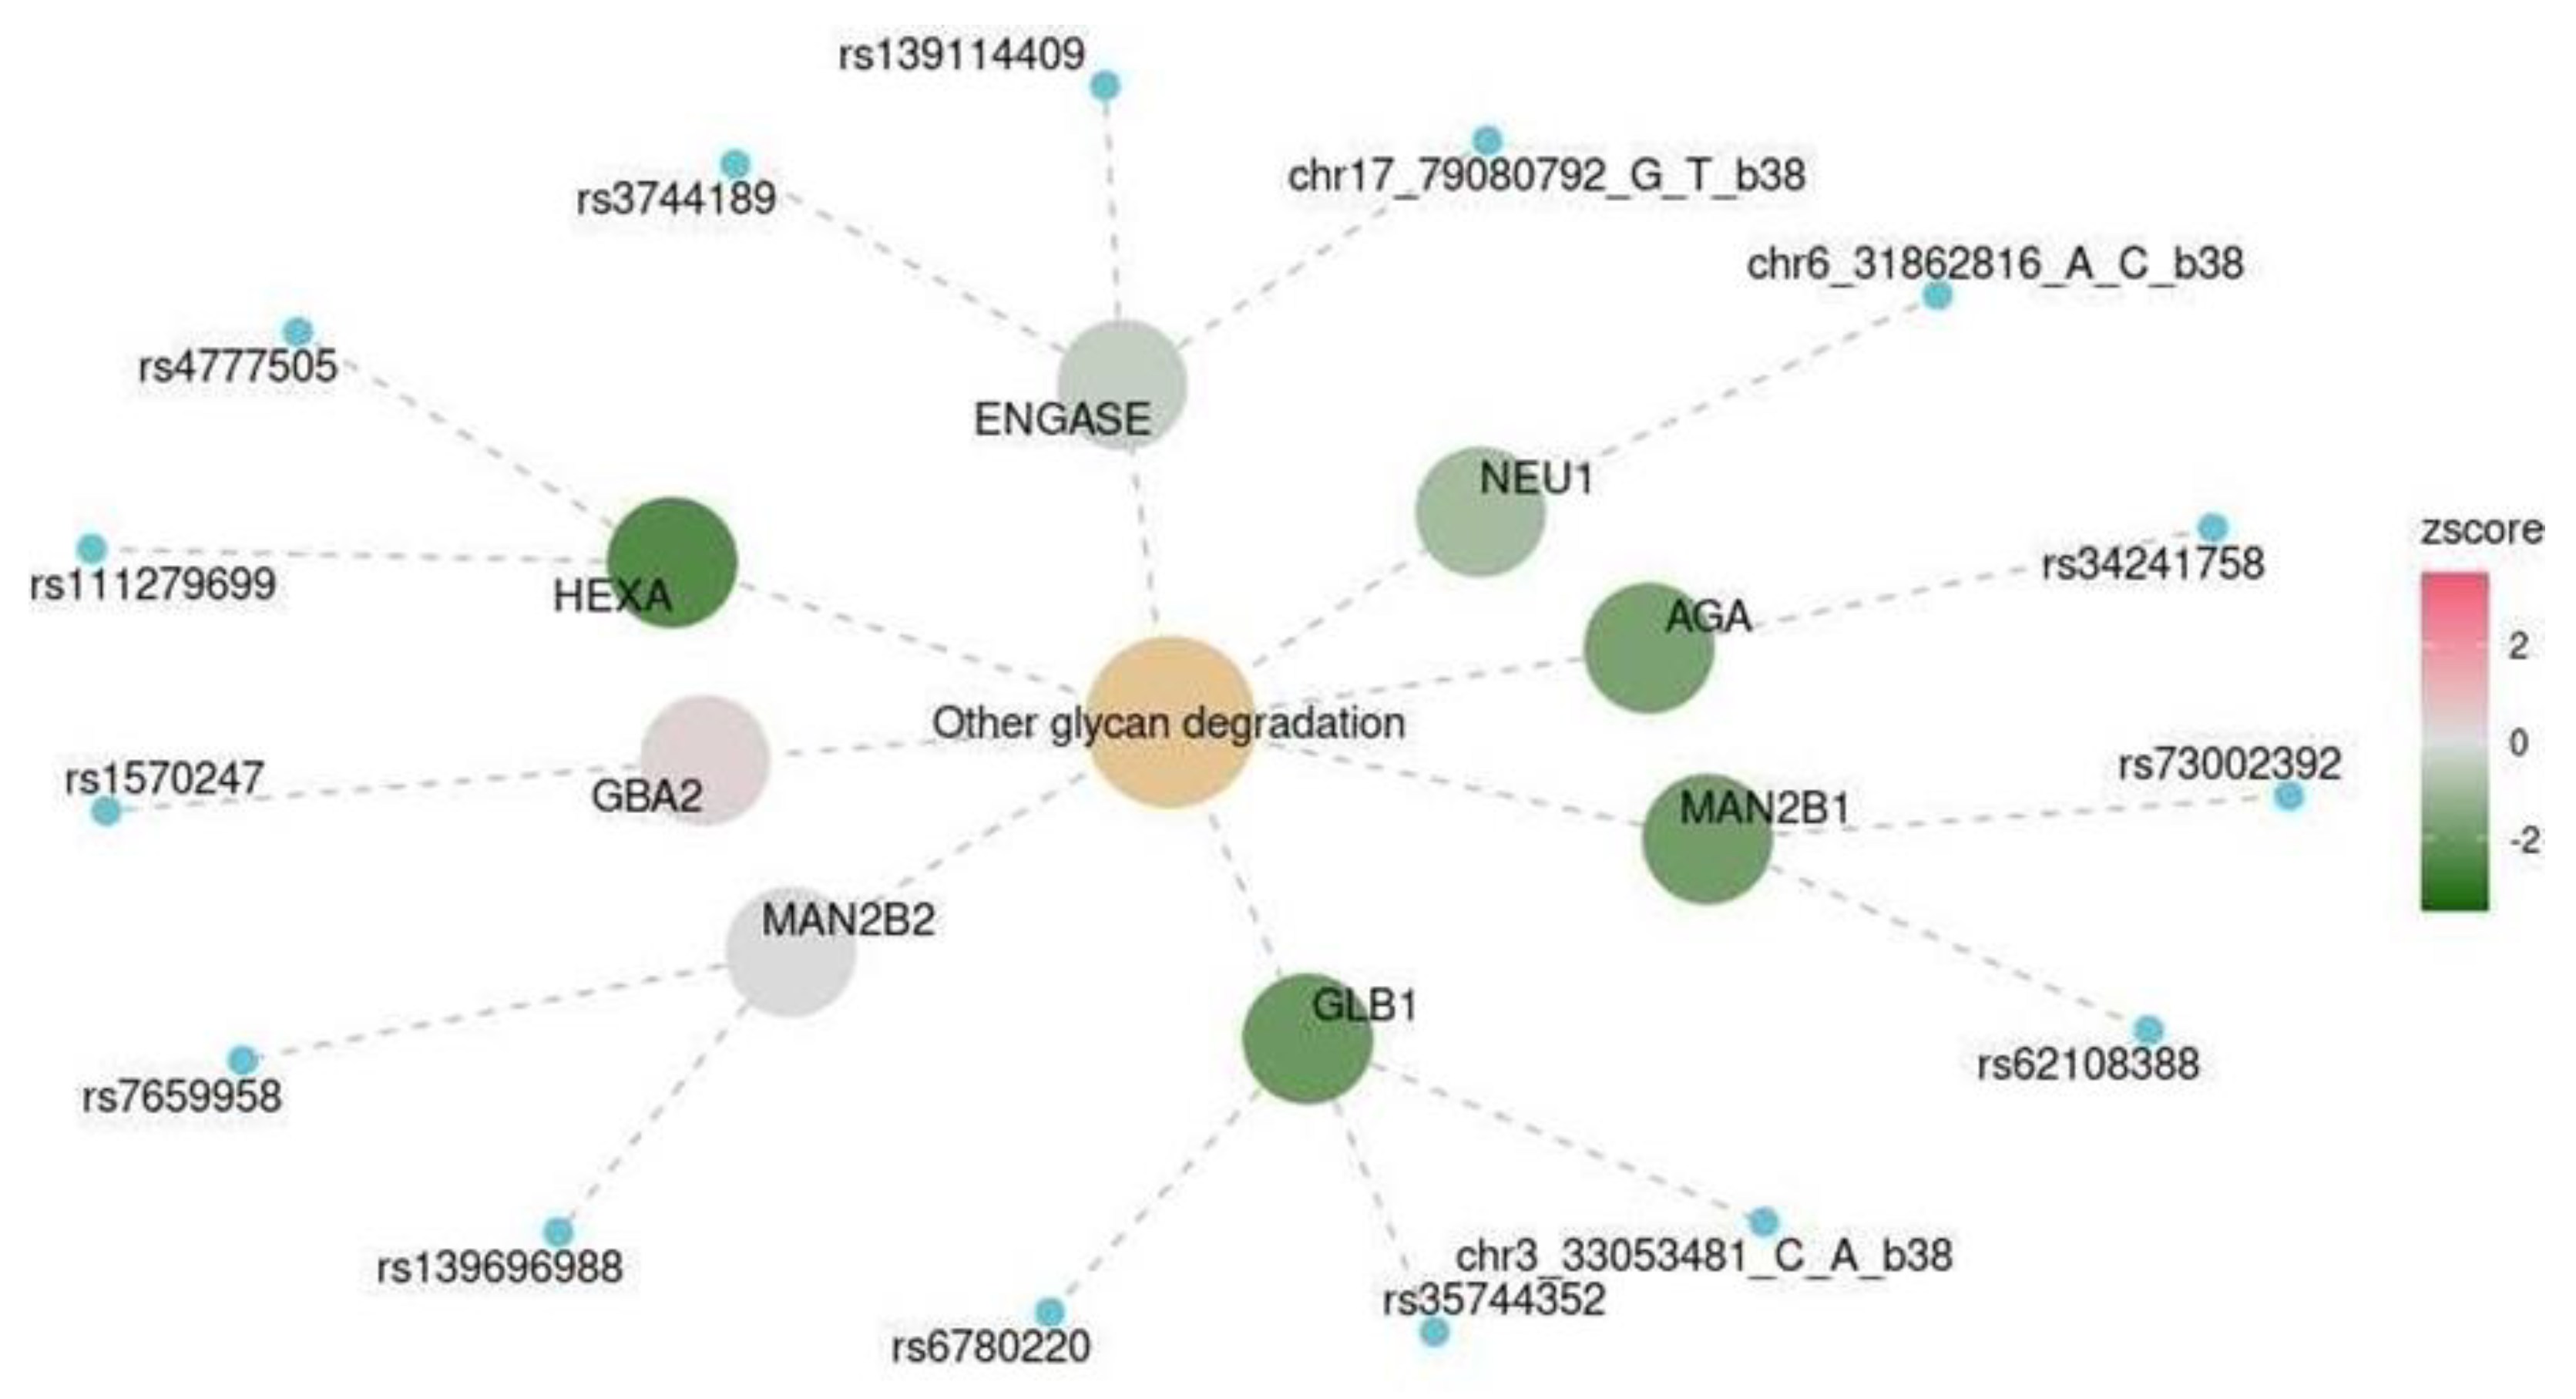
| Spinal cord at the level of C1 | KEGG | Other glycan degradation | hsa00511 | 0.041 |
| Nucleus accumbens | HALLMARK | HALLMARK_P EROXISOME | HALLMARK_P EROXISOME | 0.038 |
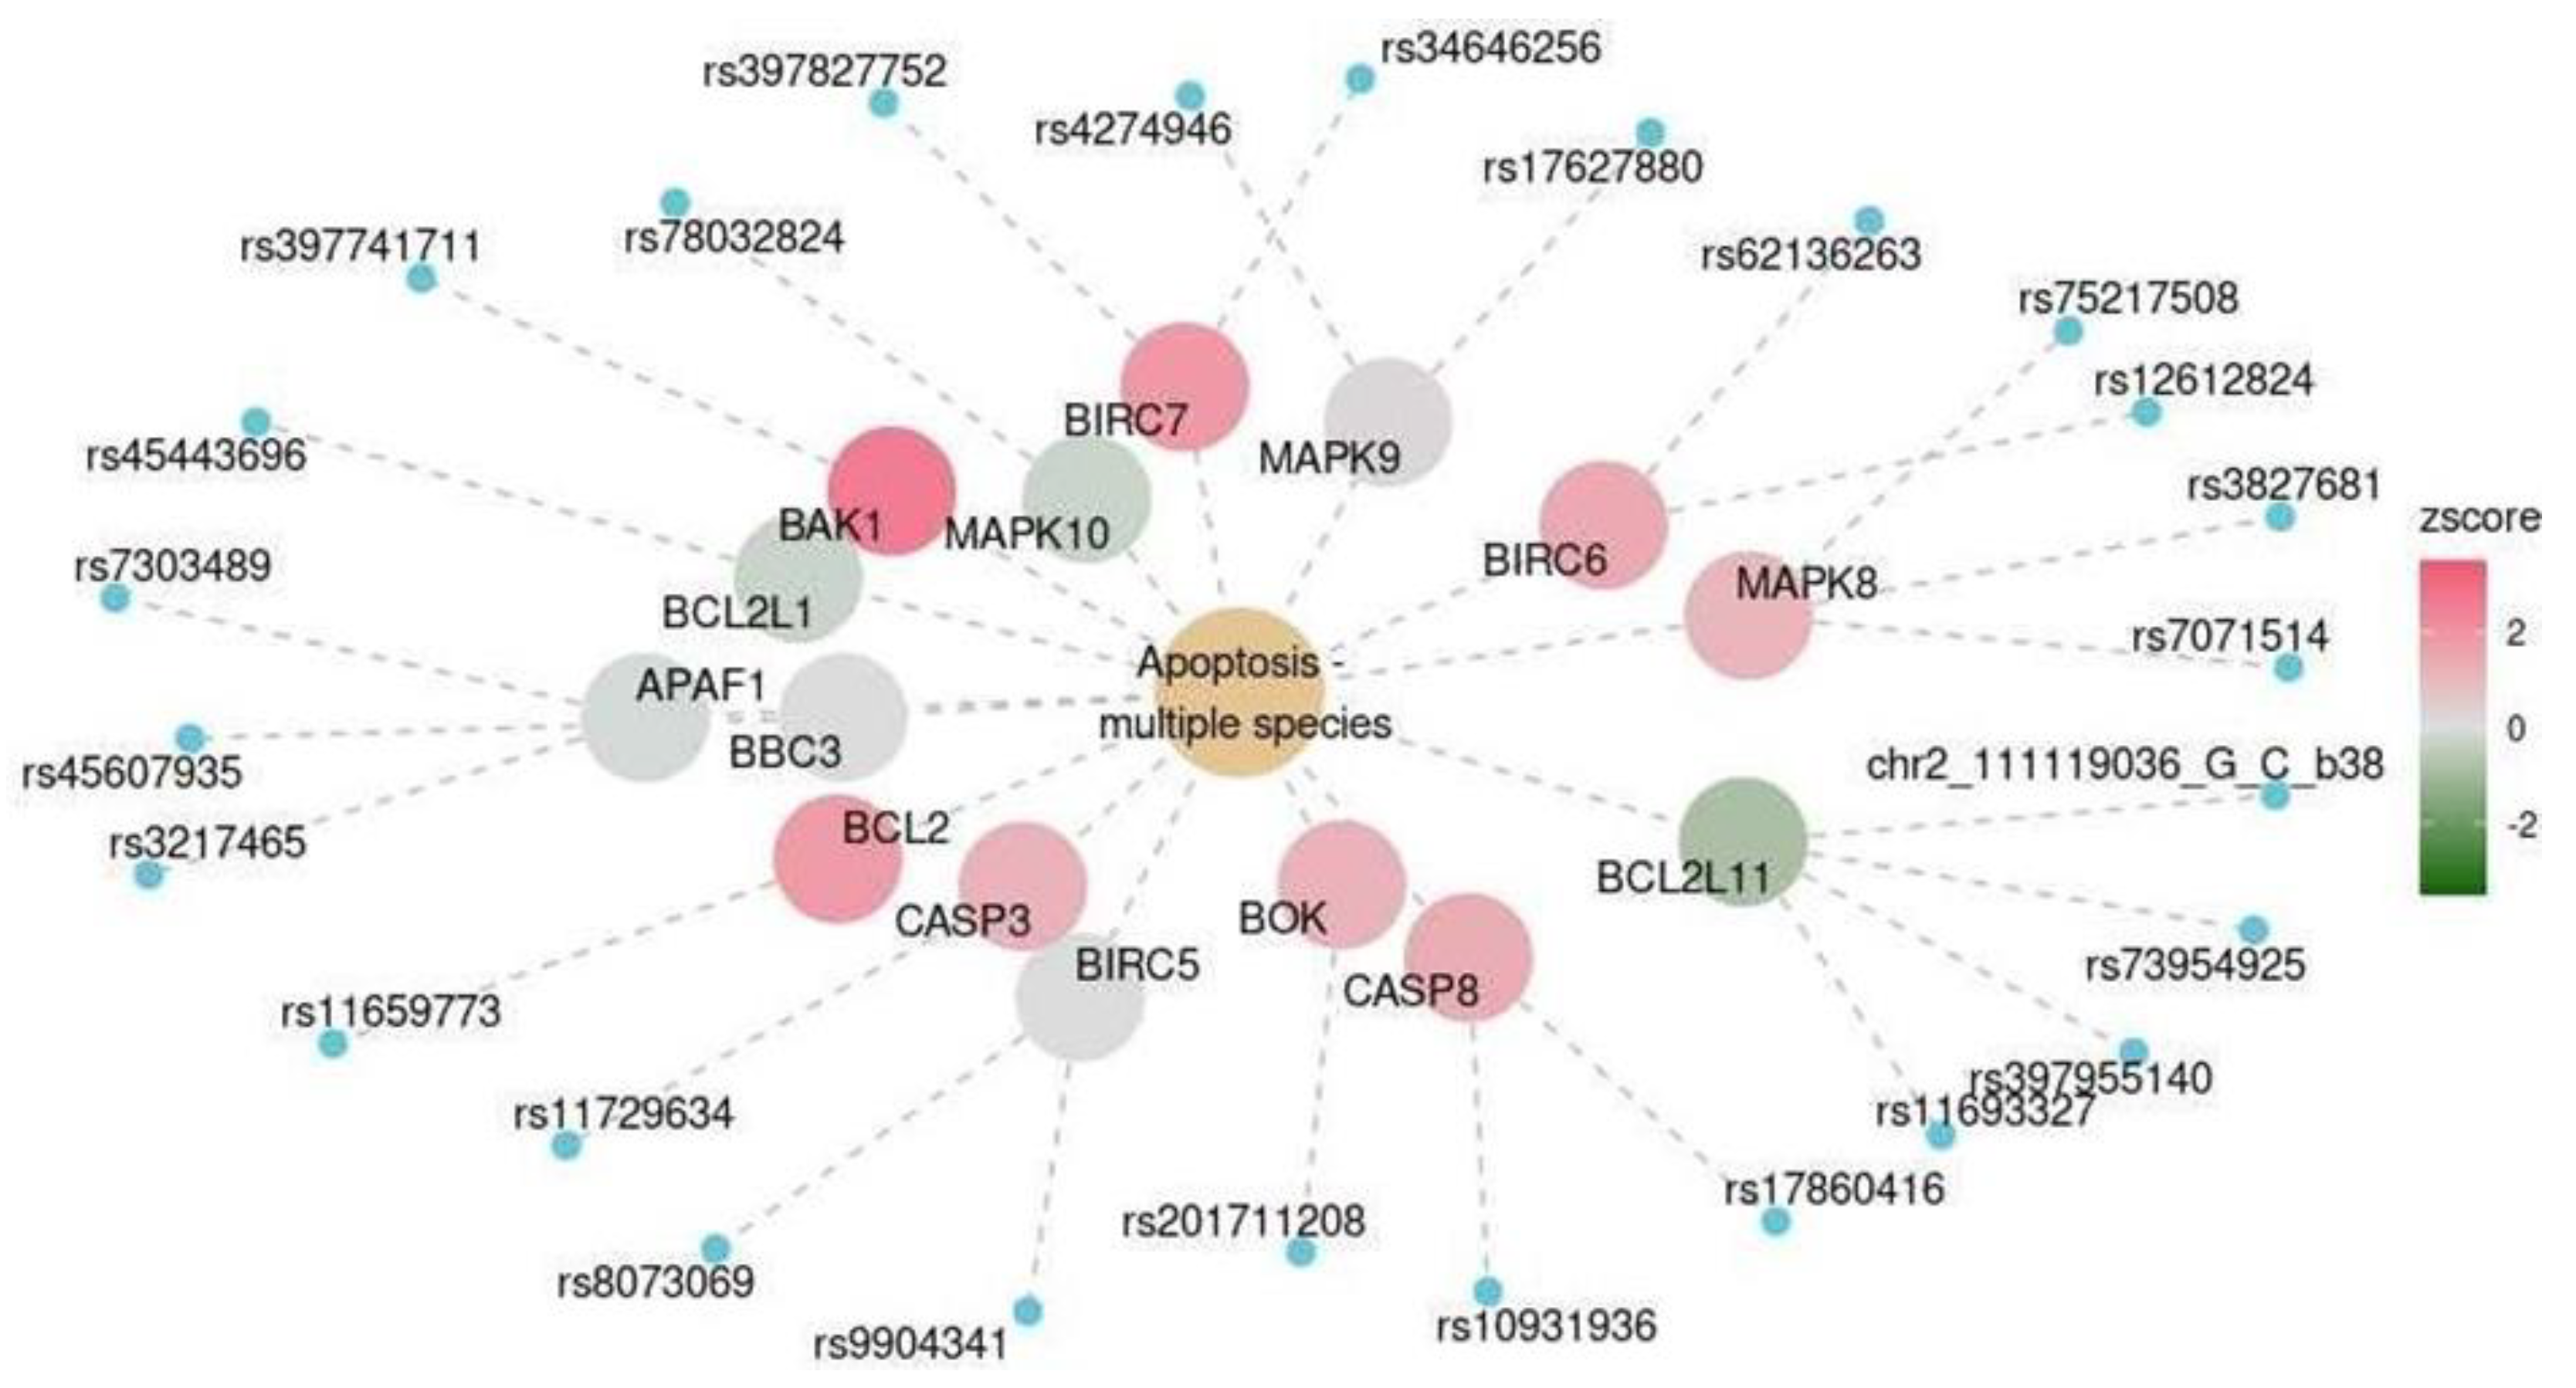
| Cerebellum | KEGG | Apoptosis–multiple species | hsa04215 | 0.016 |
| Cerebellum | KEGG | Lysine degradation | hsa00310 | 0.016 |
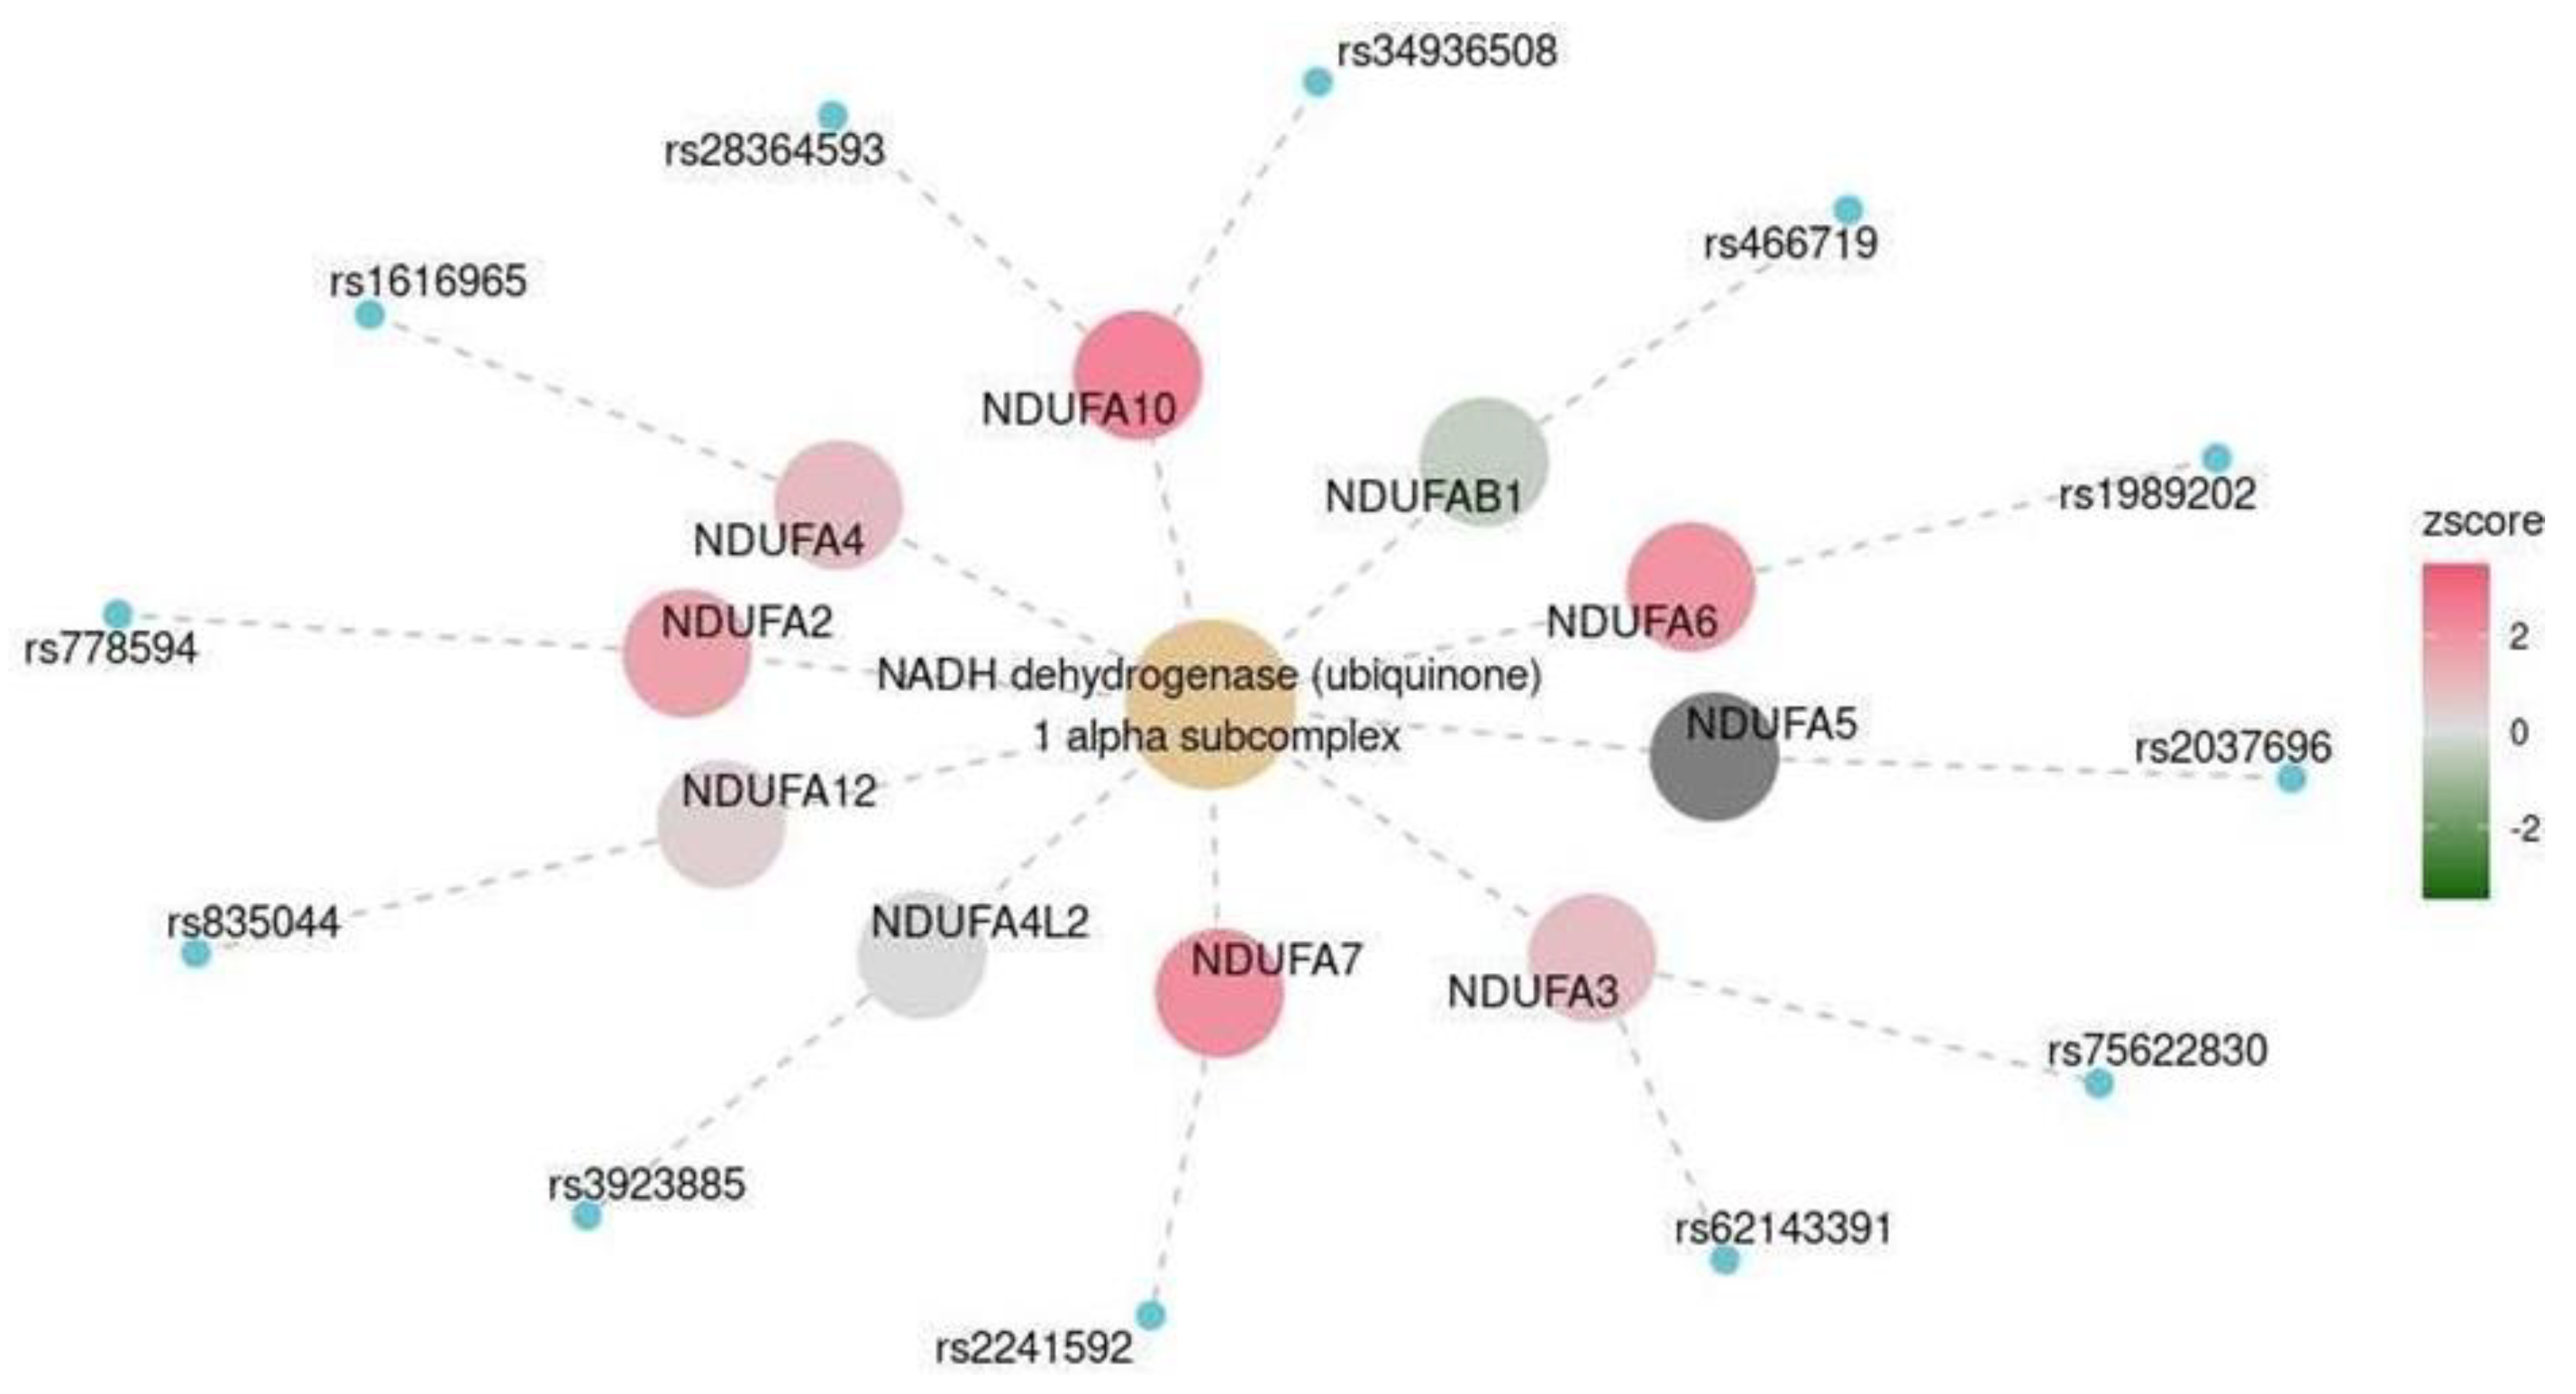
| Cerebral cortex | MKEGG | NADH dehydrogenase (ubiquinone) 1 alpha subcomplex | M00146 | 0.047 |
| Frontal cortex | MKEGG | NADH dehydrogenase (ubiquinone) 1 alpha subcomplex | M00146 | 0.003 |
Disclaimer/Publisher’s Note: The statements, opinions and data contained in all publications are solely those of the individual author(s) and contributor(s) and not of MDPI and/or the editor(s). MDPI and/or the editor(s) disclaim responsibility for any injury to people or property resulting from any ideas, methods, instructions or products referred to in the content. |
© 2024 by the authors. Licensee MDPI, Basel, Switzerland. This article is an open access article distributed under the terms and conditions of the Creative Commons Attribution (CC BY) license (https://creativecommons.org/licenses/by/4.0/).
Share and Cite
Mamchur, A.; Zelenova, E.; Dzhumaniiazova, I.; Erema, V.; Kashtanova, D.; Ivanov, M.; Bruttan, M.; Gusakova, M.; Terekhov, M.; Yudin, V.; et al. Cognitive Impairment in Nonagenarians: Potential Metabolic Mechanisms Revealed by the Synergy of In Silico Gene Expression Modeling and Pathway Enrichment Analysis. Int. J. Mol. Sci. 2024, 25, 3344. https://doi.org/10.3390/ijms25063344
Mamchur A, Zelenova E, Dzhumaniiazova I, Erema V, Kashtanova D, Ivanov M, Bruttan M, Gusakova M, Terekhov M, Yudin V, et al. Cognitive Impairment in Nonagenarians: Potential Metabolic Mechanisms Revealed by the Synergy of In Silico Gene Expression Modeling and Pathway Enrichment Analysis. International Journal of Molecular Sciences. 2024; 25(6):3344. https://doi.org/10.3390/ijms25063344
Chicago/Turabian StyleMamchur, Aleksandra, Elena Zelenova, Irina Dzhumaniiazova, Veronika Erema, Daria Kashtanova, Mikhail Ivanov, Maria Bruttan, Mariia Gusakova, Mikhail Terekhov, Vladimir Yudin, and et al. 2024. "Cognitive Impairment in Nonagenarians: Potential Metabolic Mechanisms Revealed by the Synergy of In Silico Gene Expression Modeling and Pathway Enrichment Analysis" International Journal of Molecular Sciences 25, no. 6: 3344. https://doi.org/10.3390/ijms25063344
APA StyleMamchur, A., Zelenova, E., Dzhumaniiazova, I., Erema, V., Kashtanova, D., Ivanov, M., Bruttan, M., Gusakova, M., Terekhov, M., Yudin, V., Rumyantseva, A., Matkava, L., Strazhesko, I., Isaev, R., Kruglikova, A., Maytesyan, L., Tarasova, I., Beloshevskaya, O., Mkhitaryan, E., ... Yudin, S. (2024). Cognitive Impairment in Nonagenarians: Potential Metabolic Mechanisms Revealed by the Synergy of In Silico Gene Expression Modeling and Pathway Enrichment Analysis. International Journal of Molecular Sciences, 25(6), 3344. https://doi.org/10.3390/ijms25063344