

Human Polβ Natural Polymorphic Variants G118V and R149I Affects Substate Binding and Catalysis


 , and
, and
Abstract
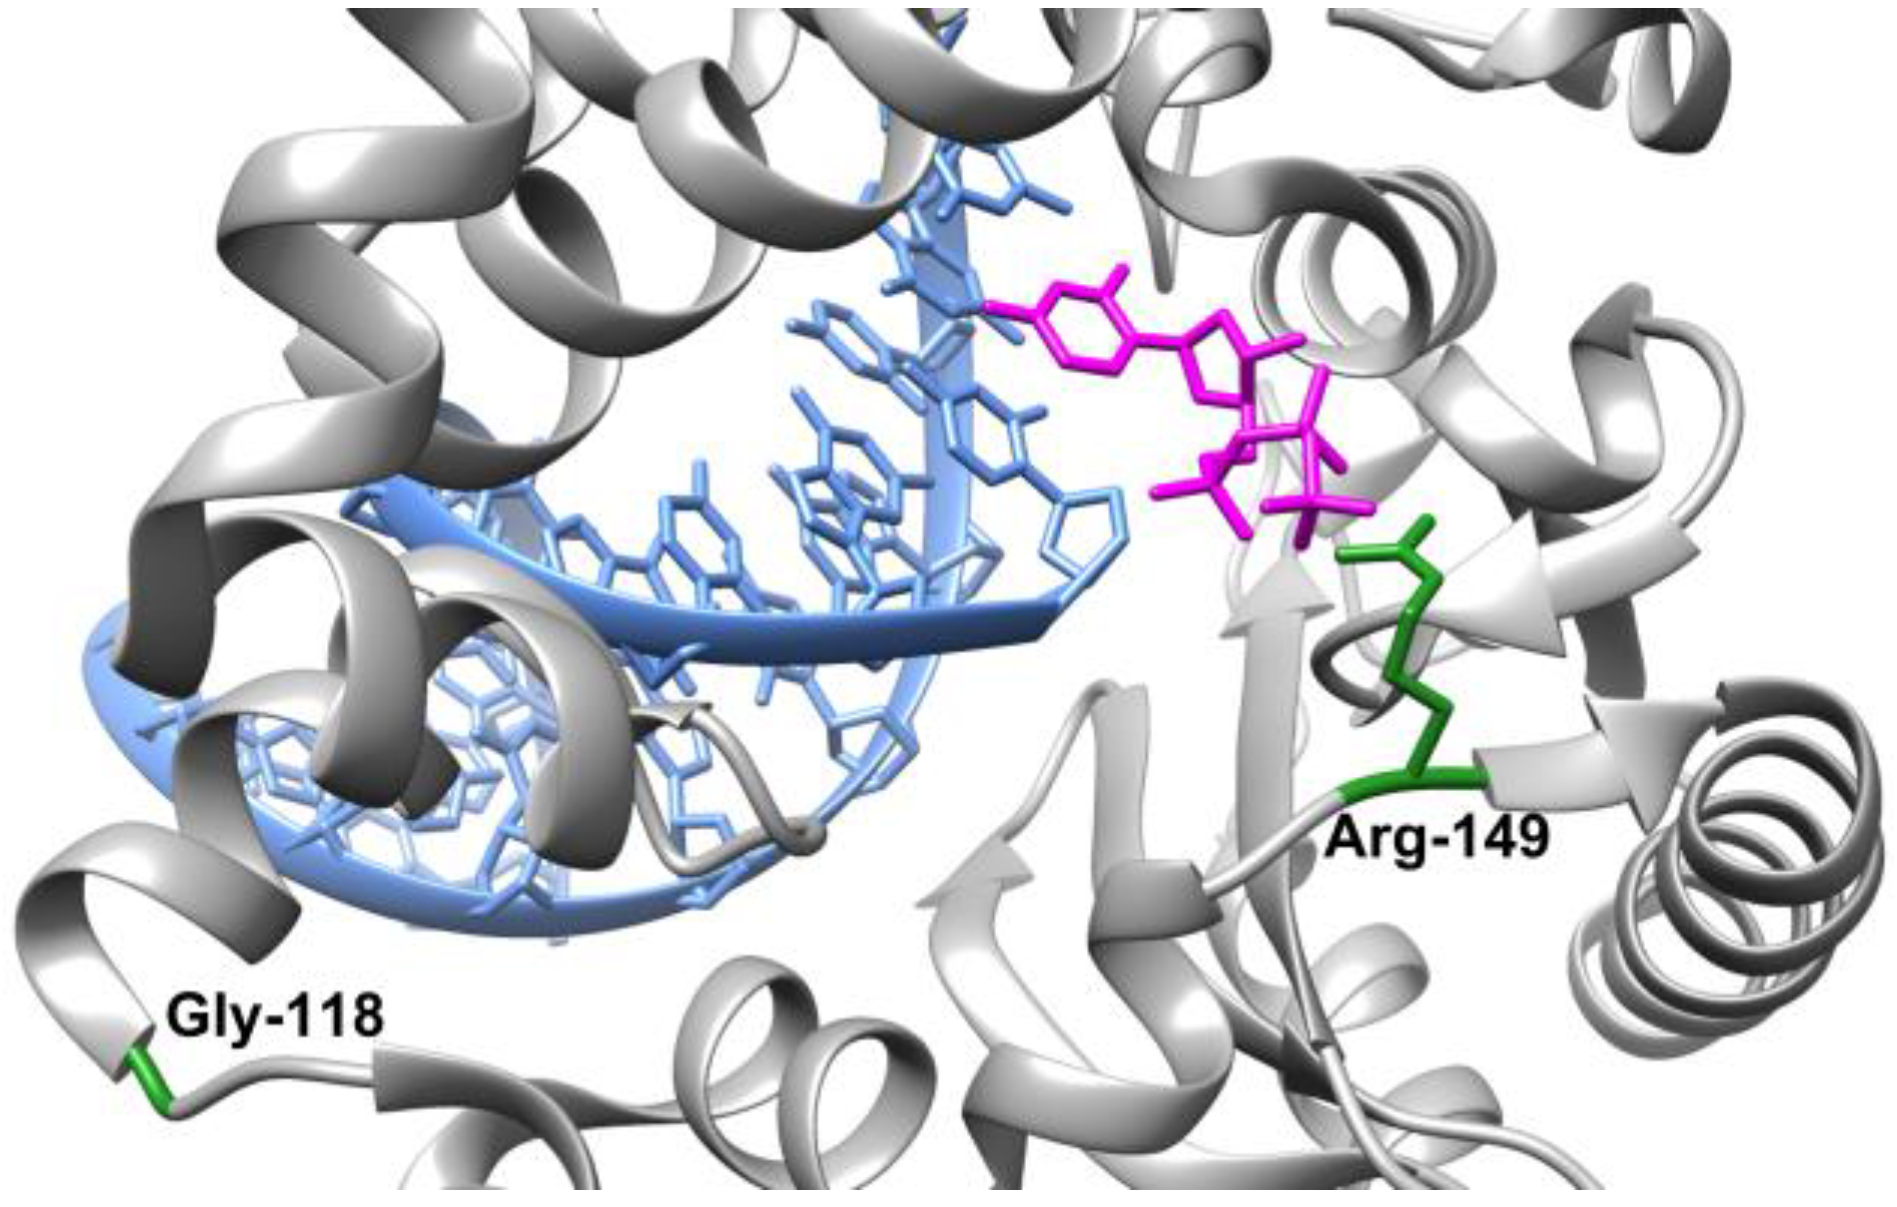
1. Introduction
2. Results and Discussion
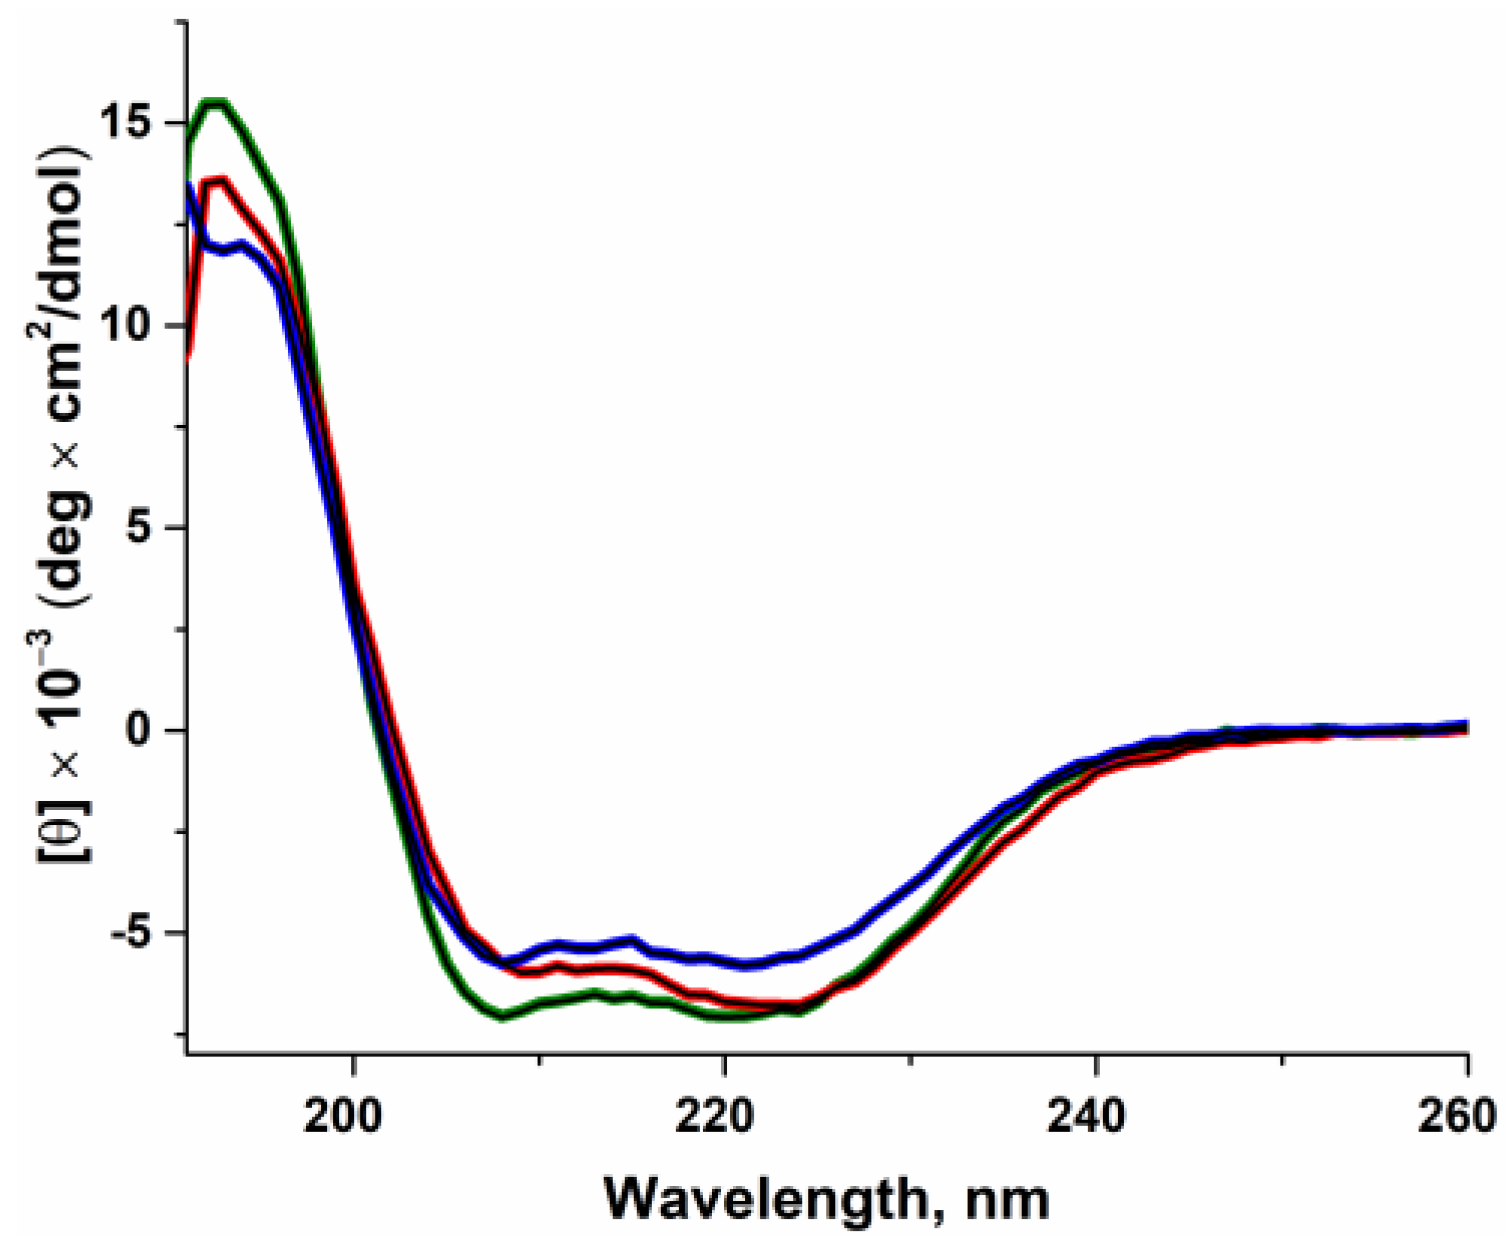
2.1. The Influence of the Amino Acid Substitutions on Enzyme Folding
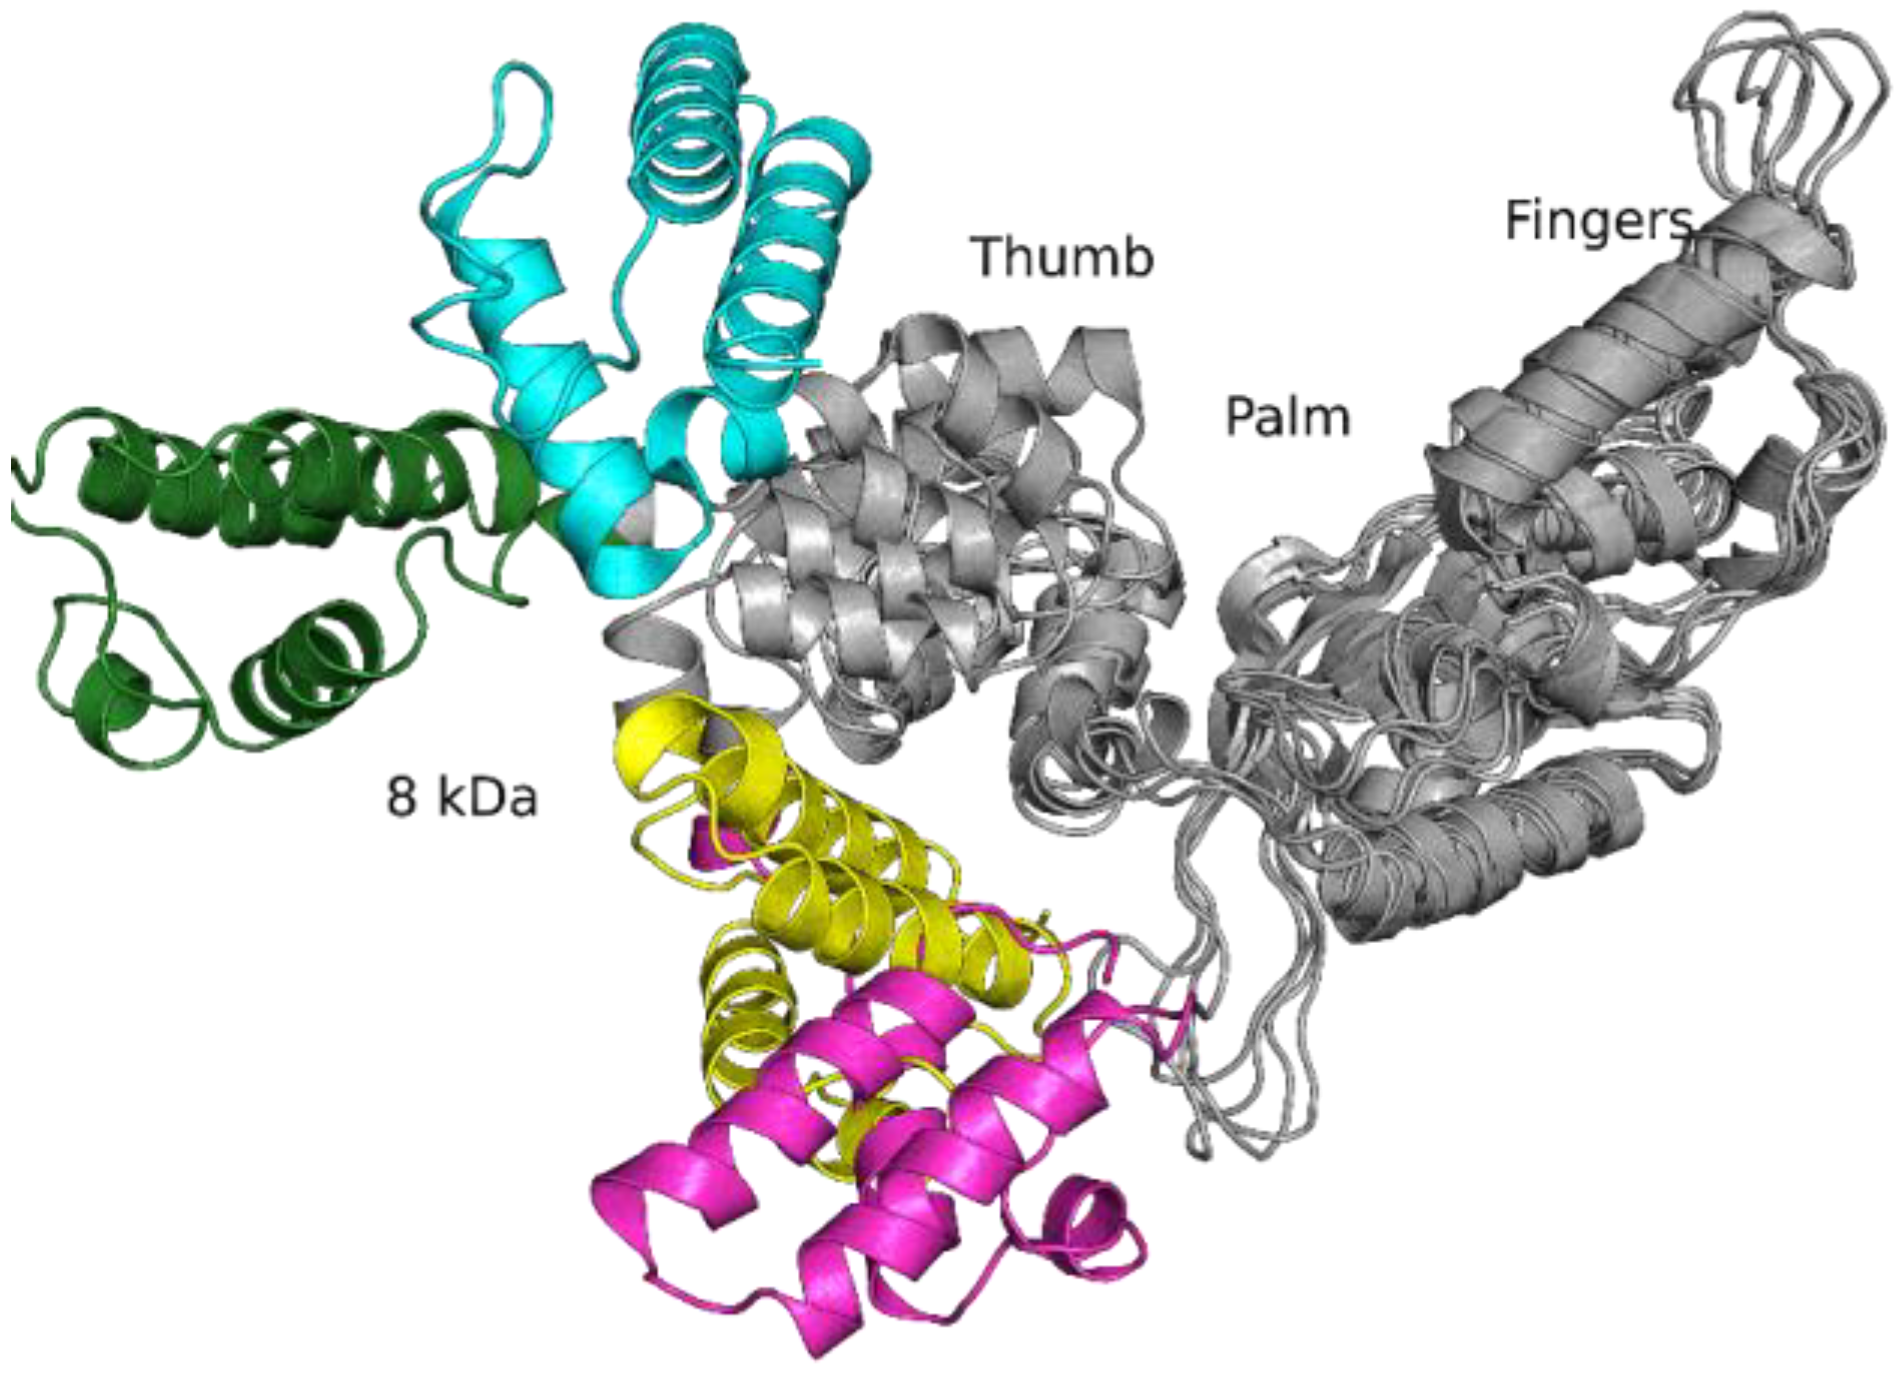
2.2. Molecular Dynamics Simulations of Free-State Enzymes
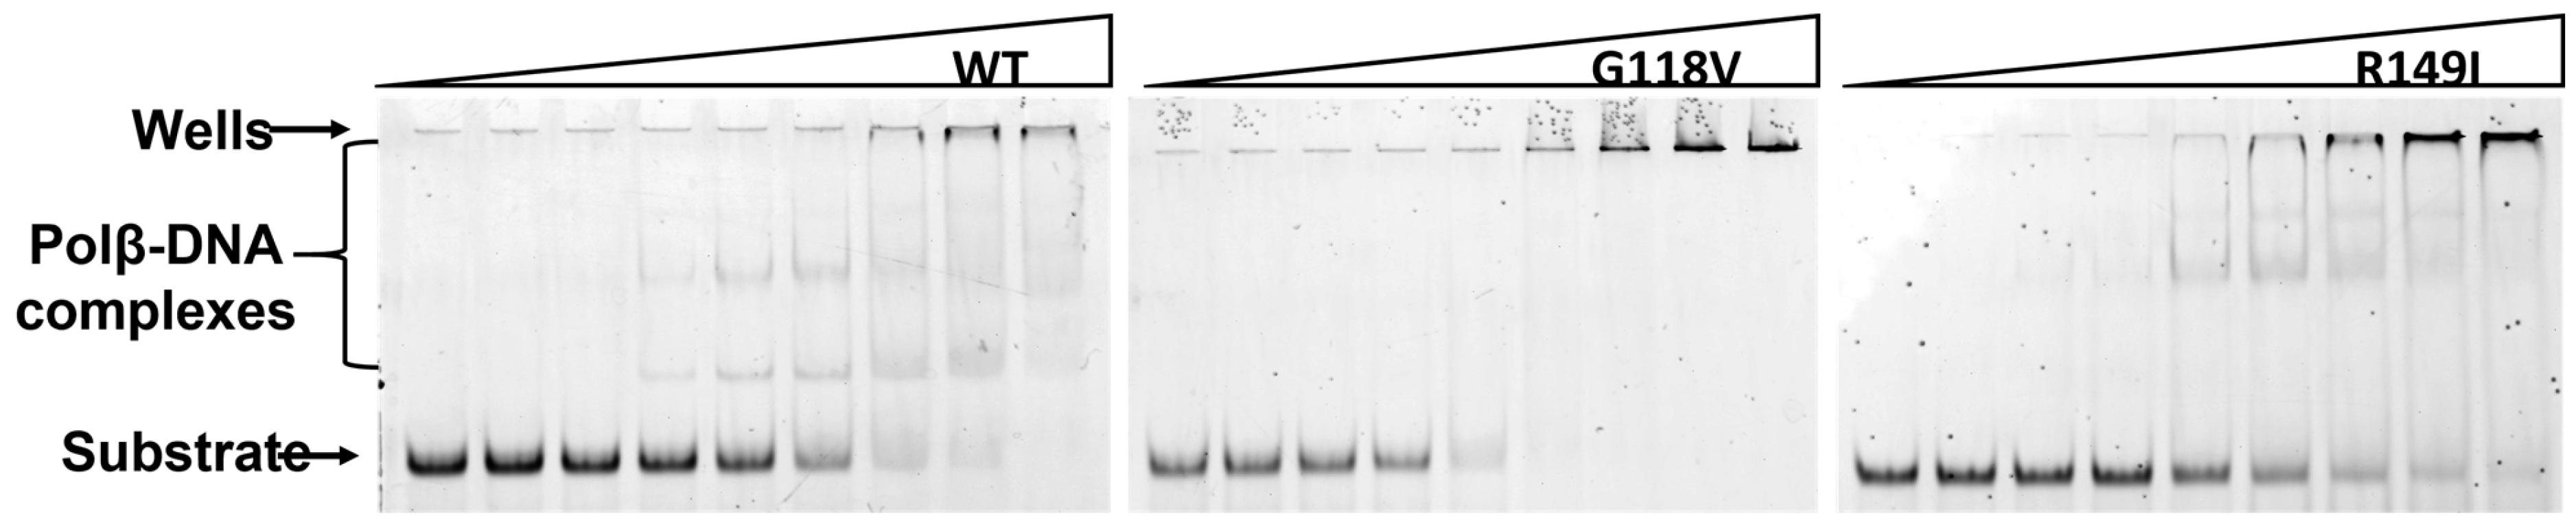
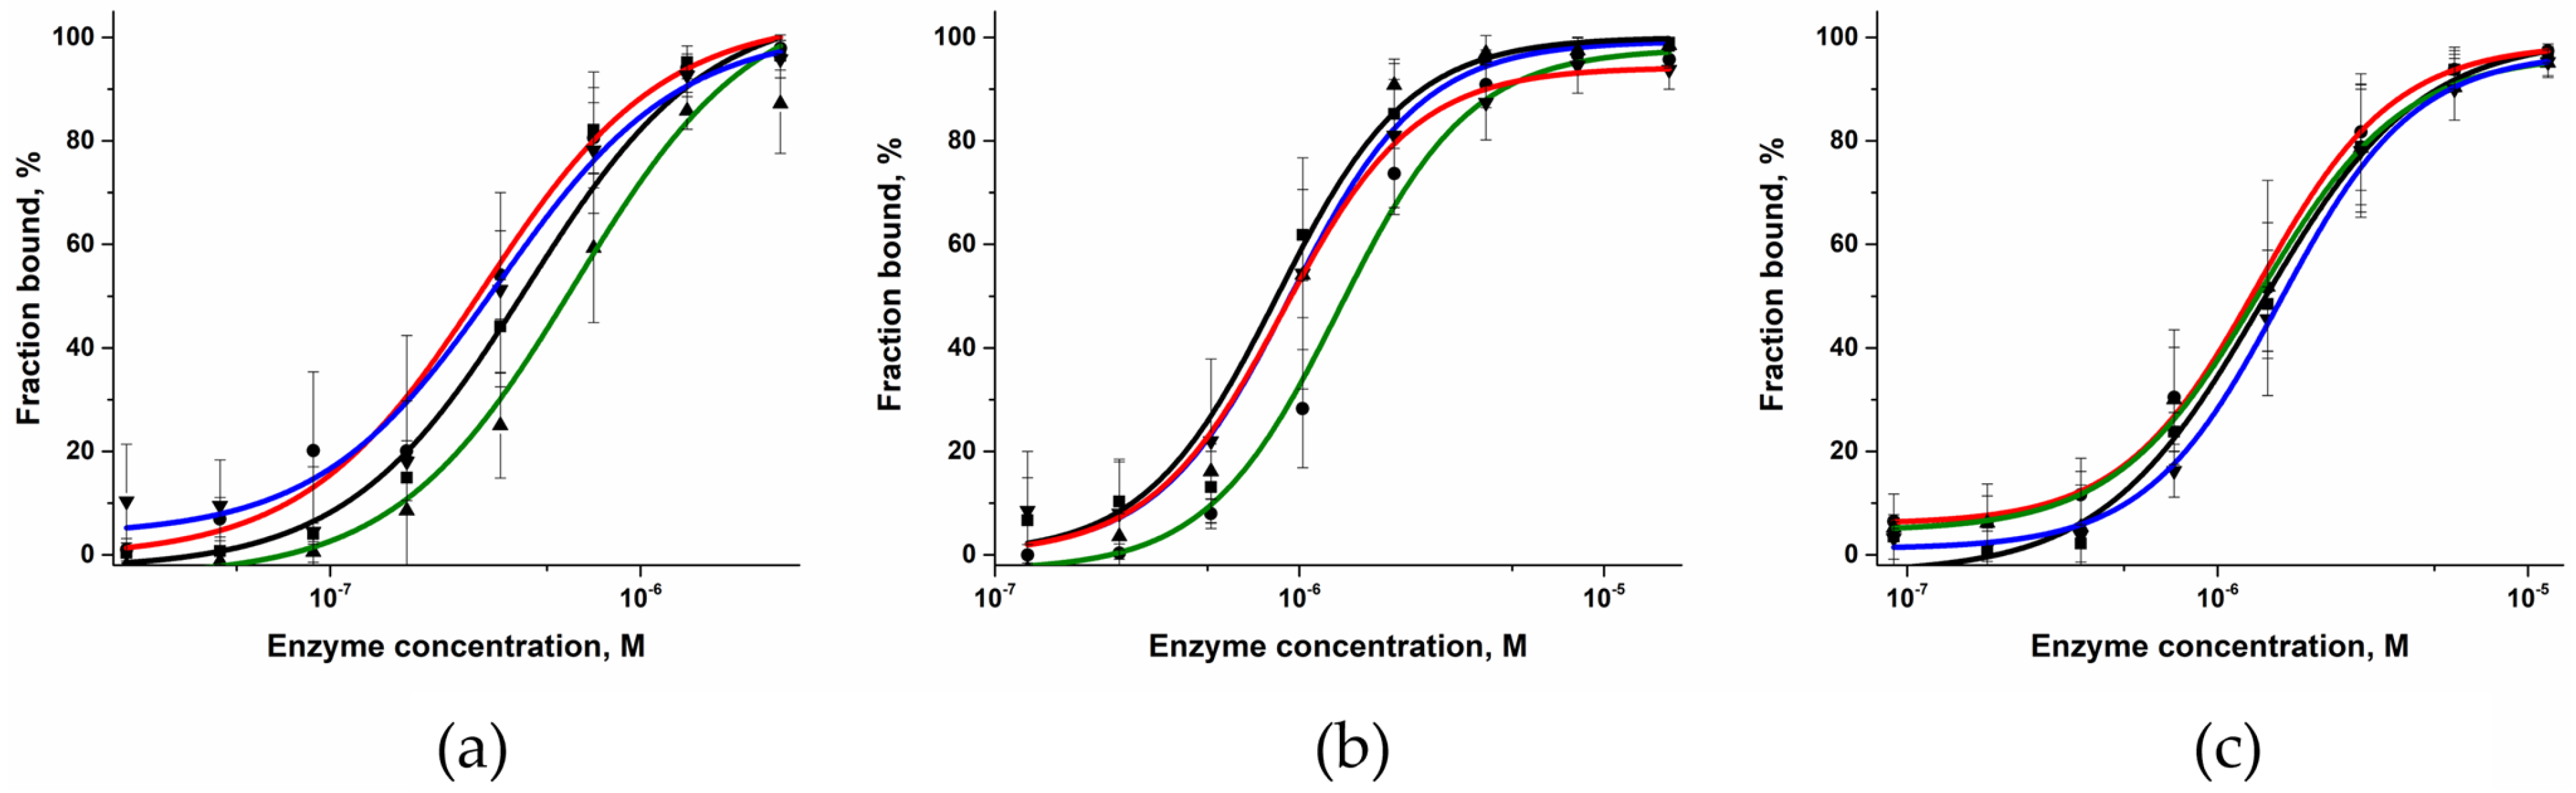
2.3. DNA-Binding Affinity of the Polβ Variants
2.4. MD Simulations of the Binary Open-State Enzyme–DNA Complex
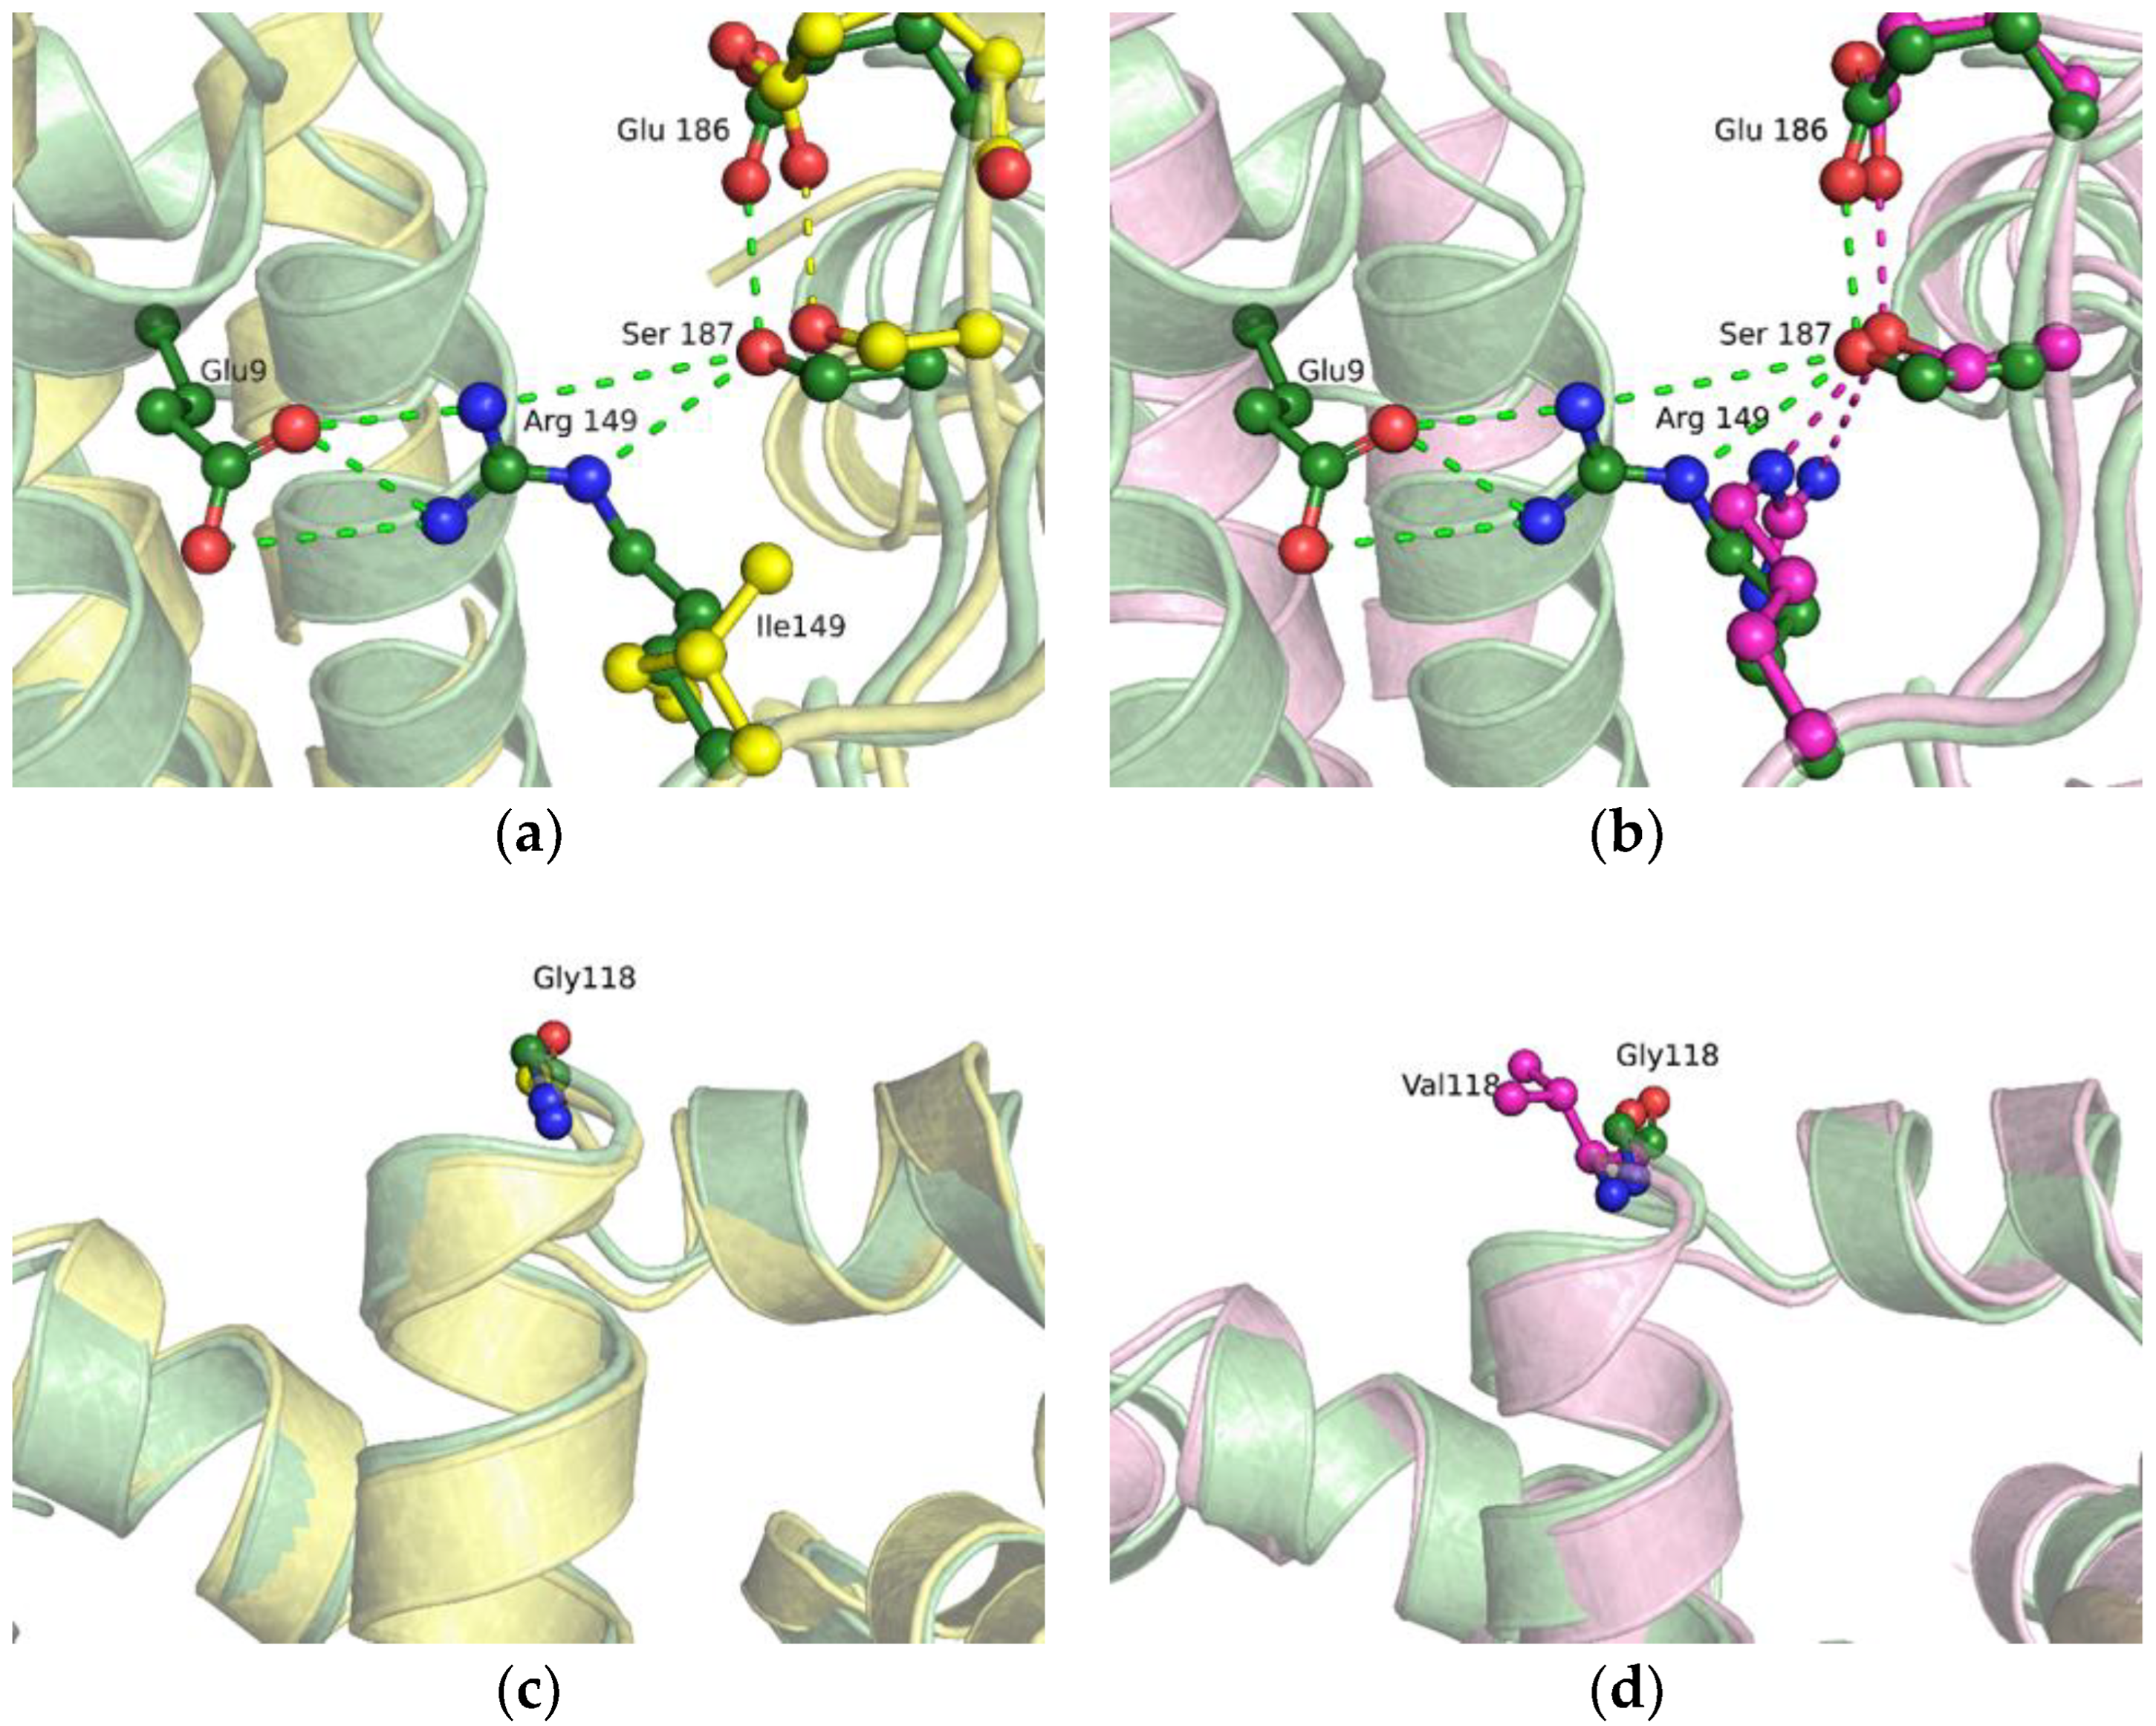
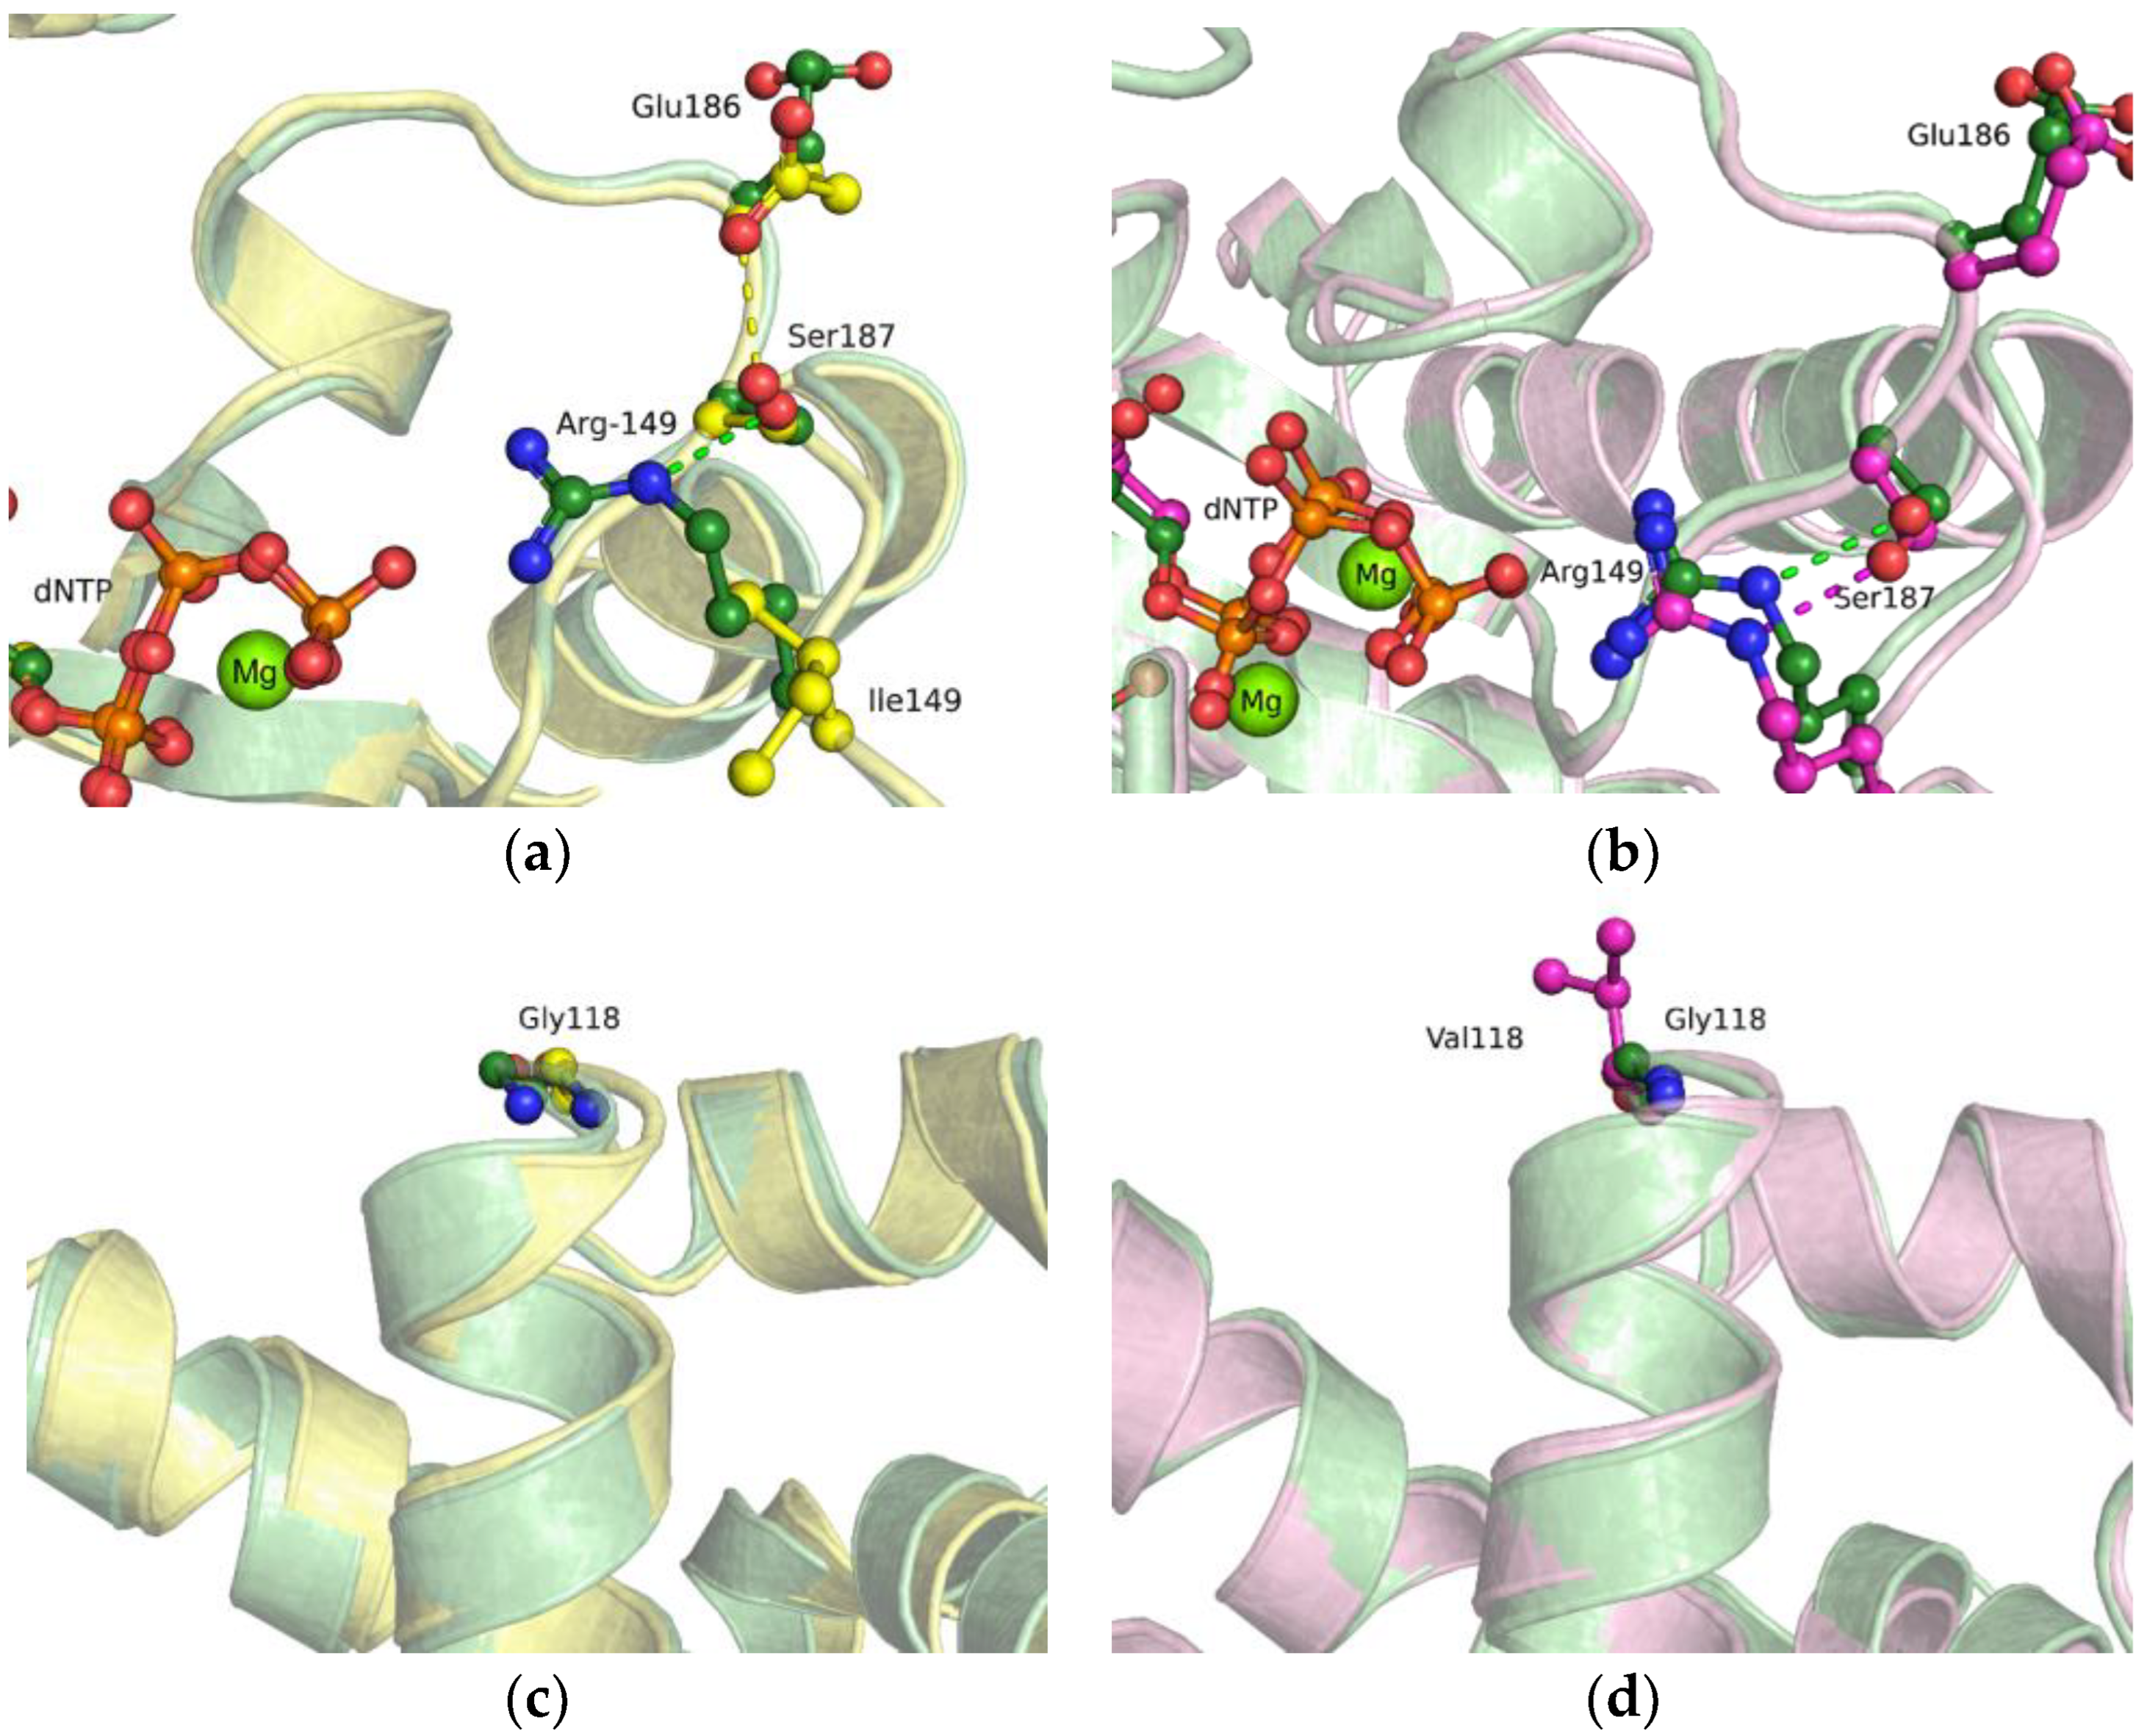
2.5. MD Simulations of the Ternary Closed-State Enzyme–DNA–dNTP Complex
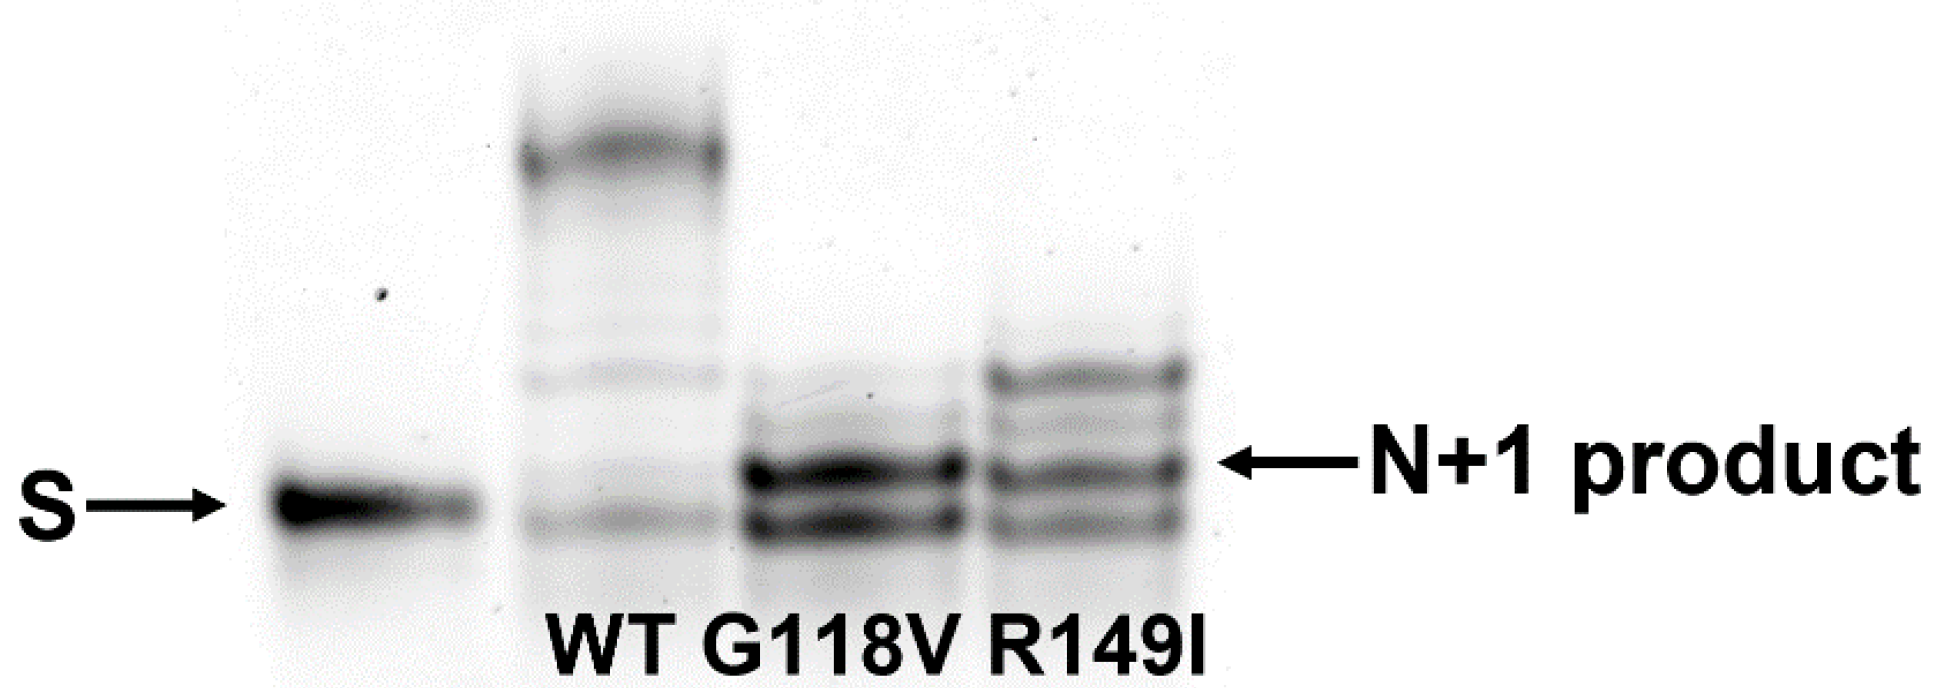
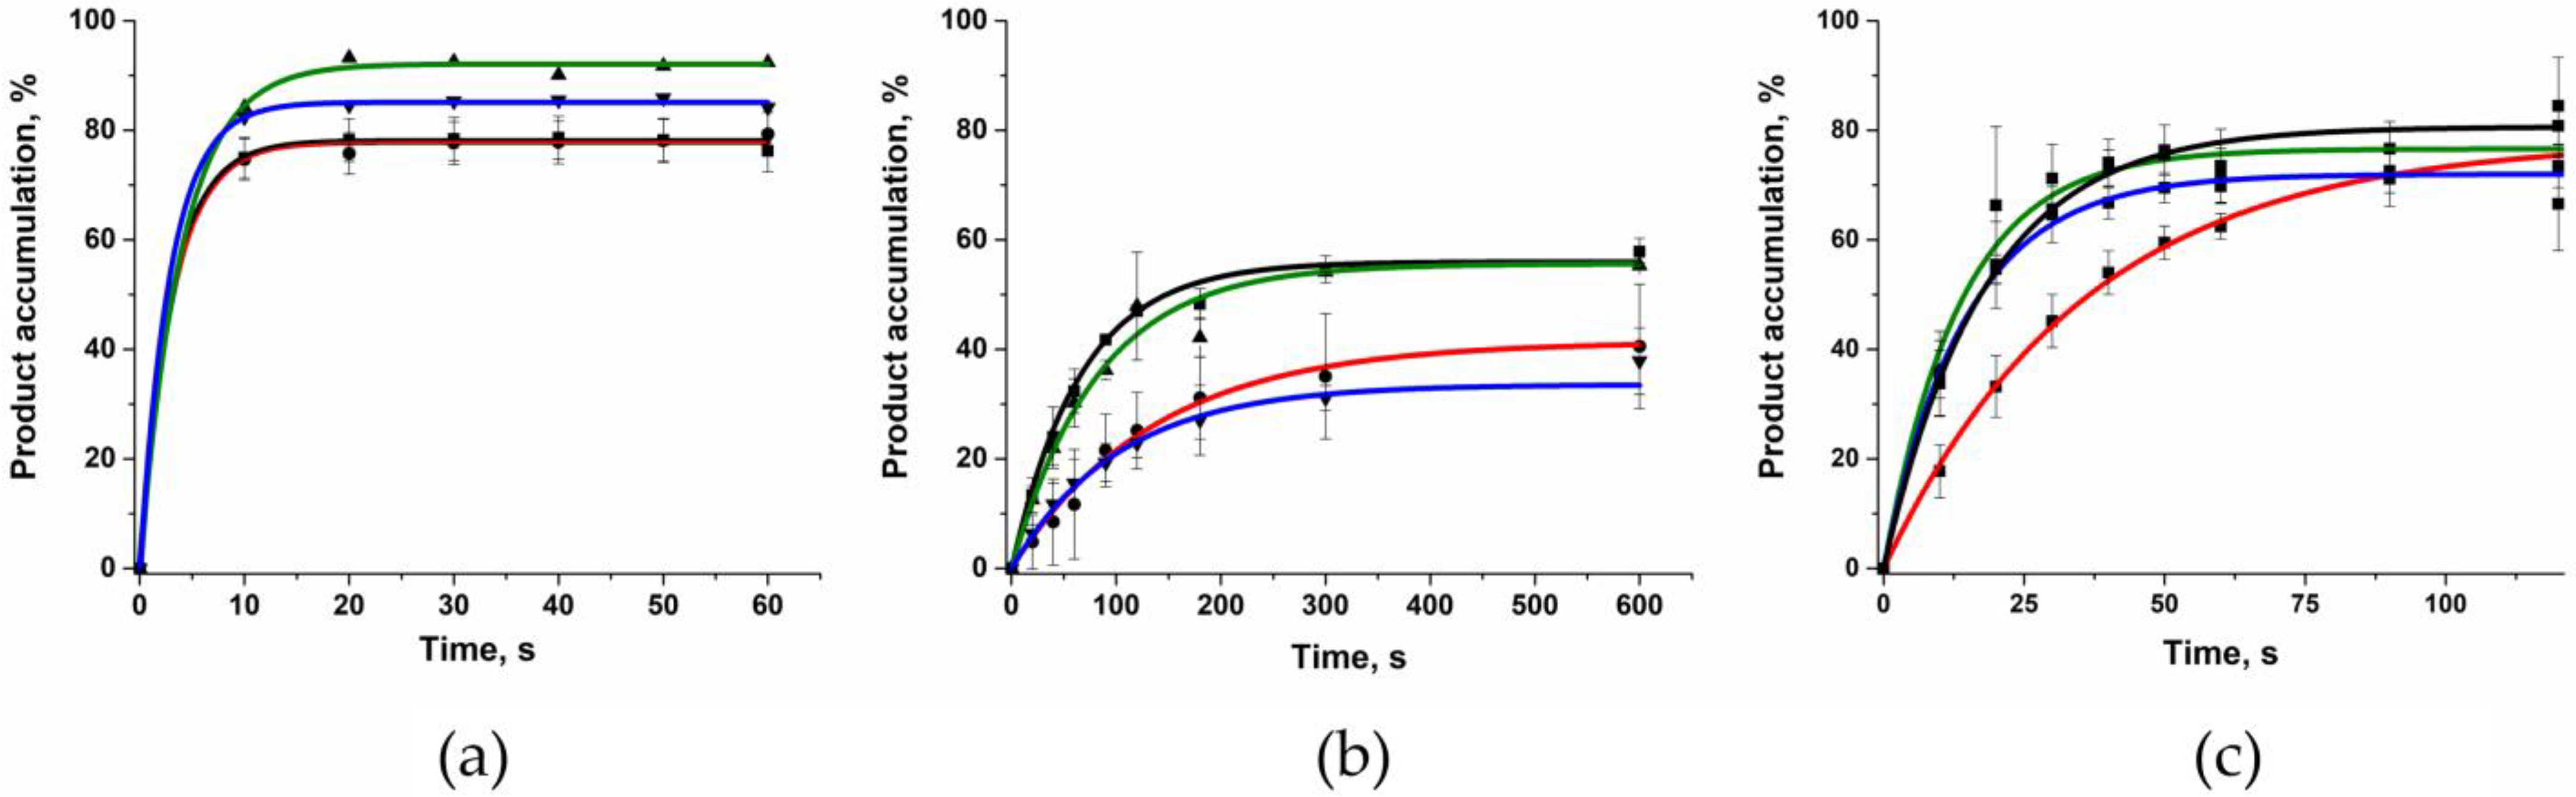
2.6. Polymerase Activity of the Two Polβ Variants
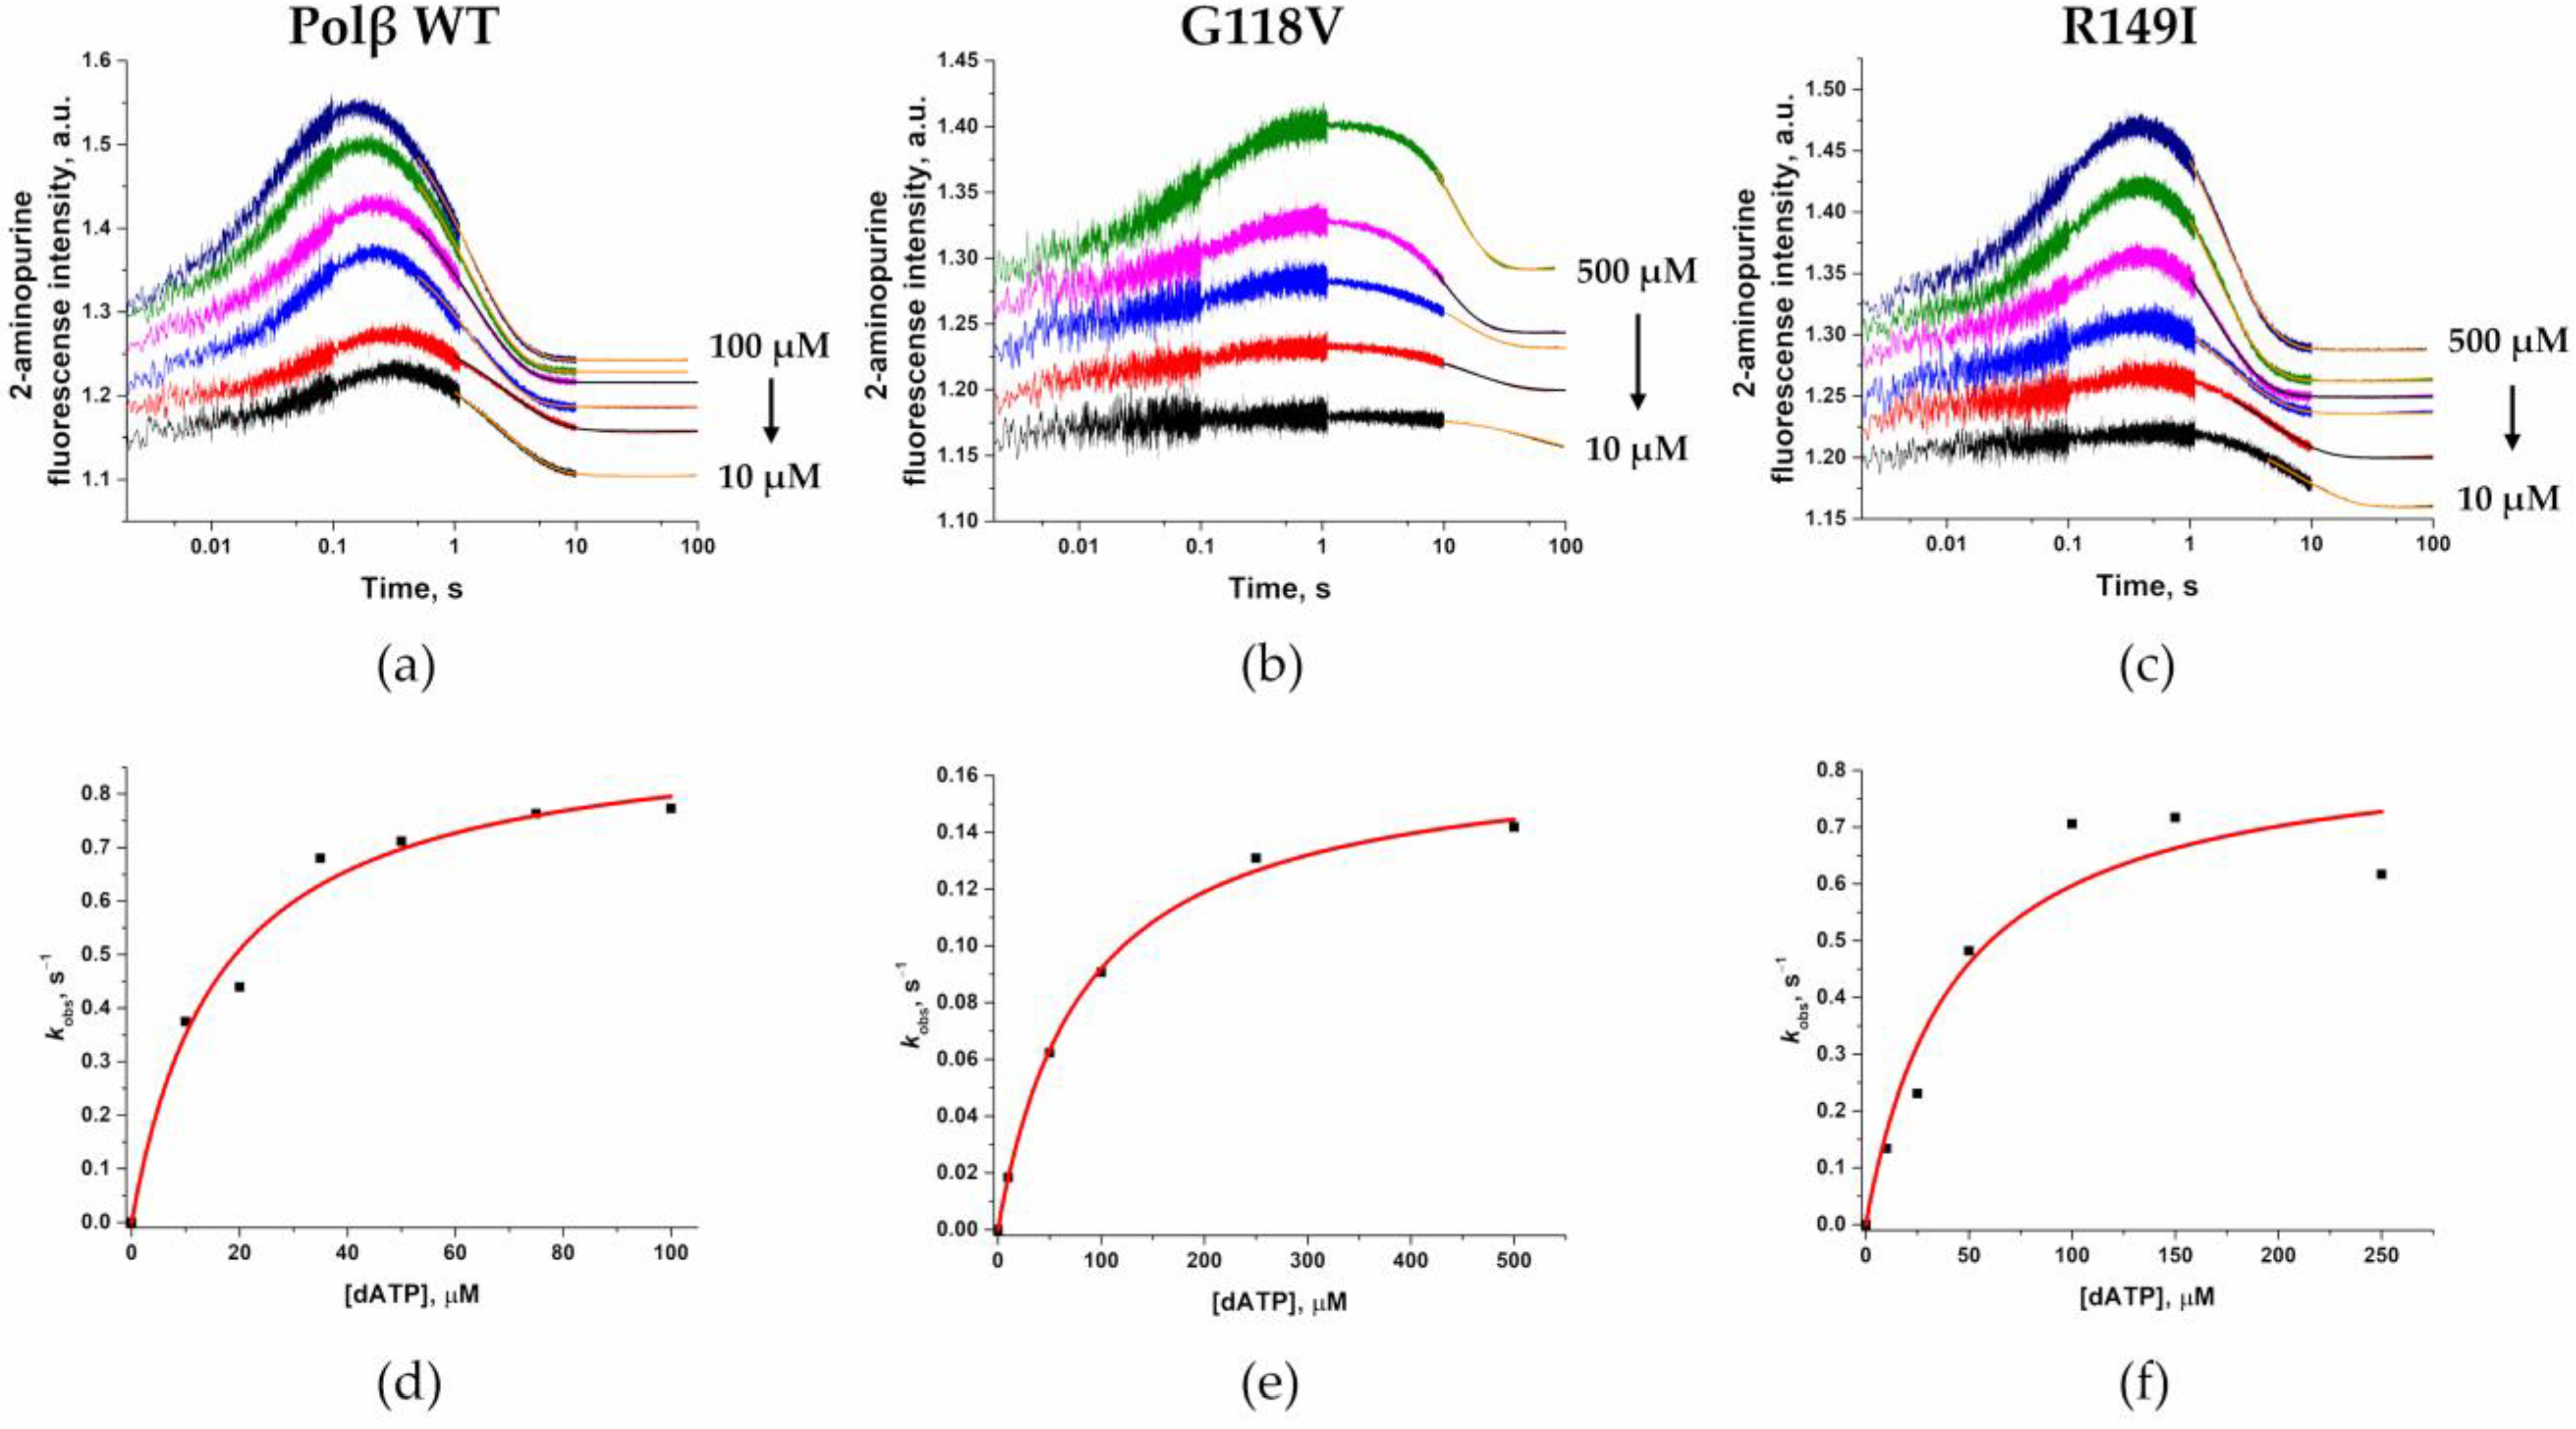
2.7. Conformational Changes of DNA and Measurement of dNTP-Binding Affinity
3. Materials and Methods
3.1. Site-Directed Mutagenesis and Protein Purification
3.2. Oligodeoxyribonucleotides
3.3. Circular Dichroism (CD) Spectroscopy
3.4. Molecular Dynamics (MD) Simulations
3.5. Electrophoretic Mobility Shift Assay (EMSA)
3.6. Polymerase Reaction Analysis
3.7. Stopped-Flow Fluorescence Measurements
4. Conclusions
Author Contributions
Funding
Institutional Review Board Statement
Informed Consent Statement
Data Availability Statement
Acknowledgments
Conflicts of Interest
References
- Burcham, P.C. Internal Hazards: Baseline DNA Damage by Endogenous Products of Normal Metabolism. Mutat. Res. Genet. Toxicol. Environ. Mutagen. 1999, 443, 11–36. [Google Scholar] [CrossRef]
- Lindahl, T. Instability and Decay of the Primary Structure of DNA. Nature 1993, 362, 709–715. [Google Scholar] [CrossRef]
- Wallace, S.S. Biological Consequences of Free Radical-Damaged DNA Bases. Free. Radic. Biol. Med. 2002, 33, 1–14. [Google Scholar] [CrossRef]
- Demple, B.; Harrison, L. Repair of Oxidative Damage to DNA: Enzymology and Biology. Annu. Rev. Biochem. 1994, 63, 915–948. [Google Scholar] [CrossRef]
- Zuo, S.; Boorstein, R.J.; Teebor, G.W. Oxidative Damage to 5-Methylcytosine in DNA. Nucleic Acids Res. 1995, 23, 3239–3243. [Google Scholar] [CrossRef]
- Hayes, R.C.; Petrullo, L.A.; Huang, H.; Wallace, S.S.; LeClerc, J.E. Oxidative Damage in DNA: Lack of Mutagenicity by Thymine Glycol Lesions. J. Mol. Biol. 1988, 201, 239–246. [Google Scholar] [CrossRef]
- Retèl, J.; Hoebee, B.; Braun, J.E.; Lutgerink, J.T.; van den Akker, E.; Wanamarta, A.H.; Joenje, H.; Lafleur, M. V Mutational Specificity of Oxidative DNA Damage. Mutat. Res. 1993, 299, 165–182. [Google Scholar] [CrossRef]
- Cooke, M.S.; Evans, M.D.; Dizdaroglu, M.; Lunec, J. Oxidative DNA Damage: Mechanisms, Mutation, and Disease. FASEB J. 2003, 17, 1195–1214. [Google Scholar] [CrossRef]
- Marnett, L.J. Oxy Radicals, Lipid Peroxidation and DNA Damage. Toxicology 2002, 181–182, 219–222. [Google Scholar] [CrossRef]
- David, S.S.; Shea, V.L.O.; Kundu, S. Base Excision Repair of Oxidative DNA Damage. Nature 2010, 447, 941–950. [Google Scholar] [CrossRef]
- Lord, C.J.; Ashworth, A. The DNA Damage Response and Cancer Therapy. Nature 2012, 481, 287–294. [Google Scholar] [CrossRef]
- Dizdaroglu, M. Oxidatively Induced DNA Damage and Its Repair in Cancer. Mutat. Res. Rev. Mutat. Res. 2015, 763, 212–245. [Google Scholar] [CrossRef] [PubMed]
- Paz-Elizur, T.; Krupsky, M.; Blumenstein, S.; Elinger, D.; Schechtman, E.; Livneh, Z. DNA Repair Activity for Oxidative Damage and Risk of Lung Cancer. J. Natl. Cancer Inst. 2003, 95, 1312–1319. [Google Scholar] [CrossRef] [PubMed]
- Iijima, H.; Patrzyc, H.B.; Budzinski, E.E.; Freund, H.G.; Dawidzik, J.B.; Rodabaugh, K.J.; Box, H.C. A Study of Pyrimidine Base Damage in Relation to Oxidative Stress and Cancer. Br. J. Cancer 2009, 101, 452–456. [Google Scholar] [CrossRef] [PubMed]
- Kaina, B.; Ochs, K.; Grösch, S.; Fritz, G.; Lips, J.; Tomicic, M.; Dunkern, T.; Christmann, M. BER, MGMT, and MMR in Defense against Alkylation-Induced Genotoxicity and Apoptosis. Prog. Nucleic Acid. Res. Mol. Biol. 2001, 68, 41–54. [Google Scholar] [PubMed]
- Krokan, H.E.; Bjørås, M. Base Excision Repair. Cold Spring Harb. Perspect. Biol. 2013, 5, a012583. [Google Scholar] [CrossRef]
- Kubota, Y.; Nash, R.A.; Klungland, A.; Schär, P.; Barnes, D.E.; Lindahl, T. Reconstitution of DNA Base Excision-Repair with Purified Human Proteins: Interaction between DNA Polymerase β and the XRCC1 Protein. EMBO J. 1996, 15, 6662–6670. [Google Scholar] [CrossRef]
- Kamileri, I.; Karakasilioti, I.; Garinis, G.A. Nucleotide Excision Repair: New Tricks with Old Bricks. Trends Genet. 2012, 28, 566–573. [Google Scholar] [CrossRef]
- McCullough, A.K.; Dodson, M.L.; Lloyd, R.S. Initiation of Base Excision Repair: Glycosylase Mechanisms and Structures. Annu. Rev. Biochem. 1999, 68, 255–285. [Google Scholar] [CrossRef]
- Srivastava, D.K.; vande Berg, B.J.; Prasad, R.; Molina, J.T.; Beard, W.A.; Tomkinson, A.E.; Wilson, S.H. Mammalian Abasic Site Base Excision Repair: Identification of the Reaction Sequence and Rate-Determining Steps. J. Biol. Chem. 1998, 273, 21203–21209. [Google Scholar] [CrossRef]
- Mol, C.D.; Hosfield, D.J.; Tainer, J.A. Abasic Site Recognition by Two Apurinic/Apyrimidinic Endonuclease Families in DNA Base Excision Repair: The 3’ Ends Justify the Means. Mutat. Res. 2000, 460, 211–229. [Google Scholar] [CrossRef]
- Seeberg, E.; Eide, L.; Bjørås, M. The Base Excision Repair Pathway. Trends Biochem. Sci. 1995, 20, 391–397. [Google Scholar] [CrossRef] [PubMed]
- Kennedy, E.E.; Caffrey, P.J.; Delaney, S. Initiating Base Excision Repair in Chromatin. DNA Repair. 2018, 71, 87–92. [Google Scholar] [CrossRef]
- Jagannathan, I.; Cole, H.A.; Hayes, J.J. Base Excision Repair in Nucleosome Substrates. Chromosome Res. 2006, 14, 27–37. [Google Scholar] [CrossRef] [PubMed]
- Yang, J.; Parsons, J.; Nicolay, N.H.; Caporali, S.; Harrington, C.F.; Singh, R.; Finch, D.; Datri, S.; Farmer, P.B.; Johnston, P.G.; et al. Cells Deficient in the Base Excision Repair Protein, DNA Polymerase Beta, Are Hypersensitive to Oxaliplatin Chemotherapy. Oncogene 2009, 29, 463–468. [Google Scholar] [CrossRef] [PubMed]
- Sobol, R.W.; Horton, J.K.; Kühn, R.; Gu, H.; Singhal, R.K.; Prasad, R.; Rajewsky, K.; Wilson, S.H. Requirement of Mammalian DNA Polymerase-β in Base-Excision Repair. Nature 1996, 379, 183–186. [Google Scholar] [CrossRef] [PubMed]
- Starcevic, D.; Dalal, S.; Sweasy, J.B. Is There a Link Between DNA Polymerase Beta and Cancer? Cell Cycle 2004, 3, 998–1001. [Google Scholar] [CrossRef]
- Copani, A.; Hoozemans, J.J.M.; Caraci, F.; Calafiore, M.; van Haastert, E.S.; Veerhuis, R.; Rozemuller, A.J.M.; Aronica, E.; Sortino, M.A.; Nicoletti, F. DNA Polymerase-Beta Is Expressed Early in Neurons of Alzheimer’s Disease Brain and Is Loaded into DNA Replication Forks in Neurons Challenged with Beta-Amyloid. J. Neurosci. 2006, 26, 10949–10957. [Google Scholar] [CrossRef]
- Calafiore, M.; Copani, A.; Deng, W. DNA Polymerase-β Mediates the Neurogenic Effect of β-Amyloid Protein in Cultured Subventricular Zone Neurospheres. J. Neurosci. Res. 2012, 90, 559–567. [Google Scholar] [CrossRef] [PubMed]
- Ahmed, A.A.; Smoczer, C.; Pace, B.; Patterson, D.; Cress Cabelof, D. Loss of DNA Polymerase β Induces Cellular Senescence. Env. Mol. Mutagen. 2018, 59, 603–612. [Google Scholar] [CrossRef]
- Krishna, T.H.; Mahipal, S.; Sudhakar, A.; Sugimoto, H.; Kalluri, R.; Rao, K.S. Reduced DNA Gap Repair in Aging Rat Neuronal Extracts and Its Restoration by DNA Polymerase Beta and DNA-Ligase. J. Neurochem. 2005, 92, 818–823. [Google Scholar] [CrossRef]
- Rao, K.S.; Annapurna, V.v.; Raji, N.S. DNA Polymerase-β May Be the Main Player for Defective DNA Repair in Aging Rat Neurons. Ann. N.Y. Acad. Sci. 2001, 928, 113–120. [Google Scholar] [CrossRef]
- Yamtich, J.; Nemec, A.A.; Keh, A.; Sweasy, J.B. A Germline Polymorphism of DNA Polymerase Beta Induces Genomic Instability and Cellular Transformation. PLoS Genet. 2012, 8, 1003052. [Google Scholar] [CrossRef] [PubMed]
- Bhattacharyya, N.; Chen, H.-C.; Comhair, S.; Erzurum, S.C.; Banerjee, S. Variant Forms of DNA Polymerase Beta in Primary Lung Carcinomas. DNA Cell. Biol. 1999, 18, 549–554. [Google Scholar] [CrossRef]
- Nemec, A.A.; Abriola, L.; Merkel, J.S.; de Stanchina, E.; DeVeaux, M.; Zelterman, D.; Glazer, P.M.; Sweasy, J.B. DNA Polymerase Beta Germline Variant Confers Cellular Response to Cisplatin Therapy. Mol. Cancer Res. 2017, 15, 269–280. [Google Scholar] [CrossRef]
- Dalal, S.; Chikova, A.; Jaeger, J.; Sweasy, J.B. The Leu22Pro Tumor-Associated Variant of DNA Polymerase Beta Is DRP Lyase Deficient. Nucleic Acids Res. 2008, 36, 411–422. [Google Scholar] [CrossRef]
- Murphy, D.L.; Kosa, J.; Jaeger, J.; Sweasy, J.B. The Asp285 Variant of DNA Polymerase Beta Extends Mispaired Primer Termini via Increased Nucleotide Binding. Biochemistry 2008, 47, 8048–8057. [Google Scholar] [CrossRef]
- Rozacky, J.; Nemec, A.A.; Sweasy, J.B.; Kidane, D. Gastric Cancer Associated Variant of DNA Polymerase Beta (Leu22Pro) Promotes DNA Replication Associated Double Strand Breaks. Oncotarget 2015, 6, 24474–24487. [Google Scholar] [CrossRef]
- Lang, T.; Dalal, S.; Chikova, A.; DiMaio, D.; Sweasy, J.B. The E295K DNA Polymerase Beta Gastric Cancer-Associated Variant Interferes with Base Excision Repair and Induces Cellular Transformation. Mol. Cell. Biol. 2007, 27, 5587–5596. [Google Scholar] [CrossRef]
- Opresko, P.L.; Sweasy, J.B.; Eckert, K.A. The Mutator Form of Polymerase β with Amino Acid Substitution at Tyrosine 265 in the Hinge Region Displays an Increase in Both Base Substitution and Frame Shift Errors. Biochemistry 1998, 37, 2111–2119. [Google Scholar] [CrossRef] [PubMed]
- Kladova, O.A.; Fedorova, O.S.; Kuznetsov, N.A. The Role of Natural Polymorphic Variants of DNA Polymerase β in DNA Repair. Int. J. Mol. Sci. 2022, 23, 2390. [Google Scholar] [CrossRef] [PubMed]
- Beard, W.A.; Wilson, S.H. Structure and Mechanism of DNA Polymerase β. Biochemistry 2014, 53, 2768–2780. [Google Scholar] [CrossRef] [PubMed]
- Shock, D.D.; Freudenthal, B.D.; Beard, W.A.; Wilson, S.H. Modulating the DNA Polymerase β Reaction Equilibrium to Dissect the Reverse Reaction. Nat. Chem. Biol. 2017, 13, 1074–1080. [Google Scholar] [CrossRef]
- Dong, Z.; Zhao, G.; Zhao, Q.; Yang, H.; Xue, L.; Tan, X.; Zheng, N. A Study of DNA Polymerase Beta Mutation in Human Esophageal Cancer. Zhonghua Yi Xue Za Zhi 2002, 82, 899–902. [Google Scholar]
- Šali, A.; Blundell, T.L. Comparative Protein Modelling by Satisfaction of Spatial Restraints. J. Mol. Biol. 1993, 234, 779–815. [Google Scholar] [CrossRef]
- Jumper, J.; Evans, R.; Pritzel, A.; Green, T.; Figurnov, M.; Ronneberger, O.; Tunyasuvunakool, K.; Bates, R.; Žídek, A.; Potapenko, A.; et al. Highly Accurate Protein Structure Prediction with AlphaFold. Nature 2021, 596, 583–589. [Google Scholar] [CrossRef]
- Gouge, J.; Rosario, S.; Romain, F.; Beguin, P.; Delarue, M. Structures of Intermediates along the Catalytic Cycle of Terminal Deoxynucleotidyltransferase: Dynamical Aspects of the Two-Metal Ion Mechanism. J. Mol. Biol. 2013, 425, 4334–4352. [Google Scholar] [CrossRef]
- Howard, M.J.; Horton, J.K.; Zhao, M.L.; Wilson, S.H. Lysines in the Lyase Active Site of DNA Polymerase b Destabilize Nonspecific DNA Binding, Facilitating Searching and DNA Gap Recognition. J. Biol. Chem. 2020, 295, 12181–12187. [Google Scholar] [CrossRef]
- Tsoi, P.Y.; Yang, M. Kinetic Study of Various Binding Modes between Human DNA Polymerase Beta and Different DNA Substrates by Surface-Plasmon-Resonance Biosensor. Biochem. J. 2002, 361, 317. [Google Scholar] [CrossRef]
- Bakman, A.S.; Kuznetsova, A.A.; Yanshole, L.v.; Ishchenko, A.A.; Saparbaev, M.; Fedorova, O.S.; Kuznetsov, N.A. Fluorescently Labeled Human Apurinic/Apyrimidinic Endonuclease APE1 Reveals Effects of DNA Polymerase β on the APE1–DNA Interaction. DNA Repair. 2023, 123, 103450. [Google Scholar] [CrossRef]
- Huang, J.; Alnajjar, K.S.; Mahmoud, M.M.; Eckenroth, B.; Doublie, S.; Sweasy, J.B. The Nature of the DNA Substrate Influences Pre-Catalytic Conformational Changes of DNA Polymerase β. J. Biol. Chem. 2018, 293, 15084–15094. [Google Scholar] [CrossRef]
- Zhong, X.; Patel, S.S.; Werneburg, B.G.; Tsai, M.D. DNA Polymerase β: Multiple Conformational Changes in the Mechanism of Catalysis. Biochemistry 1997, 36, 11891–11900. [Google Scholar] [CrossRef]
- Dunlap, C.A.; Tsai, M.D. Use of 2-Aminopurine and Tryptophan Fluorescence as Probes in Kinetic Analyses of DNA Polymerase β. Biochemistry 2002, 41, 11226–11235. [Google Scholar] [CrossRef]
- Abriata, L.A. A Simple Spreadsheet Program to Simulate and Analyze the Far-UV Circular Dichroism Spectra of Proteins. J. Chem. Educ. 2011, 88, 1268–1273. [Google Scholar] [CrossRef]
- Sawaya, M.R.; Prasad, R.; Wilson, S.H.; Kraut, J.; Pelletier, H. Crystal Structures of Human DNA Polymerase Beta Complexed with Gapped and Nicked DNA: Evidence for an Induced Fit Mechanism. Biochemistry 1997, 36, 11205–11215. [Google Scholar] [CrossRef] [PubMed]
- Batra, V.K.; Beard, W.A.; Shock, D.D.; Krahn, J.M.; Pedersen, L.C.; Wilson, S.H. Magnesium-Induced Assembly of a Complete DNA Polymerase Catalytic Complex. Structure 2006, 14, 757–766. [Google Scholar] [CrossRef] [PubMed]
- Freudenthal, B.D.; Beard, W.A.; Shock, D.D.; Wilson, S.H. Observing a DNA Polymerase Choose Right from Wrong. Cell 2013, 154, 157. [Google Scholar] [CrossRef] [PubMed]
- Yang, Z.; Lasker, K.; Schneidman-Duhovny, D.; Webb, B.; Huang, C.C.; Pettersen, E.F.; Goddard, T.D.; Meng, E.C.; Sali, A.; Ferrin, T.E. UCSF Chimera, MODELLER, and IMP: An Integrated Modeling System. J. Struct. Biol. 2012, 179, 269–278. [Google Scholar] [CrossRef]
- Gridley, C.L.; Rangarajan, S.; Firbank, S.; Dalal, S.; Sweasy, J.B.; Jaeger, J. Structural Changes in the Hydrophobic Hinge Region Adversely Affect the Activity and Fidelity of the I260Q Mutator DNA Polymerase β. Biochemistry 2013, 52, 4422–4432. [Google Scholar] [CrossRef]
- Abraham, M.J.; Murtola, T.; Schulz, R.; Páll, S.; Smith, J.C.; Hess, B.; Lindah, E. GROMACS: High Performance Molecular Simulations through Multi-Level Parallelism from Laptops to Supercomputers. SoftwareX 2015, 1–2, 19–25. [Google Scholar] [CrossRef]
- Jorgensen, W.L.; Chandrasekhar, J.; Madura, J.D.; Impey, R.W.; Klein, M.L. Comparison of Simple Potential Functions for Simulating Liquid Water. J. Chem. Phys. 1998, 79, 926. [Google Scholar] [CrossRef]
- Joung, I.S.; Cheatham, T.E. Determination of Alkali and Halide Monovalent Ion Parameters for Use in Explicitly Solvated Biomolecular Simulations. J. Phys. Chem. B 2008, 112, 9020–9041. [Google Scholar] [CrossRef]
- Maier, J.A.; Martinez, C.; Kasavajhala, K.; Wickstrom, L.; Hauser, K.E.; Simmerling, C. Ff14SB: Improving the Accuracy of Protein Side Chain and Backbone Parameters from Ff99SB. J. Chem. Theory Comput. 2015, 11, 3696–3713. [Google Scholar] [CrossRef] [PubMed]
- Zgarbová, M.; Šponer, J.; Otyepka, M.; Cheatham, T.E.; Galindo-Murillo, R.; Jurečka, P. Refinement of the Sugar-Phosphate Backbone Torsion Beta for AMBER Force Fields Improves the Description of Z- and B-DNA. J. Chem. Theory Comput. 2015, 11, 5723–5736. [Google Scholar] [CrossRef] [PubMed]
- Bayly, C.I.; Merz, K.M.; Ferguson, D.M.; Cornell, W.D.; Fox, T.; Caldwell, J.W.; Kollman, P.A.; Cieplak, P.; Gould, I.R.; Spellmeyer, D.C. A Second Generation Force Field for the Simulation of Proteins, Nucleic Acids, and Organic Molecules. J. Am. Chem. Soc. 1995, 117, 5179–5197. [Google Scholar]
- Zgarbová, M.; Otyepka, M.; Šponer, J.; Mládek, A.; Banáš, P.; Cheatham, T.E.; Jurečka, P. Nucleic Acids Force Field Based on Reference Quantum Chemical Calculations of Glycosidic Torsion Profiles. J. Chem. Theory Comput. 2011, 7, 2886–2902. [Google Scholar] [CrossRef] [PubMed]
- Meagher, K.L.; Redman, L.T.; Carlson, H.A. Development of Polyphosphate Parameters for Use with the AMBER Force Field. J. Comput. Chem. 2003, 24, 1016–1025. [Google Scholar] [CrossRef]
- Vanquelef, E.; Simon, S.; Marquant, G.; Garcia, E.; Klimerak, G.; Delepine, J.C.; Cieplak, P.; Dupradeau, F.Y.R.E.D. Server: A Web Service for Deriving RESP and ESP Charges and Building Force Field Libraries for New Molecules and Molecular Fragments. Nucleic Acids Res. 2011, 39, W511–W517. [Google Scholar] [CrossRef]
- Jiang, Y.; Zhang, H.; Tan, T. Rational Design of Methodology-Independent Metal Parameters Using a Nonbonded Dummy Model. J. Chem. Theory Comput. 2016, 12, 3250–3260. [Google Scholar] [CrossRef] [PubMed]
- Oelschlaeger, P.; Klahn, M.; Beard, W.A.; Wilson, S.H.; Warshel, A. Magnesium-Cationic Dummy Atom Molecules Enhance Representation of DNA Polymerase β in Molecular Dynamics Simulations: Improved Accuracy in Studies of Structural Features and Mutational Effects. J. Mol. Biol. 2007, 366, 687–701. [Google Scholar] [CrossRef] [PubMed]
- Essmann, U.; Perera, L.; Berkowitz, M.L.; Darden, T.; Lee, H.; Pedersen, L.G. A Smooth Particle Mesh Ewald Method. J. Chem. Phys. 1998, 103, 8577. [Google Scholar] [CrossRef]
- Wennberg, C.L.; Murtola, T.; Hess, B.; Lindahl, E. Lennard-Jones Lattice Summation in Bilayer Simulations Has Critical Effects on Surface Tension and Lipid Properties. J. Chem. Theory Comput. 2013, 9, 3527–3537. [Google Scholar] [CrossRef] [PubMed]
- Hess, B.; Bekker, H.; Berendsen, H.J.C.; Fraaije, J.G.E.M. LINCS: A Linear Constraint Solver for Molecular Simulations. J. Comput. Chem. 1997, 18, 14631472. [Google Scholar] [CrossRef]
- Bussi, G.; Donadio, D.; Parrinello, M. Canonical Sampling through Velocity Rescaling. J. Chem. Phys. 2007, 126, 014101. [Google Scholar] [CrossRef] [PubMed]
- Parrinello, M.; Rahman, A. Polymorphic Transitions in Single Crystals: A New Molecular Dynamics Method. J. Appl. Phys. 1998, 52, 7182. [Google Scholar] [CrossRef]
- Miller, B.R.; McGee, T.D.; Swails, J.M.; Homeyer, N.; Gohlke, H.; Roitberg, A.E. MMPBSA.Py: An Efficient Program for End-State Free Energy Calculations. J. Chem. Theory Comput. 2012, 8, 3314–3321. [Google Scholar] [CrossRef]
- Valdés-Tresanco, M.S.; Valdés-Tresanco, M.E.; Valiente, P.A.; Moreno, E. Gmx_MMPBSA: A New Tool to Perform End-State Free Energy Calculations with GROMACS. J. Chem. Theory Comput. 2021, 17, 6281–6291. [Google Scholar] [CrossRef]
- Duan, L.; Liu, X.; Zhang, J.Z.H. Interaction Entropy: A New Paradigm for Highly Efficient and Reliable Computation of Protein-Ligand Binding Free Energy. J. Am. Chem. Soc. 2016, 138, 5722–5728. [Google Scholar] [CrossRef] [PubMed]


| WT Polβ | Polβ G118V | Polβ R149I |
|---|---|---|
| 78.6 ± 15.7 | 78.4 ± 16.7 | 64.7 ± 12.3 |
| Substrate | WT Polβ | Polβ G118V * | Polβ R149I |
|---|---|---|---|
| Gap_A | 0.38 ± 0.02 | 0.85 ± 0.09 | 1.37 ± 0.07 |
| Gap_T | 0.33 ± 0.03 | 0.88 ± 0.07 | 1.35 ± 0.06 |
| Gap_G | 0.59 ± 0.07 | 1.3 ± 0.1 | 1.56 ± 0.05 |
| Gap_C | 0.38 ± 0.03 | 0.93 ± 0.07 | 1.36 ± 0.09 |
| Substrate | WT Polβ * | Polβ G118V | Polβ R149I |
|---|---|---|---|
| Gap_A | 0.33 ± 0.03 | 0.015 ± 0.001 | 0.056 ± 0.001 |
| Gap_T | 0.32 ± 0.04 | 0.007 ± 0.001 | 0.028 ± 0.001 |
| Gap_G | 0.25 ± 0.02 | 0.012 ± 0.001 | 0.073 ± 0.008 |
| Gap_C | 0.34 ± 0.02 | 0.010 ± 0.001 | 0.069 ± 0.003 |
| WT Polβ | Polβ G118V | Polβ R149I | |
|---|---|---|---|
| kpol, s−1 | 0.93 ± 0.05 | 0.17 ± 0.01 | 0.9 ± 0.1 |
| Kd, app (dATP), μM | 16 ± 3 | 83 ± 6 | 42 ± 18 |
| Polβ Mutant | Primer Sequence |
|---|---|
| G118V | Forward: 5′-GCAAGGAAGTTTGTAGATGAAGTAATTAAAACACTAGAAGATCTCAG-3′ Reverse: 5′-CTGAGATCTTCTAGTGTTTTAATTACTTCATCTACAAACTTCCTTGC-3′ |
| R149I | Forward: 5′-GGGGACTTTGAAAAAATAATTCCTCGTGAAGAGATGTTACAAATG-3′ Reverse: 5′-CATTTGTAACATCTCTTCACGAGGAATTATTTTTTCAAAGTCCCC-3′ |
| Name | Sequence |
|---|---|
| Pol16 | 5′-TAGTCACCTCAATCCA-3′ |
| FAM_Pol19 | FAM 5′-GCCTCGCAGCGGTCCAACC-3′ |
| Pol19 | 5′-GCCTCGCAGCGGTCCAACC-3′ |
| Pol36_N | 5′-TGGATTGAGGTGACTANGGTTGGACGGCTGCGAGGC-3′ |
| Pol36_N_aPu | 5′-TGGATTGAGGTGACTXNGGTTGGACGGCTGCGAGGC-3′ |
Disclaimer/Publisher’s Note: The statements, opinions and data contained in all publications are solely those of the individual author(s) and contributor(s) and not of MDPI and/or the editor(s). MDPI and/or the editor(s) disclaim responsibility for any injury to people or property resulting from any ideas, methods, instructions or products referred to in the content. |
© 2023 by the authors. Licensee MDPI, Basel, Switzerland. This article is an open access article distributed under the terms and conditions of the Creative Commons Attribution (CC BY) license (https://creativecommons.org/licenses/by/4.0/).
Share and Cite
Kladova, O.A.; Tyugashev, T.E.; Mikushina, E.S.; Soloviev, N.O.; Kuznetsov, N.A.; Novopashina, D.S.; Kuznetsova, A.A. Human Polβ Natural Polymorphic Variants G118V and R149I Affects Substate Binding and Catalysis. Int. J. Mol. Sci. 2023, 24, 5892. https://doi.org/10.3390/ijms24065892
Kladova OA, Tyugashev TE, Mikushina ES, Soloviev NO, Kuznetsov NA, Novopashina DS, Kuznetsova AA. Human Polβ Natural Polymorphic Variants G118V and R149I Affects Substate Binding and Catalysis. International Journal of Molecular Sciences. 2023; 24(6):5892. https://doi.org/10.3390/ijms24065892
Chicago/Turabian StyleKladova, Olga A., Timofey E. Tyugashev, Elena S. Mikushina, Nikita O. Soloviev, Nikita A. Kuznetsov, Daria S. Novopashina, and Aleksandra A. Kuznetsova. 2023. "Human Polβ Natural Polymorphic Variants G118V and R149I Affects Substate Binding and Catalysis" International Journal of Molecular Sciences 24, no. 6: 5892. https://doi.org/10.3390/ijms24065892
APA StyleKladova, O. A., Tyugashev, T. E., Mikushina, E. S., Soloviev, N. O., Kuznetsov, N. A., Novopashina, D. S., & Kuznetsova, A. A. (2023). Human Polβ Natural Polymorphic Variants G118V and R149I Affects Substate Binding and Catalysis. International Journal of Molecular Sciences, 24(6), 5892. https://doi.org/10.3390/ijms24065892