Article

Regulation of ssb Gene Expression in Escherichia coli

1
Department of Clinical Medicine and Surgery, University of Naples Federico II, 81031 Naples, Italy
2
Department of Plant Pathology, Division for Phytomedicine, Faculty of Agriculture, University of Zagreb, 10000 Zagreb, Croatia
3
Division of Molecular Medicine, Ruđer Bošković Institute, 10000 Zagreb, Croatia
4
Division of Molecular Biology, Ruđer Bošković Institute, 10000 Zagreb, Croatia
*
Author to whom correspondence should be addressed.
Int. J. Mol. Sci. 2022, 23(18), 10917; https://doi.org/10.3390/ijms231810917
Submission received: 8 August 2022 / Revised: 1 September 2022 / Accepted: 15 September 2022 / Published: 18 September 2022
(This article belongs to the Special Issue Molecular Mechanism of DNA Replication and Repair)

Abstract

:
Bacterial SSB proteins, as well as their eukaryotic RPA analogues, are essential and ubiquitous. They avidly bind single-stranded DNA and regulate/coordinate its metabolism, hence enabling essential DNA processes such as replication, transcription, and repair. The prototypic Escherichia coli SSB protein is encoded by an ssb gene. Although the ssb gene promoters harbor an SOS box, multiple studies over several decades failed to elucidate whether ssb gene expression is inducible and SOS dependent. The SOS regulon is comprised of about 50 genes, whose transcription is coordinately induced under stress conditions. Using quantitative real-time PCR, we determined the ssb gene expression kinetics in UV- and γ-irradiated E. coli and revealed that ssb gene expression is elevated in irradiated cells in an SOS-dependent manner. Additionally, the expression of the sulA gene was determined to indicate the extent of SOS induction. In a mutant with a constitutively induced SOS regulon, the ssb gene was overexpressed in the absence of DNA damage. Furthermore, we measured ssb gene expression by droplet digital PCR during unaffected bacterial growth and revealed that ssb gene expression was equal in wild-type and SOS bacteria, whereas sulA expression was higher in the former. This study thus reveals a complex pattern of ssb gene expression, which under stress conditions depends on the SOS regulon, whereas during normal bacterial growth it is unlinked to SOS induction. The E. coli ssb gene is SOS regulated in such a way that its basal expression is relatively high and can be increased only through stronger SOS induction. The remarkable SOS induction observed in undisturbed wild-type cells may challenge our notion of the physiological role of the SOS response in bacteria.

1. Introduction

Genetic information is stored and protected within the double-stranded DNA molecule as a result of DNA duplex’s stability and inertness. However, the information encoded in the DNA duplex can only be used when DNA loses its duplex character, which occurs in a spatiotemporal manner during the obligatory physiological DNA metabolic processes of DNA replication, transcription, recombination, and repair. During these processes, enzymes, such as helicases and nucleases, act on the DNA duplex to transiently expose single-stranded DNA (ssDNA). The ssDNA intermediates are swiftly and tightly bound by the single-strand DNA binding (SSB) class of proteins in prokaryotes and RPA (replication protein A) proteins in eukaryotes [1,2,3,4,5,6], both of which play two essential roles in every cell: (a) SSB binds to ssDNA in a sequence-independent way and protects it from the activity of various nucleases [2,7,8,9,10]; (b) SSB interacts with/recruits a plethora of enzymes involved in DNA metabolism and thus regulates their activity, acting as a molecular matchmaker [11]. As a result of these activities, SSBs (RPAs) play a central role in DNA metabolism in organisms across all kingdoms of life and are, thus, essential proteins that enable fundamental cellular processes such as DNA replication, recombination, and repair [12].
Among the highly conserved bacterial SSB proteins, Escherichia coli SSB is considered prototypic regarding its structure and function [1,2,3,4,13]. The E. coli SSB protein exists as a homotetramer, with each monomer containing 178 amino acids, which can be divided into two domains based on proteolytic cleavage [13]. The well conserved N-terminal domain consists of 117 amino acids and is required for tetramer formation and cooperative ssDNA binding [13,14], while the C-terminal domain (especially its conserved C-terminal 9 residue acid tip) seems to mediate interactions with at least 14 DNA binding proteins that comprise the SSB interactome [11,15].
The essential SSB protein-coding gene, ssb, is located at centisome 92.08 of the E. coli chromosome [16]. The promoters of the E. coli ssb contain a single LexA repressor binding sequence (SOS box), which implies that ssb belongs to the SOS regulon [17]. The SOS regulon is a set of about 50 genes in the E. coli chromosome whose expression is repressed by a LexA repressor, until coordinately induced under stress conditions. The SOS response is induced when accumulated regions of ssDNA are bound by the RecA protein which acts as a coprotease to facilitate LexA repressor autocleavage [18]. Since SSB is such an important governor of DNA metabolism, it should not be surprising that it is a part of the regulon that regulates DNA replication, repair, mutagenesis, and cell division in bacteria under stress. However, the issue of SOS regulation of E. coli ssb expression turns out to be far from settled. Namely, ssb is regulated in a rather complex manner, containing three different promoters, of which LexA may repress only one, whereas the other two enable constitutive, though relatively low, ssb expression [17]. The LexA binding box is rather distant (−170 nt) from the ssb coding region and is divergent from the consensus SOS box (heterology index, HI, 6.98) [19]. Furthermore, the SOS box is situated in an intergenic region between the ssb and uvrA genes, which are transcribed in opposite directions, indicating that it can control the expression of both genes [19] (Figure 1).
Whether E. coli ssb is inducible under the SOS response was explored by several laboratories in the 1980s and then again in the 2000s. In these earlier studies, no increase in SSB level upon SOS induction were observed by radioimmunoassay [20,21,22,23]. On the other hand, two studies reported a very moderate and slow increase in SSB production in cells with a heavily induced SOS response [23,24], raising in turn the question of the physiological relevance of those results. When the ssb gene was cloned into lambda phage and introduced into SOS-noninducible cells, the uninterrupted synthesis of the SSB protein indicated that the ssb is not repressed by LexA, unlike uvrA [25].
The results of gene fusion investigations were also contradictory as one study failed to confirm SOS regulation of ssb [21], whereas the other showed that ssb expression is indeed SOS regulated [26]. However, Brandsma et al. cloned the gene fusion into a pBR322 plasmid so it was present in multiple copies in a cell, which further increases during SOS induction [27], hence making this experimental system not particularly useful since it does not mimic normal physiological conditions.
Another attempt at resolving the question of the ssb gene’s regulation was made possible by the introduction of DNA microarray assays [28]. Two studies used UV and one mitomycin C as an SOS inducer, and changes were measured in the genome-wide gene expression of the E. coli ORFs in response to DNA damage. Many discrepant results reported in the three studies notwithstanding, all three failed to detect an increase in ssb expression in treated cells [29,30,31]. This suggests that either the E. coli ssb is not regulated by the LexA repressor (and hence may not be a functional part of the SOS regulon), or the increase in ssb expression is too low to be detected under the given experimental conditions. Similarly, moderately increased (~3.5 fold) uvrA expression was detected just in Courcelle et al. [30], whereas the other two studies reported no increase in uvrA expression [29,31]. Earlier, the induction of uvrA expression was reported to be about 4-fold, on average, as shown by the β-galactosidase assay [32].
On the other hand, we recently reported that ssb gene expression is indeed increased (more than two-fold) in γ-irradiated E. coli, as determined by a quantitative real-time PCR (RT-qPCR) analysis [33]. Hence, in this study we used the RT-qPCR and droplet digital PCR assays to determine the time course of ssb gene expression in various physiological contexts in E. coli to gain a deeper insight into the regulation of this essential gene.

2. Results

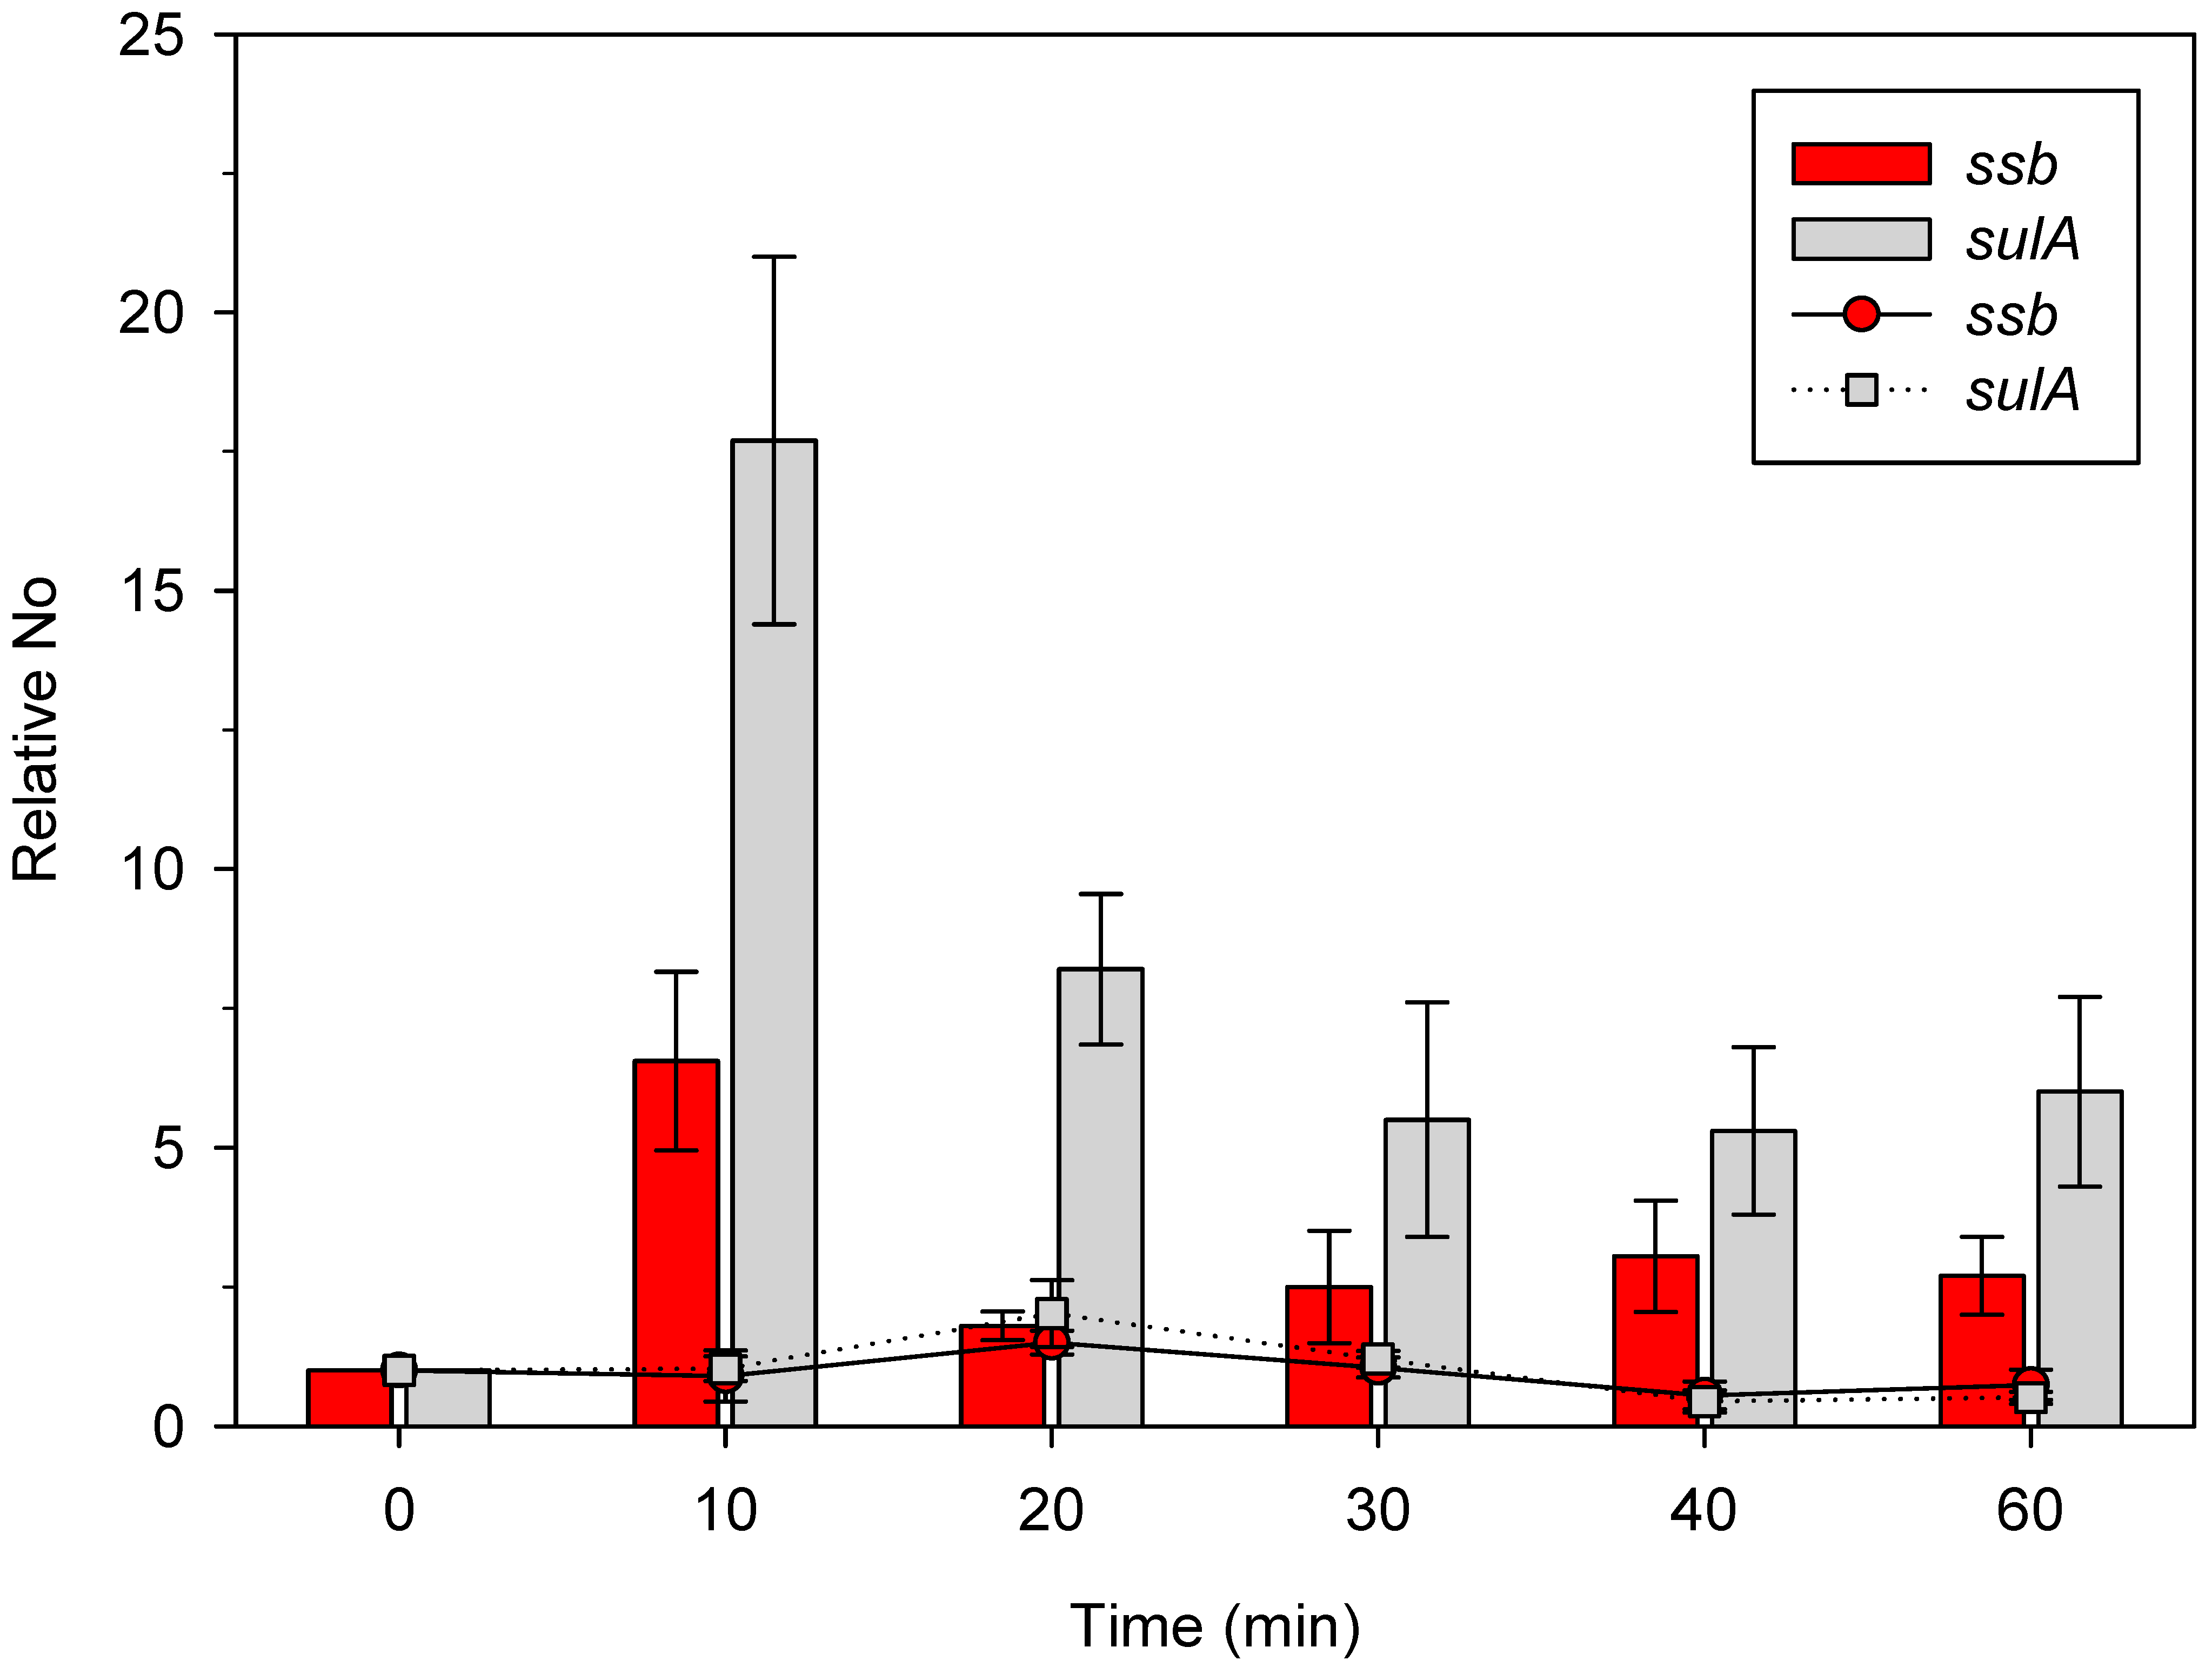
2.1. γ Irradiation Induces ssb and sulA Gene Expression

Recently, we reported the observation of the 2.5-fold increase in the ssb gene expression in γ-irradiated (400 Gy) wild-type E. coli, 40 min post irradiation at 37 °C [33].
In the current study we sought to characterize the expression of the ssb gene more thoroughly; hence, we determined its kinetics. Bacteria were irradiated with 400 Gy of γ-rays, incubated at 37 °C and samples taken 60 min post irradiation. In parallel, we determined the expression of the sulA gene, whose expression is one of the most heavily induced during SOS induction and is thus commonly used for quantifying the SOS response [18].
For reference, we used the expressions of the ssb and sulA genes in unirradiated bacteria, which were 9.4 × 10⁻⁶ ± 2.2 × 10⁻⁶ and 7.6 × 10⁻⁶ ± 2.7 × 10⁻⁶, respectively (n = 3). As shown in Figure 2, the expression of the ssb gene increased about 7-fold compared to an unirradiated control (shown as a bar at 0 min) 10 min after irradiation. After another 10 min of incubation, ssb expression decreased to the level about two-fold higher than the control (Figure 2). ssb gene expression was about three-fold higher in γ-irradiated bacteria 30 min, 40 min, and 60 min post irradiation, compared to the unirradiated control (Figure 2). This is in relatively good agreement with our previous results, wherein we observed about a 2.5-fold increase ine ssb expression 40 min post irradiation [33]. On the other hand, sulA gene expression increased more heavily than that of the ssb gene, being about 18-fold higher than the unirradiated control (shown as a bar at 0 min) and about 2.5-fold higher than the ssb gene 10 min post irradiation (Figure 2). Upon further incubation, sulA expression decreased about twice, to about 8 times the level of the unirradiated control 20 min post irradiation (Figure 2). The expression of sulA further decreased and stabilized at about five-fold above the control 30 min, 40 min, and 60 min post irradiation, which was about two-fold higher than the respective ssb gene expression (Figure 2). The presented results show that both ssb and sulA expression is increased in γ-irradiated bacteria, with the latter gene being induced more heavily.
As a control, we measured the expression of the two genes in the identical experimental setting, except for the application of no irradiation. As expected, no increase in ssb and sulA expression occurred in this situation (Figure 2), indicating that γ-irradiation induces both the ssb and SOS regulon (i.e., sulA gene).
Cell survival in γ-irradiated wild-type cultures was 0.22 ± 0.04 (n = 4), as compared to the unirradiated control.

2.2. UV Induces ssb and sulA Gene Expression

We irradiated bacteria with 40 Jm−2 of UV and followed the kinetics of ssb and sulA gene expression, as expressed in relation to the expressions of the two genes in unirradiated bacteria, which were 6.1 × 10⁻⁶ ± 1.8 × 10⁻⁶ and 7.2 × 10⁻⁶ ± 1.7 × 10⁻⁶, respectively (n = 3), and shown as bars at 0 min. The expression of ssb increased about 18- and 17-fold 10 min and 20 min after irradiation, respectively, as compared to the unirradiated control (Figure 2). Further incubation led to a decrease in the respective ssb expression to about 10-, 5-, and 4-fold above the control 30 min, 40 min, and 60 min post irradiation (Figure 3). Again, the expression of sulA increased more than ssb, reaching about 65- and 70-fold above the unirradiated control 10 min and 20 min post irradiation, respectively (Figure 3). Following further incubation, sulA expression dropped first to about 20-fold above the control 30 min post irradiation, and then to about 5-fold above the control 40 min and 60 min post irradiation (Figure 3).
Based on the above results, we can conclude that UV irradiation induces the expression of both ssb and sulA (i.e., SOS regulon).
Cell survival in UV-irradiated wild-type cultures was 0.86 ± 0.07 (n = 4) of that of the unirradiated part of the culture.
We also determined the expression profile of the uvrA gene in UV-irradiated bacteria, and showed that it was also induced in an SOS-dependent manner (Supplementary Figure S1).

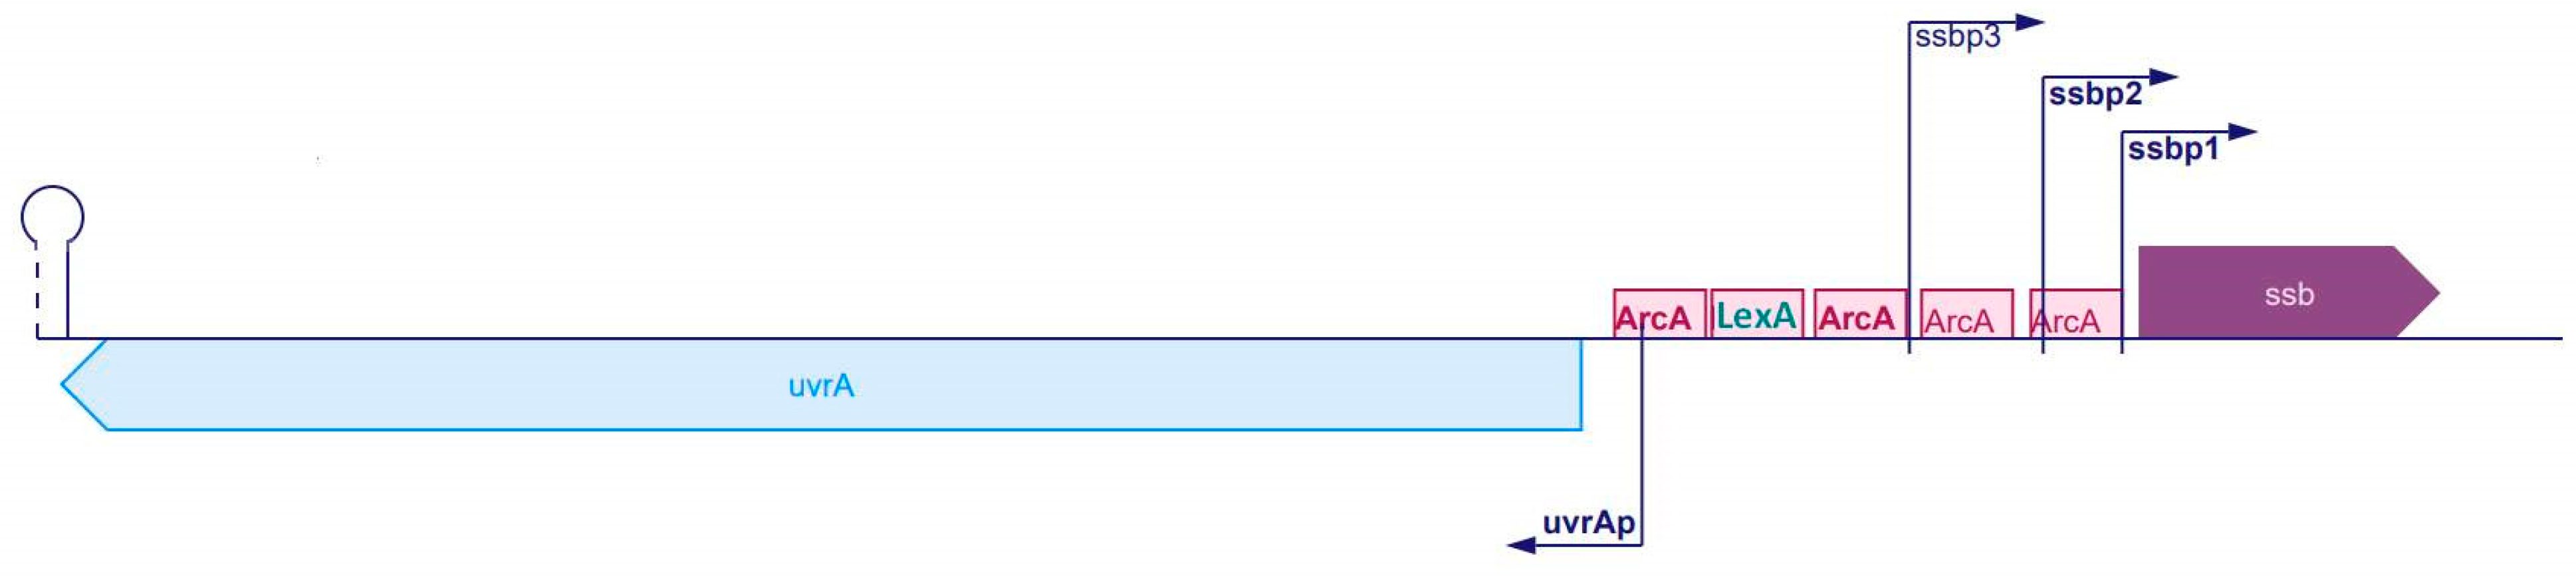
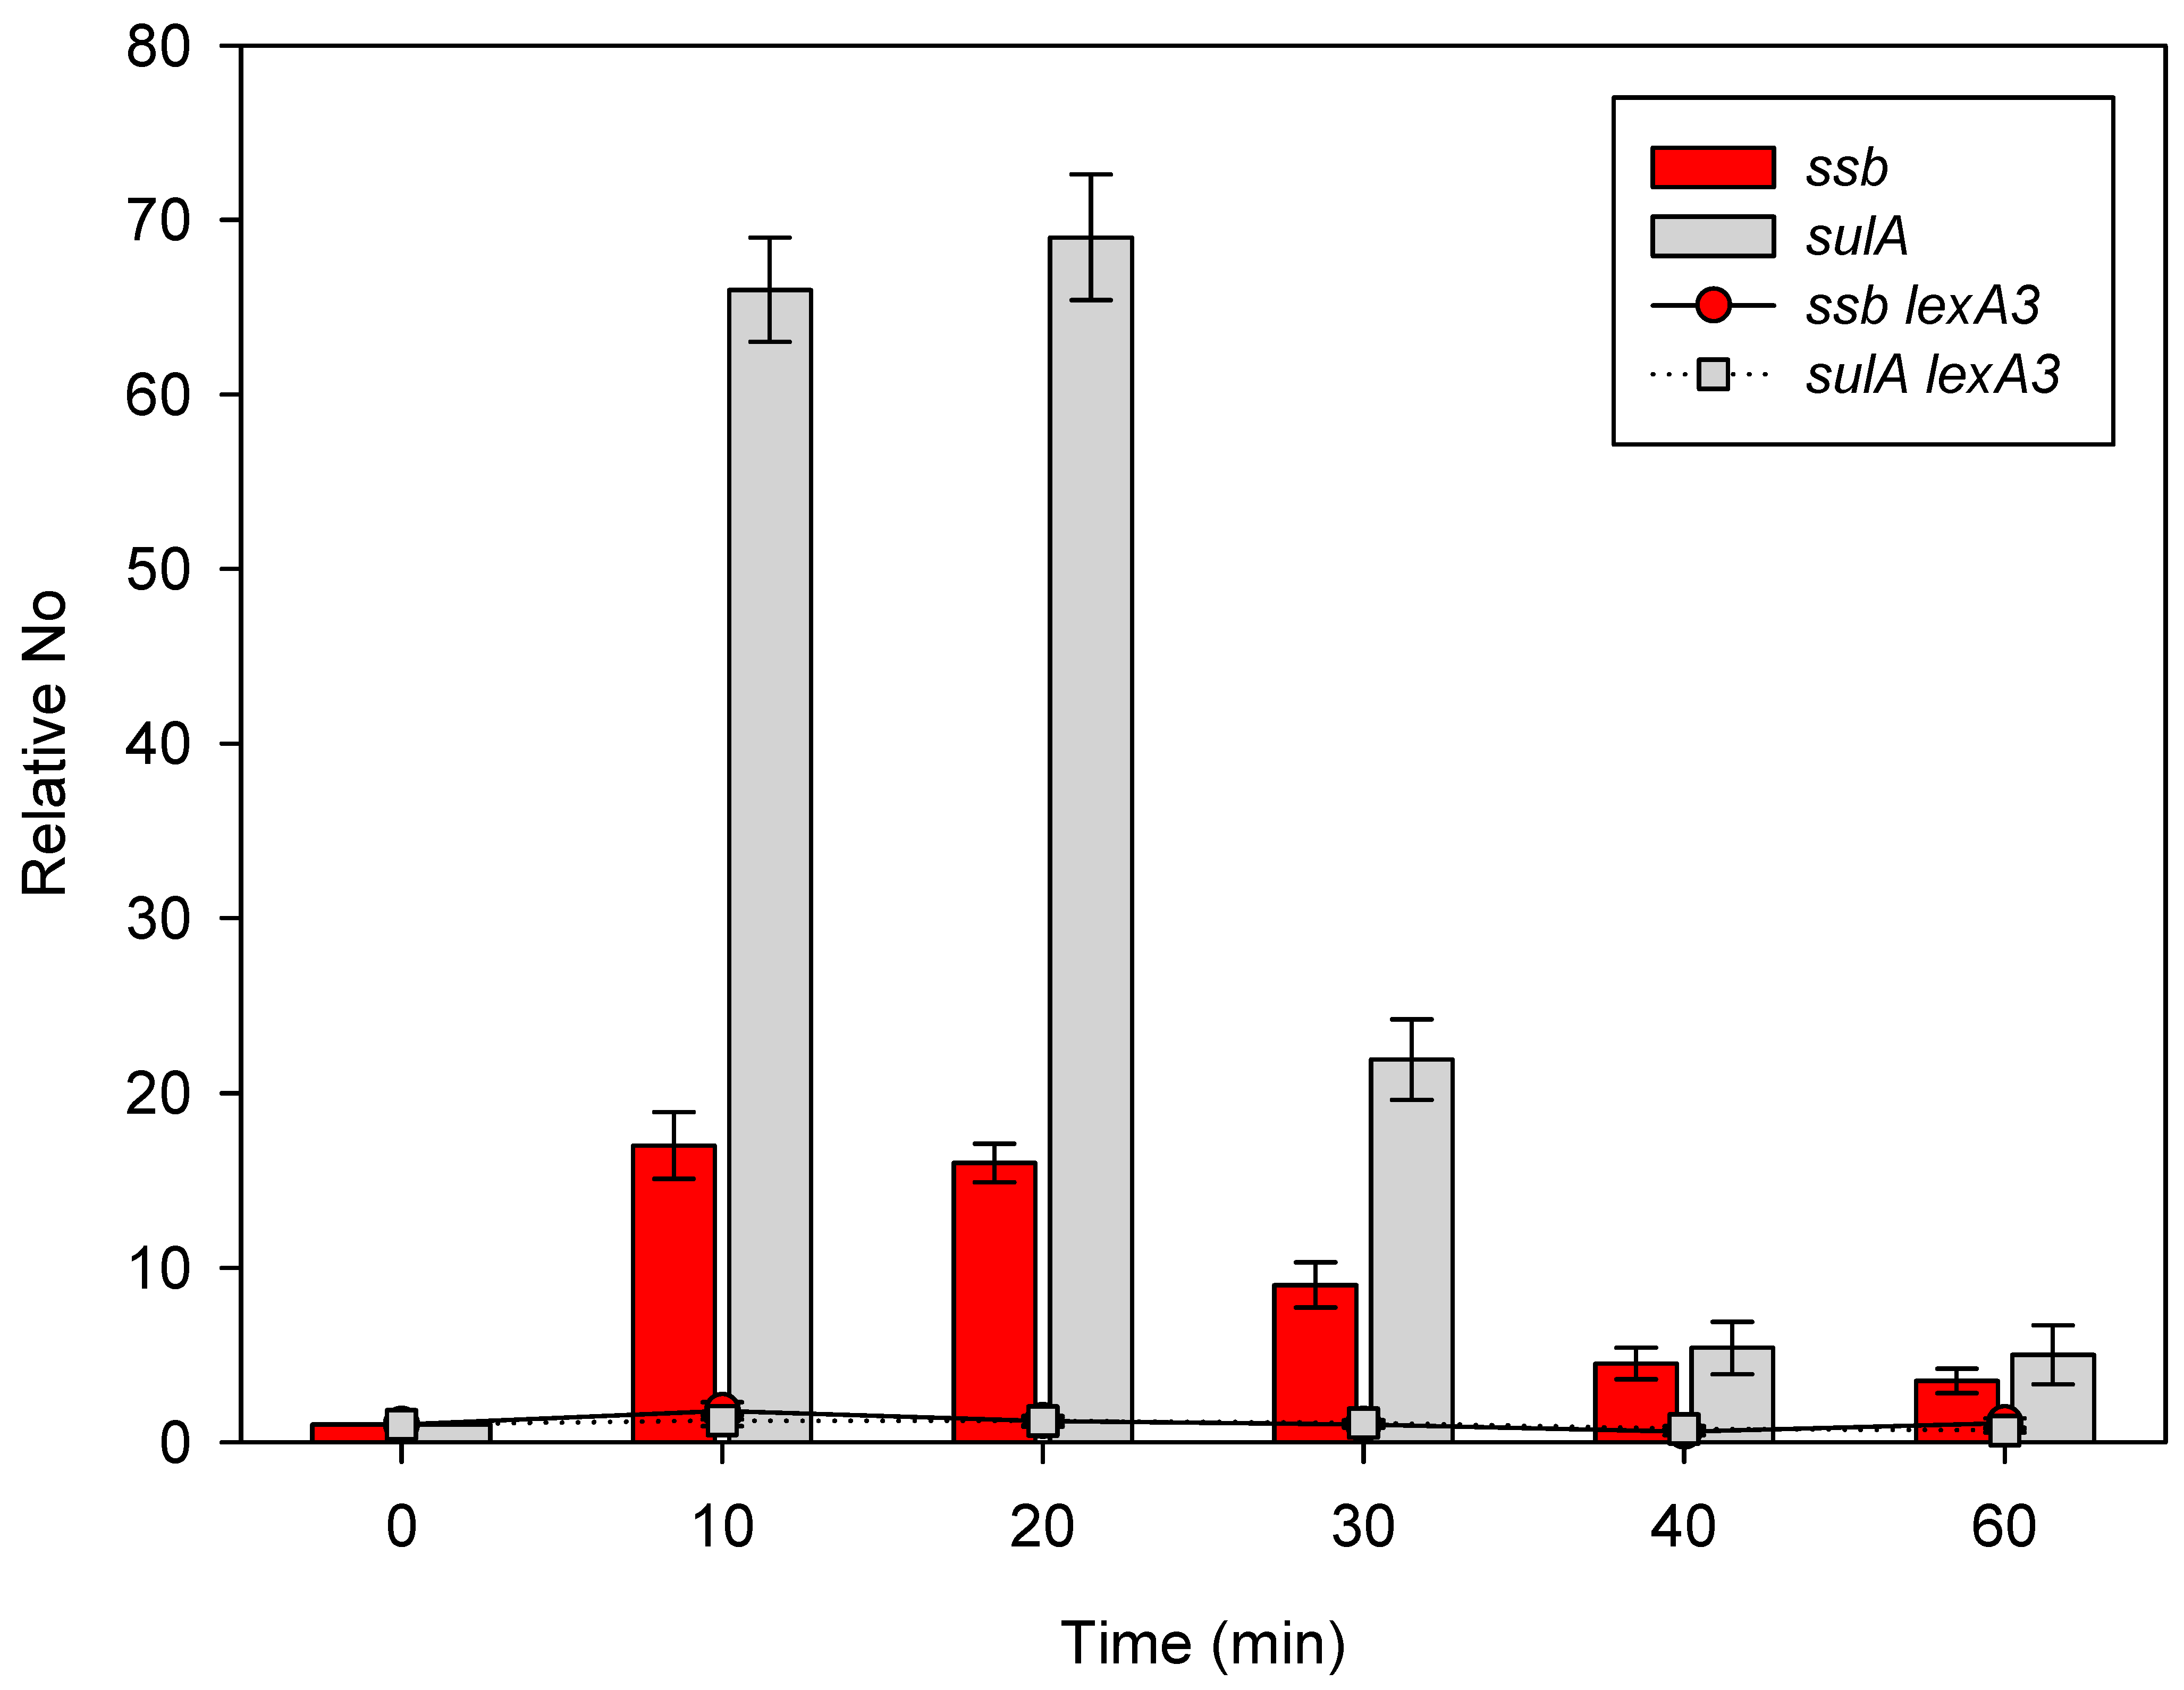
2.3. Expression of the ssb Gene Is Regulated by the LexA Repressor

Our results have so far shown that both ssb and sulA (SOS regulon) are induced by UV- and γ-irradiation. In order to determine possible causality between the induction of the SOS and ssb, we measured the expression in an SOS uninducible lexA3 mutant, which produces an uncleavable LexA repressor [18]. The lexA3 mutant irradiated with γ-rays (not shown) or UV displayed no increase in the expressions of either the ssb or the sulA gene (Figure 3), compared to the unirradiated control, which were 2.1 × 10⁻⁵ ± 4.8 × 10⁻⁶ and 1.3 × 10⁻⁵ ± 2.9 × 10⁻⁶, respectively (n = 3).
The lack of sulA expression in SOS bacteria confirms its repression by the LexA repressor. However, much more interesting is the absence of ssb gene expression in SOS cells because it shows that the E. coli ssb gene is indeed under the control of the SOS regulon under stress conditions in bacteria.

2.4. The ssb Gene Is Overexpressed in Bacteria with Constitutively Activated SOS Regulon

We have shown that the ssb gene is induced when exogenous stress (UV or γ) activates the SOS response. Next, we explored whether SOS induction suffices for ssb gene induction, or the stressor is required. We measured ssb gene expression in an unirradiated lexA71 (Def) mutant, which has inactive LexA repressor and thus the SOS system is constitutively induced [18].
Expression of the ssb gene was highly induced in the mutant during unimpeded exponential growth in a rich medium (OD600~0.4); its No value was 2.8 × 10⁻² ± 1.1 × 10⁻², while that of the wild-type control was 5.4 × 10⁻⁵ ± 3.2 × 10⁻⁵ (n = 3). Thus, the expression of the ssb gene was about 520-fold higher in the constitutively activated SOS mutant than in wild-type bacteria, without the application of any SOS inducing agent.
Hence, our results indicate that constitutive SOS activation suffices for the induction of ssb gene expression, whereas exogenous stress is dispensable.

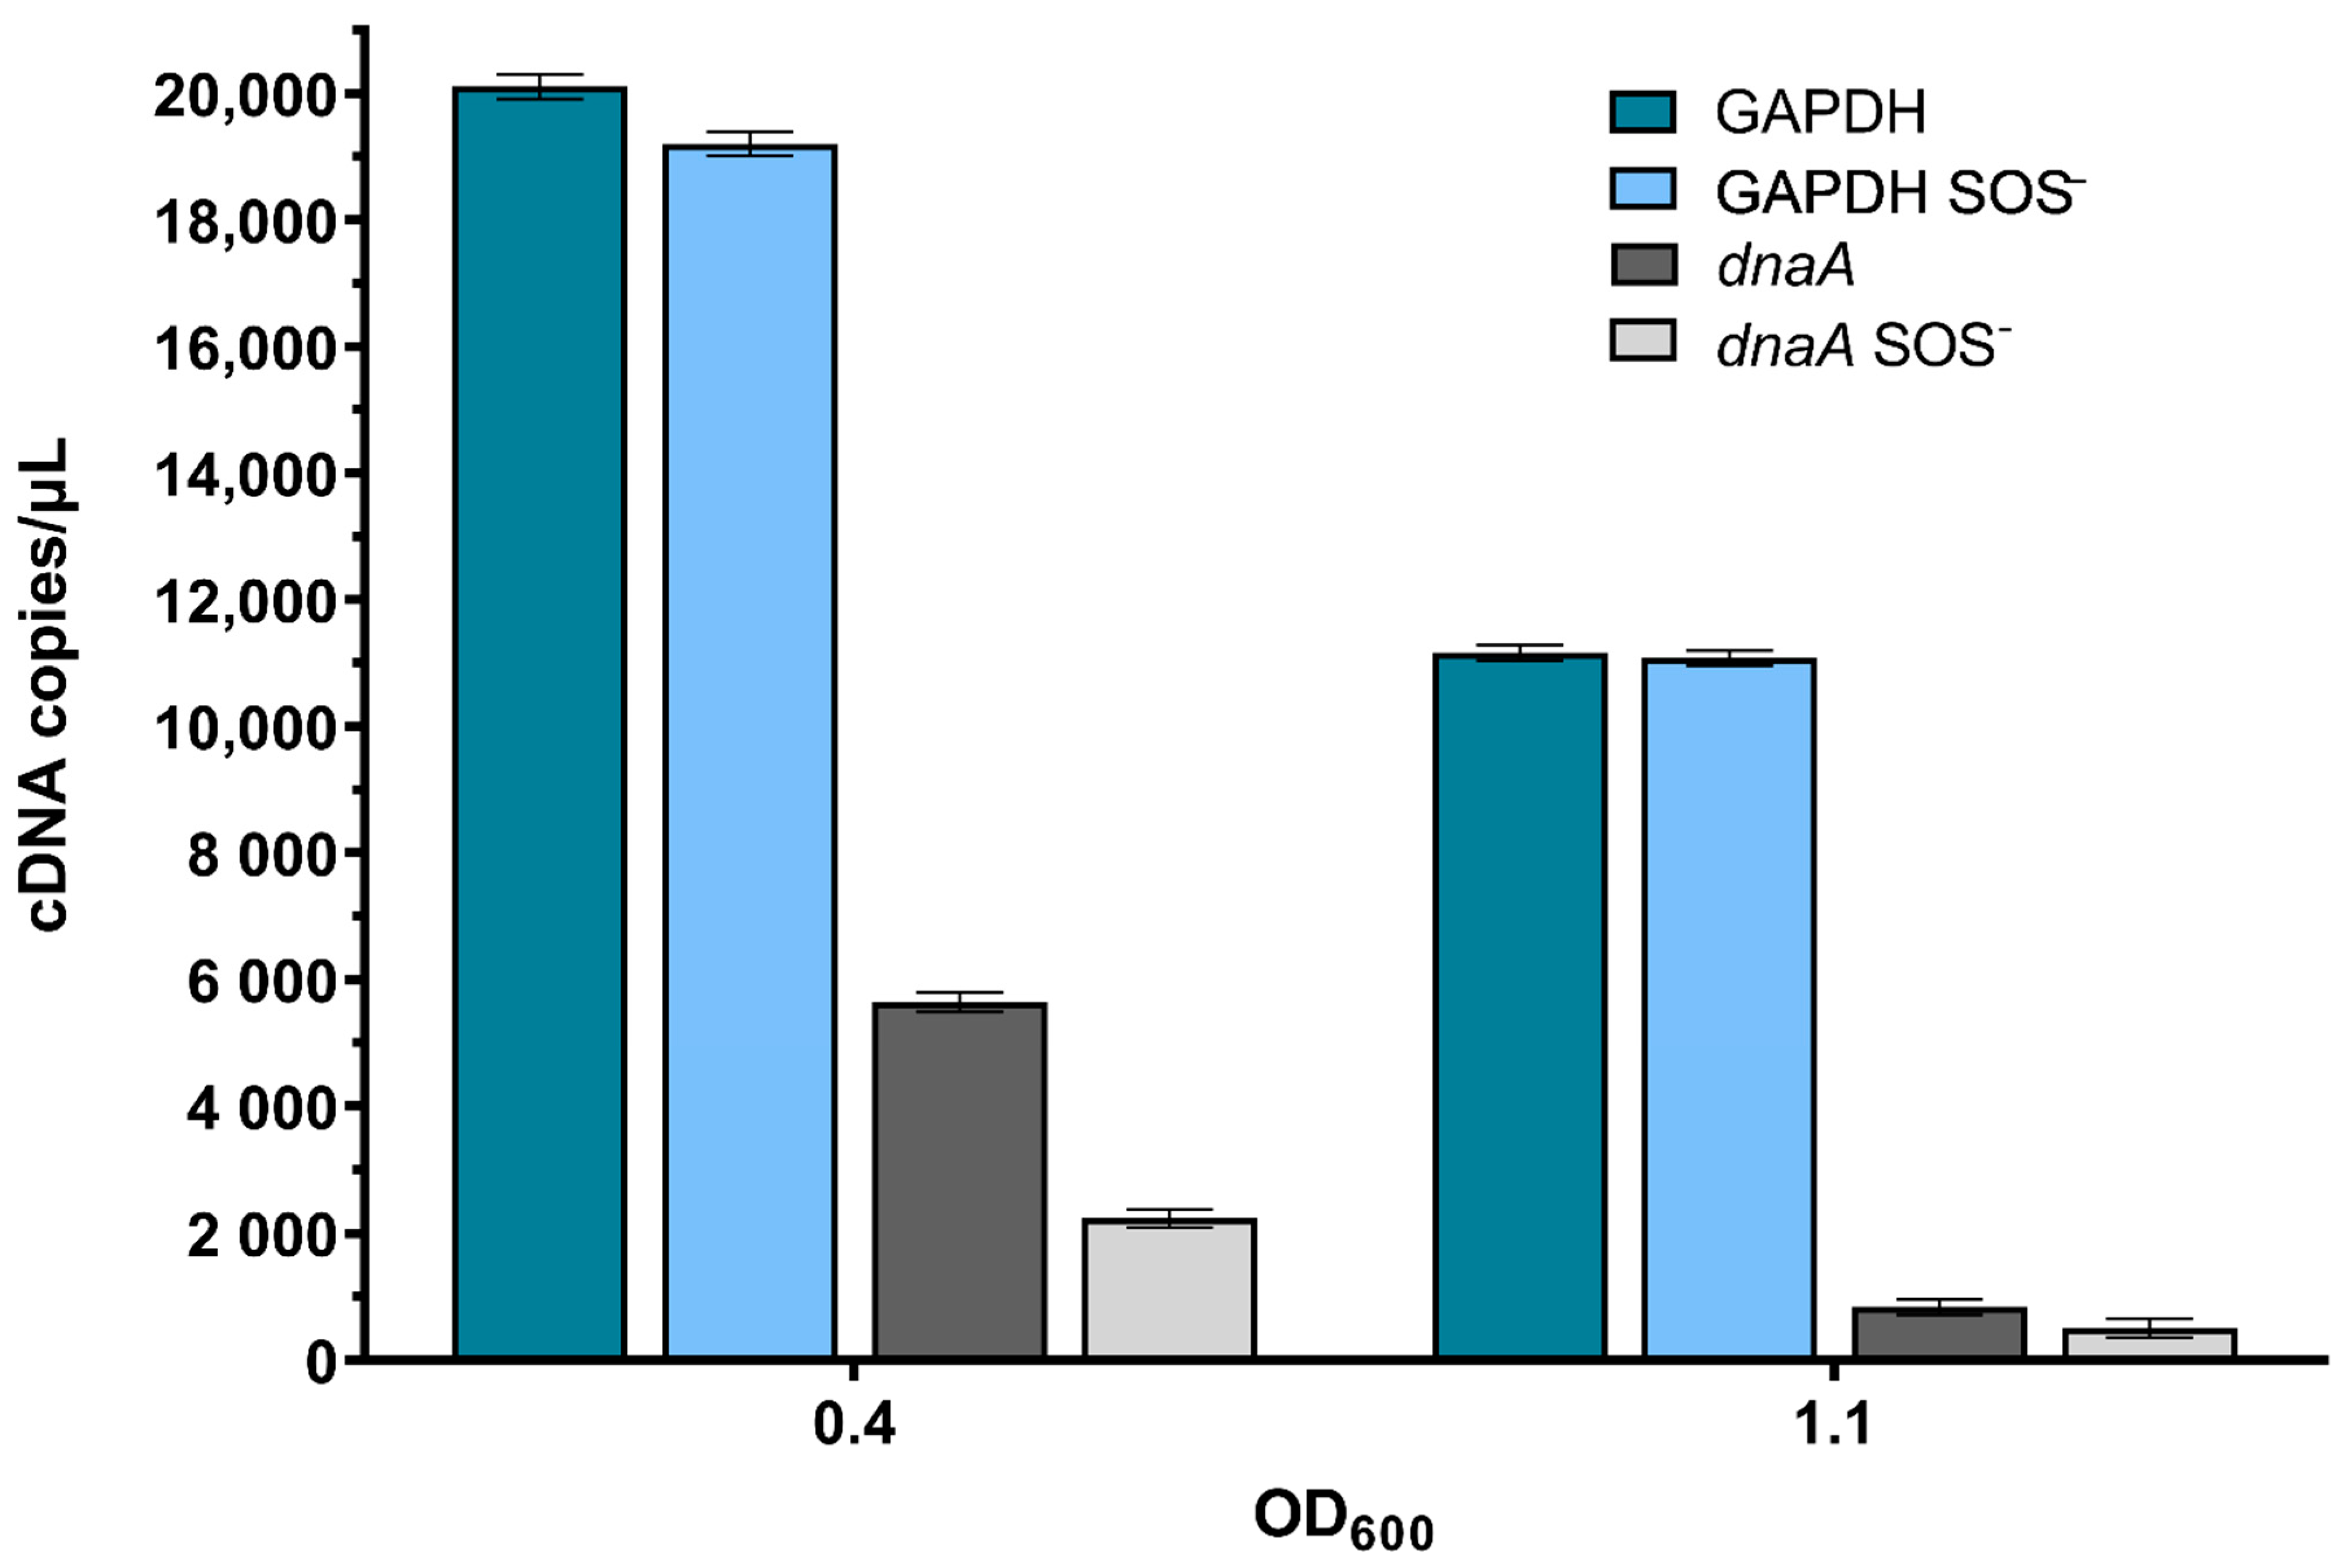
2.5. ssb Gene Expression Is Unlinked to SOS Induction during Undisturbed Bacterial Growth

Considering the ssb promoters’ composition, which enables constitutive expression of this essential gene (see Introduction), we explored ssb gene expression during normal, unaffected growth of wild-type and lexA3 mutant bacteria in rich medium with aeration, in mid-exponential, as well as in early and late stationary phases of growth. The expression of sulA was also determined, as a measure of SOS induction. To obtain more sensitive and reproducible data, we conducted an absolute quantification of transcripts by microfluidic droplet digital PCR (ddPCR).
First, to check the sensitivity of the method as a measure of the overall level of gene expression in growing E. coli cultures, as well as its SOS dependence, we determined the expression of GAPDH (glyceraldehyde-3-phosphate dehydrogenase), a housekeeping gene unrelated to DNA metabolism, which is SOS independent; as well as the dnaA gene, which codes for the replication initiator protein, DnaA [34], and is SOS dependent [35]. GAPDH gene expression was very high in exponentially growing cells, at about 20,000 cDNA copies per µL, which fell about two-fold when cells reached the early stationary growth phase (Figure 4), and further diminished to about 140 cDNA copies per µL in late stationary phase cultures. GAPDH gene expression was at similar levels in wild-type and lexA3 mutant bacteria, indicating that it is unaffected by the SOS regulon, which is unsurprising since this gene’s promoter does not possess an SOS box. Conversely, exponentially growing (OD600~0.4) wild-type and lexA3 cells contained about 5600 and 2200 cDNA copies per µL of the dnaA transcript, respectively (Figure 4), indicating that the dnaA transcript level is increased in wild-type cells due to SOS induction. The dnaA transcript level fell more than 6-fold in the early stationary phase (OD600~1.1) in wild-type bacteria and about 5-fold in their lexA3 derivatives (Figure 4), whereas in the late stationary phase cells, there was no dnaA expression.
There were about 1000 cDNA copies per µL of the ssb gene transcript in both wild-type bacteria and their lexA3 derivatives in the mid-exponential growth phase (OD600~0.4) (Figure 5). The level of the ssb transcript fell about 30% in both bacterial strains in the early stationary growth phase (OD600~1.1) (Figure 5). The data indicate a lack of SOS control of ssb gene expression.
In contrast, uvrA gene expression was about 700 cDNA copies per µL in the wild-type cells in the mid-exponential growth phase (OD600~0.4), whereas there were about thirty percent fewer transcripts in the lexA3 mutant (Figure 5), indicating the SOS dependence of uvrA expression.
sulA gene expression reached about 900 cDNA copies per µL in wild-type cells in the mid-exponential growth phase (OD600~0.4), whereas there were about three-fold fewer transcripts in the lexA3 mutant (Figure 5), suggesting that sulA is expressed at an elevated level due to SOS induction. In the early stationary growth phase (OD600~1.1), the expression of sulA decreased in both wild-type and lexA3 bacteria, with the drop being larger in the former, thus reducing the difference in expression between the two bacterial strains (Figure 5).

3. Discussion

The SSB (RPA) class of proteins is essential for DNA metabolic processes in all living organisms. Although the E. coli SSB protein is the most thoroughly studied, and hence considered the prototypical bacterial SSB [1,2,3,4,13], regulation of its gene, ssb, is still poorly characterized (see Introduction). A complex structure of three ssb promotors, containing a single LexA repressor binding site (SOS box) [17], warrants a multifaceted expression profile, as we have reported here.
By using the RT-qPCR assay, we showed that the expression of ssb is induced by both UV- and γ-irradiation in a LexA-dependent manner, i.e., the gene is a part of the SOS regulon. Furthermore, we showed that SOS induction is sufficient for increasing the expression of ssb, while the application of an exogenous stressor is dispensable. Therefore, we were able to finally resolve the longstanding issue of the regulation of ssb expression by showing that it is indeed LexA dependent. The inability of earlier studies to detect an increase in ssb expression when the SOS response is activated can be attributed to the lower sensitivity of the assays used in those studies. The expression of sulA in UV-irradiated cells is indicative in this regard. In our assay (40 Jm−2 UV, rich medium), sulA expression rose ~70-fold compared to the unirradiated control, which lasted for ~20 min and then dropped to ~20-fold 30 min post irradiation and then to ~5-fold above the control level 40–60 min post irradiation (Figure 2). On the other hand, Courcelle et al. [30] (40 Jm−2 UV, minimal medium) observed a ~14-fold increase in sulA expression 5 min post irradiation, which fell to ~9-fold above the unirradiated control 60 min post irradiation. Quillardet et al. [31] (30 Jm−2 UV, rich medium) reported a ~7.5-fold increase in sulA expression compared to the unirradiated control 30 min post irradiation, which is about three-fold lower than our observation. Hence, although the experimental conditions were similar in the three studies, sulA expression was considerably higher in our report compared to the other two. Notably, the level of SSB is higher in cells grown in rich media than in those grown in minimal media [36]. In our assay, the increase in ssb expression was substantially lower than that of sulA, although the kinetics of both genes’ expressions are similar, with the highest increases observed early, then followed by gradual decreases while retaining the higher level compared to the unirradiated control even 60 min post irradiation. Consequently, lower ssb gene expression (compared to the sulA expression) combined with a lower sensitivity of microarray assays (compared to RT-qPCR) likely led to the lack of ssb gene induction detection in the previous two studies.
An interesting difference was observed in gene expressions in UV- and γ-irradiated bacteria. Namely, the peaks of the two genes’ expressions in UV-irradiated bacteria were about three-fold higher and lasted twice as long as those in γ-irradiated cells, although the γ survival was about four-fold lower than that of the cells irradiated with UV. These results suggest that UV is a more potent SOS inducer than γ-irradiation, which likely reflects the difference in the mechanism of SOS induction in the two situations, with DNA replication impairment being the main cause in the former and the processing of DNA double-strand breaks (DSBs) the main instigator of the SOS response in the latter [37,38,39]. A robust exonuclease activity of the RecBCD enzyme during DSB repair in wild-type cells may be regarded as a very strong suppressor of SOS induction as it thoroughly eliminates ssDNA tracts produced by its unwinding of the damaged DNA.
We revealed another level of ssb gene regulation while following its expression during bacterial growth in the absence of exogenous DNA damaging agents. First, we detected a gradient of gene expression in all tested genes depending on the bacterial growth phase. Namely, gene expression was highest in actively replicating and dividing bacteria during the exponential growth phase, which, in turn, decreased in parallel to the cessation of DNA replication and cell division. This is absolutely expected considering that each generation of dividing cells must duplicate their entire cellular structures.
However, we did notice some differences in the assayed genes’ expression profiles. sulA expression was higher in wild-type than in SOS cells, suggesting that the SOS regulon is induced in actively replicating and dividing bacteria. The difference in sulA expression between wild-type and SOS bacteria decreased in parallel with decreasing DNA replication and cell division (at OD600~1.1), indicating DNA replication as the likely cause of SOS induction. The SOS induction that we observed in undisturbed logarithmically growing wild-type E. coli is a remarkable result (that surely warrants further studying) that contradicts the commonly accepted knowledge that no SOS induction occurs during normal bacterial growth. Indeed, there is a report [40] of SOS induction (as determined by following the activity of the sulA promoter by GFP) in a small subpopulation (0.9%) of undisturbed log-phase wild-type cells. In comparison, our observation of a ~3-fold increased sulA expression level in wild-type vs SOS culture is certainly more physiologically relevant. For, if ~1% of the cells produce that ~3-fold increase in the whole bacterial population (as we measured), their sulA expression should have increased ~300-fold, which is highly unlikely considering that those cultures were undisturbed and such a strong sulA induction was not observed even in heavily disturbed bacteria. Consequently, our data suggest at least an order of magnitude higher incidence of SOS-induced cells in an assayed population, compared to the previous report. Notably, bacteria were grown in minimal medium in the previous study, whereas we grew them in rich medium. Therefore, the application of the highly sensitive ddPCR assay revealed a surprisingly high induction of the SOS regulon in the undisturbed wild-type log-phase-grown E. coli population, which may have a strong ramification for our perception of the physiological role of the SOS system in bacteria.
A similar, though a bit less pronounced, SOS dependence was observed in the expression of the dnaA, a gene coding for the replication initiator protein DnaA. Although the expression of E. coli dnaA is known to be induced by exogenous stress in an SOS-dependent way [35], this is the first report of SOS control of this gene expression during normal, undisturbed bacterial log-phase growth, which is, incidentally, enabled by DnaA. This in turn raises the question of the possible SOS control of DNA replication (initiation) in wild-type bacteria grown in undisturbed conditions. Notably, dnaA overexpression in exponentially growing wild-type bacteria may limit SOS induction, as proposed [41].
On the other hand, ssb expression was more complex, which is not surprising considering that this essential gene harbors multiple promoters. Namely, no difference was noted in ssb gene expression in wild-type and SOS cells in undisturbed, logarithmically-grown cultures, although the increased expression of sulA in the former shows that the SOS regulon was indeed induced. One is tempted to conclude that ssb gene expression is independent of the SOS regulon during the normal growth of E. coli, but ssb overexpression in undisturbed bacteria with a constitutively induced SOS regulon argues against such an explanation. In addition, the (moderate) SOS-dependence of uvrA gene expression, which is repressed by the same SOS box as ssb, reveals fine differences in the regulation of the two genes. The LexA box that controls both genes is quite heterologous (HI 6.98) to the consensus SOS-box sequence, and is thus bound by the LexA repressor with lower affinity [19]. The consequence of this is the relatively high basal expression of both genes, which does not increase substantially (or at all) upon moderate SOS induction. The different expressions of ssb and uvrA in logarithmically-grown cells can be explained by considering their position in respect to the LexA box. Namely, the SOS box is quite distant (170 nt) from the ssb coding region and its control is restricted to the most distant (of the three) ssb promoter [17], whereas the LexA box overlaps with the −35 region of the uvrA promotor. Consequently, LexA repressor inactivation affects uvrA expression more directly than that of ssb.
Our results thus indicate that ssb gene expression is quite stringently suppressed by the LexA repressor in wild-type cells; so much so that the basal ssb gene expression is elevated only with stronger SOS induction, such as after UV- and γ-irradiation, or due to constitutive SOS induction. Weaker SOS induction, such as that observed during normal growth in a rich medium, is obviously insufficient for increasing ssb expression. On the other hand, the basal ssb expression level is quite high in undisturbed growing E. coli: it is as high as that of induced sulA. Therefore, we conclude that the expression of the essential E. coli ssb gene is SOS regulated in such a way that its basal level is relatively high, whereas stronger SOS induction is required for an increase in ssb expression. The basal level of SSB proteins in exponentially growing wt E. coli in LB medium reaches ~8000 copies, e.g., ~2000 tetramers [42], while its consumption during replication should not exceed 200 tetramers [43]. The excess ~1800 tetramers are mostly membrane-localized, from which they swiftly translocate to DNA following DNA damage [43]. Therefore, a combination of the previous results concerning SSB concentration in a cell, and our present results, indicates that even basal ssb gene expression produces a considerable SSB surplus (~1800 tetramers) in an undisturbed bacterial population grown exponentially in a rich medium, and thus there is no need for induced ssb gene expression in those bacteria.

4. Materials and Methods

4.1. Strains, Growth Conditions, and Media

All strains used were derivatives of wild-type E. coli K-12 strain AB1157 [44]. The following mutants were constructed by P1 transduction, as described earlier [45]: DE127 lexA3 (Ind, uncleavable LexA repressor) malB::Tn9 [33]; DE675 lexA71::Tn5 (Def, inoperative LexA repressor) ΔsulA::FRT (laboratory collection). Bacteria were grown at 37 °C in rich Luria–Bertani (LB) broth, with aeration, and on LB plates [45].

4.2. Cell Irradiation by UV and γ-Rays

A fresh overnight bacterial culture was diluted 100-fold in fresh LB broth and grown with aeration at 37 °C until reaching an optical density of 0.4 at 600 nm (OD600).
For UV irradiation, a bacterial culture was spread into Petri dishes so that they covered the bottom as a no more than 2-mm-thick layer. The bacteria were irradiated with a low-pressure Hg germicidal lamp, which produced UV of 254 nm at a rate of 2 Jm−2 s−1. Irradiation was performed at room temperature while mixing bacteria, and then the irradiated cells were transferred into an Erlenmeyer flask and incubated at 37 °C in the dark. Samples were collected at 10, 20, 30, 40, and 60 min after irradiation.
Bacteria were γ-irradiated using a 60Co source, with a dose of 400 Gy, at a dose rate of 2 Gy s−1. A bacterial culture was γ-irradiated at 0 °C in an Erlenmeyer flask and then incubated at 37 °C and samples taken at 10, 20, 30, 40, and 60 min after irradiation.
For survival assays, irradiated bacterial cultures were serially diluted in 67 mM phosphate buffer (pH 7.0), and aliquots spread on LB plates, which were then incubated at 37 °C for 24–48 h. Cell survival was expressed as a fraction of unirradiated control, and expressed as an average value from three experiments ± standard deviation.

4.3. RNA Isolation and Reverse Transcription

Bacterial RNA was extracted from 8 mL samples of bacterial cultures using the RNeasy® Plus Mini Kit (Qiagen, Hilden, Germany) and RNAprotect™ Bacteria Reagent (Qiagen) according to the manufacturer’s instructions. Integrity of RNA was checked by gel electrophoresis, while its quantification was performed with the Quant-IT RNA assay Kit using Qubit fluorometer (Invitrogen, Waltham, MA, USA). Approximately 0.5 μg of RNA was reverse transcribed by the PrimeScript RT reagent kit with genomic DNA Eraser (perfect Real Time, Takara, Mississauga, ON, Canada) using random and oligo dT primers mix in 10 μL reaction. Negative controls without reverse transcriptase were used for all samples.

4.4. Quantitative Real-Time PCR (RT-qPCR) Analysis

Primers for the ssb and sulA gene expression analysis by RT-qPCR were: fw-GTTGTGCTGTTCGGCAAACT and rev-GCGATCCTGACCGGATTGAT; fw-GCCGGGCTTATCAGTGAAGT, and rev-CCTGAACCCATTCCCGACTC, respectively. Endogenous control genes for normalization were: 16S ribosomal gene, fw-GTTAGCCGGTGCTTCTTCTG and rev-CAGCCACACTGGAACTGAGA; and glyceraldehyde-3-phosphate dehydrogenase (GAPDH) gene, fw-GGAACGCCATACCAGTCAGT and rev-AGGTCTGATGACCACCGTTC. Both endogenous controls gave the same results, and we used the latter as it is commonly used as a control and, as shown in Figure 4, its expression is SOS independent. Additionally, Figure 4 shows that GAPDH expression varies less than 2-fold in different bacterial growth phases, which is all indicative of its suitability as a control. We used the following thermal cycling conditions: 50 °C 2 min, 95 °C 7 min, 95 °C 15 s, 60 °C 1 min for 40 cycles followed by dissociation stage: 95 °C for 15 s, 60 °C for 1 min, 95 °C for 15 s, and 60 °C for 15 s. We tested specificity of amplified products on agarose gel and confirmed them by dissociation curve analysis. For post-run data analysis, we used LinRegPCR software v.11.1 [46,47], which enables calculation of the starting concentration of amplicon (“No value”). “No value” is expressed in arbitrary fluorescence units and is calculated by considering PCR efficiency, ranging between 90–100%, and baseline fluorescence. “No value” determined for each technical replicate was averaged and such averaged “No values” were divided by “No values” of endogenous control. Normalized “No values” were compared using unpaired t-test, which compares the mean of two unmatched groups.

4.5. Absolute Quantification of RNA Levels by Microfluidic Digital PCR

Microfluidic droplet digital PCR (ddPCR) procedure was performed using the QIAcuity 2-plex instrument (Qiagen, Hilden, Germany). The ddPCR reaction mixture was assembled using QIAcuity 3X Eva Green PCR Master Mix, 10X primer mix (4 μM), RNase-free water, and a fixed concentration of cDNA template in a final volume of 15 μL per sample. After accurate vortexing, 12 μL of the above prepared mixture was transferred into the 24-well 8.5 K nanoplate and sealed with the nanoplate seal. For quality control of QIAcuity dPCR, the assay was replicated with different amounts of template input (24, 12, and 6 ng). The sequence of primers for transcript detection of ssb, sulA, and GAPDH genes was the same as that used in RT-qPCR; primers used for dnaA gene were: fw-ATCATTCTCACCTCGGATCG and rev-AGACGCTGGCGATAAAGAA. Considering the uvrA gene is 2823 nt long, we used two sets of primers: fw-GCAGGAGAAAGCCCCTCAAT/ rev-TCGGGTTCTGGCAAATCCTC and fw-ACGACGAATGGAGGTATCGC/ rev-CAGATGCTGAAATCGCTGGC. The results were very similar and only those obtained with a first set of primers are shown. The 8.5 K nanoplate gives rise to 8500 single partitions in which the template is distributed randomly. The QIAcuity carries out fully automated processing including all necessary steps for plate priming, sealing of partitions, thermocycling, and image analysis. The amplification cycling protocol include 95 °C for 2 min for enzyme activation and the following 40 cycles of 15 s at 95 °C for denaturation, 15 s at 60 °C for annealing, and 15 s at 72 °C for extension, and then a final step at 40 °C for 5 min. Fluorescence light is emitted by positive partitions that have a target molecule, as compared to those without target, the negative partitions. The experiments were performed using a negative control without reverse transcription enzyme. Data were analyzed using the QIAcuity Suite Software V1.1.3 (Qiagen) and the results are expressed in copies of cDNA/µL based on Poisson statistics analyses. The partitions produced by the machine resemble Poisson process since the targets finish in partitions independently and with a fixed rate. The Poisson distribution gives probabilities for positive integer random events. The parameter of this distribution, λ, is the expectation value for these events, which means it is the mean probability for a proportion of a counting process or the counting process for the ddPCR analysis. Furthermore, the QIAcuity has imbedded software that can quantify and produce reliable statistics. In our case the statistical measure we considered was the Poisson confidence interval at a 95% level that, when plotted, shows whether the events differ with 95% confidence.

Supplementary Materials

The following supporting information can be downloaded at: https://www.mdpi.com/article/10.3390/ijms231810917/s1.

Author Contributions

Conceptualization, I.F., and D.Đ.; formal analysis, I.F., E.Đ., A.P., and D.Đ.; funding acquisition, D.Đ.; investigation, I.F., E.Đ., H.M., S.I., D.Z., S.L., A.P., and D.Đ.; validation, S.I., D.Z., S.L., and D.Đ.; writing—original draft, I.F., E.Đ., S.I., D.Z., and D.Đ.; writing—review and editing, I.F., E.Đ., H.M., S.I., D.Z., S.L., A.P., and D.Đ. All authors have read and agreed to the published version of the manuscript.

Funding

This research was funded by Croatian Science Foundation, grant IP-2019-04-3790.

Institutional Review Board Statement

Not applicable.

Informed Consent Statement

Not applicable.

Data Availability Statement

Not applicable.

Acknowledgments

We are grateful to Maria Chiara Feliciello (Alma Mater Studiorum University of Bologna, Italy) for statistical analysis support, and to Mary Sopta for correction of the English text.

Conflicts of Interest

The authors declare no conflict of interest.

References

  1. Sigal, N.; Delius, H.; Kornberg, T.; Gefter, M.L.; Alberts, B.A. DNA-unwinding protein isolated from Escherichia coli: Its interaction with DNA and with DNA polymerases. Proc. Natl. Acad. Sci. USA 1972, 69, 3537–3541. [Google Scholar] [CrossRef] [PubMed]
  2. Molineux, I.J.; Gefter, M.L. Properties of the Escherichia coli DNA-binding (unwinding) protein interaction with nucleolytic enzymes and DNA. J. Mol. Biol. 1975, 98, 811–825. [Google Scholar] [CrossRef]
  3. Weiner, J.H.; Bertsch, L.L.; Kornberg, A. The deoxyribonucleic acid unwinding protein of Escherichia coli. Properties and functions in replication. J. Biol. Chem. 1975, 250, 1972–1980. [Google Scholar] [CrossRef]
  4. Meyer, R.R.; Laine, P.S. The single-stranded DNA-binding protein of Escherichia coli. Microbiol. Rev. 1990, 54, 342–380. [Google Scholar] [CrossRef] [PubMed]
  5. Lohman, T.M.; Ferrari, M.E. Escherichia coli single-stranded DNA-binding protein: Multiple DNA-binding modes and cooperativities. Annu. Rev. Biochem. 1994, 63, 527–570. [Google Scholar] [CrossRef]
  6. Zou, Y.; Liu, Y.; Wu, X.; Shell, S.M. Functions of human replication protein A (RPA): From DNA replication to DNA damage and stress responses. J. Cell. Physiol. 2006, 208, 267–273. [Google Scholar] [CrossRef]
  7. Mackay, V.; Linn, S. Selective inhibition of the dnase activity of the recBC enzyme by the DNA binding protein from Escherichia coli. J. Biol. Chem. 1976, 251, 3716–3719. [Google Scholar] [CrossRef]
  8. Meyer, R.R.; Glassberg, J.; Scott, J.V.; Kornberg, A. A temperature-sensitive single-stranded DNA-binding protein from Escherichia coli. J. Biol. Chem. 1980, 255, 2897–2929. [Google Scholar] [CrossRef]
  9. Kowalczykowski, S.C.; Dixon, D.A.; Eggleston, A.K.; Lauder, S.D.; Rehrauer, W.M. Biochemistry of homologous recombination in Escherichia coli. Microbiol. Rev. 1994, 58, 401–465. [Google Scholar] [CrossRef]
  10. Myler, L.R.; Gallardo, I.F.; Zhou, Y.; Gong, F.; Yang, S.H.; Wold, M.S.; Miller, K.M.; Paull, T.T.; Finkelstein, I.J. Single-molecule imaging reveals the mechanism of Exo1 regulation by single-stranded DNA binding proteins. Proc. Natl. Acad. Sci. USA 2016, 113, E1170–E1179. [Google Scholar] [CrossRef] [Green Version]
  11. Shereda, R.D.; Kozlov, A.G.; Lohman, T.M.; Cox, M.M.; Keck, J.L. SSB as an organizer/mobilizer of genome maintenance complexes. Crit. Rev. Biochem. Mol. Biol. 2008, 43, 289–318. [Google Scholar] [CrossRef]
  12. von Hippel, P.H.; Delagoutte, E. A general model for nucleic acid helicases and their “coupling” within macromolecular machines. Cell 2001, 104, 177–190. [Google Scholar] [CrossRef]
  13. Williams, K.R.; Spicer, E.K.; LoPresti, M.B.; Guggenheimer, R.A.; Chase, J.W. Limited proteolysis studies on the Escherichia coli single-stranded DNA binding protein. Evidence for a functionally homologous domain in both the Escherichia coli and T4 DNA binding proteins. J. Biol. Chem. 1983, 258, 3346–3355. [Google Scholar] [CrossRef]
  14. Raghunathan, S.; Kozlov, A.G.; Lohman, T.M.; Waksman, G. Structure of the DNA binding domain of E. coli SSB bound to ssDNA. Nat. Struct. Biol. 2000, 7, 648–652. [Google Scholar] [CrossRef] [PubMed]
  15. Costes, A.; Lecointe, F.; McGovern, S.; Quevillon-Cheruel, S.; Polard, P. The C-terminal domain of the bacterial SSB protein acts as a DNA maintenance hub at active chromosome replication forks. PLoS Genet. 2010, 6, e1001238. [Google Scholar] [CrossRef]
  16. BioCyc. Available online: https://biocyc.org/gene?orgid=ECOLI&id=EG10976 (accessed on 19 June 2022).
  17. Brandsma, J.A.; Bosch, D.; de Ruÿter, M.; van de Putte, P. Analysis of the regulatory region of the ssb gene of Escherichia coli. Nucleic Acids Res. 1985, 13, 5095–5109. [Google Scholar] [CrossRef]
  18. Friedberg, E.C.; Walker, G.C.; Siede, W.; Wood, R.D.; Schultz, R.A.; Ellenberger, T. DNA Repair and Mutagenesis, 2nd ed.; ASM Press: Washington, DC, USA, 2006. [Google Scholar]
  19. Fernández De Henestrosa, A.R.; Ogi, T.; Aoyagi, S.; Chafin, D.; Hayes, J.J.; Ohmori, H.; Woodgate, R. Identification of additional genes belonging to the LexA regulon in Escherichia coli. Mol. Microbiol. 2000, 35, 1560–1572. [Google Scholar] [CrossRef]
  20. Whittier, R.F.; Chase, J.W. DNA repair in E. coli strains deficient in single-strand DNA binding protein. Mol. Gen. Genet. 1981, 183, 341–347. [Google Scholar] [CrossRef]
  21. Salles, B.; Paoletti, C.; Villani, G. Lack of single-strand DNA-binding protein amplification under conditions of SOS induction in E. coli. Mol. Gen. Genet. 1983, 189, 175–177. [Google Scholar] [CrossRef]
  22. Villani, G.; Pierre, A.; Salles, B. Quantification of SSB protein in E. coli and its variation during RECA protein induction. Biochimie 1984, 66, 471–476. [Google Scholar] [CrossRef]
  23. Perrino, F.W.; Rein, D.C.; Bobst, A.M.; Meyer, R.R. The relative rate of synthesis and levels of single-stranded DNA binding protein during induction of SOS repair in Escherichia coli. Mol. Gen. Genet. 1987, 209, 612–614. [Google Scholar] [CrossRef]
  24. Moreau, P.L. Effects of overproduction of single-stranded DNA-binding protein on RecA protein-dependent processes in Escherichia coli. J. Mol. Biol. 1987, 194, 621–634. [Google Scholar] [CrossRef]
  25. Alazard, R.J. Study of the expression of UvrA and SSB proteins in vivo in lambda hybrid phages containing the uvrA and ssbA genes of Escherichia coli. Mutat. Res./Fundam. Mol. Mech. Mutagenesis 1983, 109, 155–168. [Google Scholar] [CrossRef]
  26. Brandsma, J.A.; Bosch, D.; Backendorf, C.; van de Putte, P. A common regulatory region shared by divergently transcribed genes of the Escherichia coli SOS system. Nature 1983, 305, 243–245. [Google Scholar] [CrossRef] [PubMed]
  27. Bertrand-Burggraf, E.; Oertel, P.; Schnarr, M.; Daune, M.; Granger-Schnarr, M. Effect of induction of SOS response on expression of pBR322 genes and on plasmid copy number. Plasmid 1989, 22, 163–168. [Google Scholar] [CrossRef]
  28. Khodursky, A.B.; Peter, B.J.; Schmid, M.B.; DeRisi, J.; Botstein, D.; Brown, P.O.; Cozzarelli, N.R. Analysis of topoisomerase function in bacterial replication fork movement: Use of DNA microarrays. Proc. Natl. Acad. Sci. USA 2000, 97, 9419–9424. [Google Scholar] [CrossRef]
  29. Khil, P.P.; Camerini-Otero, R.D. Over 1000 genes are involved in the DNA damage response of Escherichia coli. Mol. Microbiol. 2002, 44, 89–105. [Google Scholar] [CrossRef]
  30. Courcelle, J.; Khodursky, A.; Peter, B.; Brown, P.O.; Hanawalt, P.C. Comparative gene expression profiles following UV exposure in wild-type and SOS-deficient Escherichia coli. Genetics 2001, 158, 41–64. [Google Scholar] [CrossRef]
  31. Quillardet, P.; Rouffaud, M.A.; Bouige, P. DNA array analysis of gene expression in response to UV irradiation in Escherichia coli. Res. Microbiol. 2003, 154, 559–572. [Google Scholar] [CrossRef]
  32. Peterson, K.R.; Mount, D.W. Differential repression of SOS genes by unstable LexA41 (Tsl-1) protein causes a “split phenotype” in Escherichia coli K-12. J. Mol. Biol. 1987, 193, 27–40. [Google Scholar] [CrossRef]
  33. Feliciello, I.; Zahradka, D.; Zahradka, K.; Ivanković, S.; Puc, N.; Đermić, D. RecF, UvrD, RecX and RecN proteins suppress DNA degradation at DNA double-strand breaks in Escherichia coli. Biochimie 2018, 148, 116–126. [Google Scholar] [CrossRef] [PubMed]
  34. BioCyc. Available online: https://biocyc.org/gene?orgid=ECOLI&id=PD03831 (accessed on 19 June 2022).
  35. Quiñones, A.; Jüterbock, W.R.; Messer, W. Expression of the dnaA gene of Escherichia coli is inducible by DNA damage. Mol. Gen. Genet. 1991, 227, 9–16. [Google Scholar] [CrossRef] [PubMed]
  36. Bobst, E.V.; Bobst, A.M.; Perrino, F.W.; Meyer, R.R.; Rein, D.C. Variability in the nucleic acid binding site size and the amount of single-stranded DNA-binding protein in Escherichia coli. FEBS Lett. 1985, 181, 133–137. [Google Scholar] [CrossRef]
  37. Salles, B.; Defais, M. Signal of induction of recA protein in E. coli. Mutat. Res./DNA Repair Rep. 1984, 131, 53–59. [Google Scholar] [CrossRef]
  38. Sassanfar, M.; Roberts, J.W. Nature of the SOS-inducing signal in Escherichia coli. The involvement of DNA replication. J. Mol. Biol. 1990, 212, 79–96. [Google Scholar] [CrossRef]
  39. Chaudhury, A.M.; Smith, G.R. Role of Escherichia coli RecBC enzyme in SOS induction. Mol. Gen. Genet. 1985, 201, 525–528. [Google Scholar] [CrossRef]
  40. Pennington, J.M.; Rosenberg, S.M. Spontaneous DNA breakage in single living Escherichia coli cells. Nat. Genet. 2007, 39, 797–802, Erratum in Nat. Genet. 2007, 39, 1174. [Google Scholar] [CrossRef]
  41. Wurihan; Gezi; Brambilla, E.; Wang, S.; Sun, H.; Fan, L.; Shi, Y.; Sclavi, B.; Morigen. DnaA and LexA Proteins Regulate Transcription of the uvrB Gene in Escherichia coli: The Role of DnaA in the Control of the SOS Regulon. Front. Microbiol. 2018, 9, 1212. [Google Scholar] [CrossRef]
  42. Schmidt, A.; Kochanowski, K.; Vedelaar, S.; Ahrne, E.; Volkmer, B.; Callipo, L.; Heinemann, M. The quantitative and condition-dependent Escherichia coli proteome. Nat. Biotechnol. 2016, 34, 104–110. [Google Scholar] [CrossRef]
  43. Zhao, T.; Liu, Y.; Wang, Z.; He, R.; Xiang Zhang, J.; Xu, F.; Lei, M.; Deci, M.B.; Nguyen, J.; Bianco, P.R. Super-resolution imaging reveals changes in Escherichia coli SSB localization in response to DNA damage. Genes Cells 2019, 24, 814–826. [Google Scholar] [CrossRef]
  44. Bachmann, B.J. Pedigrees of some mutant strains of Escherichia coli K-12. Bacteriol. Rev. 1972, 36, 525–557. [Google Scholar] [CrossRef] [PubMed]
  45. Miller, J.H. A Short Course in Bacterial Genetics; Cold Spring Harbor Laboratory Press: Cold Spring Harbor, NY, USA, 1992. [Google Scholar]
  46. Ruijter, J.M.; Ramakers, C.; Hoogaars, W.M.; Karlen, Y.; Bakker, O.; van den Hoff, M.J.; Moorman, A.F. Amplification efficiency: Linking baseline and bias in the analysis of quantitative PCR data. Nucleic Acids Res. 2009, 37, e45. [Google Scholar] [CrossRef] [PubMed]
  47. Ruijter, J.M.; Pfaffl, M.W.; Zhao, S.; Spiess, A.N.; Boggy, G.; Blom, J.; Rutledge, R.G.; Sisti, D.; Lievens, A.; De Preter, K.; et al. Evaluation of qPCR curve analysis methods for reliable biomarker discovery: Bias, resolution, precision and implications. Methods 2013, 59, 32–46. [Google Scholar] [CrossRef] [PubMed]
Figure 1. Location of LexA repressor binding sequence, (SOS) box, in relation to ssb and uvrA genes. ArcA is a sequence and onto ArcA a dual transcriptional regulator binds, which inhibits transcription during anaerobic conditions.
Ijms 23 10917 g001
Figure 2. Expression of the ssb and the sulA gene in wild-type E. coli γ-irradiated with 400 Gy and incubated at 37 °C. Bacteria were irradiated when their exponential growth in LB medium reached OD600~0.4. Bars represent expression in irradiated bacteria (except at time 0), and dots and lines in unirradiated bacteria. No represents normalized average No value for the two genes. Each value is a mean of the three independent qRT-PCR experiments, with error bars representing standard deviation.
Ijms 23 10917 g002
Figure 3. Expression of the ssb and the sulA gene in E. coli UV-irradiated with 40 Jm−2 and incubated at 37 °C. Bacteria were irradiated when their exponential growth in LB medium reached OD600~0.4. Data are shown for wild-type bacteria (bars) and lexA3 (Ind, SOS) (dots and lines) mutants. Bars and dots at time 0 represent unirradiated control. No represents normalized average No value for the two genes. Each value is a mean of the three independent qRT-PCR experiments, with error bars representing standard deviation.
Ijms 23 10917 g003
Figure 4. Absolute quantification of the GAPDH and dnaA genes’ transcripts during growth of wild-type and lexA3 (SOS) mutant bacteria in LB medium at 37 °C. Measurements were taken at mid-exponential growth phase (OD600~0.4) and early stationary growth phase (OD600~1.1). Three independent ddPCR experiments at three different concentrations gave the same relative results. Error bars represent Poisson confidence interval at a 95% level.
Ijms 23 10917 g004
Figure 5. Absolute quantification of the ssb, uvrA, and sulA genes’ transcripts during growth of wild-type and lexA3 (SOS) mutant bacteria in LB medium at 37 °C. Measurements were taken at mid-exponential growth phase (OD600~0.4) and early stationary growth phase (OD600~1.1). Three independent ddPCR experiments at three different concentrations gave the same relative results (the presented results are with 24 ng cDNA/sample). Error bars represent Poisson confidence interval at a 95% level.
Ijms 23 10917 g005
Publisher’s Note: MDPI stays neutral with regard to jurisdictional claims in published maps and institutional affiliations.

