
Deep Learning of Phase-Contrast Images of Cancer Stem Cells Using a Selected Dataset of High Accuracy Value Using Conditional Generative Adversarial Networks

 , , and
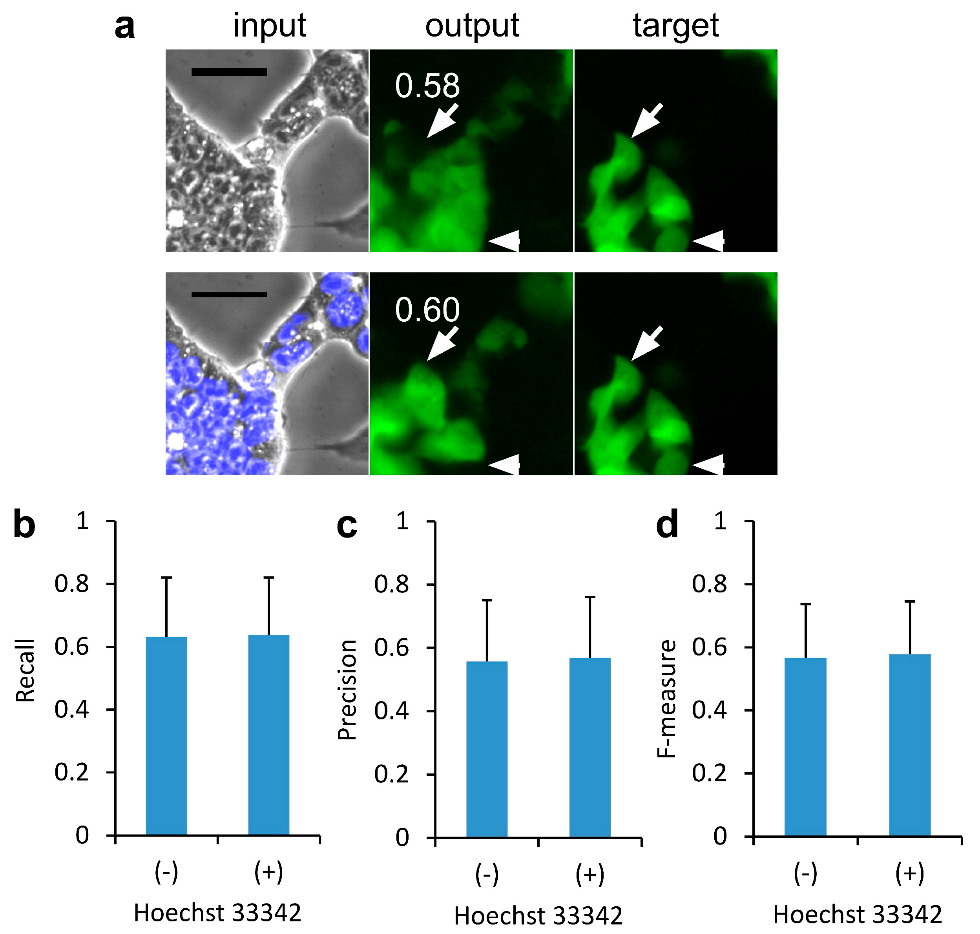
Abstract
1. Introduction
2. Results
2.1. Effect of Nucleus Images on the Deep Learning of CSC Images for Image-to-Image Translation
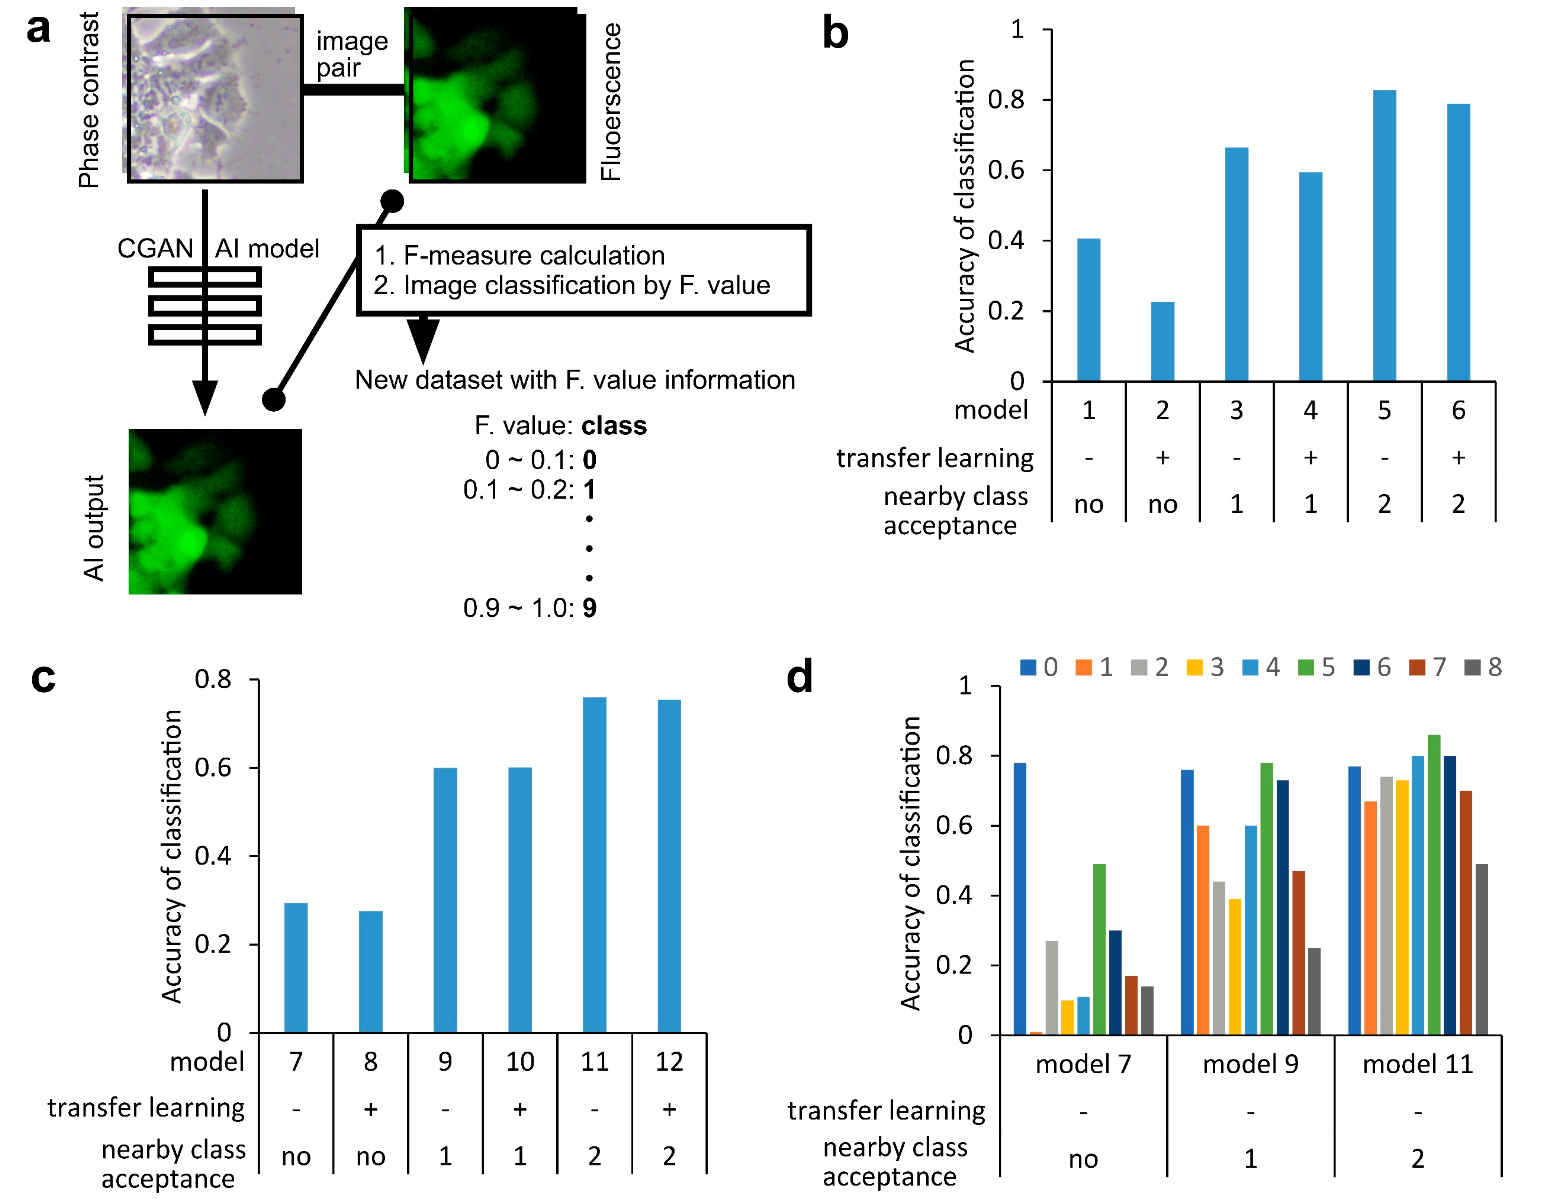
2.2. Labeling of the Phase-Contrast Image of CSCs with F-Measure Values
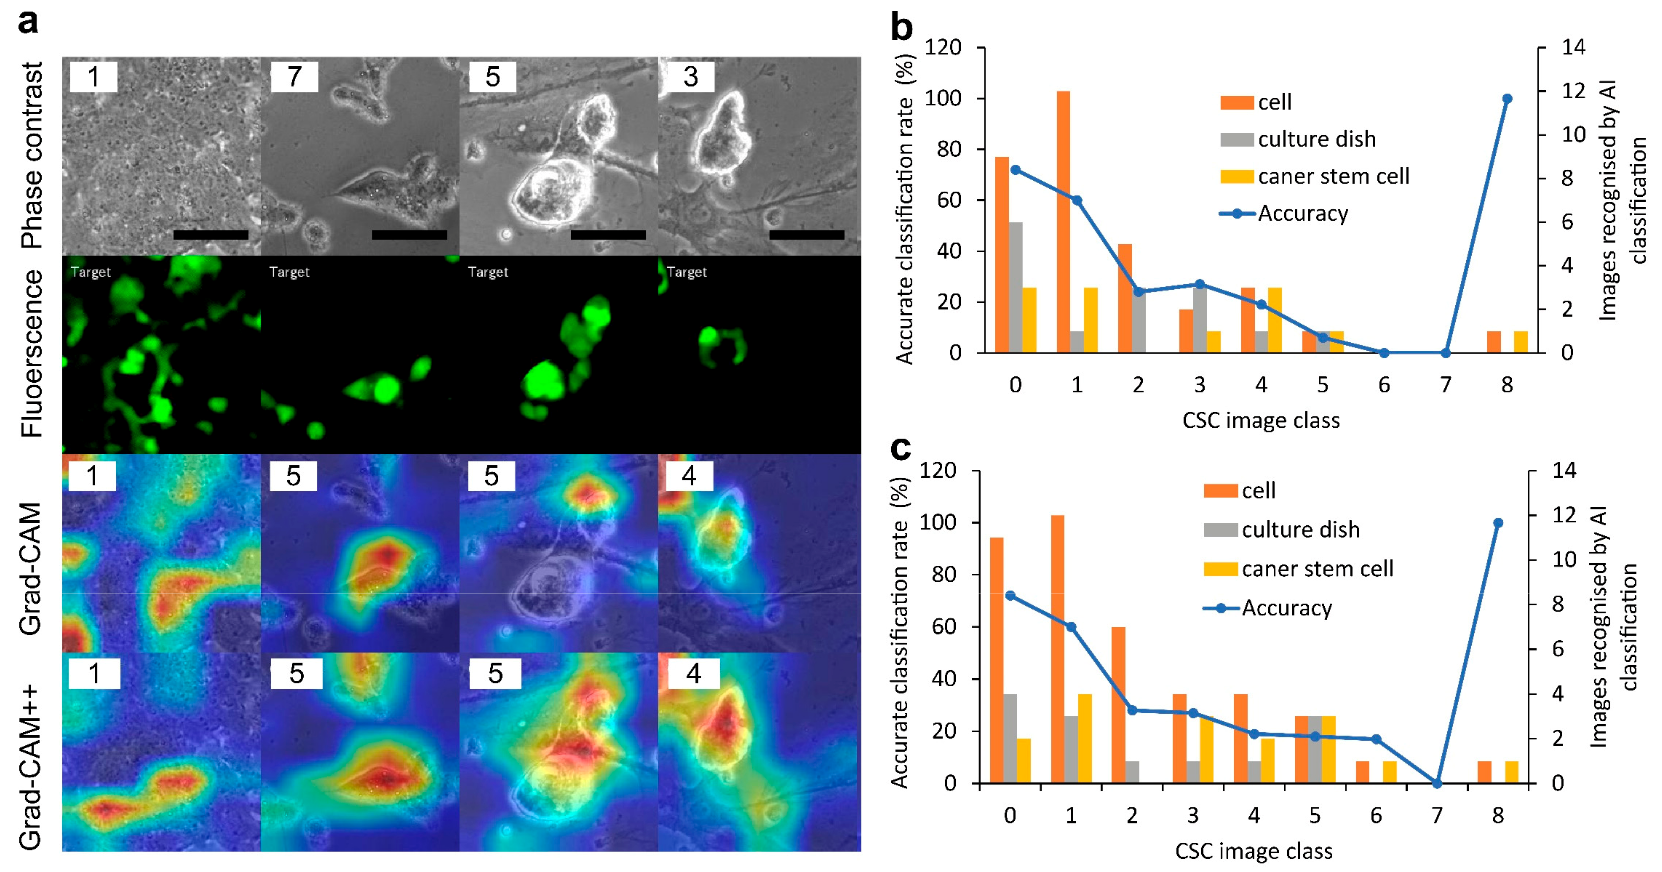
2.3. Deep Learning of Phase-Contrast Images for the Classification of CSC Images Labeled with F-Measure Values
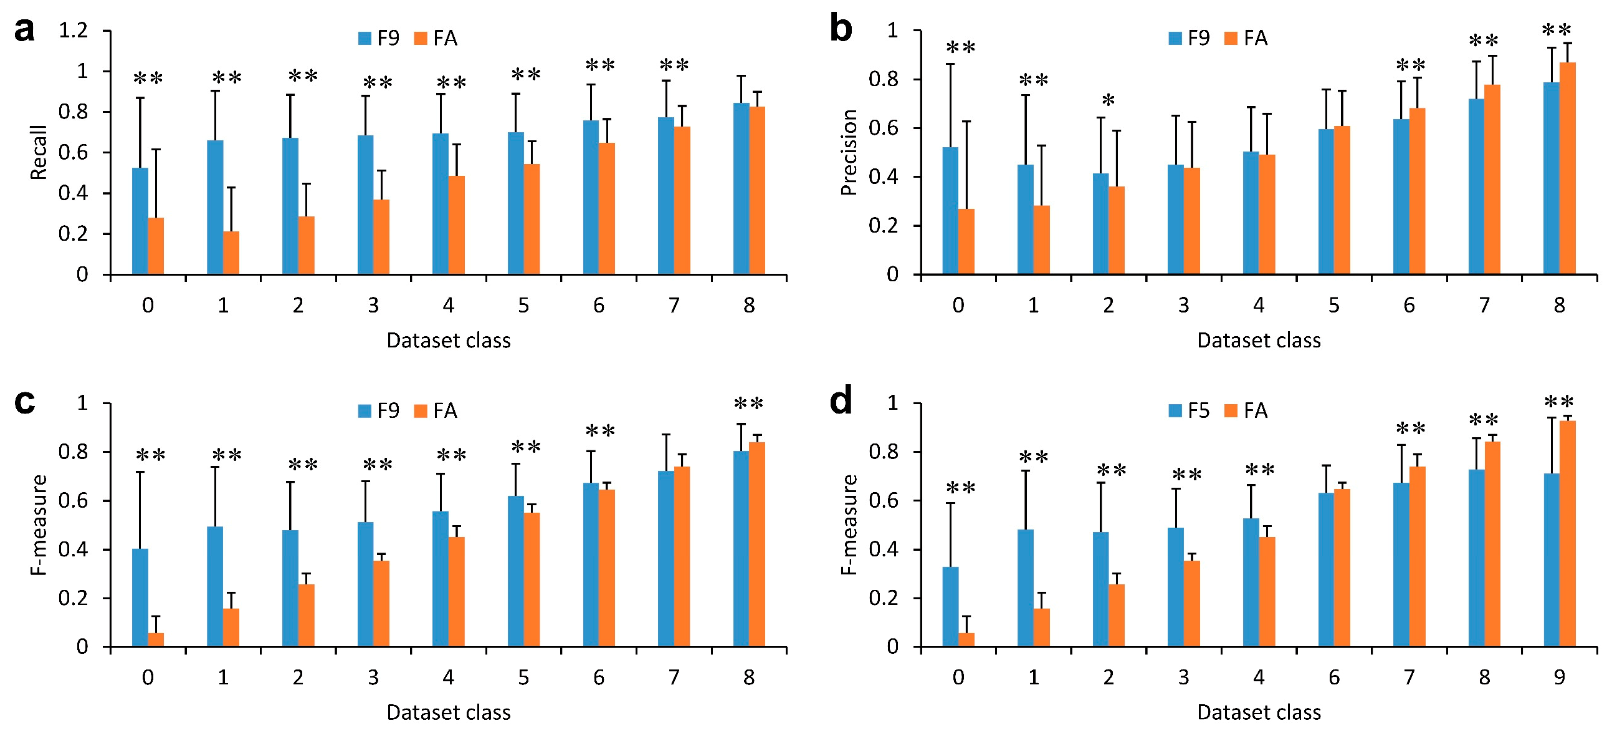
2.4. Effect of Training Pairs of GFP and Phase-Contrast Images with High F-Measure Values on Constructing an AI Model of Image-to-Image Translation
3. Discussion
4. Materials and Methods
4.1. Cell Culture
4.2. Microscopy
4.3. Image Processing and AI
4.4. Statistical Analysis
5. Conclusions
Supplementary Materials
Author Contributions
Funding
Institutional Review Board Statement
Informed Consent Statement
Data Availability Statement
Conflicts of Interest
References
- Batlle, E.; Clevers, H. Cancer stem cells revisited. Nat. Med. 2017, 23, 1124–1134. [Google Scholar] [CrossRef] [PubMed]
- Sessions, D.T.; Kashatus, D.F. Mitochondrial dynamics in cancer stem cells. Cell. Mol. Life Sci. 2021, 78, 3803–3816. [Google Scholar] [CrossRef] [PubMed]
- Tsuchiya, H.; Shiota, G. Immune evasion by cancer stem cells. Regen. Ther. 2021, 17, 20–33. [Google Scholar] [CrossRef] [PubMed]
- Marzagalli, M.; Fontana, F.; Raimondi, M.; Limonta, P. Cancer Stem Cells—Key Players in Tumor Relapse. Cancers 2021, 13, 376. [Google Scholar] [PubMed]
- Lathia, J.; Liu, H.; Matei, D. The Clinical Impact of Cancer Stem Cells. Oncologist 2019, 25, 123–131. [Google Scholar] [CrossRef] [PubMed]
- Okita, K.; Ichisaka, T.; Yamanaka, S. Generation of germline-competent induced pluripotent stem cells. Nature 2007, 448, 313–317. [Google Scholar] [CrossRef] [PubMed]
- Chen, L.; Kasai, T.; Li, Y.; Sugii, Y.; Jin, G.; Okada, M.; Vaidyanath, A.; Mizutani, A.; Satoh, A.; Kudoh, T.; et al. A model of cancer stem cells derived from mouse induced pluripotent stem cells. PLoS ONE 2012, 7, e33544. [Google Scholar] [CrossRef]
- Zhang, Y.M.; Liu, Y.Q.; Liu, D.; Zhang, L.; Qin, J.; Zhang, Z.; Su, Y.; Yan, C.; Luo, Y.L.; Li, J.; et al. The Effects of Astragalus Polysaccharide on Bone Marrow-Derived Mesenchymal Stem Cell Proliferation and Morphology Induced by A549 Lung Cancer Cells. Med. Sci. Monit. Int. Med. J. Exp. Clin. Res. 2019, 25, 4110–4121. [Google Scholar] [CrossRef] [PubMed]
- Hirose, T.; Kotoku, J.i.; Toki, F.; Nishimura, E.K.; Nanba, D. Label-Free Quality Control and Identification of Human Keratinocyte Stem Cells by Deep Learning-Based Automated Cell Tracking. Stem Cells 2021, 39, 1091–1100. [Google Scholar] [CrossRef] [PubMed]
- Piotrowski, T.; Rippel, O.; Elanzew, A.; Niessing, B.; Stucken, S.; Jung, S.; Konig, N.; Haupt, S.; Stappert, L.; Brustle, O.; et al. Deep-learning-based multi-class segmentation for automated, non-invasive routine assessment of human pluripotent stem cell culture status. Comput. Biol. Med. 2021, 129, 104172. [Google Scholar] [CrossRef] [PubMed]
- Park, K.; Lee, J.Y.; Lee, S.Y.; Jeong, I.; Park, S.-Y.; Kim, J.W.; Nam, S.A.; Kim, H.W.; Kim, Y.K.; Lee, S. Deep learning predicts the differentiation of kidney organoids derived from human induced pluripotent stem cells. Kidney Res. Clin. Pract. 2023, 42, 75–85. [Google Scholar] [CrossRef] [PubMed]
- Zhu, Y.; Huang, R.; Wu, Z.; Song, S.; Cheng, L.; Zhu, R. Deep learning-based predictive identification of neural stem cell differentiation. Nat. Commun. 2021, 12, 2614. [Google Scholar] [CrossRef] [PubMed]
- Isola, P.; Zhu, J.; Zhou, T.; Efros, A.A. Image-to-Image Translation with Conditional Adversarial Networks. In Proceedings of the 2017 IEEE Conference on Computer Vision and Pattern Recognition (CVPR), Honolulu, HI, USA, 21–26 July 2017; pp. 5967–5976. [Google Scholar]
- Hanai, Y.; Ishihata, H.; Zhang, Z.; Maruyama, R.; Kasai, T.; Kameda, H.; Sugiyama, T. Temporal and Locational Values of Images Affecting the Deep Learning of Cancer Stem Cell Morphology. Biomedicines 2022, 10, 941. [Google Scholar] [CrossRef] [PubMed]
- Aida, S.; Okugawa, J.; Fujisaka, S.; Kasai, T.; Kameda, H.; Sugiyama, T. Deep Learning of Cancer Stem Cell Morphology Using Conditional Generative Adversarial Networks. Biomolecules 2020, 10, 931. [Google Scholar] [CrossRef] [PubMed]
- De, K.; Pedersen, M. Impact of Colour on Robustness of Deep Neural Networks. In Proceedings of the 2021 IEEE/CVF International Conference on Computer Vision Workshops (ICCVW), Montreal, BC, Canada, 11–17 October 2021; pp. 21–30. [Google Scholar]
- Reddy, K.S.; Singh, U.; Uttam, P.K. Effect of image colourspace on performance of convolution neural networks. In Proceedings of the 2017 2nd IEEE International Conference on Recent Trends in Electronics, Information & Communication Technology (RTEICT), Bangalore, India, 19–20 May 2017; pp. 2001–2005. [Google Scholar]
- Kusumoto, D.; Yuasa, S. The application of convolutional neural network to stem cell biology. Inflamm. Regen. 2019, 39, 14. [Google Scholar] [CrossRef] [PubMed]
- Liu, Z.; Jin, L.; Chen, J.; Fang, Q.; Ablameyko, S.; Yin, Z.; Xu, Y. A survey on applications of deep learning in microscopy image analysis. Comput. Biol. Med. 2021, 134, 104523. [Google Scholar] [CrossRef] [PubMed]
- Alamir, M.; Alghamdi, M. The Role of Generative Adversarial Network in Medical Image Analysis: An In-Depth Survey. ACM Comput. Surv. 2022, 55, 96. [Google Scholar] [CrossRef]
- Ronneberger, O.; Fischer, P.; Brox, T. U-Net: Convolutional Networks for Biomedical Image Segmentation; Springer International Publishing: Cham, Switzerland, 2015; pp. 234–241. [Google Scholar]
- Sadanandan, S.K.; Karlsson, J.; Wählby, C. Spheroid Segmentation Using Multiscale Deep Adversarial Networks. In Proceedings of the 2017 IEEE International Conference on Computer Vision Workshops (ICCVW), Venice, Italy, 22–29 October 2017; pp. 36–41. [Google Scholar]
- Simonyan, K.; Zisserman, A. Very Deep Convolutional Networks for Large-Scale Image Recognition. arXiv 2015, arxiv:1409.1556. [Google Scholar]
- He, K.; Zhang, X.; Ren, S.; Sun, J. Deep Residual Learning for Image Recognition. In Proceedings of the 2016 IEEE Conference on Computer Vision and Pattern Recognition (CVPR), Las Vegas, NV, USA, 27–30 June 2016; pp. 770–778. [Google Scholar]
- Selvaraju, R.R.; Cogswell, M.; Das, A.; Vedantam, R.; Parikh, D.; Batra, D. Grad-CAM: Visual Explanations from Deep Networks via Gradient-Based Localization. Int. J. Comput. Vis. 2020, 128, 336–359. [Google Scholar] [CrossRef]
- Chattopadhay, A.; Sarkar, A.; Howlader, P.; Balasubramanian, V.N. Grad-CAM++: Generalized Gradient-Based Visual Explanations for Deep Convolutional Networks. In Proceedings of the 2018 IEEE Winter Conference on Applications of Computer Vision (WACV), Lake Tahoe, NV, USA, 12–15 March 2018; pp. 839–847. [Google Scholar]


Disclaimer/Publisher’s Note: The statements, opinions and data contained in all publications are solely those of the individual author(s) and contributor(s) and not of MDPI and/or the editor(s). MDPI and/or the editor(s) disclaim responsibility for any injury to people or property resulting from any ideas, methods, instructions or products referred to in the content. |
© 2023 by the authors. Licensee MDPI, Basel, Switzerland. This article is an open access article distributed under the terms and conditions of the Creative Commons Attribution (CC BY) license (https://creativecommons.org/licenses/by/4.0/).
Share and Cite
Zhang, Z.; Ishihata, H.; Maruyama, R.; Kasai, T.; Kameda, H.; Sugiyama, T. Deep Learning of Phase-Contrast Images of Cancer Stem Cells Using a Selected Dataset of High Accuracy Value Using Conditional Generative Adversarial Networks. Int. J. Mol. Sci. 2023, 24, 5323. https://doi.org/10.3390/ijms24065323
Zhang Z, Ishihata H, Maruyama R, Kasai T, Kameda H, Sugiyama T. Deep Learning of Phase-Contrast Images of Cancer Stem Cells Using a Selected Dataset of High Accuracy Value Using Conditional Generative Adversarial Networks. International Journal of Molecular Sciences. 2023; 24(6):5323. https://doi.org/10.3390/ijms24065323
Chicago/Turabian StyleZhang, Zaijun, Hiroaki Ishihata, Ryuto Maruyama, Tomonari Kasai, Hiroyuki Kameda, and Tomoyasu Sugiyama. 2023. "Deep Learning of Phase-Contrast Images of Cancer Stem Cells Using a Selected Dataset of High Accuracy Value Using Conditional Generative Adversarial Networks" International Journal of Molecular Sciences 24, no. 6: 5323. https://doi.org/10.3390/ijms24065323
APA StyleZhang, Z., Ishihata, H., Maruyama, R., Kasai, T., Kameda, H., & Sugiyama, T. (2023). Deep Learning of Phase-Contrast Images of Cancer Stem Cells Using a Selected Dataset of High Accuracy Value Using Conditional Generative Adversarial Networks. International Journal of Molecular Sciences, 24(6), 5323. https://doi.org/10.3390/ijms24065323