

A Study on the Interactions of Proteinase K with Myricetin and Myricitrin by Multi-Spectroscopy and Molecular Modeling


Abstract
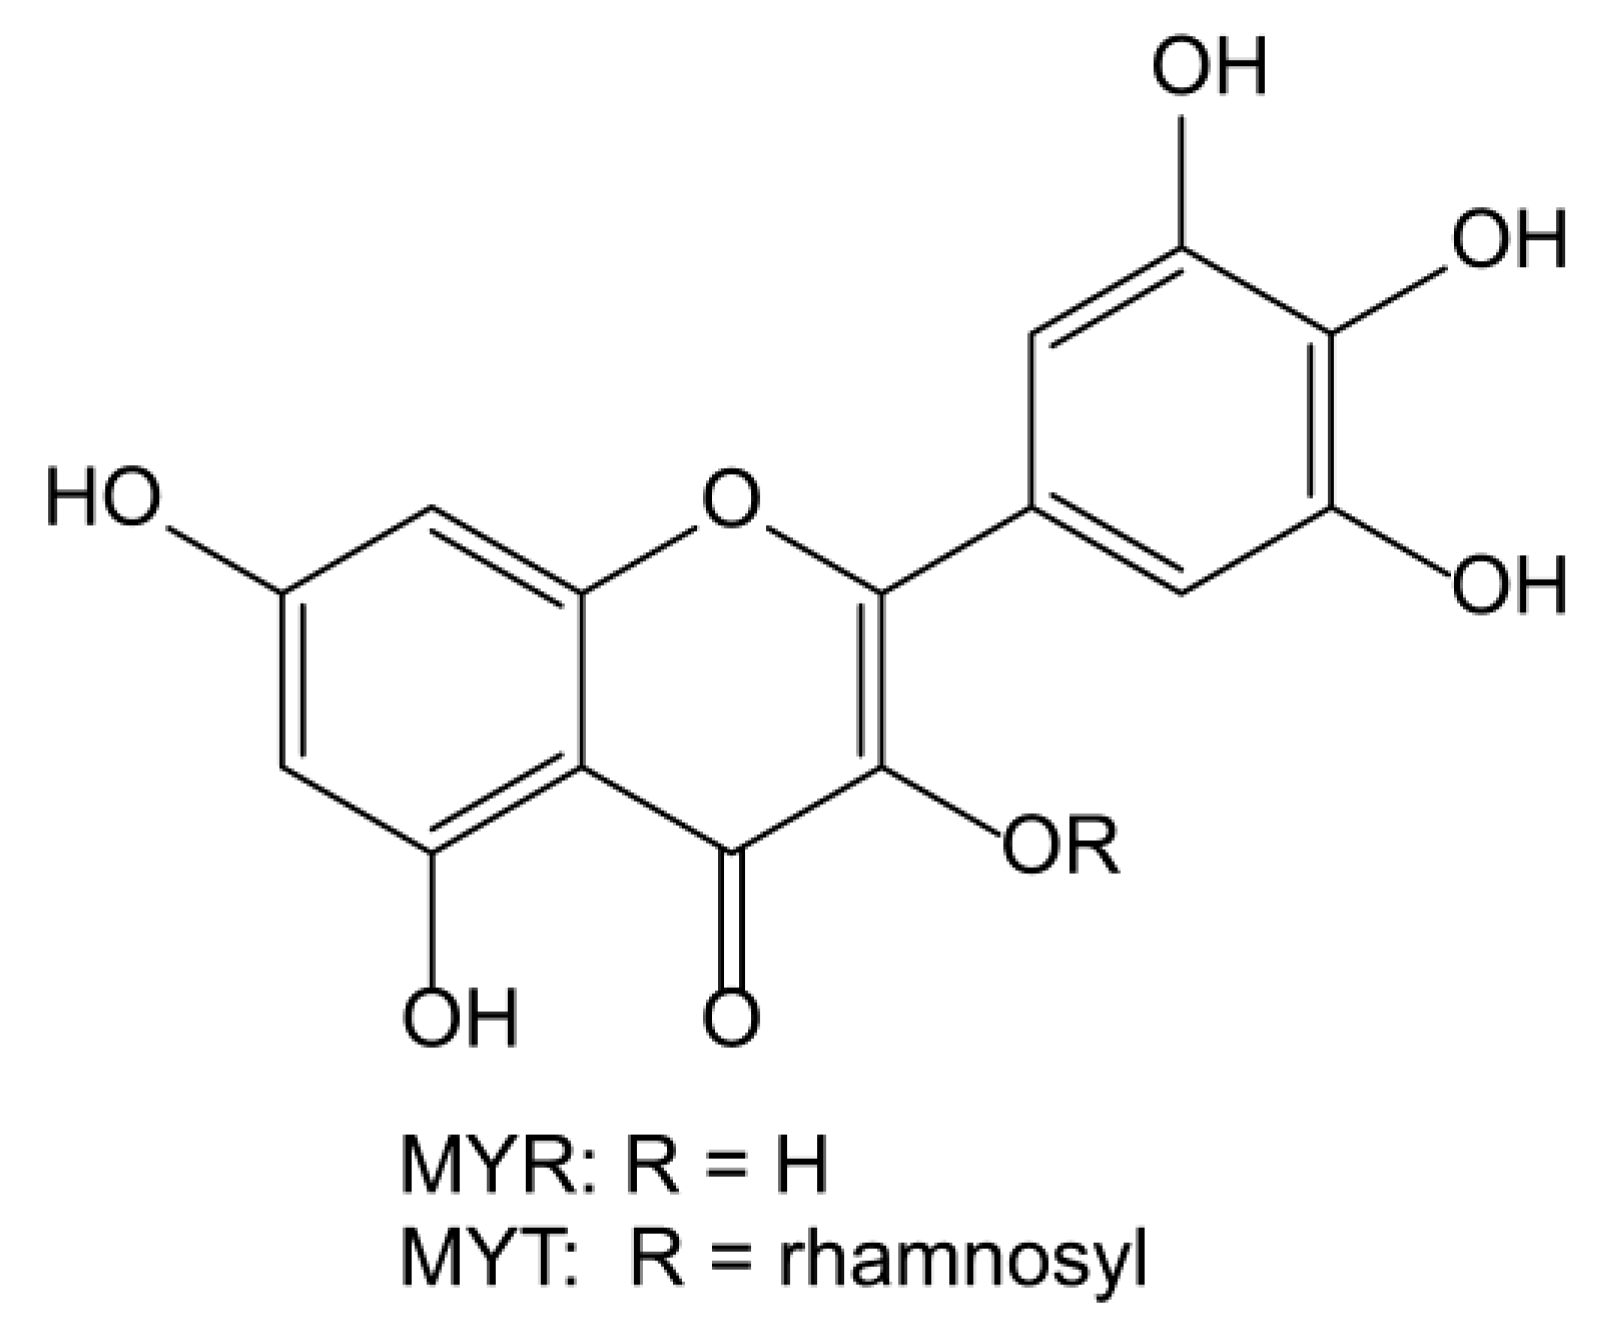
1. Introduction
2. Results and Discussion
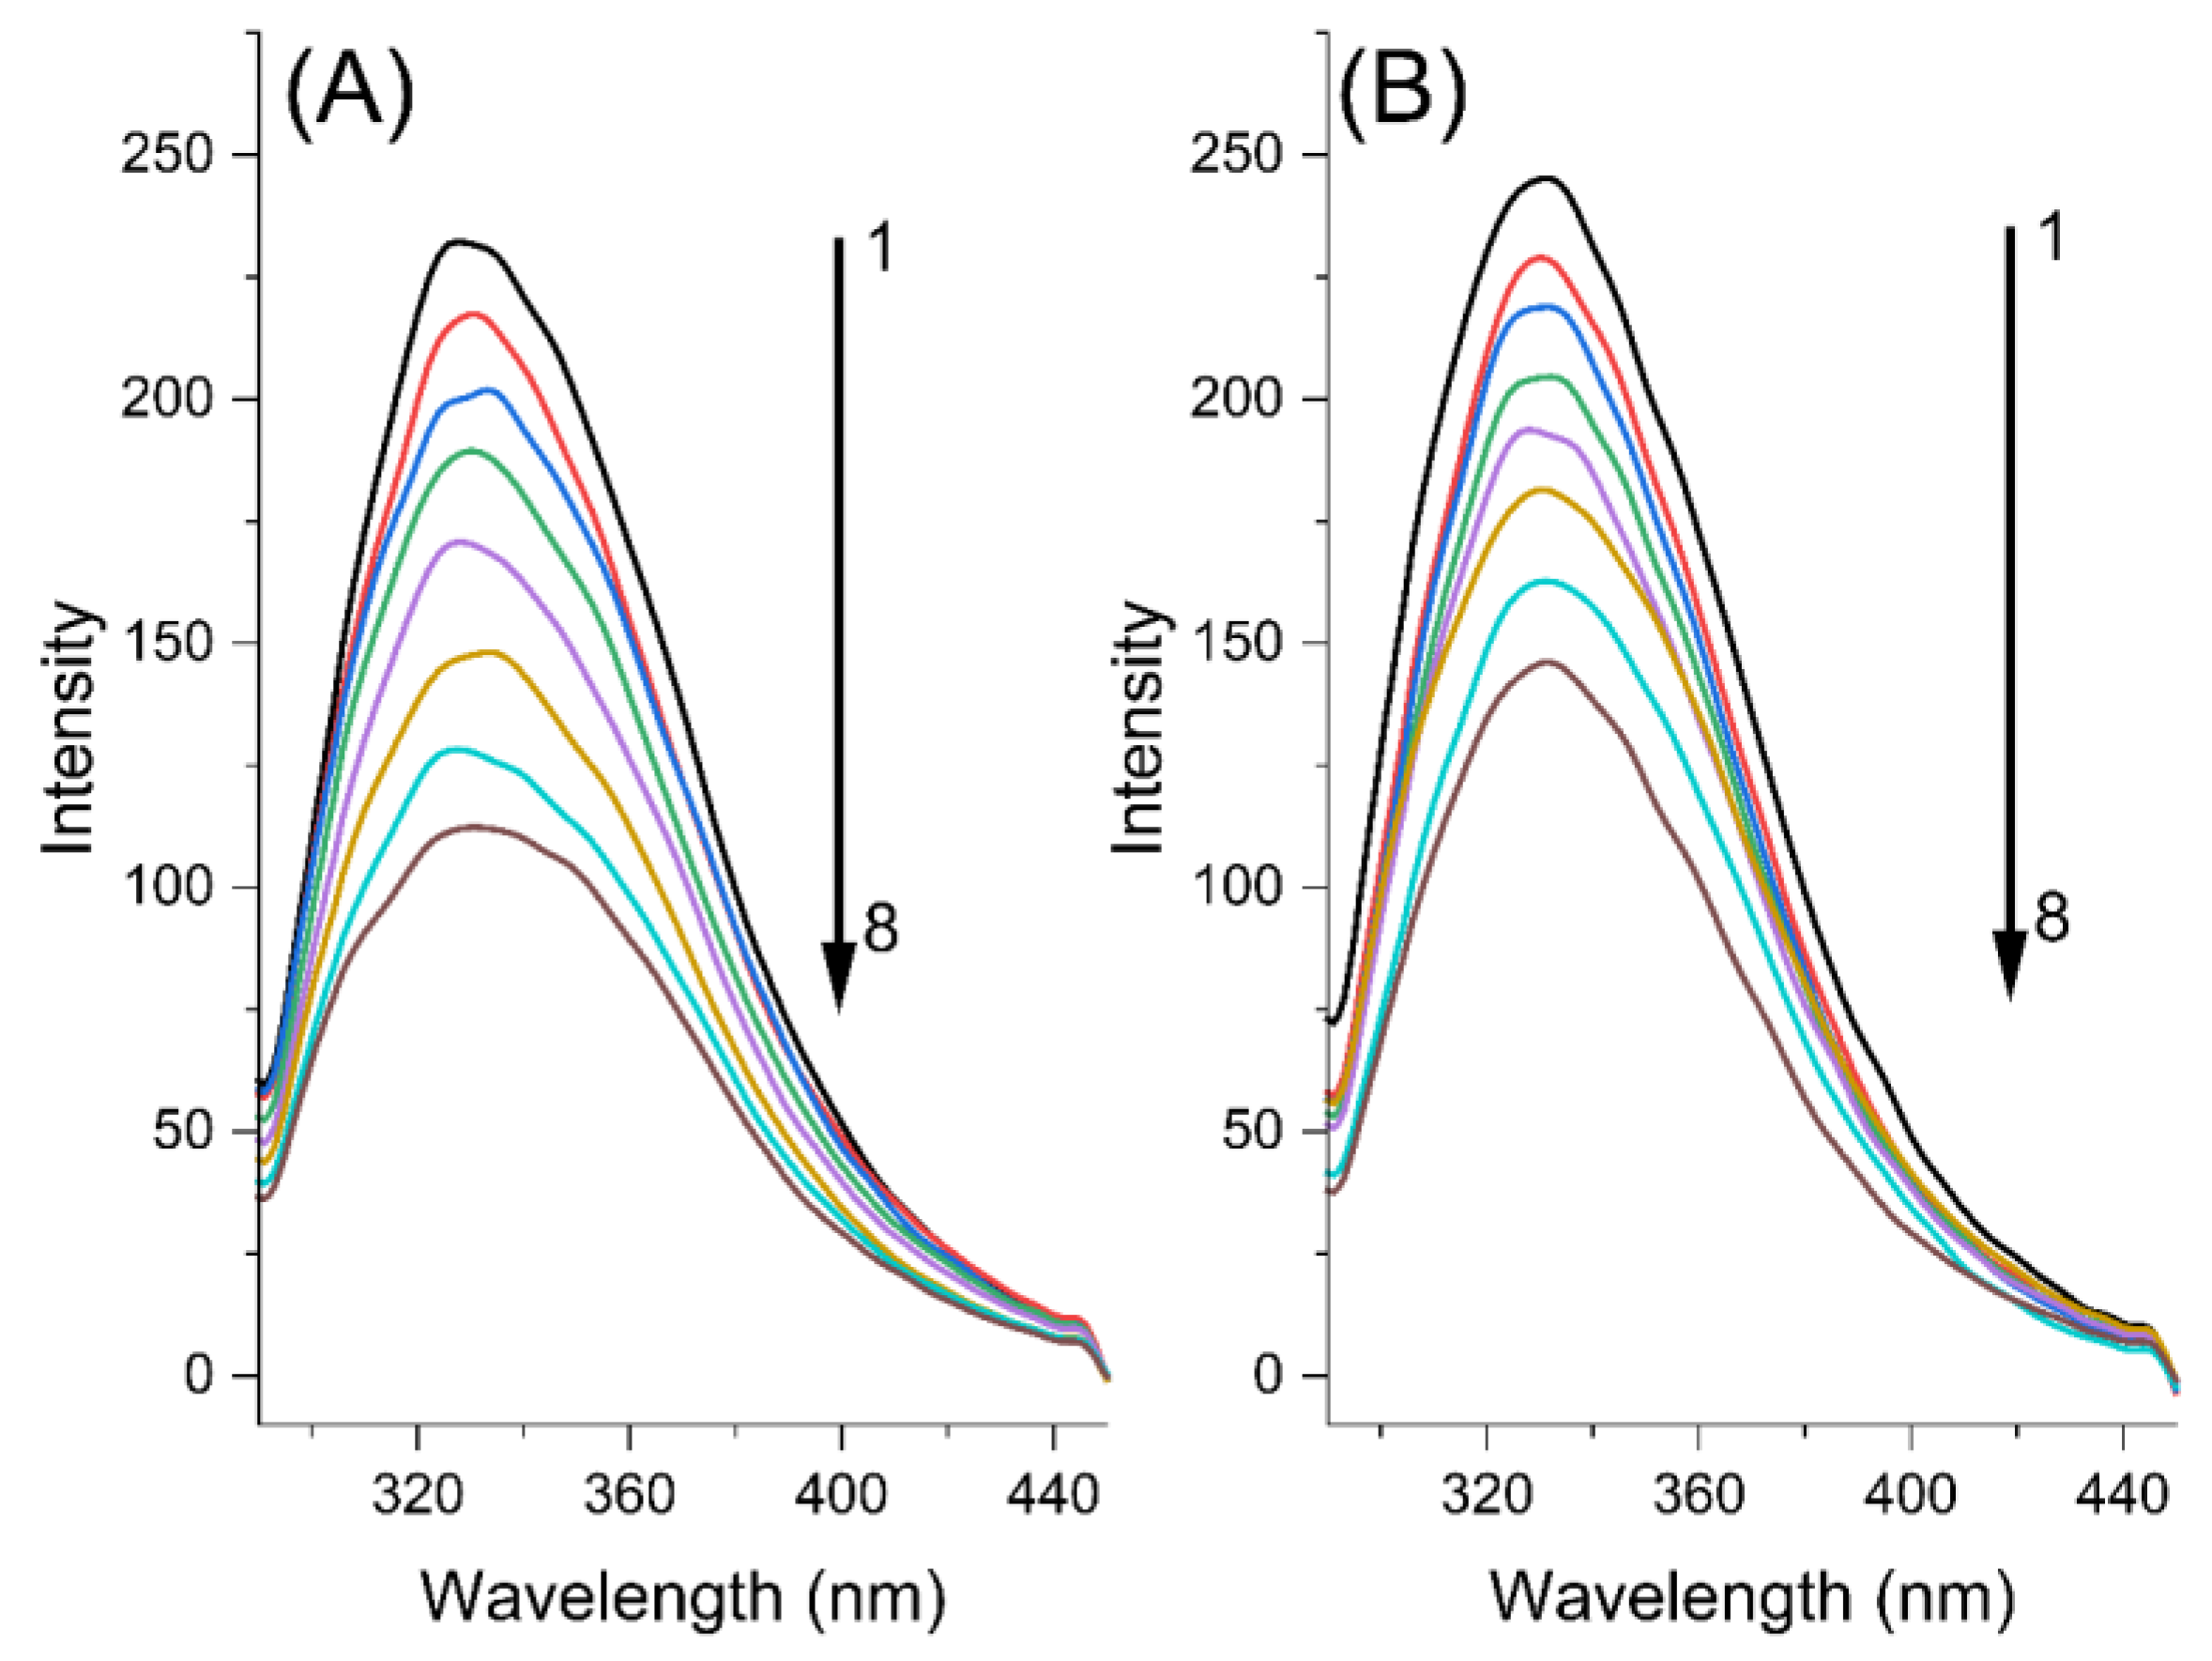
2.1. Fluorescence Quenching Mechanism
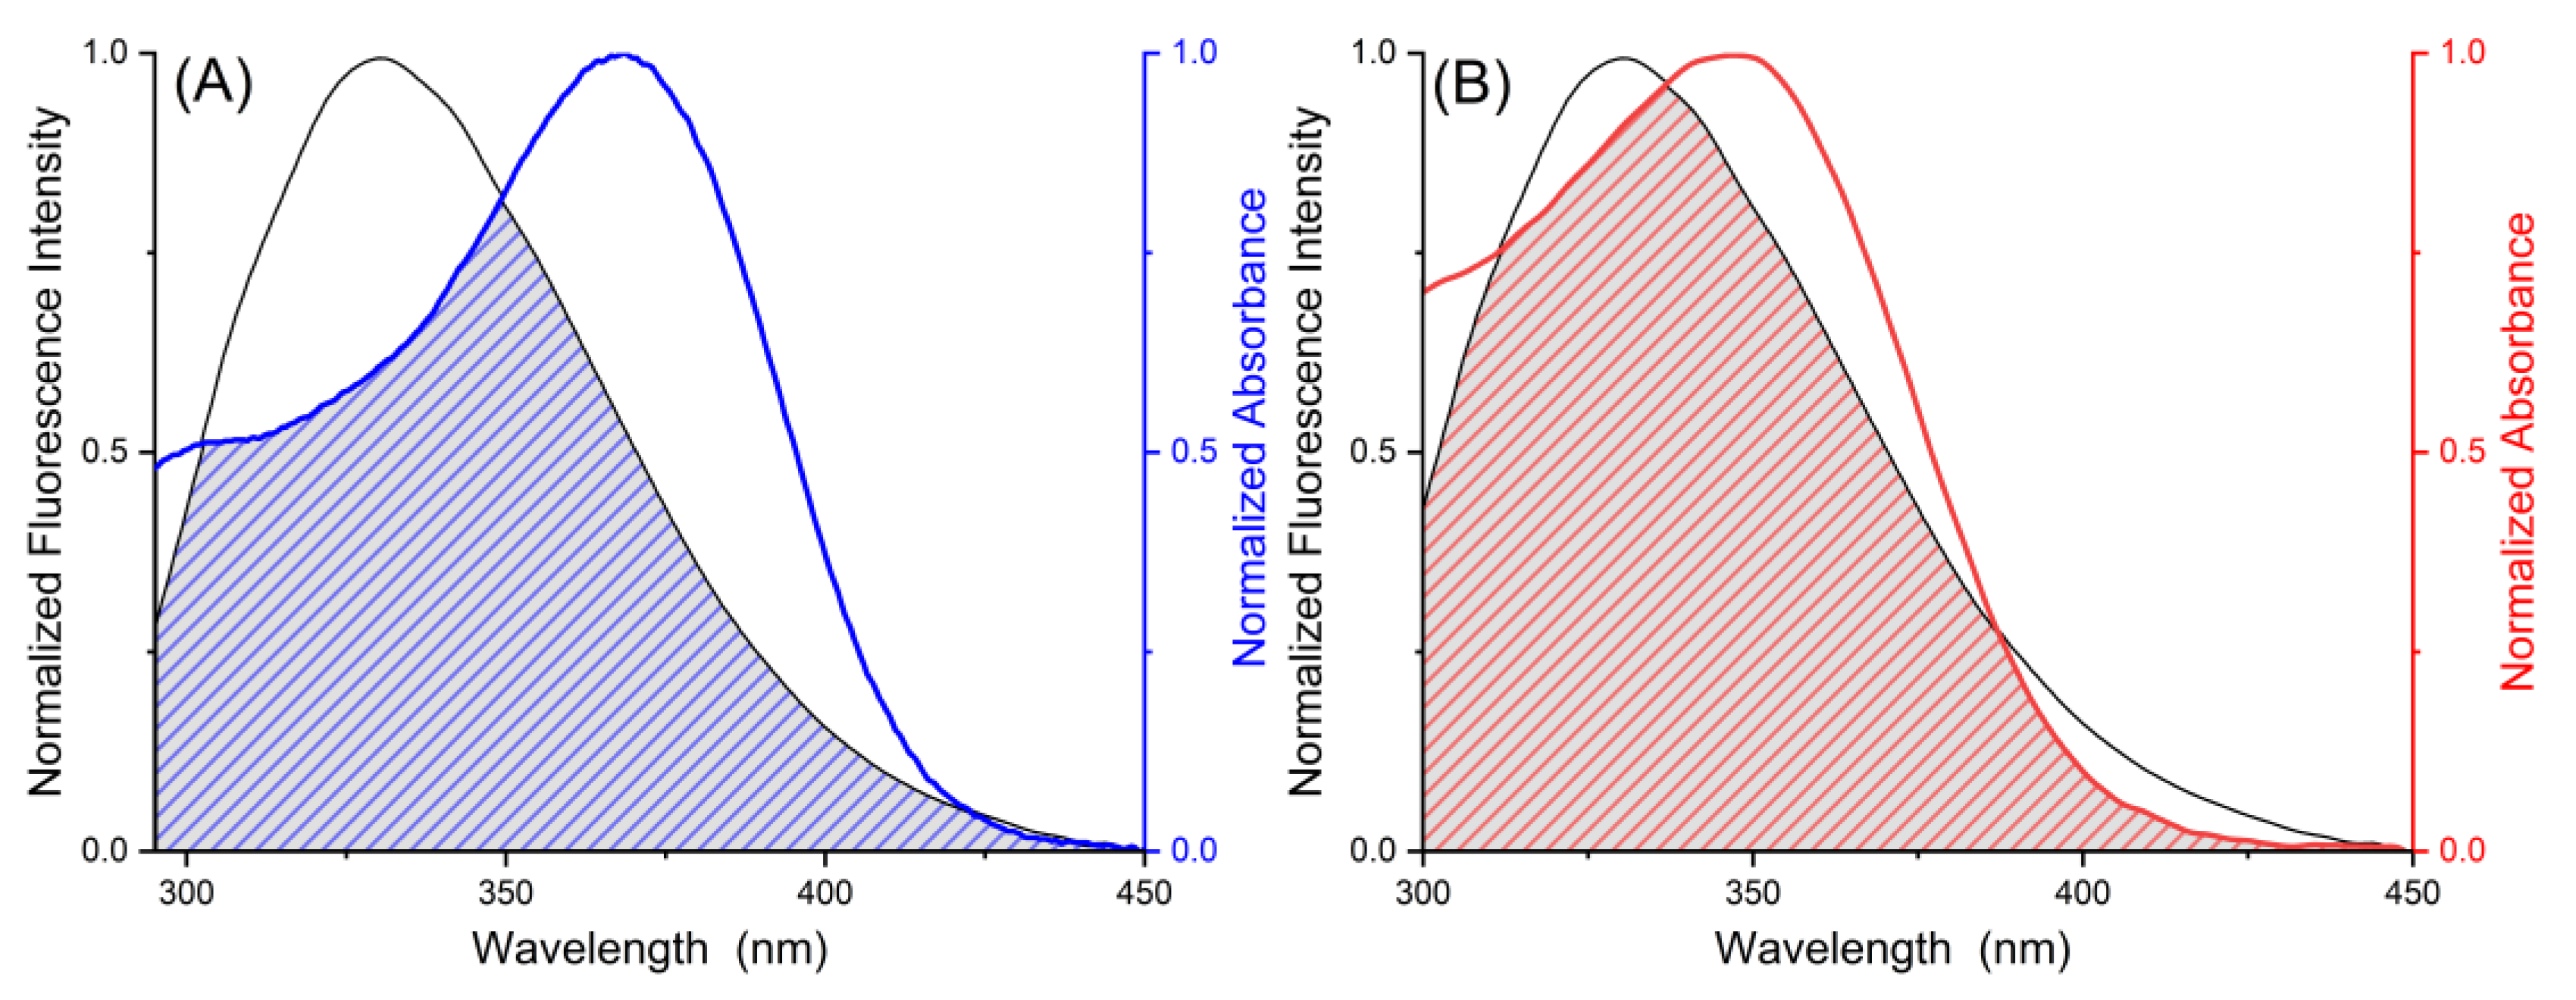
2.2. Förster Resonance Energy Transfer
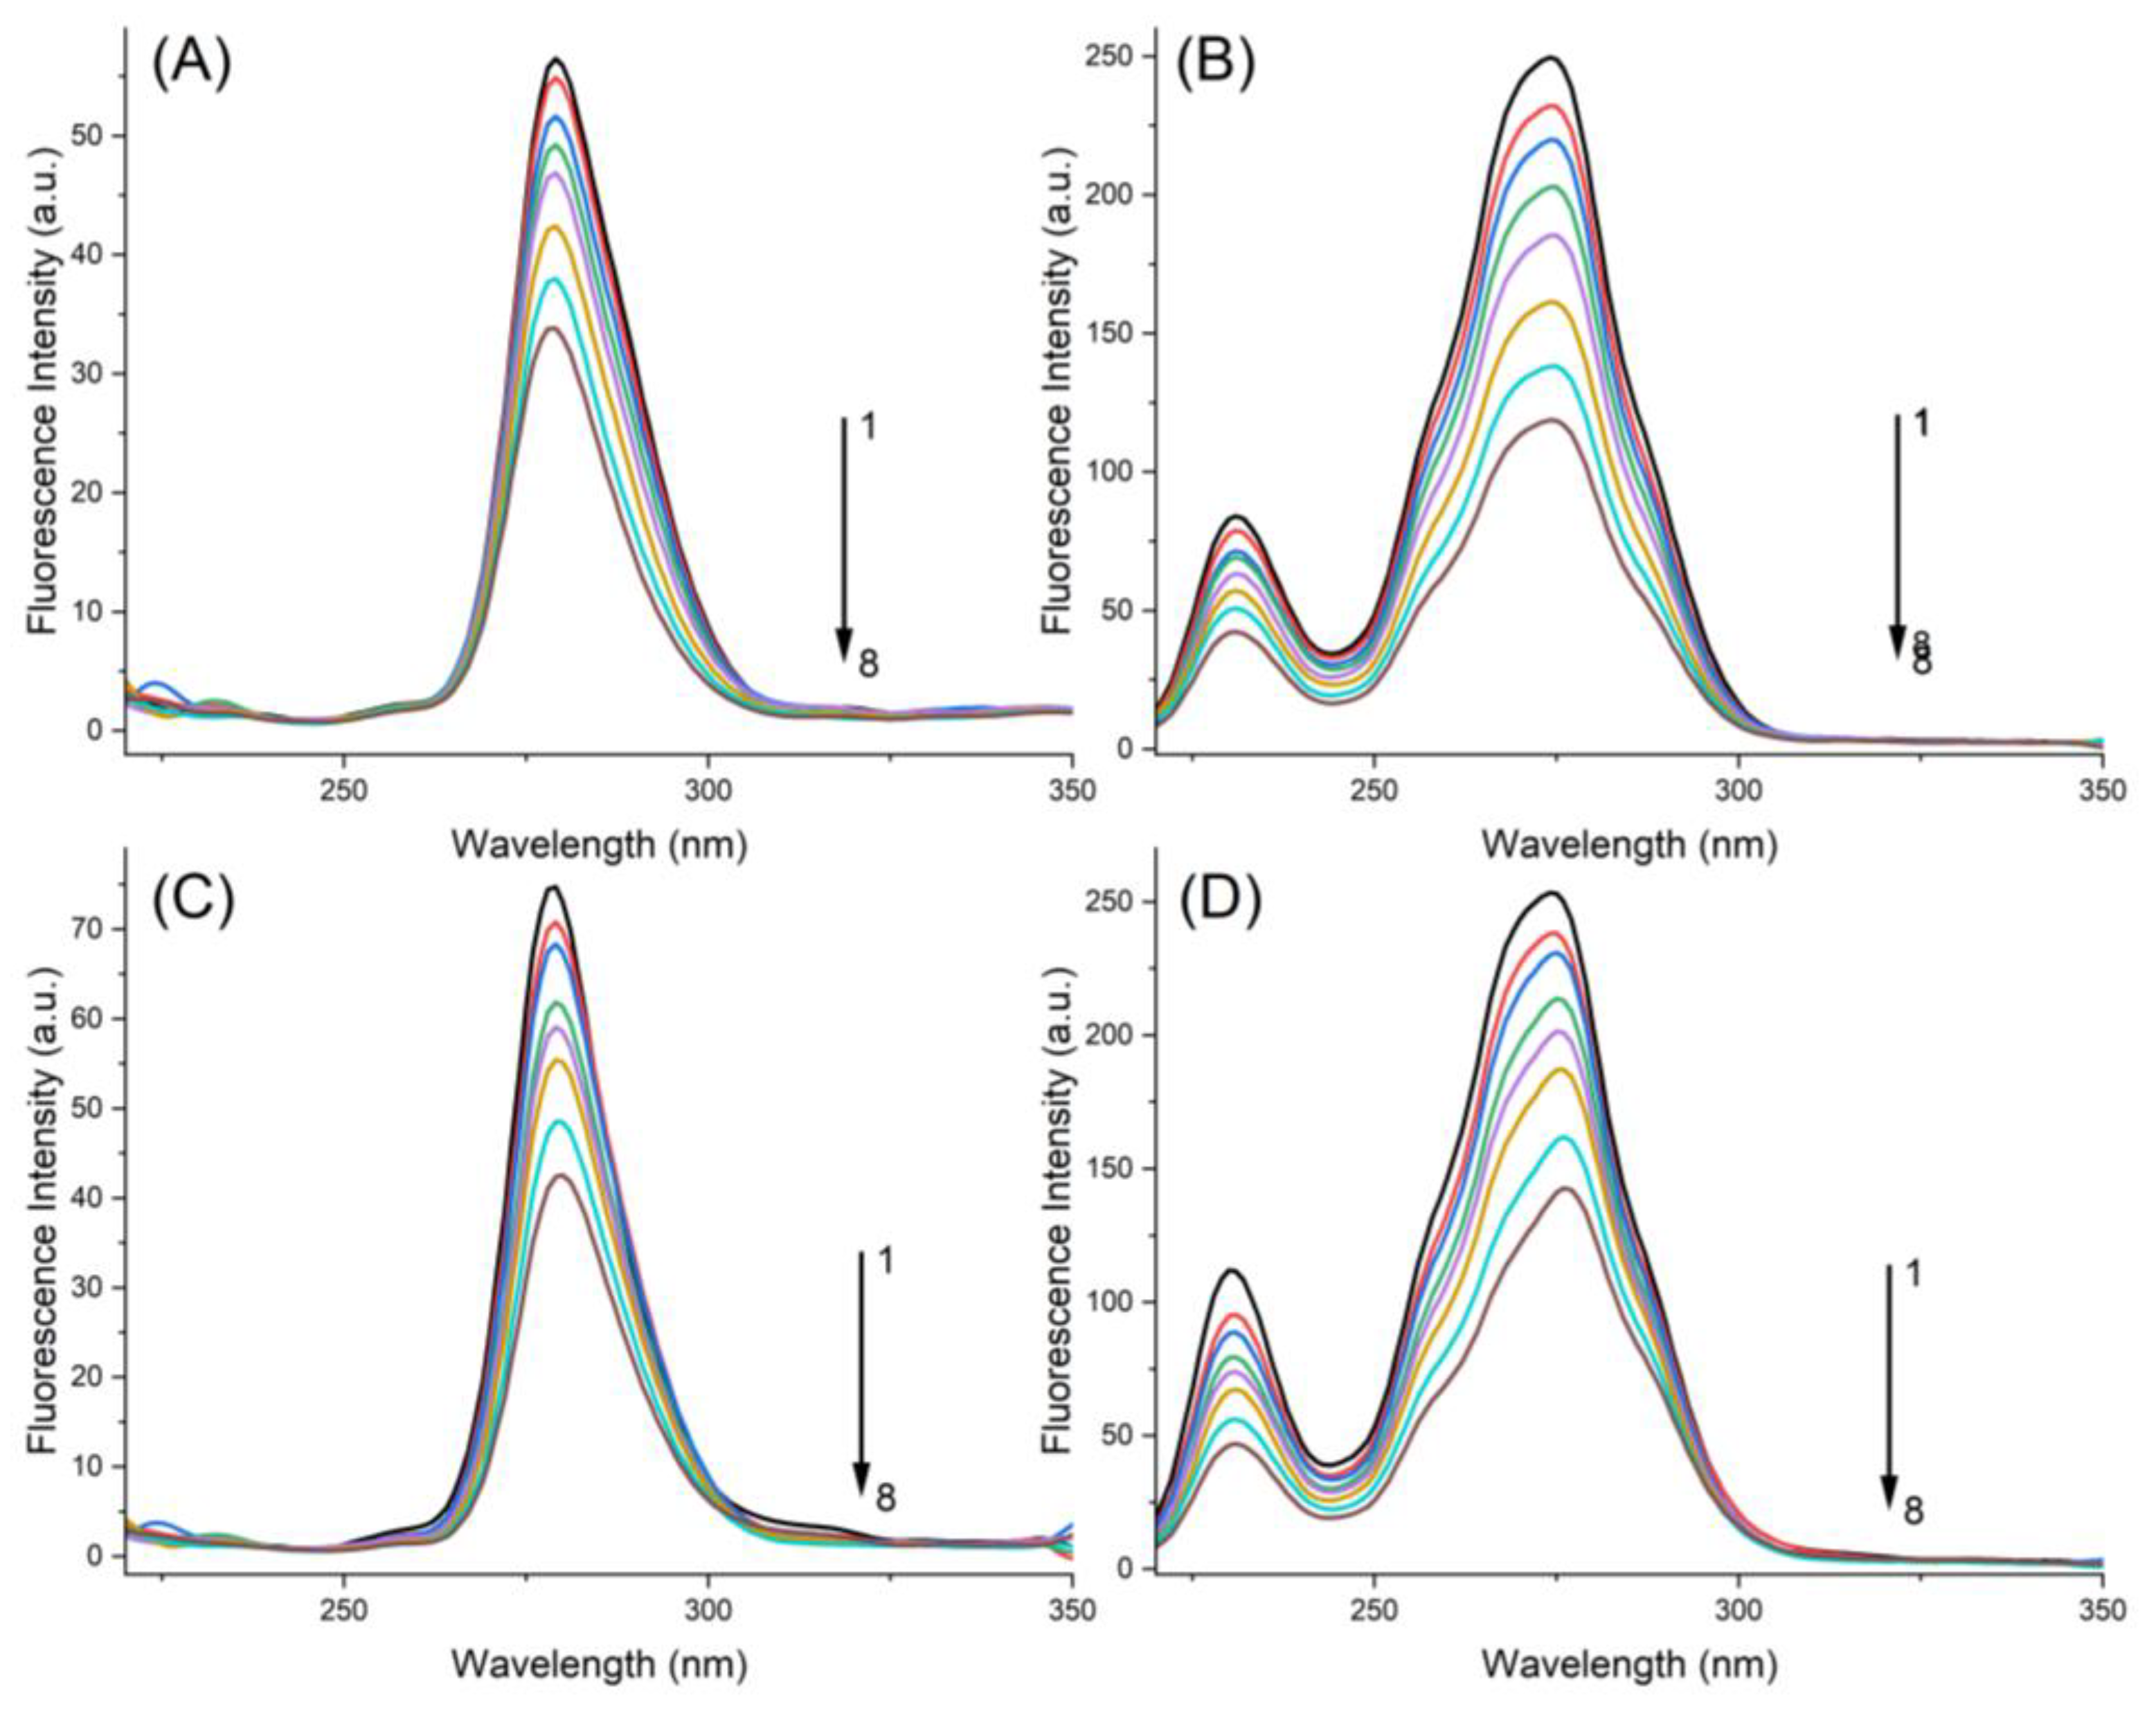
2.3. Synchronous Fluorescence Spectroscopy
2.4. Competitive Binding Experiments
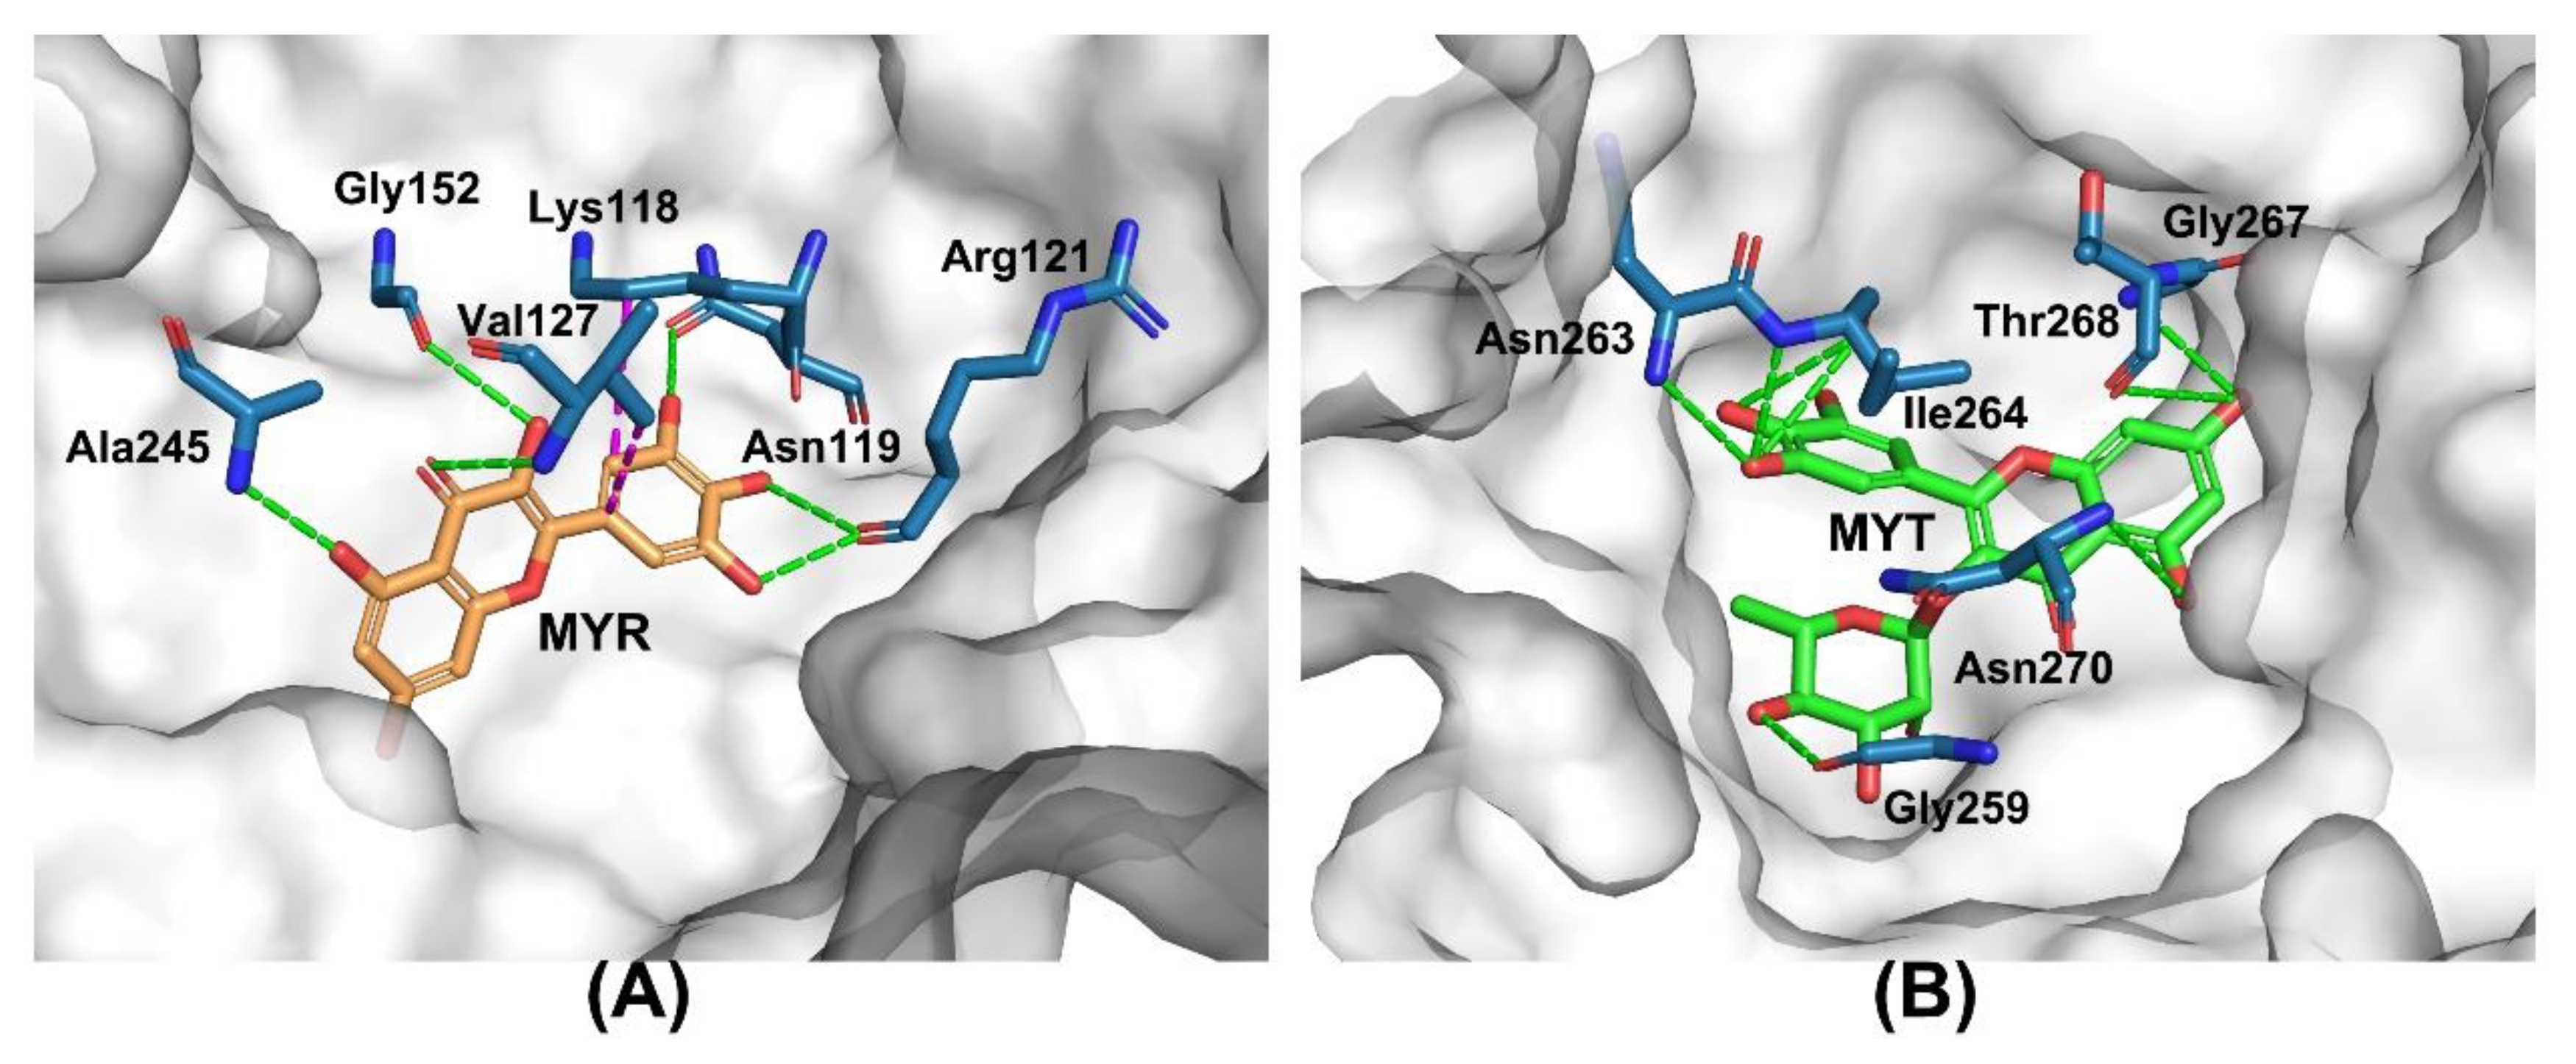
2.5. Molecular Docking Study
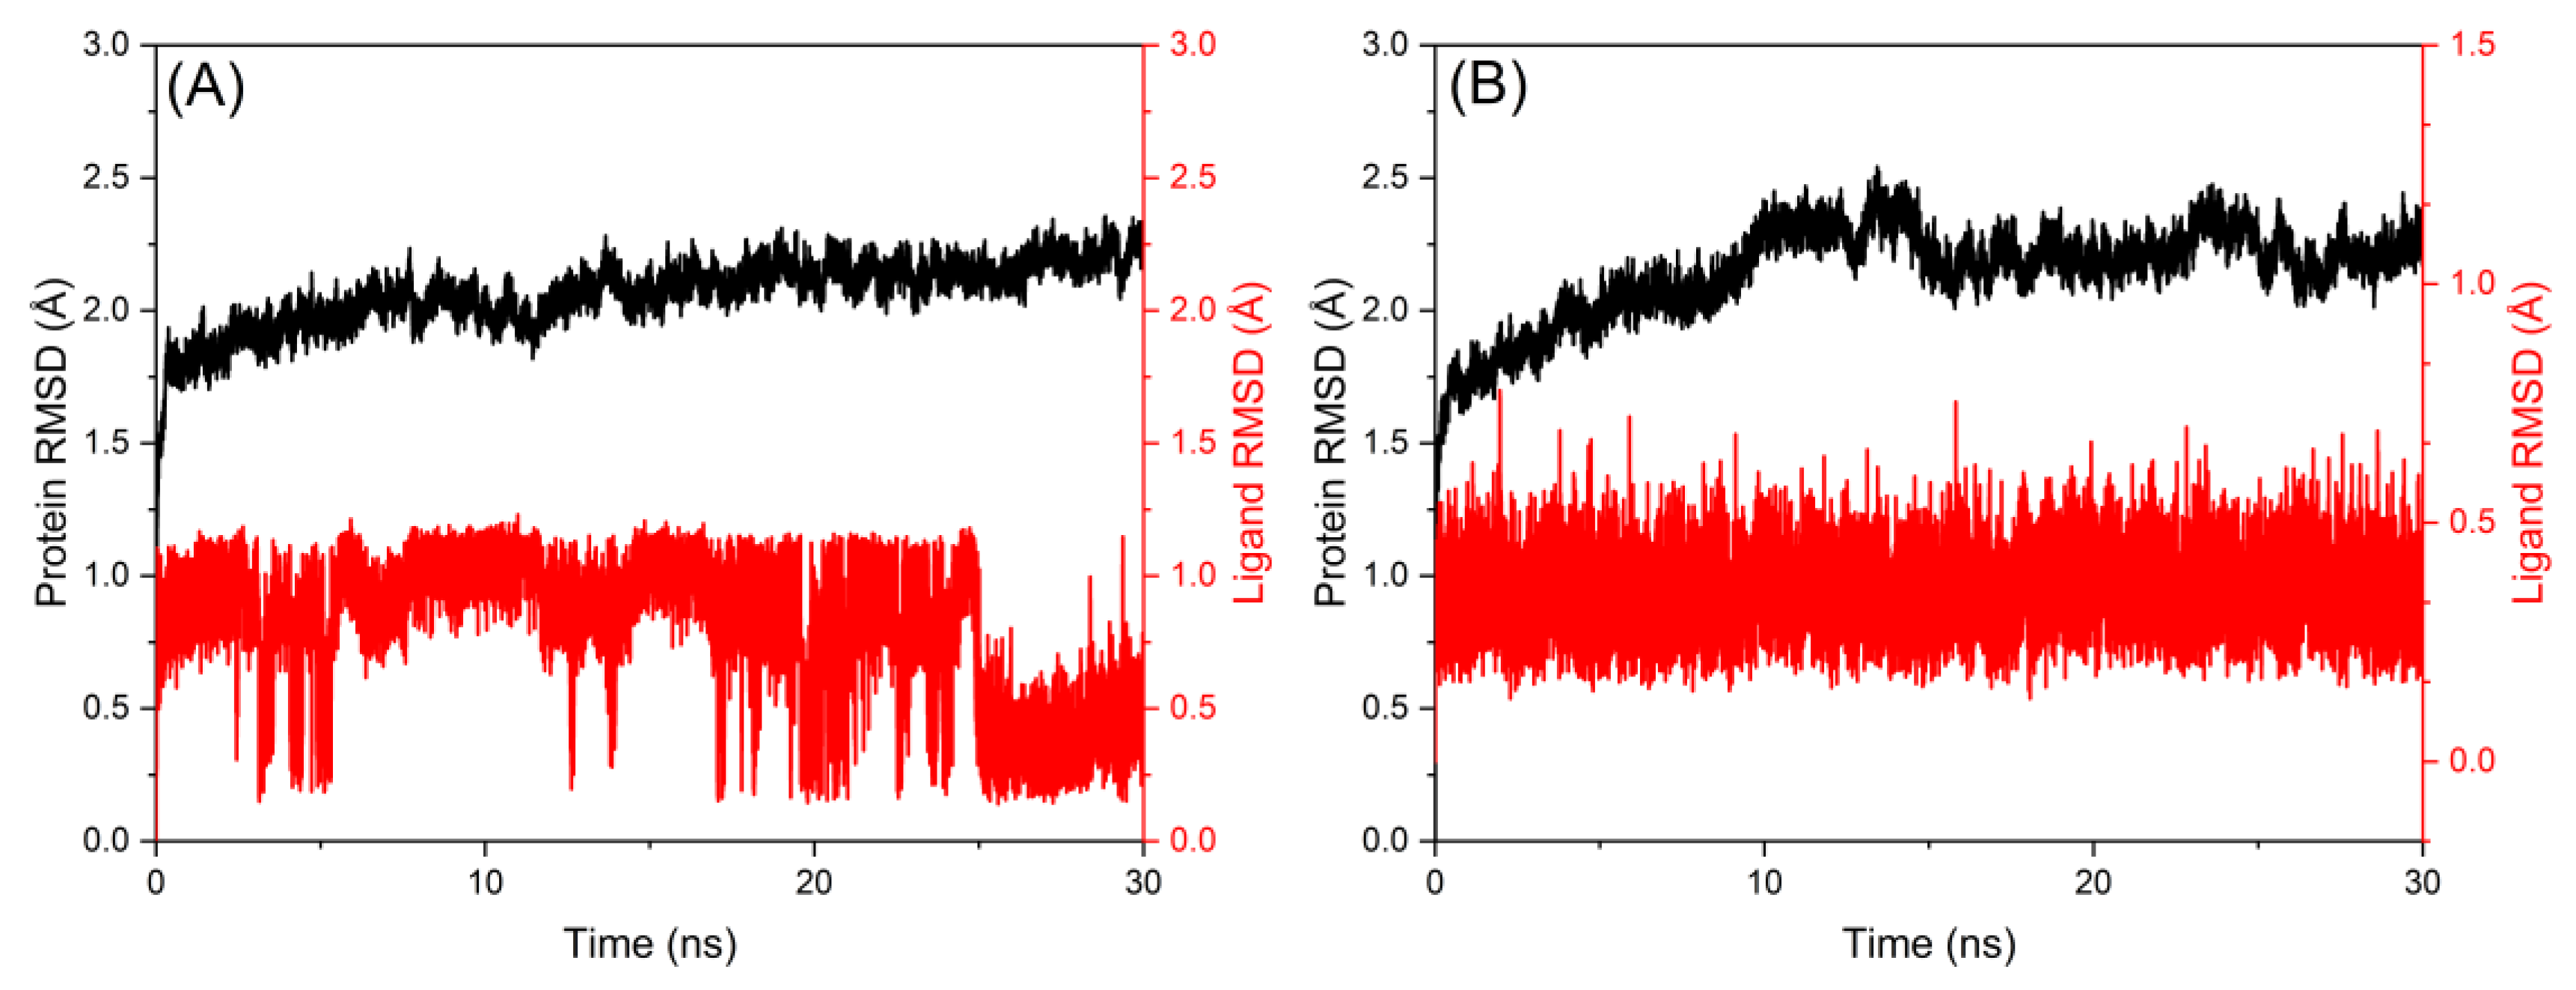
2.6. Molecular Dynamics Simulation Study
3. Materials and Methods
3.1. Materials
3.2. Instruments
3.3. Site-Tagged Competition Experiments with Ibuprofen and Cytisine
3.4. Förster Resonance Energy Transfer Studies
3.5. Molecular Docking Studies
3.6. Molecular Dynamics Studies
4. Conclusions
Author Contributions
Funding
Institutional Review Board Statement
Informed Consent Statement
Data Availability Statement
Conflicts of Interest
References
- Sun, C.; Huang, H.; Xu, C.; Li, X.; Chen, K. Biological Activities of Extracts from Chinese Bayberry (Myrica rubra Sieb. et Zucc.): A Review. Plant Foods Hum. Nutr. 2013, 68, 97–106. [Google Scholar] [CrossRef]
- Semwal, D.K.; Semwal, R.B.; Combrinck, S.; Viljoen, A. Myricetin: A Dietary Molecule with Diverse Biological Activities. Nutrients 2016, 8, 90. [Google Scholar] [CrossRef] [PubMed]
- Bertin, R.; Chen, Z.; Marin, R.; Donati, M.; Feltrinelli, A.; Montopoli, M.; Zambon, S.; Manzato, E.; Froldi, G. Activity of Myricetin and Other Plant-Derived Polyhydroxyl Compounds in Human LDL and Human Vascular Endothelial Cells against Oxidative Stress. Biomed. Pharmacother. 2016, 82, 472–478. [Google Scholar] [CrossRef] [PubMed]
- Kim, M.E.; Ha, T.K.; Yoon, J.H.; Lee, J.S. Myricetin Induces Cell Death of Human Colon Cancer Cells via BAX/BCL2-Dependent Pathway. Anticancer Res. 2014, 34, 701. [Google Scholar] [PubMed]
- Song, X.; Tan, L.; Wang, M.; Ren, C.; Guo, C.; Yang, B.; Ren, Y.; Cao, Z.; Li, Y.; Pei, J. Myricetin: A review of the Most Recent Research. Biomed. Pharmacother. 2021, 134, 111017. [Google Scholar] [CrossRef]
- Zhang, B.; Shen, Q.; Chen, Y.; Pan, R.; Kuang, S.; Liu, G.; Sun, G.; Sun, X. Myricitrin Alleviates Oxidative Stress-induced Inflammation and Apoptosis and Protects Mice against Diabetic Cardiomyopathy. Sci. Rep. 2017, 7, 44239. [Google Scholar] [CrossRef]
- Yan, Z.; Lin, Z.; Wu, Y.; Zhan, J.; Qi, W.; Lin, J.; Shen, J.; Xue, X.; Pan, X. The Protective Effect of Myricitrin in Osteoarthritis: An In Vitro and In Vivo Study. Int. Immunopharmacol. 2020, 84, 106511. [Google Scholar] [CrossRef]
- Jo, S.; Kim, S.; Shin, D.H.; Kim, M.-S. Inhibition of African Swine Fever Virus Protease by Myricetin and Myricitrin. J. Enzyme. Inhib. Med. Chem. 2020, 35, 1045–1049. [Google Scholar] [CrossRef]
- Vojta, D.; Dominković, K.; Miljanić, S.; Spanget-Larsen, J. Intramolecular Hydrogen Bonding in Myricetin and Myricitrin. Quantum Chemical Calculations and Vibrational Spectroscopy. J. Mol. Struct. 2017, 1131, 242–249. [Google Scholar] [CrossRef]
- Man, N.; Wang, Q.; Li, H.; Adu-Frimpong, M.; Sun, C.; Zhang, K.; Yang, Q.; Wei, Q.; Ji, H.; Toreniyazov, E.; et al. Improved Oral Bioavailability of Myricitrin by Liquid Self-Microemulsifying Drug Delivery Systems. J. Drug Deliv. Sci. Technol. 2019, 52, 597–606. [Google Scholar] [CrossRef]
- Pähler, A.; Banerjee, A.; Dattagupta, J.K.; Fujiwara, T.; Lindner, K.; Pal, G.P.; Suck, D.; Weber, G.; Saenger, W. Three-Dimensional Structure of Fungal Proteinase K Reveals Similarity to Bacterial Subtilisin. EMBO J. 1984, 3, 1311–1314. [Google Scholar] [CrossRef]
- Jafari, A.; Shareghi, B.; Hosseini-Koupaei, M.; Farhadian, S. Characterization of Osmolyte-Enzyme Interactions Using Different Spectroscopy and Molecular Dynamic Techniques: Binding of Sucrose to Proteinase K. Int. J. Biol. Macromol. 2020, 151, 1250–1258. [Google Scholar] [CrossRef] [PubMed]
- Divsalar, A.; Razmi, M.; Saboury, A.A.; Mansouri-Torshizi, H.; Ahmad, F. Biological Evaluation of a New Synthesized Pt(II) Complex by Cytotoxic and Spectroscopic Studies. Cell Biochem. Biophys. 2015, 71, 1415–1424. [Google Scholar] [CrossRef]
- Guo, D.; Zhang, B.; Liu, R. Investigation of The Effects of Nanoag on The Enzyme Lysozyme at The Molecular Level. RSC Adv. 2016, 6, 36273–36280. [Google Scholar] [CrossRef]
- Sun, M.; Su, M.; Sun, H. Spectroscopic Investigation on The Interaction Characteristics and Inhibitory Activities between Baicalin and Acetylcholinesterase. Med. Chem. Res. 2018, 27, 1589–1598. [Google Scholar] [CrossRef]
- Eftink, M.R.; Ghiron, C.A. Fluorescence Quenching Studies with Proteins. Anal. Biochem. 1981, 114, 199–227. [Google Scholar] [CrossRef]
- Zhang, Q.; Liu, L.; Zhu, Z.; Ni, Y. Functionalization of Fe3O4/rGO Magnetic Nanoparticles with Resveratrol and In Vitro DNA Interaction. Spectrochim. Acta A Mol. Biomol. Spectrosc. 2022, 273, 121032. [Google Scholar] [CrossRef]
- Roy, S.; Das, T.K. Study of Interaction Between Tryptophan, Tyrosine, and Phenylalanine Separately with Silver Nanoparticles by Fluorescence Quenching Method. J. Appl. Spectrosc. 2015, 82, 598–606. [Google Scholar] [CrossRef]
- Ma, Y.-J.; Wu, J.-H.; Li, X.; Xu, X.-B.; Wang, Z.-Y.; Wu, C.; Du, M.; Song, L. Effect of Alkyl Distribution in Pyrazine on Pyrazine Flavor Release in Bovine Serum Albumin Solution. RSC Adv. 2019, 9, 36951–36959. [Google Scholar] [CrossRef]
- Pasban Ziyarat, F.; Asoodeh, A.; Sharif Barfeh, Z.; Pirouzi, M.; Chamani, J. Probing the Interaction of Lysozyme with Ciprofloxacin in The Presence of Different-Sized Ag Nano-Particles by Multispectroscopic Techniques and Isothermal Titration Calorimetry. J. Biomol. Struct. Dyn. 2014, 32, 613–629. [Google Scholar] [CrossRef] [PubMed]
- Moradi, M.; Divsalar, A.; Saboury, A.A.; Ghalandari, B.; Harifi, A.R. Inhibitory Effects of Deferasirox on The Structure and Function of Bovine Liver Catalase: A Spectroscopic and Theoretical Study. J. Biomol. Struct. Dyn. 2015, 33, 2255–2266. [Google Scholar] [CrossRef]
- Sørlie, M.; Chan, J.M.; Wang, H.; Seefeldt, L.C.; Parker, V.D. Elucidating Thermodynamic Parameters for Electron Transfer Proteins Using Isothermal Titration Calorimetry: Application to The Nitrogenase Fe Protein. J. Bio. Inorg. Chem. 2003, 8, 560–566. [Google Scholar] [CrossRef]
- Saboury, A.A.; Karbassi, F. Thermodynamic Studies on The Interaction of Calcium Ions with Alpha-Amylase. Thermochim. Acta 2000, 362, 121–129. [Google Scholar] [CrossRef]
- Zhang, X.; Li, L.; Xu, Z.; Liang, Z.; Su, J.; Huang, J.; Li, B. Investigation of The Interaction of Naringin Palmitate with Bovine Serum Albumin: Spectroscopic Analysis and Molecular Docking. PLoS ONE 2013, 8, e59106. [Google Scholar] [CrossRef]
- Hosseini-Koupaei, M.; Shareghi, B.; Saboury, A.A.; Davar, F. Molecular Investigation on The Interaction of Spermine with Proteinase K by Multispectroscopic Techniques and Molecular Simulation Studies. Int. J. Biol. Macromol. 2017, 94, 406–414. [Google Scholar] [CrossRef]
- Hamishehkar, H.; Hosseini, S.; Naseri, A.; Safarnejad, A.; Rasoulzadeh, F. Interactions of Cephalexin with Bovine Serum Albumin: Displacement Reaction and Molecular Docking. Bioimpacts 2016, 6, 125–133. [Google Scholar] [CrossRef] [PubMed]
- Rowland, C.E.; Brown, C.W.; Medintz, I.L.; Delehanty, J.B. Intracellular FRET-Based Probes: A Review. Methods Appl. Fluoresc. 2015, 3, 042006. [Google Scholar] [CrossRef]
- Heller, D.P.; Greenstock, C.L. Fluorescence Lifetime Analysis of DNA Intercalated Ethidium Bromide and Quenching by Free Dye. Biophys. Chem. 1994, 50, 305–312. [Google Scholar] [CrossRef] [PubMed]
- Zehetmayer, P.; Hellerer, T.; Parbel, A.; Scheer, H.; Zumbusch, A. Spectroscopy of Single Phycoerythrocyanin Monomers: Dark State Identification and Observation of Energy Transfer Heterogeneities. Biophys. J. 2002, 83, 407–415. [Google Scholar] [CrossRef] [PubMed]
- Wang, J.; Liu, B.; Bian, G.; Duan, S.; Cui, M. Spectroscopy and Molecular Docking Analysis of the Interaction between Trypsin and Cefpirome. J. Anal. Bioanal. Sep. Tech. 2017, 2, 67–74. [Google Scholar]
- Clegg, R.M. Förster Resonance Energy Transfer—FRET What Is It, Why Do It, and How It’s Done. In Laboratory Techniques in Biochemistry and Molecular Biology; Elsevier: Amsterdam, The Netherlands, 2009; Volume 33, pp. 1–57. [Google Scholar]
- Han, Z.; Wu, Y.; Mi, Y.; Liu, L.; Su, G.; Yu, Z. Isomeric Discrimination of Oleanolic and Ursolic Acids by Human Serum Albumin: A Joint Study of Fluorescence Spectroscopy and Molecular Docking. Spectrosc. Spec. Anal. 2019, 39, 2190–2195. [Google Scholar]
- Wu, Y.; Han, Z.; Ma, J.; He, Y.; Liu, L.; Xin, S.; Yu, Z. Intermolecular Interactions between Cytisine and Bovine Serum Albumin: A Synchronous Fluorescence Spectroscopic Analysis and Molecular Docking Research. Spectrosc. Spec. Anal. 2016, 36, 765–769. [Google Scholar]
- Zhang, D.; Zhang, X.; Liu, Y.-C.; Huang, S.-C.; Ouyang, Y.; Hu, Y.-J. Investigations of The Molecular Interactions between Nisoldipine and Human Serum Albumin In Vitro Using Multi-Spectroscopy, Electrochemistry and Docking Studies. J. Mol. Liq. 2018, 258, 155–162. [Google Scholar] [CrossRef]
- Kou, S.-B.; Lin, Z.-Y.; Wang, B.-L.; Shi, J.-H.; Liu, Y.-X. Evaluation of The Binding Behavior of Olmutinib (HM61713) with Model Transport Protein: Insights from Spectroscopic and Molecular Docking Studies. J. Mol. Struct. 2021, 1224, 129024. [Google Scholar] [CrossRef]
- Wani, T.A.; Bakheit, A.H.; Zargar, S.; Alamery, S. Mechanistic Competitive Binding Interaction Study Between Olmutinib and Colchicine with Model Transport Protein Using Spectroscopic and Computer Simulation Approaches. J. Photochem. Photobiol. A 2022, 426, 113794. [Google Scholar] [CrossRef]
- Ni, Y.; Zhu, R.; Kokot, S. Competitive Binding of Small Molecules with Biopolymers: A Fluorescence Spectroscopy and Chemometrics Study of The Interaction of Aspirin and Ibuprofen with BSA. Analyst 2011, 136, 4794–4801. [Google Scholar] [CrossRef]
- Liu, K.; Kokubo, H. Prediction of Ligand Binding Mode Among Multiple Cross-Docking Poses by Molecular Dynamics Simulations. J. Comput. Aided Mol. Des. 2020, 34, 1195–1205. [Google Scholar] [CrossRef] [PubMed]
- Hosseini-Koupaei, M.; Shareghi, B.; Saboury, A.A.; Davar, F.; Sirotkin, V.A.; Hosseini-Koupaei, M.H.; Enteshari, Z. Catalytic Activity, Structure and Stability of Proteinase K In the Presence of Biosynthesized Cuo Nanoparticles. Int. J. Biol. Macromol. 2019, 122, 732–744. [Google Scholar] [CrossRef] [PubMed]
- Han, D.; Han, Z.; Liu, L.; Wang, Y.; Xin, S.; Zhang, H.; Yu, Z. Solubility Enhancement of Myricetin by Inclusion Complexation with Heptakis-O-(2-Hydroxypropyl)-β-Cyclodextrin: A Joint Experimental and Theoretical Study. Int. J. Mol. Sci. 2020, 21, 766. [Google Scholar] [CrossRef]
- Jafari, A.; Shareghi, B.; Farhadian, S.; Tirgir, F. Evaluation of Maltose Binding to Proteinase K: Insights from Spectroscopic and Computational Approach. J. Mol. Liq. 2019, 280, 1–10. [Google Scholar] [CrossRef]
- Saqib, S.; Faryad, S.; Afridi, M.I.; Arshad, B.; Younas, M.; Naeem, M.; Zaman, W.; Ullah, F.; Nisar, M.; Ali, S.; et al. Bimetallic Assembled Silver Nanoparticles Impregnated in Aspergillus fumigatus Extract Damage the Bacterial Membrane Surface and Release Cellular Contents. Coatings 2022, 12, 1505. [Google Scholar] [CrossRef]
- Berman, H.M.; Westbrook, J.; Feng, Z.; Gilliland, G.; Bhat, T.N.; Weissig, H.; Shindyalov, I.N.; Bourne, P.E. The Protein Data Bank. Nucleic Acids Res. 2000, 28, 235–242. [Google Scholar] [CrossRef] [PubMed]
- Hanwell, M.D.; Curtis, D.E.; Lonie, D.C.; Vandermeersch, T.; Zurek, E.; Hutchison, G.R. Avogadro: An Advanced Semantic Chemical Editor, Visualization, and Analysis Platform. J. Cheminformatics 2012, 4, 17. [Google Scholar] [CrossRef] [PubMed]
- Morris, G.M.; Huey, R.; Lindstrom, W.; Sanner, M.F.; Belew, R.K.; Goodsell, D.S.; Olson, A.J. Autodock4 and Autodocktools4: Automated Docking with Selective Receptor Flexibility. J. Comput. Chem. 2009, 30, 2785–2791. [Google Scholar] [CrossRef] [PubMed]
- Adasme, M.F.; Linnemann, K.L.; Bolz, S.N.; Kaiser, F.; Salentin, S.; Haupt, V.J.; Schroeder, M. PLIP 2021: Expanding the Scope of The Protein–Ligand Interaction Profiler to DNA and RNA. Nucleic Acids Res. 2021, 49, W530–W534. [Google Scholar] [CrossRef] [PubMed]
- Bowers, K.J.; Chow, E.; Xu, H.; Dror, R.O.; Eastwood, M.P.; Gregersen, B.A.; Klepeis, J.L.; Kolossvary, I.; Moraes, M.A.; Sacerdoti, F.D.; et al. Scalable Algorithms for Molecular Dynamics Simulations on Commodity Clusters. In Proceedings of the 2006 ACM/IEEE conference on Supercomputing, Tampa, FL, USA, 11–17 November 2006; p. 84. [Google Scholar]


| Ligand | T/K | Ksv/104 L·mol−1 | Kq/1012 L·mol−1·s−1 | KA/104 L·mol−1 | nA |
|---|---|---|---|---|---|
| MYR | 290 | 3.57 | 3.57 | 5.90 | 1.0 |
| 300 | 2.46 | 2.46 | 2.47 | 0.9 | |
| 310 | 1.90 | 1.90 | 0.88 | 0.9 | |
| MYT | 290 | 2.20 | 2.20 | 8.78 | 1.1 |
| 300 | 2.06 | 2.06 | 2.43 | 1.0 | |
| 310 | 1.88 | 1.88 | 0.53 | 0.9 |
| Ligand | T/K | ∆H/kJ·mol−1 | ∆S/J·mol−1·K−1 | ∆G/kJ·mol−1 |
|---|---|---|---|---|
| MYR | 290 | −98.01 | −3.51 | −27.62 |
| 300 | −25.23 | |||
| 310 | −22.77 | |||
| MYT | 290 | −105.01 | −3.86 | −27.44 |
| 300 | −25.18 | |||
| 310 | −22.09 |
| Ligand | J/cm3∙L∙mol−1 | RC/nm | E | r/nm |
|---|---|---|---|---|
| MYR | 9.29 × 10⁻¹⁴ | 3.61 | 0.105 | 5.11 |
| MYT | 6.73 × 10⁻¹⁴ | 3.42 | 0.128 | 3.89 |
| Ligand | Site Marker | KSV/104 L·mol−1 | R a |
|---|---|---|---|
| MYR | blank | 2.46 | 0.992 |
| ibuprofen | 1.71 | 0.998 | |
| cytisine | 1.74 | 0.995 | |
| MYT | blank | 2.06 | 0.997 |
| ibuprofen | 1.27 | 0.998 | |
| cytisine | 0.78 | 0.994 |
Disclaimer/Publisher’s Note: The statements, opinions and data contained in all publications are solely those of the individual author(s) and contributor(s) and not of MDPI and/or the editor(s). MDPI and/or the editor(s) disclaim responsibility for any injury to people or property resulting from any ideas, methods, instructions or products referred to in the content. |
© 2023 by the authors. Licensee MDPI, Basel, Switzerland. This article is an open access article distributed under the terms and conditions of the Creative Commons Attribution (CC BY) license (https://creativecommons.org/licenses/by/4.0/).
Share and Cite
Liu, K.; Zhang, Y.; Zhang, W.; Liu, L.; Yu, Z. A Study on the Interactions of Proteinase K with Myricetin and Myricitrin by Multi-Spectroscopy and Molecular Modeling. Int. J. Mol. Sci. 2023, 24, 5317. https://doi.org/10.3390/ijms24065317
Liu K, Zhang Y, Zhang W, Liu L, Yu Z. A Study on the Interactions of Proteinase K with Myricetin and Myricitrin by Multi-Spectroscopy and Molecular Modeling. International Journal of Molecular Sciences. 2023; 24(6):5317. https://doi.org/10.3390/ijms24065317
Chicago/Turabian StyleLiu, Kefan, Yubo Zhang, Wei Zhang, Liyan Liu, and Zhan Yu. 2023. "A Study on the Interactions of Proteinase K with Myricetin and Myricitrin by Multi-Spectroscopy and Molecular Modeling" International Journal of Molecular Sciences 24, no. 6: 5317. https://doi.org/10.3390/ijms24065317
APA StyleLiu, K., Zhang, Y., Zhang, W., Liu, L., & Yu, Z. (2023). A Study on the Interactions of Proteinase K with Myricetin and Myricitrin by Multi-Spectroscopy and Molecular Modeling. International Journal of Molecular Sciences, 24(6), 5317. https://doi.org/10.3390/ijms24065317