Article

Stress-Inducible SCAND Factors Suppress the Stress Response and Are Biomarkers for Enhanced Prognosis in Cancers

1
Department of Dental Pharmacology, Faculty of Medicine, Dentistry and Pharmaceutical Sciences, Okayama University, Okayama 700-8525, Japan
2
Department of Cancer Biology, National Cancer Institute, Cairo University, Cairo 11796, Egypt
3
Department of Oral and Maxillofacial Surgery, Graduate School of Medicine, Dentistry and Pharmaceutical Sciences, Okayama University, Okayama 700-8525, Japan
4
Department of Radiation Oncology, Beth Israel Deaconess Medical Center, Harvard Medical School, Boston, MA 02115, USA
*
Author to whom correspondence should be addressed.
Int. J. Mol. Sci. 2023, 24(6), 5168; https://doi.org/10.3390/ijms24065168
Submission received: 24 January 2023 / Revised: 2 March 2023 / Accepted: 6 March 2023 / Published: 8 March 2023

Abstract

:
The cell stress response is an essential system present in every cell for responding and adapting to environmental stimulations. A major program for stress response is the heat shock factor (HSF)–heat shock protein (HSP) system that maintains proteostasis in cells and promotes cancer progression. However, less is known about how the cell stress response is regulated by alternative transcription factors. Here, we show that the SCAN domain (SCAND)-containing transcription factors (SCAN-TFs) are involved in repressing the stress response in cancer. SCAND1 and SCAND2 are SCAND-only proteins that can hetero-oligomerize with SCAN-zinc finger transcription factors, such as MZF1(ZSCAN6), for accessing DNA and transcriptionally co-repressing target genes. We found that heat stress induced the expression of SCAND1, SCAND2, and MZF1 bound to HSP90 gene promoter regions in prostate cancer cells. Moreover, heat stress switched the transcript variants’ expression from long noncoding RNA (lncRNA-SCAND2P) to protein-coding mRNA of SCAND2, potentially by regulating alternative splicing. High expression of HSP90AA1 correlated with poorer prognoses in several cancer types, although SCAND1 and MZF1 blocked the heat shock responsiveness of HSP90AA1 in prostate cancer cells. Consistent with this, gene expression of SCAND2, SCAND1, and MZF1 was negatively correlated with HSP90 gene expression in prostate adenocarcinoma. By searching databases of patient-derived tumor samples, we found that MZF1 and SCAND2 RNA were more highly expressed in normal tissues than in tumor tissues in several cancer types. Of note, high RNA expression of SCAND2, SCAND1, and MZF1 correlated with enhanced prognoses of pancreatic cancer and head and neck cancers. Additionally, high expression of SCAND2 RNA was correlated with better prognoses of lung adenocarcinoma and sarcoma. These data suggest that the stress-inducible SCAN-TFs can function as a feedback system, suppressing excessive stress response and inhibiting cancers.

1. Introduction

The cell stress response is an intrinsic system in all cells responding and adapting to environmental stimulations. One of the representative stress response systems is the heat shock factor (HSF)–heat shock protein (HSP) program that maintains proteostasis in cells [1,2,3,4] and promotes cancer progression [5,6,7]. The HSF–HSP system was originally found to be activated in response to heat shock stress (HSS) but was subsequently shown to also be induced by oxidative stress, heavy metals, toxins, bacterial infections, and other stresses [1]. Such proteotoxic stresses cause protein misfolding and thus activate the HSF–HSP system. Of note, the HSF–HSP system is often activated in cancer [8,9,10].
Heat shock protein 90 (HSP90) members are stress-inducible protein chaperones that assist protein folding and re-folding to give their clients functionality in the intracellular space. As HSP90 has several hundred protein substrates (called ‘clients’), it is involved in many cellular processes beyond protein folding, which include DNA repair, development, the immune response, and neurodegeneration [11,12,13,14,15]. Elevated expression of HSP90 has been observed in many cancer types and correlates with poor prognosis, increased metastatic potential, and resistance to therapy [16,17,18,19]. Moreover, the HSP90 alpha and beta isoforms are often released with extracellular vesicles (EV), including exosomes, by cancer cells and trigger cancer initiation and progression, as well as the polarization of tumor-associated macrophages (TAM) to an immunosuppressive M2 subtype [6,17,20,21,22]. In addition, HSP90 is produced and released by immunocytes, such as macrophages, and plays a key role in antigen cross-presentation [14,15,23,24]. HSF1 is the master regulator of the protein quality control machinery in response to proteotoxic stress conditions [2,3,25] and enhances cancer progression [5,7]. Upon proteotoxic stress, HSF1 binds to heat shock elements (HSE) in the promoter regions of HSP genes and other stress-inducible genes [2,3,25]. HSF1 drives oncogenesis in many ways beyond inducing the gene expression of chaperones [7,26,27,28], co-chaperones [6], and non-chaperone target genes [9]. However, less is known about how HSP90 genes are attenuated by alternative transcription factors.
The SCAN domain-containing transcription factors (SCAN-TF) contain the SREZBP-CTfin51-AW1-Number 18 cDNA domain (SCAND), a leucine-rich oligomerization domain highly conserved among the SCAN-TF family (Figure S1). This family contains more than 50 members, most of which contain a zinc finger (ZF) domain to scan DNA sequences for binding; hence, they are called SCAN-ZF factors [29,30,31,32,33]. Myeloid zinc finger 1 (MZF1), also known as ZSCAN6 or ZNF42, is a prototypical SCAN-ZF that contains an N-terminal SCAN domain, a linker region, and a C-terminal DNA binding domain [34,35,36]. Many studies have identified MZF1 as an oncogenic transcription factor [34,37,38,39,40] and cancer stemness factor [41,42]. However, depending on the context, MZF1 can also function as a tumor suppressor [43,44,45]. While there are more than 50 types of SCAN-TFs, only 6 zinc-fingerless SCAND-only proteins exist [30,31]. SCAND1 is a SCAN domain-only protein that can hetero-oligomerize with other SCAN-ZFs, including MZF1, through inter-SCAN domain interactions to repress transcription [32,33,37,43,46]. Thus, hetero-oligomerization between SCAND molecules and SCAN-ZF molecules can transform their roles, forming a transcriptional repressor complex [32,33,37,43,46]. Indeed, SCAND1 represses the co-chaperone CDC37 gene (encoding cell division control 37) by interacting with MZF1 and suppressing prostate cancer [37]. Moreover, SCAND1 and MZF1 are mutually inducible and form oligomers that can reverse epithelial-to-mesenchymal transition (EMT), tumor growth, and migration by repressing EMT driver genes and mitogenic protein kinase (MAPK) genes [43]. High expression of MZF1 correlated with poor prognoses in prostate cancer and kidney cancer, whereas SCAND1 and MZF1 expression correlate with better prognoses in pancreatic cancer and stage III head and neck cancers [43]. These suggest that MZF1 alone is oncogenic, whereas repressing complexes of SCAND1 and MZF1 is tumor suppressor, depending on their gene expression in cancer cases. SCAND2 is another member of SCAND factors with high homologies. Of note, SCAND2 RNA has been registered as SCAND2P, a pseudogene for long noncoding RNA (lncRNA), and protein-coding SCAND2 mRNA in the NCBI database, although it has not been biologically investigated.
It has been unclear whether the SCAND factors and MZF1 are involved in proteotoxic stress response in cancer. Here, we show that the SCANDs and MZF1 are stress-inducible factors and can attenuate HSP90 gene expression in prostate cancer cells. We also show that cell stress alters the transcript variants of protein-coding and noncoding RNA of SCAND2. Moreover, we show that high expression levels of these SCAN-TF RNA can be predictive biomarkers of better prognoses in several cancer types, indicating potential tumor suppressor roles.

2. Results

2.1. Heat Shock Elements (HSE) in the Promoter Regions of MZF1(ZSCAN6), SCAND1, and SCAND2P Genes in the Human Genome

We first grasp the loci and structures of MZF1(ZSCAN6), SCAND1, and SCAND2P genes in the human genome. The MZF1 gene is located at the terminal end of chromosome 19 (Figure 1A, Figures S1 and S2). SCAND1 gene is located on chromosome 20. SCAND2P gene is located on chromosome 15. These SCAN-TF genes overlap with other genes encoding MZF1-AS1 (antisense 1), CNBD2, and WDR73. SCAND2P gene is located neighboring with ZSCAN2 gene, another member of SCAN-ZFs. MZF1 gene is located near the TRIM28 gene, encoding a stress-related transcriptional elongation factor.
To predict whether MZF1, SCAND1, and SCAND2P genes are transcriptionally regulated by HSFs and MZF1, we searched for binding sequences of these TFs in promoter regions. Several binding sequences (BSs) for HSF1 and HSF4 were found in the promoter regions of MZF1, SCAND1, and SCAND2P genes (Figure 1B,C; Table 1). Moreover, dozens of MZF1-BSs were found in the promoter regions of SCAND1 and MZF1 genes (Table 1). These data suggested that MZF1, SCAND1, and SCAND2P genes are transcriptionally regulated by HSFs, MZF1, and SCANDs.

2.2. Heat Shock Stress Induces MZF1, SCAND1, and SCAND2 Gene Expression and Reduces lncRNA-SCAND2P in Prostate Cancer

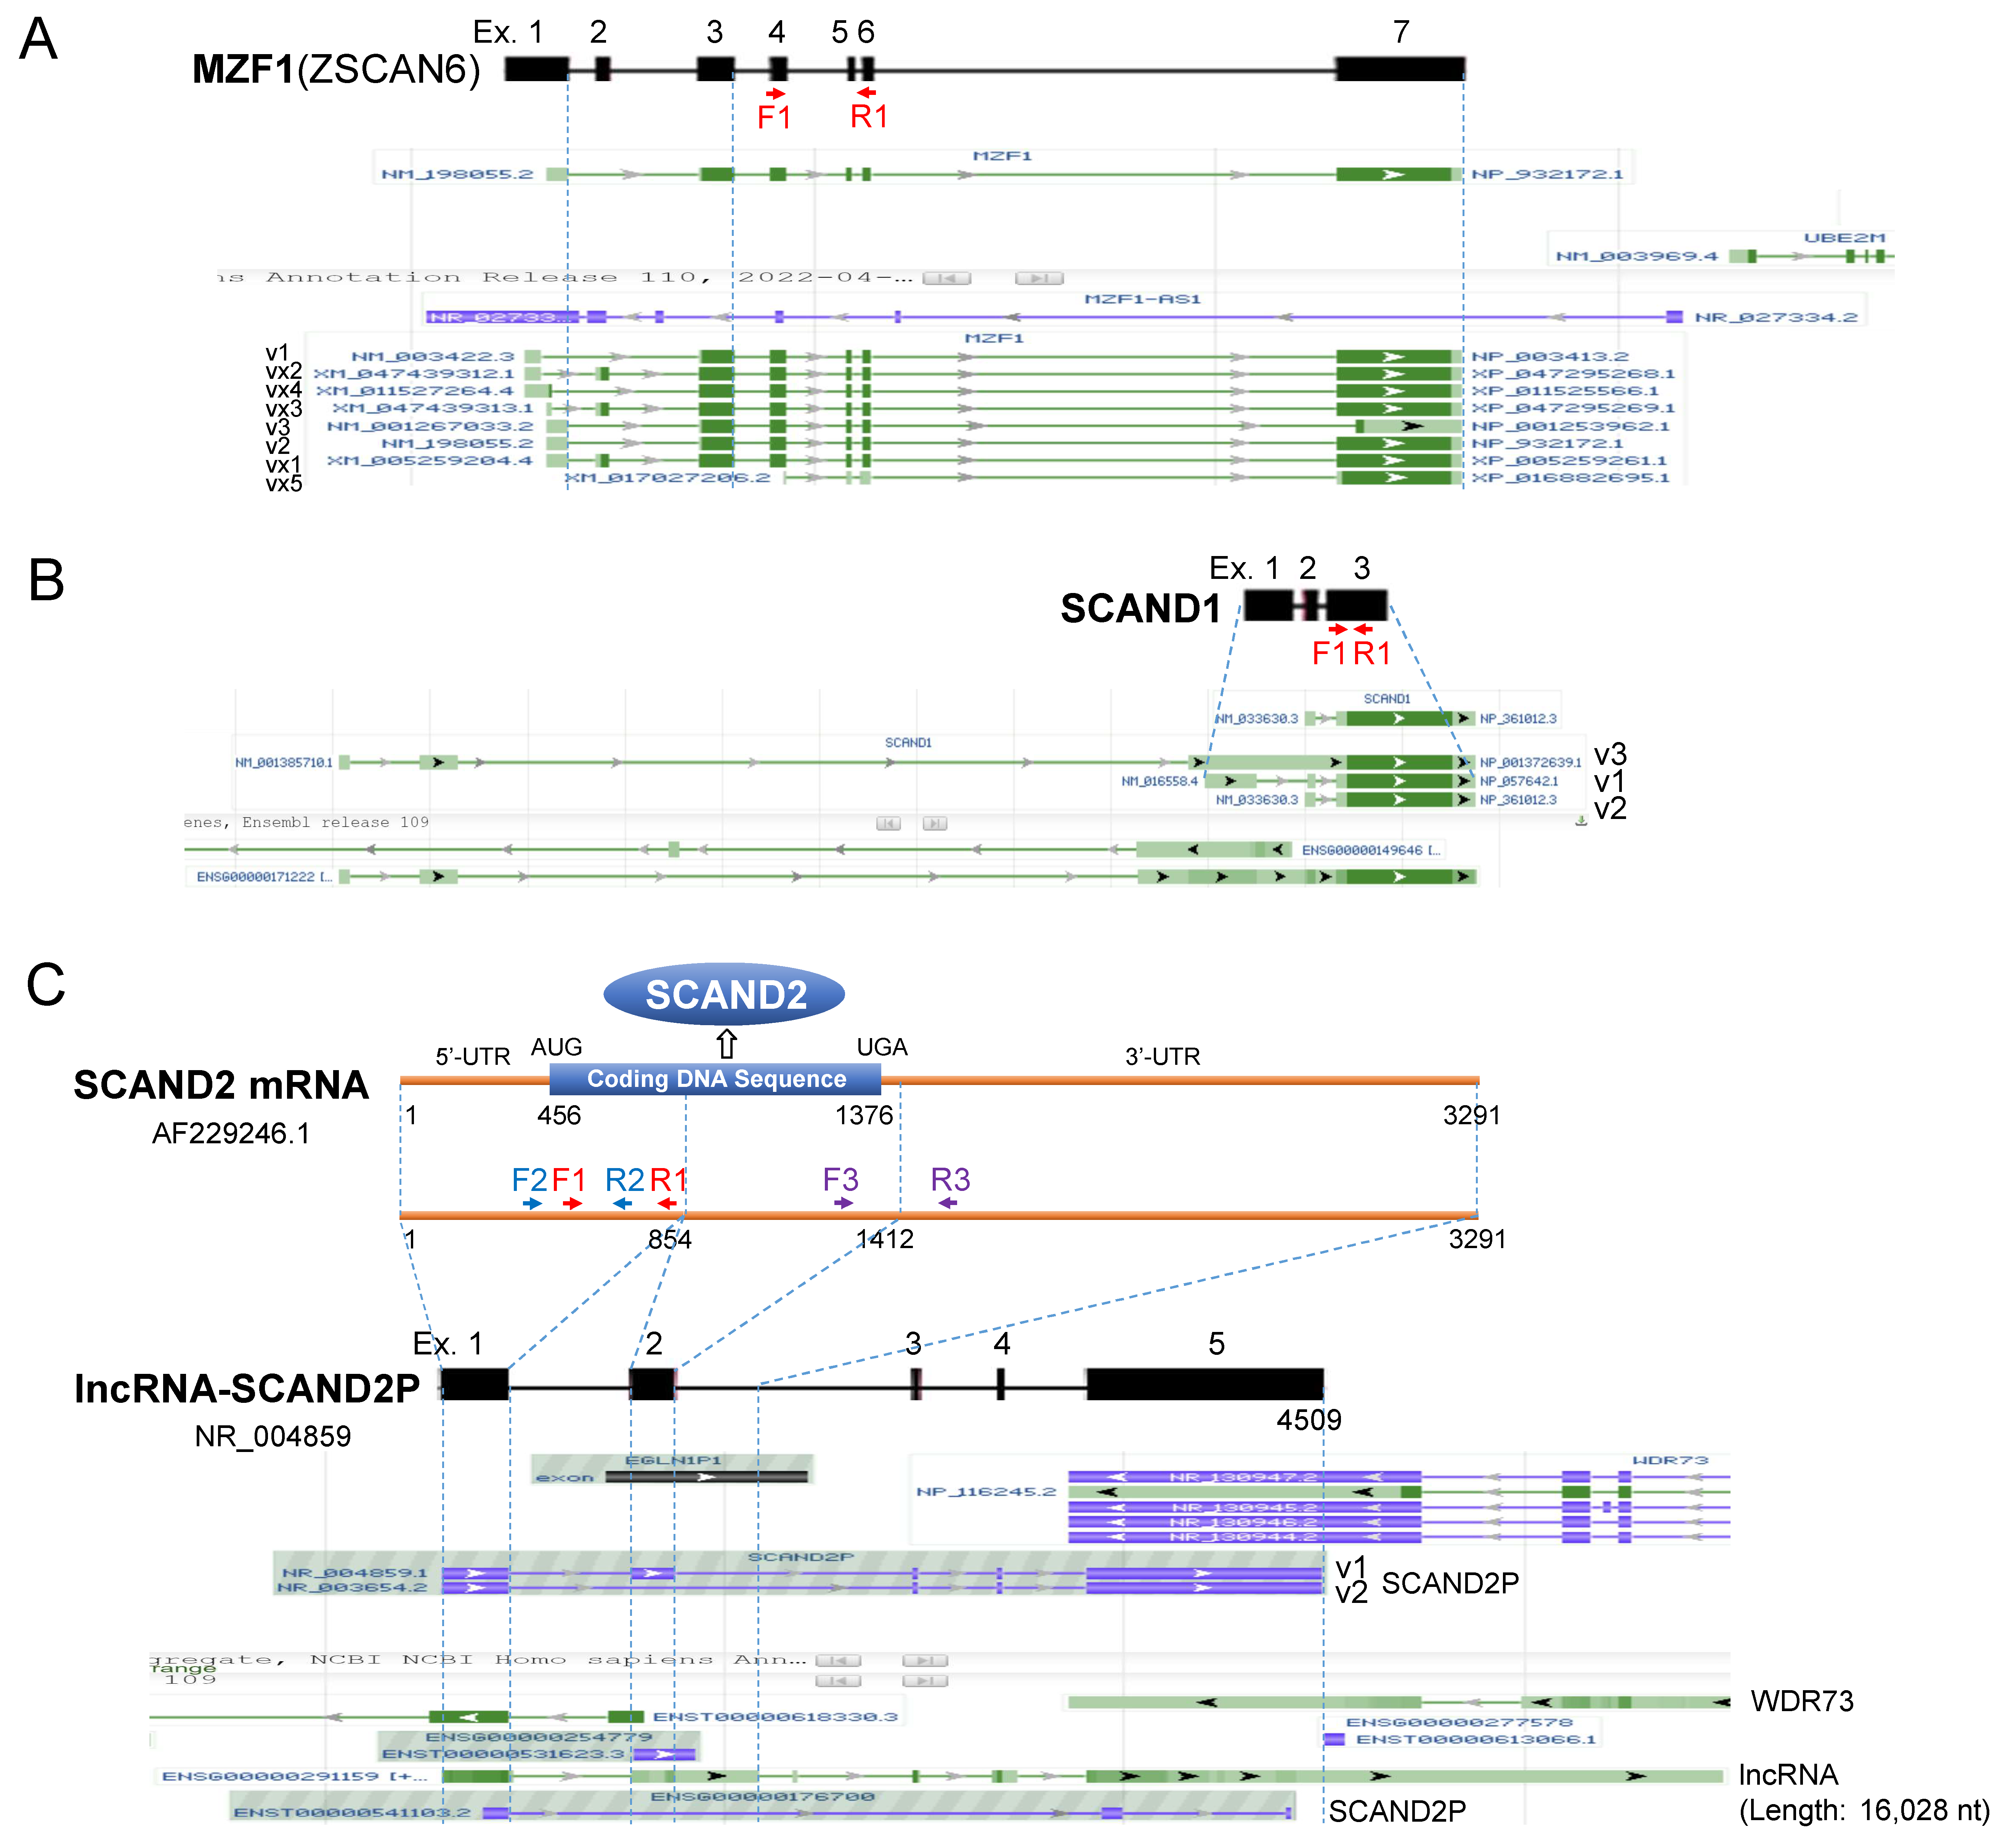
We next considered transcript variants of MZF1, SCAND1, and SCAND2. We found eight MZF1 RNA variants, three SCAND1 RNA variants, and three SCAND2(SCAND2P) RNA variants in the NCBI database (Figure 2A–C). Of note, the SCAND2 complete coding DNA sequence (AF229246.1) and lncRNA-SCAND2P (NR_004859.1 and NR_003654.2) were found at the same genome locus (Figure 2C). We designed primer pairs that can detect all these variants for qRT-PCR analysis (Figure 2 and Figure S2, Table S1).
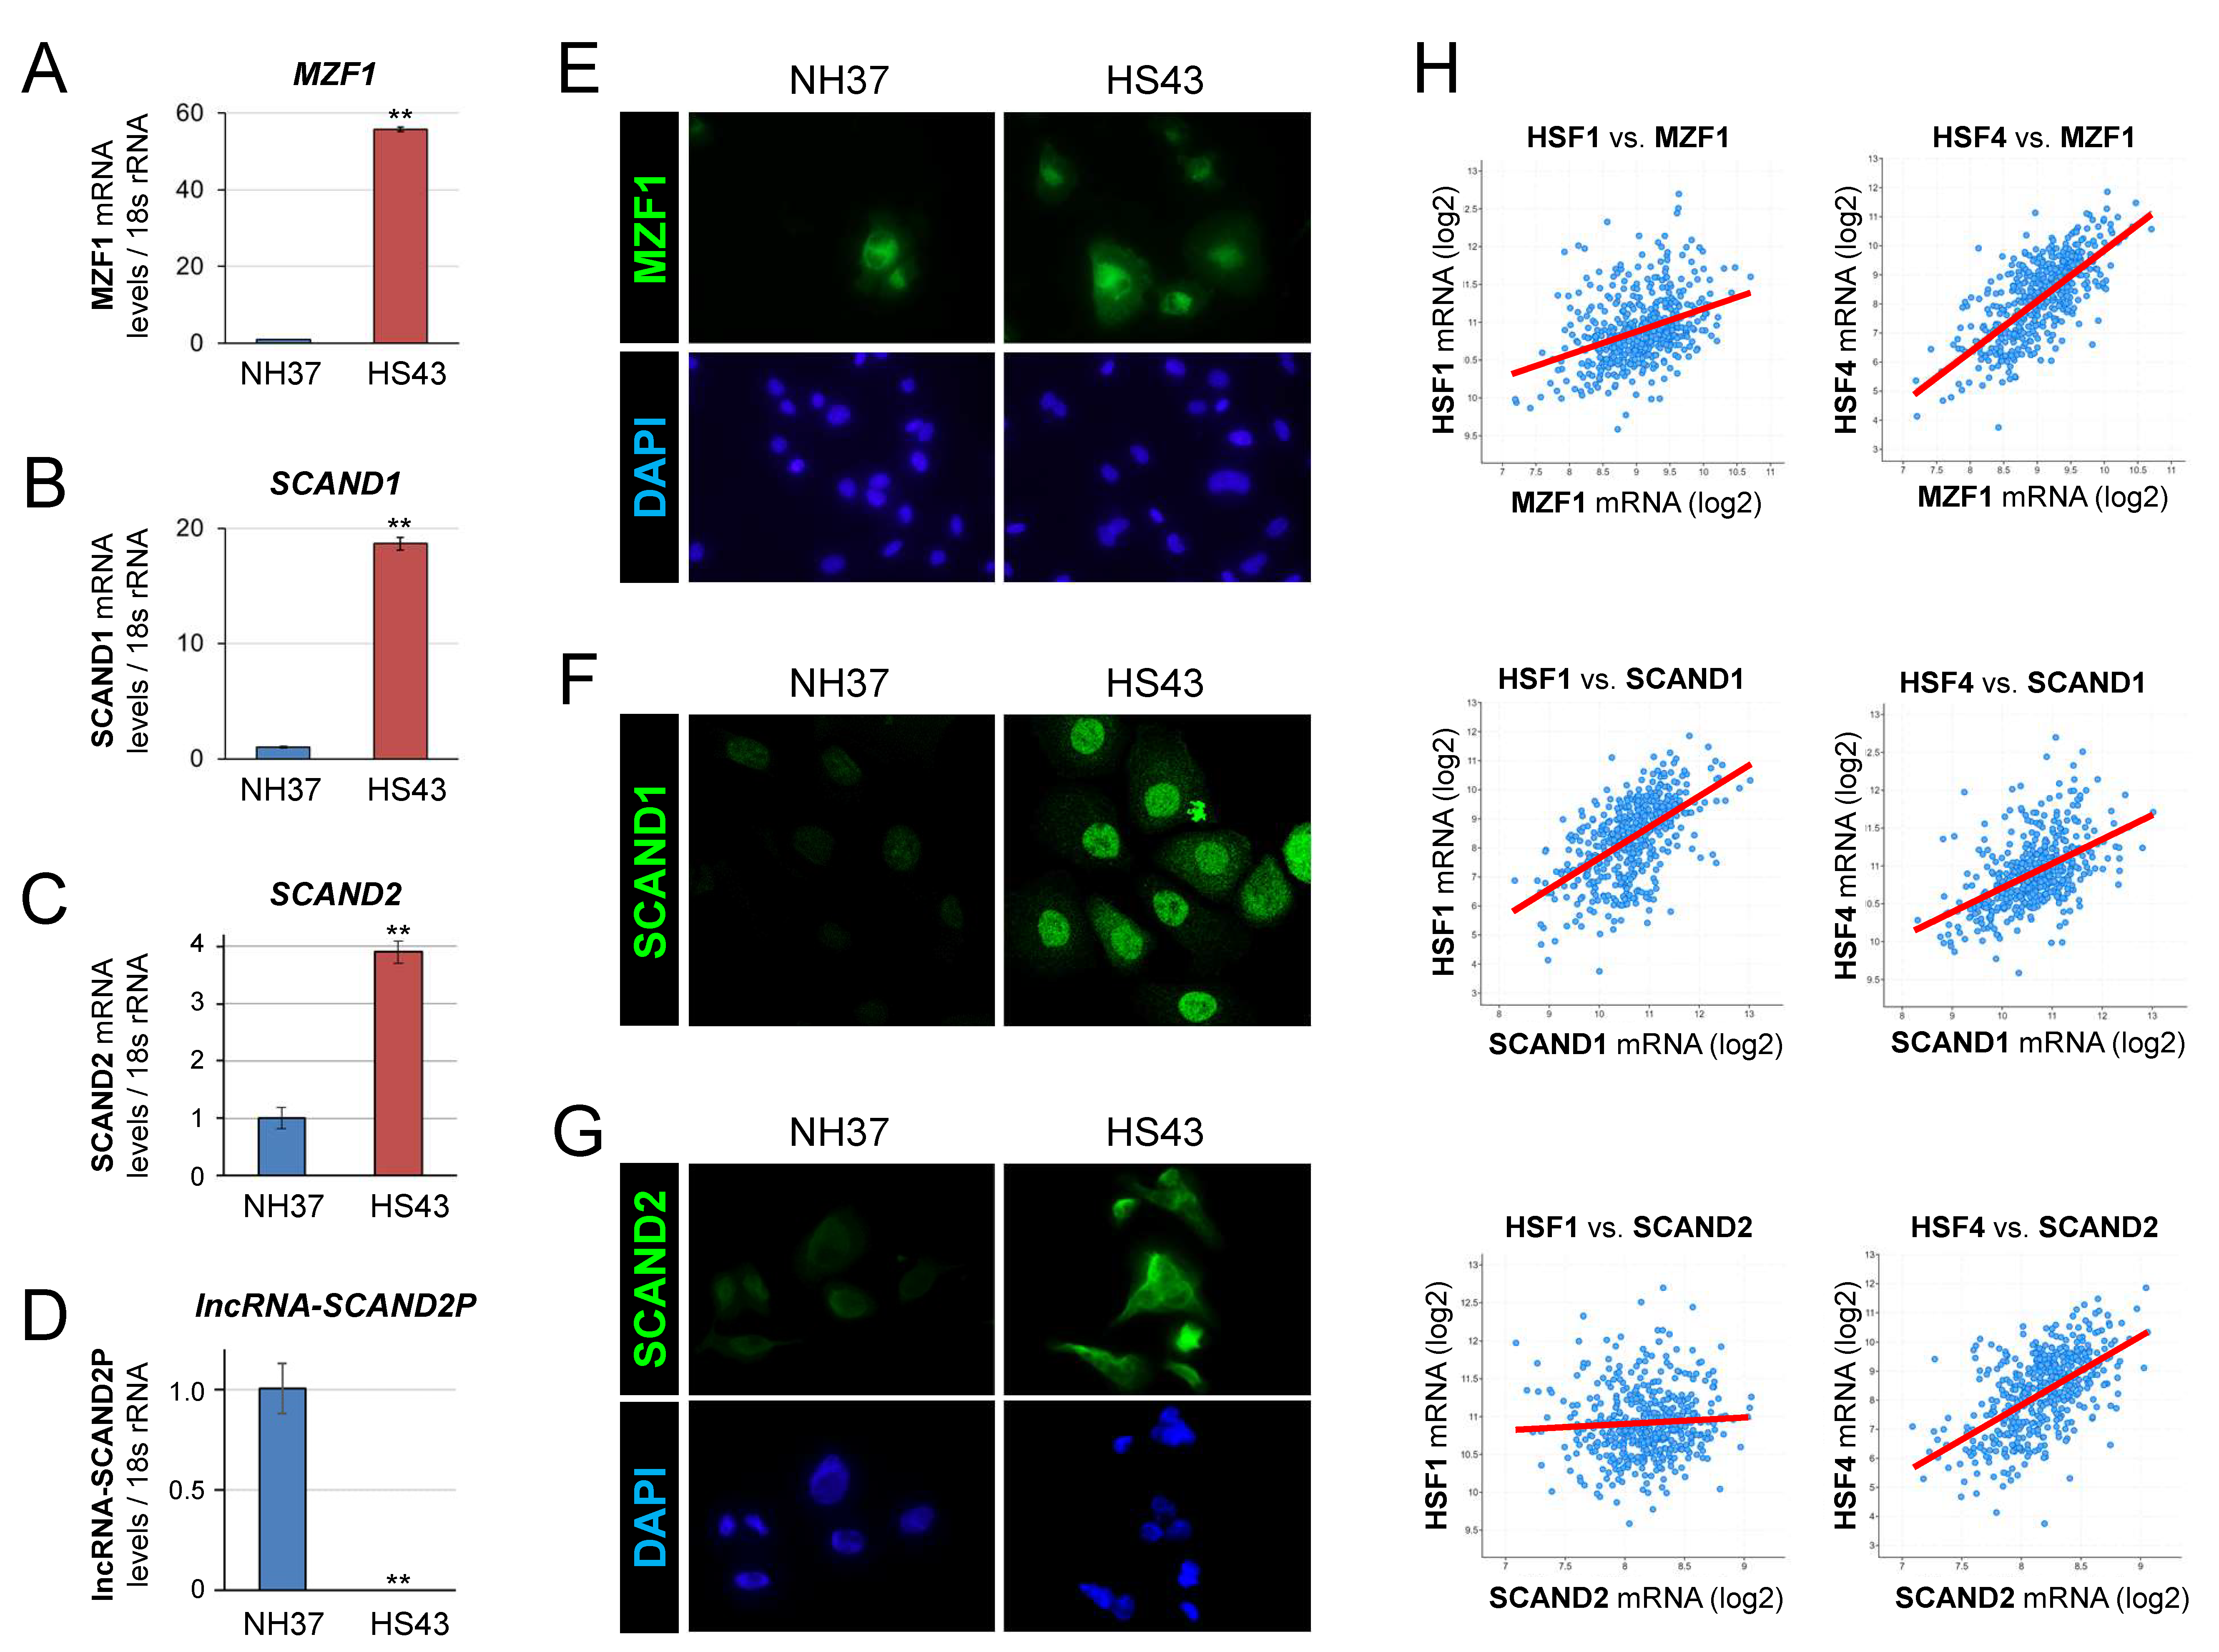
We then asked whether MZF1, SCAND1, and SCAND2 mRNA expression was inducible by heat shock stress (HSS). MZF1, SCAND1, and SCAND2 mRNA expression was significantly induced by HSS in DU-145 cells (Figure 3A–C and Figure S3). On the other hand, the expression level of lncRNA-SCAND2P was significantly reduced upon HSS (Figure 3D and Figure S3). These data suggested that the alternative transcript balance was shifted from lncRNA-SCAND2P to protein-coding SCAND2 mRNA upon cell stress, which potentially regulates alternative splicing.
To examine the stress inducibility of the SCAN-TFs, we next performed immunocytochemistry after HSS. MZF1, SCAND1, SCAND2 expression levels were increased upon HSS in DU-145 cells (Figure 3E–G and Figure S4). We next examined whether the gene expression of SCAN-TFs (MZF1, SCAND1, and SCAND2(P)) was correlated with HSF1 or HSF4 gene expression in prostate cancer specimens derived from patients. SCAND1 and MZF1 gene expression levels were correlated with the degree of gene expression of HSF1 and HSF4 (Figure 3H, Table 2). SCAND2 expression was correlated with the expression of HSF4 but not with HSF1.
These data suggested that these SCAND-TF genes (MZF1, SCAND1, and SCAND2) are highly responsive stress-inducible genes in prostate cancer, whose regulation is intricately mediated by the coordinated action of HSF1 and/or HSF4. Furthermore, cell stress in prostate cancer changes the variant expression of the SCAND2 gene from the lncRNA-SCAND2P to protein-coding SCAND2 mRNA.

2.3. Co-Expression Correlation of SCAN-TF Genes in Prostate Cancer

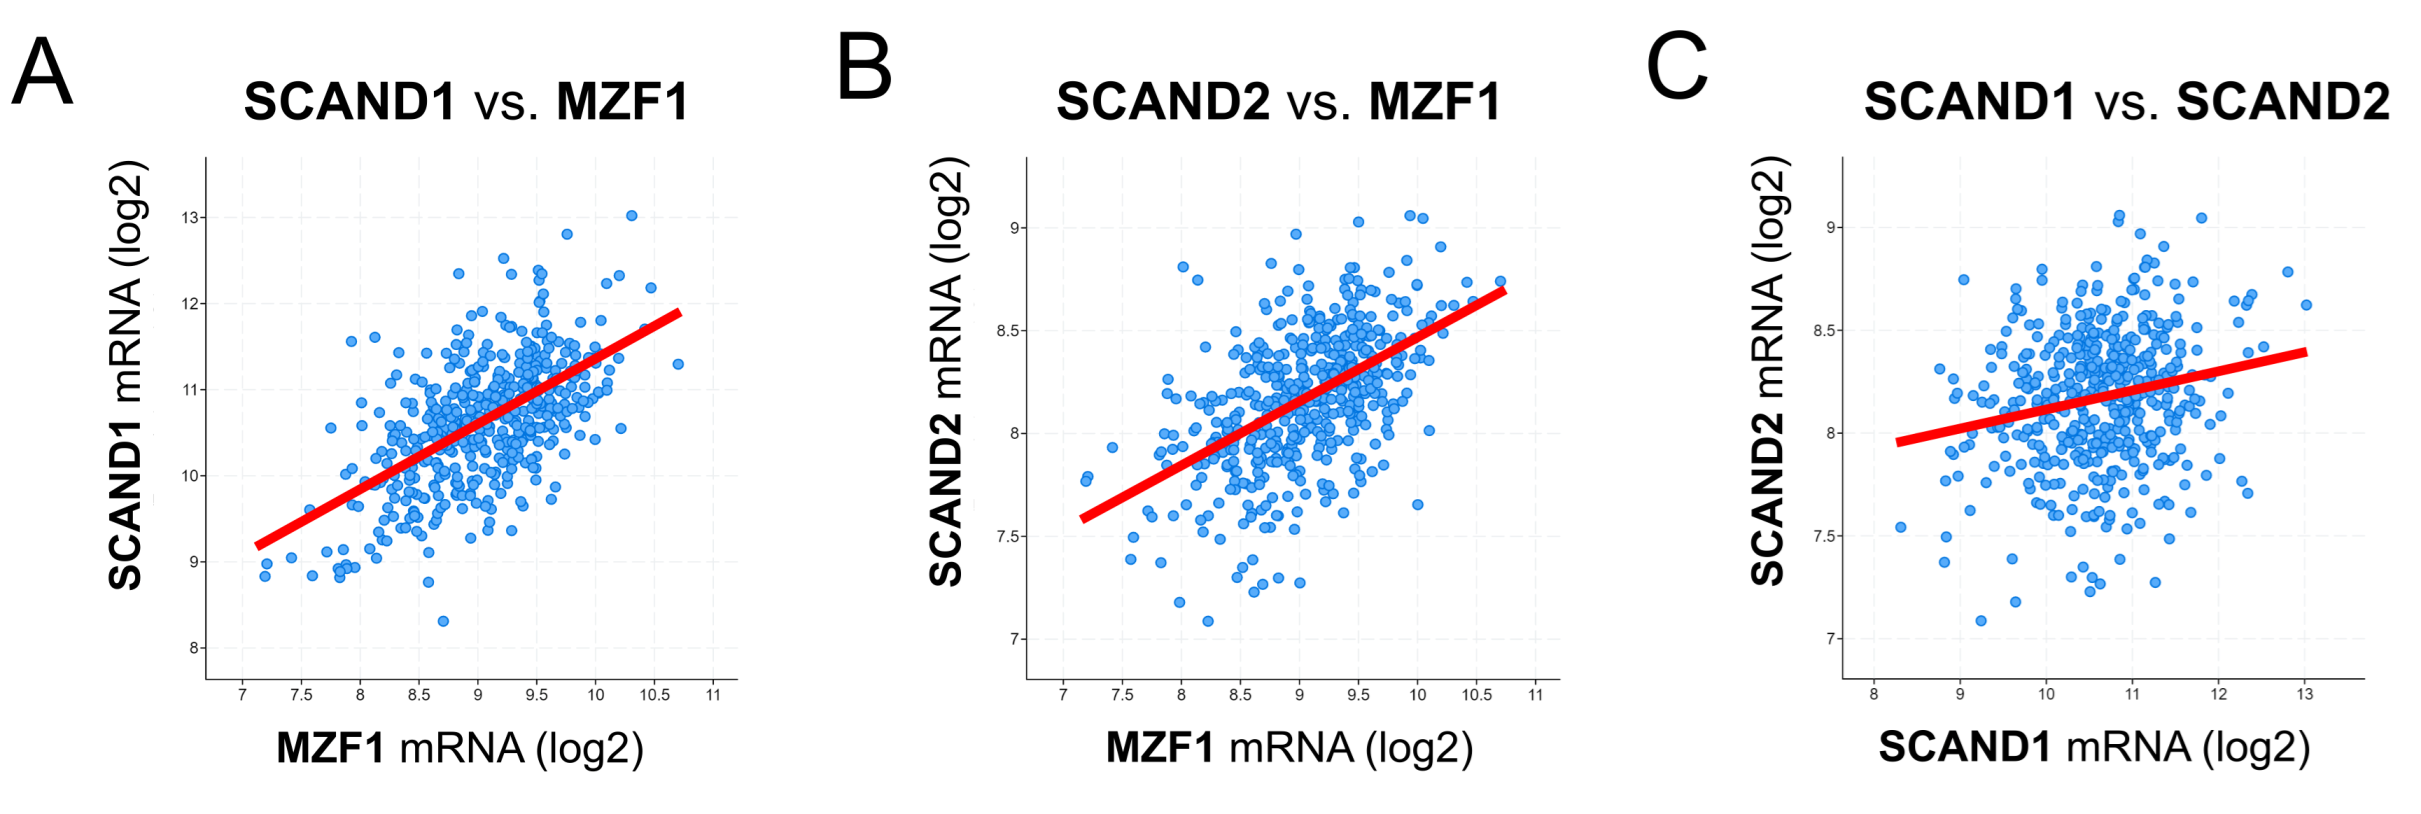
We recently showed that MZF1 and SCAND1 gene expression could mutually induce each other’s expression [43]. Moreover, several MZF1-BSs exist in the promoter regions of SCAND1 and MZF1 genes, as shown in Table 2. We analyzed co-expression correlations of MZF1, SCAND1, and SCAND2 genes in prostate cancer. In prostate adenocarcinoma specimens, the expression of MZF1 was positively correlated with both SCAND1 and SCAND2 RNA expression (Figure 4A–C; Table 3).
Therefore, these data suggested that MZF1 could induce SCAND1 and SCAND2 gene expression in prostate cancer.

2.4. Heat Shock Stress Induces HSF1 and MZF1(ZSCAN6) Binding to HSP90 Genes

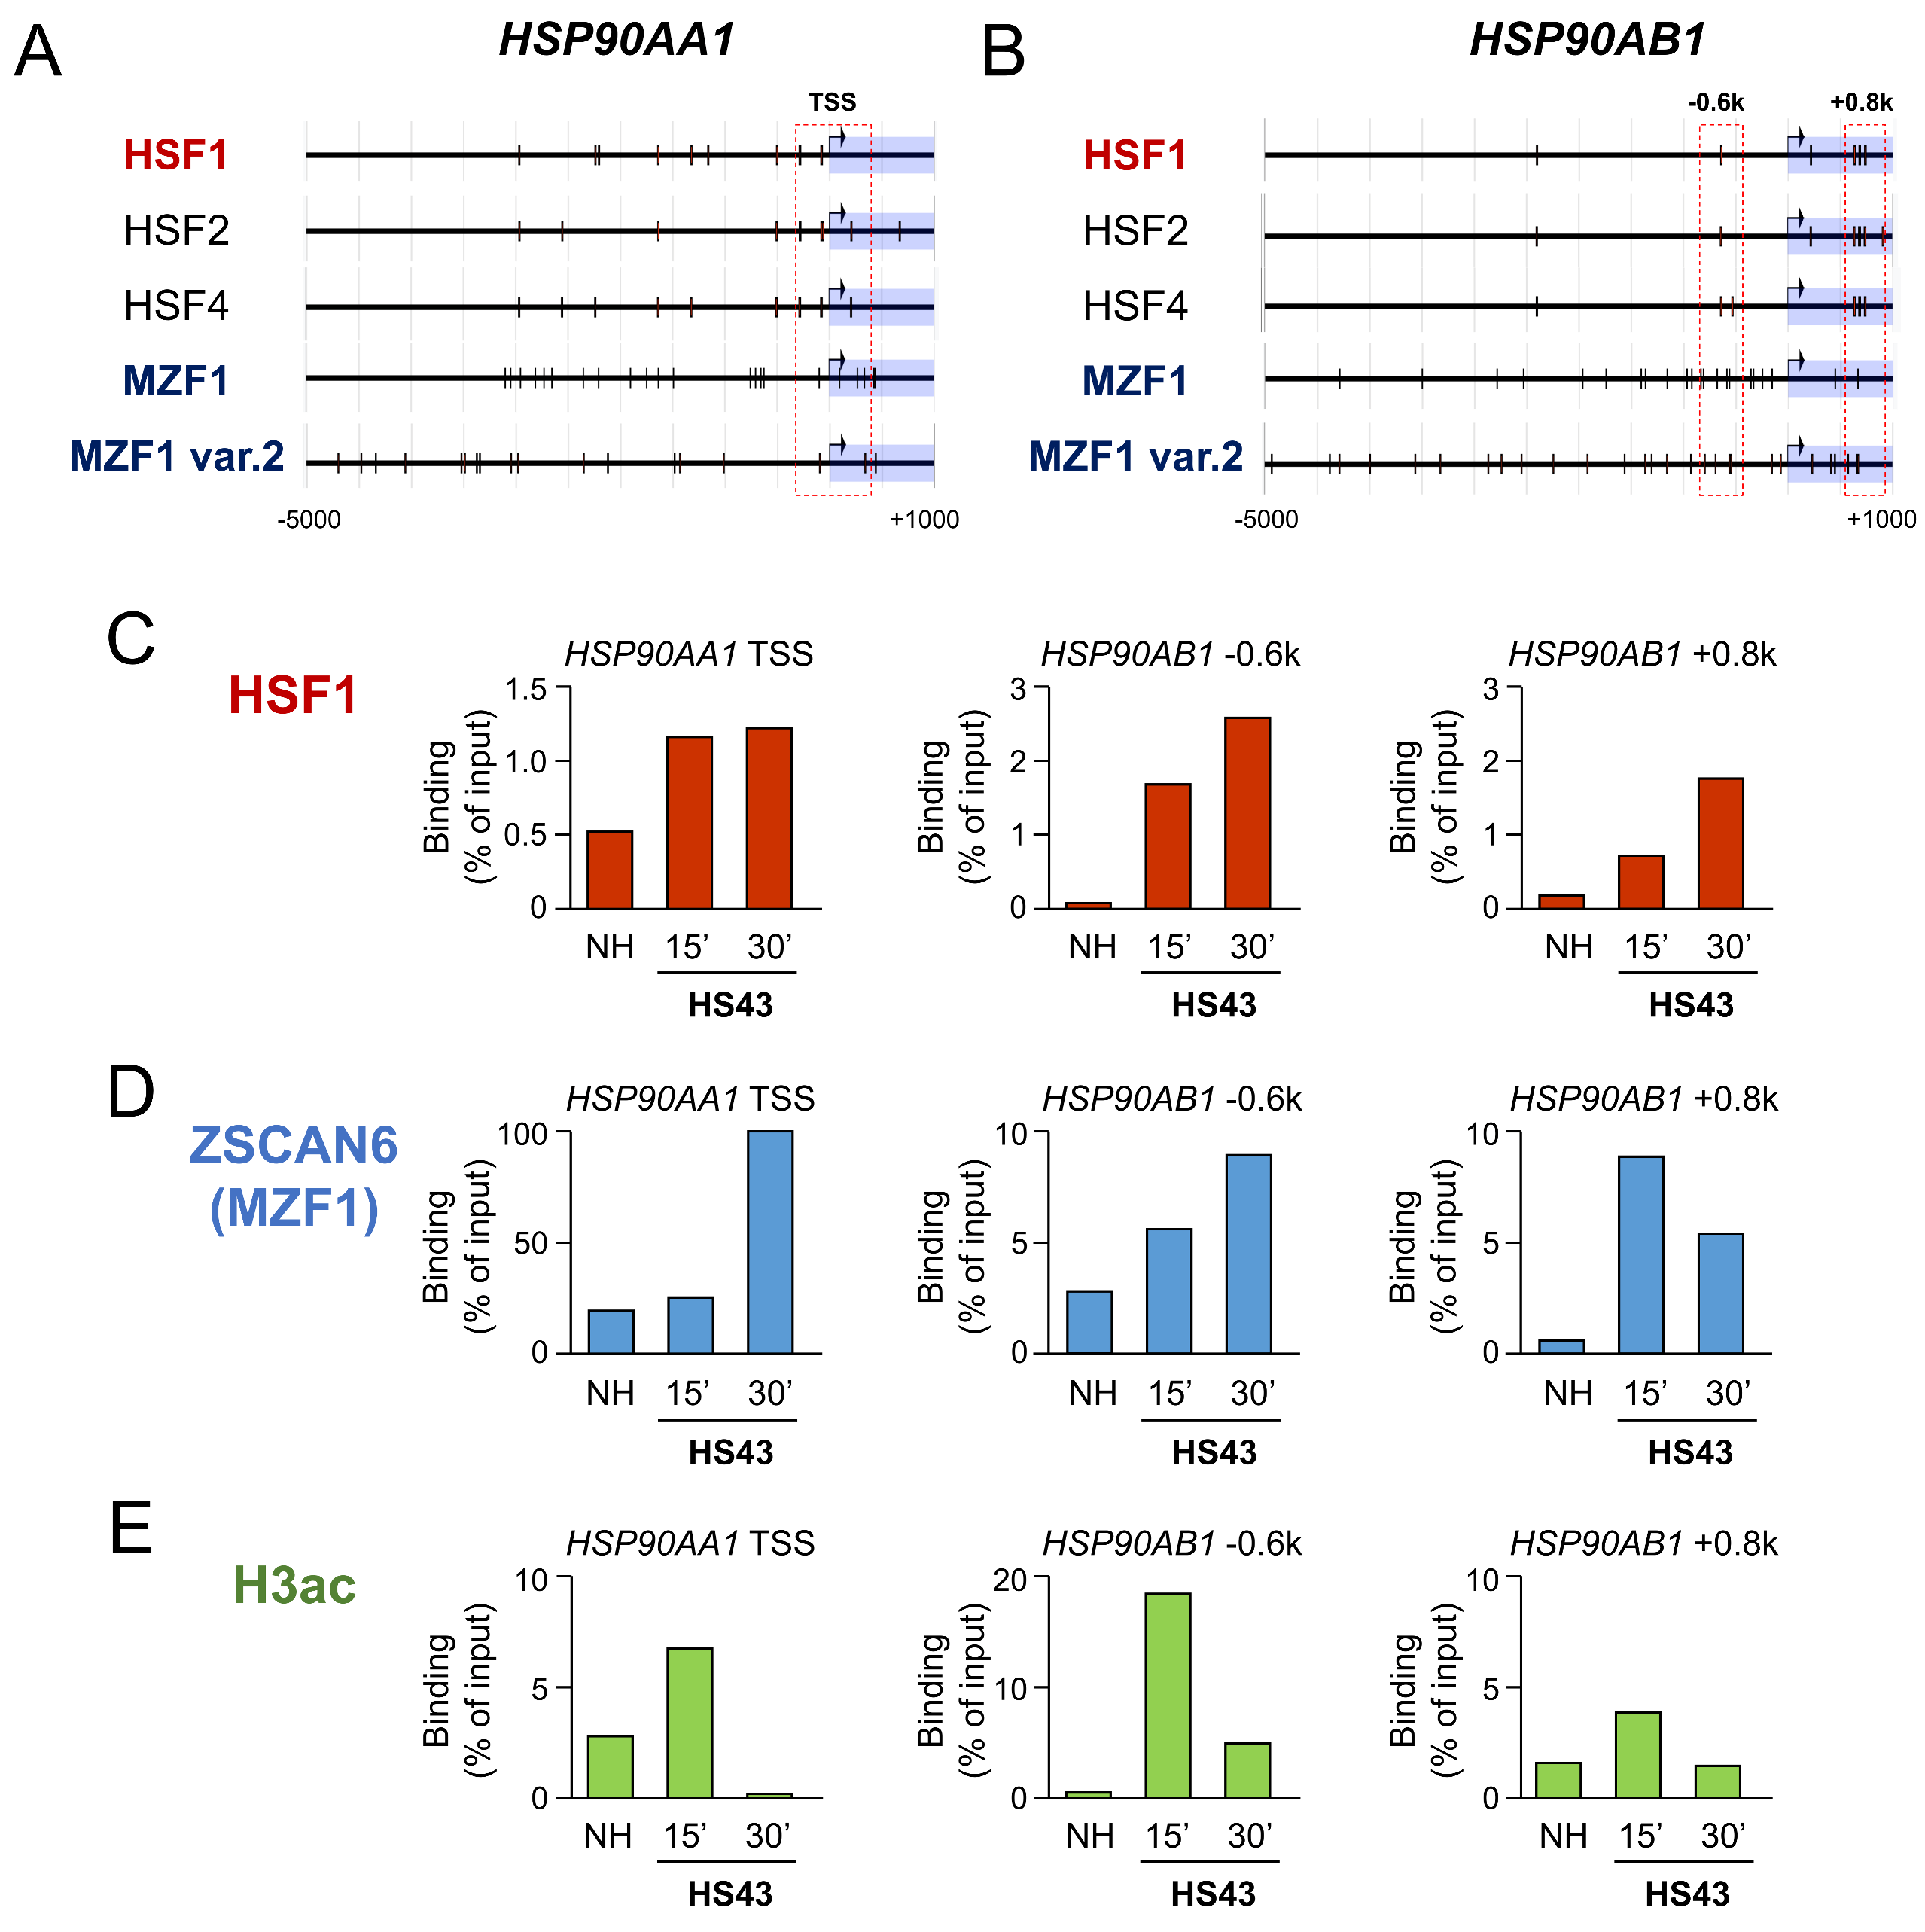
To ask whether HSP90 genes were directly regulated by HSF1 and MZF1/ZSCAN6, we next analyzed promoter regions of HSP90AA1 and HSP90AB1 genes and performed ChIP-qPCR. The HSP90AA1 promoter region (−5000 to +1000) contained 9 sites for HSF1 and 40 binding sites for MZF1. The HSP90AB1 promoter region (−5000 to +1000) contained 8 binding sites for HSF1 and 50 binding sites for MZF1 (Table 4; Figure 5A,B). These data indicated that HSP90 genes could be potential targets for the HSF1 and MZF1-SCAND complex.
We next performed ChIP-qPCR analysis to ask about the direct regulation of HSP90 genes by HSF1 and MZF1(ZSCAN6). The binding of HSF1 to the HSP90AA1 gene promoter region was increased in response to HSS in PC-3 prostate cancer cells (Figure 5C). MZF1(ZSCAN6) binding to the HSP90AB1 gene promoter region was also increased in response to HSS (Figure 5D). Histone H3 acetylation, a marker of transcriptional activation, in the HSP90AA1 gene promoter region was transiently increased in response to HSS in 15 min and then reduced in 30 min (Figure 5E).
These data suggested that HSF1 and MZF1 binding to the HSP90 gene promoter regions could be transiently activating HSP90 genes and repressing them later. Induction of SCAND expression upon HSS and its binding to MZF1 may function to turn off the transcription of HSP90 genes in 30 min.

2.5. MZF1 and SCAND1 Blocks the Heat Shock Response of HSP90

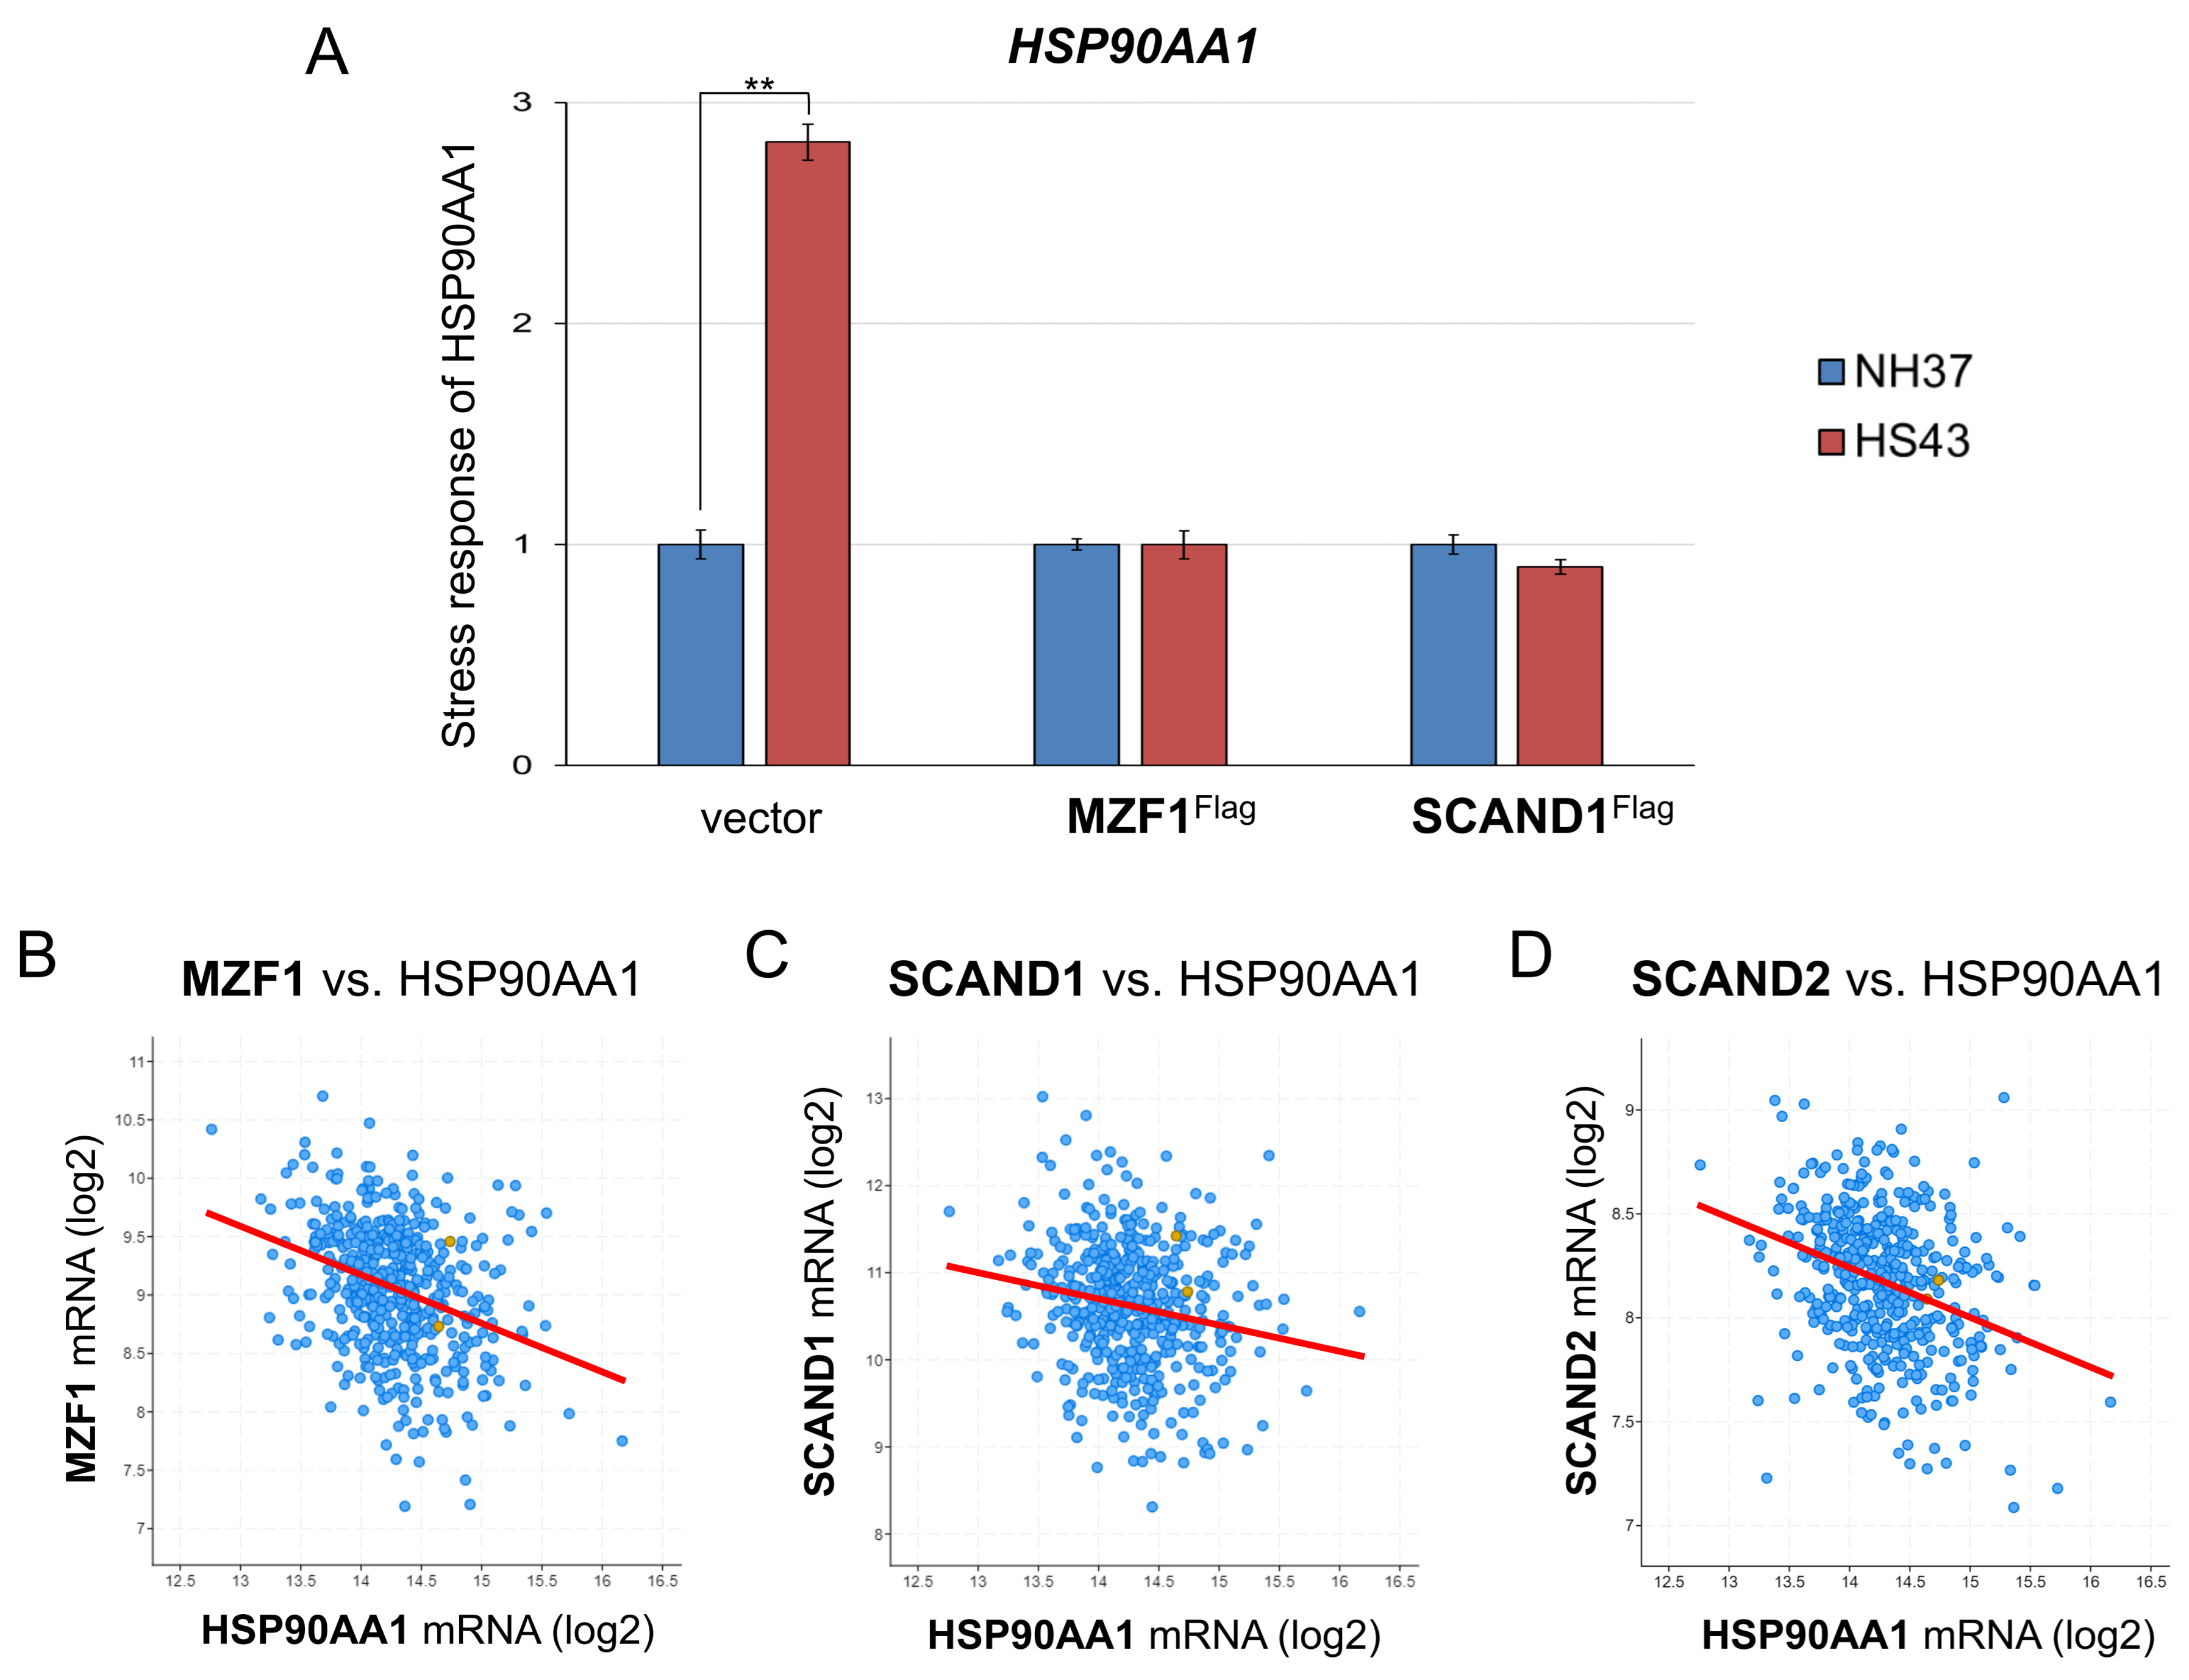
We next examined whether MZF1 and SCAND1 could affect the heat shock response of the HSP90AA1 gene. Indeed, HSP90AA1 mRNA expression was induced by HSS. However, MZF1 or SCAND1 overexpression blocked the HS response of HSP90AA1 gene expression (Figure 6A).
To ask whether HSP90AA1 gene was regulated by transcription factors, including SCAN-TFs and HSFs, we examined their co-expression correlation in prostate adenocarcinoma specimens. HSP90AA1 gene expression was negatively correlated with the gene expression of MZF1(ZSCAN6), SCAND1, SCAND2, and HSF4 in prostate adenocarcinoma specimens (Figure 6B–D; Table 5). HSP90AA1 gene expression was not significantly correlated with the gene expression of HSF1, HSF2, and HSF5 in prostate adenocarcinoma specimens (Table 5).
We next examined whether the expression of other HSP genes is correlated with expression of these SCAN-TFs in addition to HSP90AA1. MZF1, SCAND1, and SCAND2 expressions were negatively correlated with gene expression of HSPA13, HSPA4, HSPA4L, and HSPH1 (Table 6 and Table S2). These data suggested that SCAN-TFs co-repressed multiple HSP genes.
These data indicated that HSP90AA1 gene expression was negatively regulated by MZF1(ZSCAN6), SCAND1, SCAND2, and HSF4 in prostate adenocarcinomas.

2.6. Reduced Expression of SCAND2 and MZF1 Coincide with the Increased HSP90 Expression in Tumor Tissues Compared with Normal Tissues

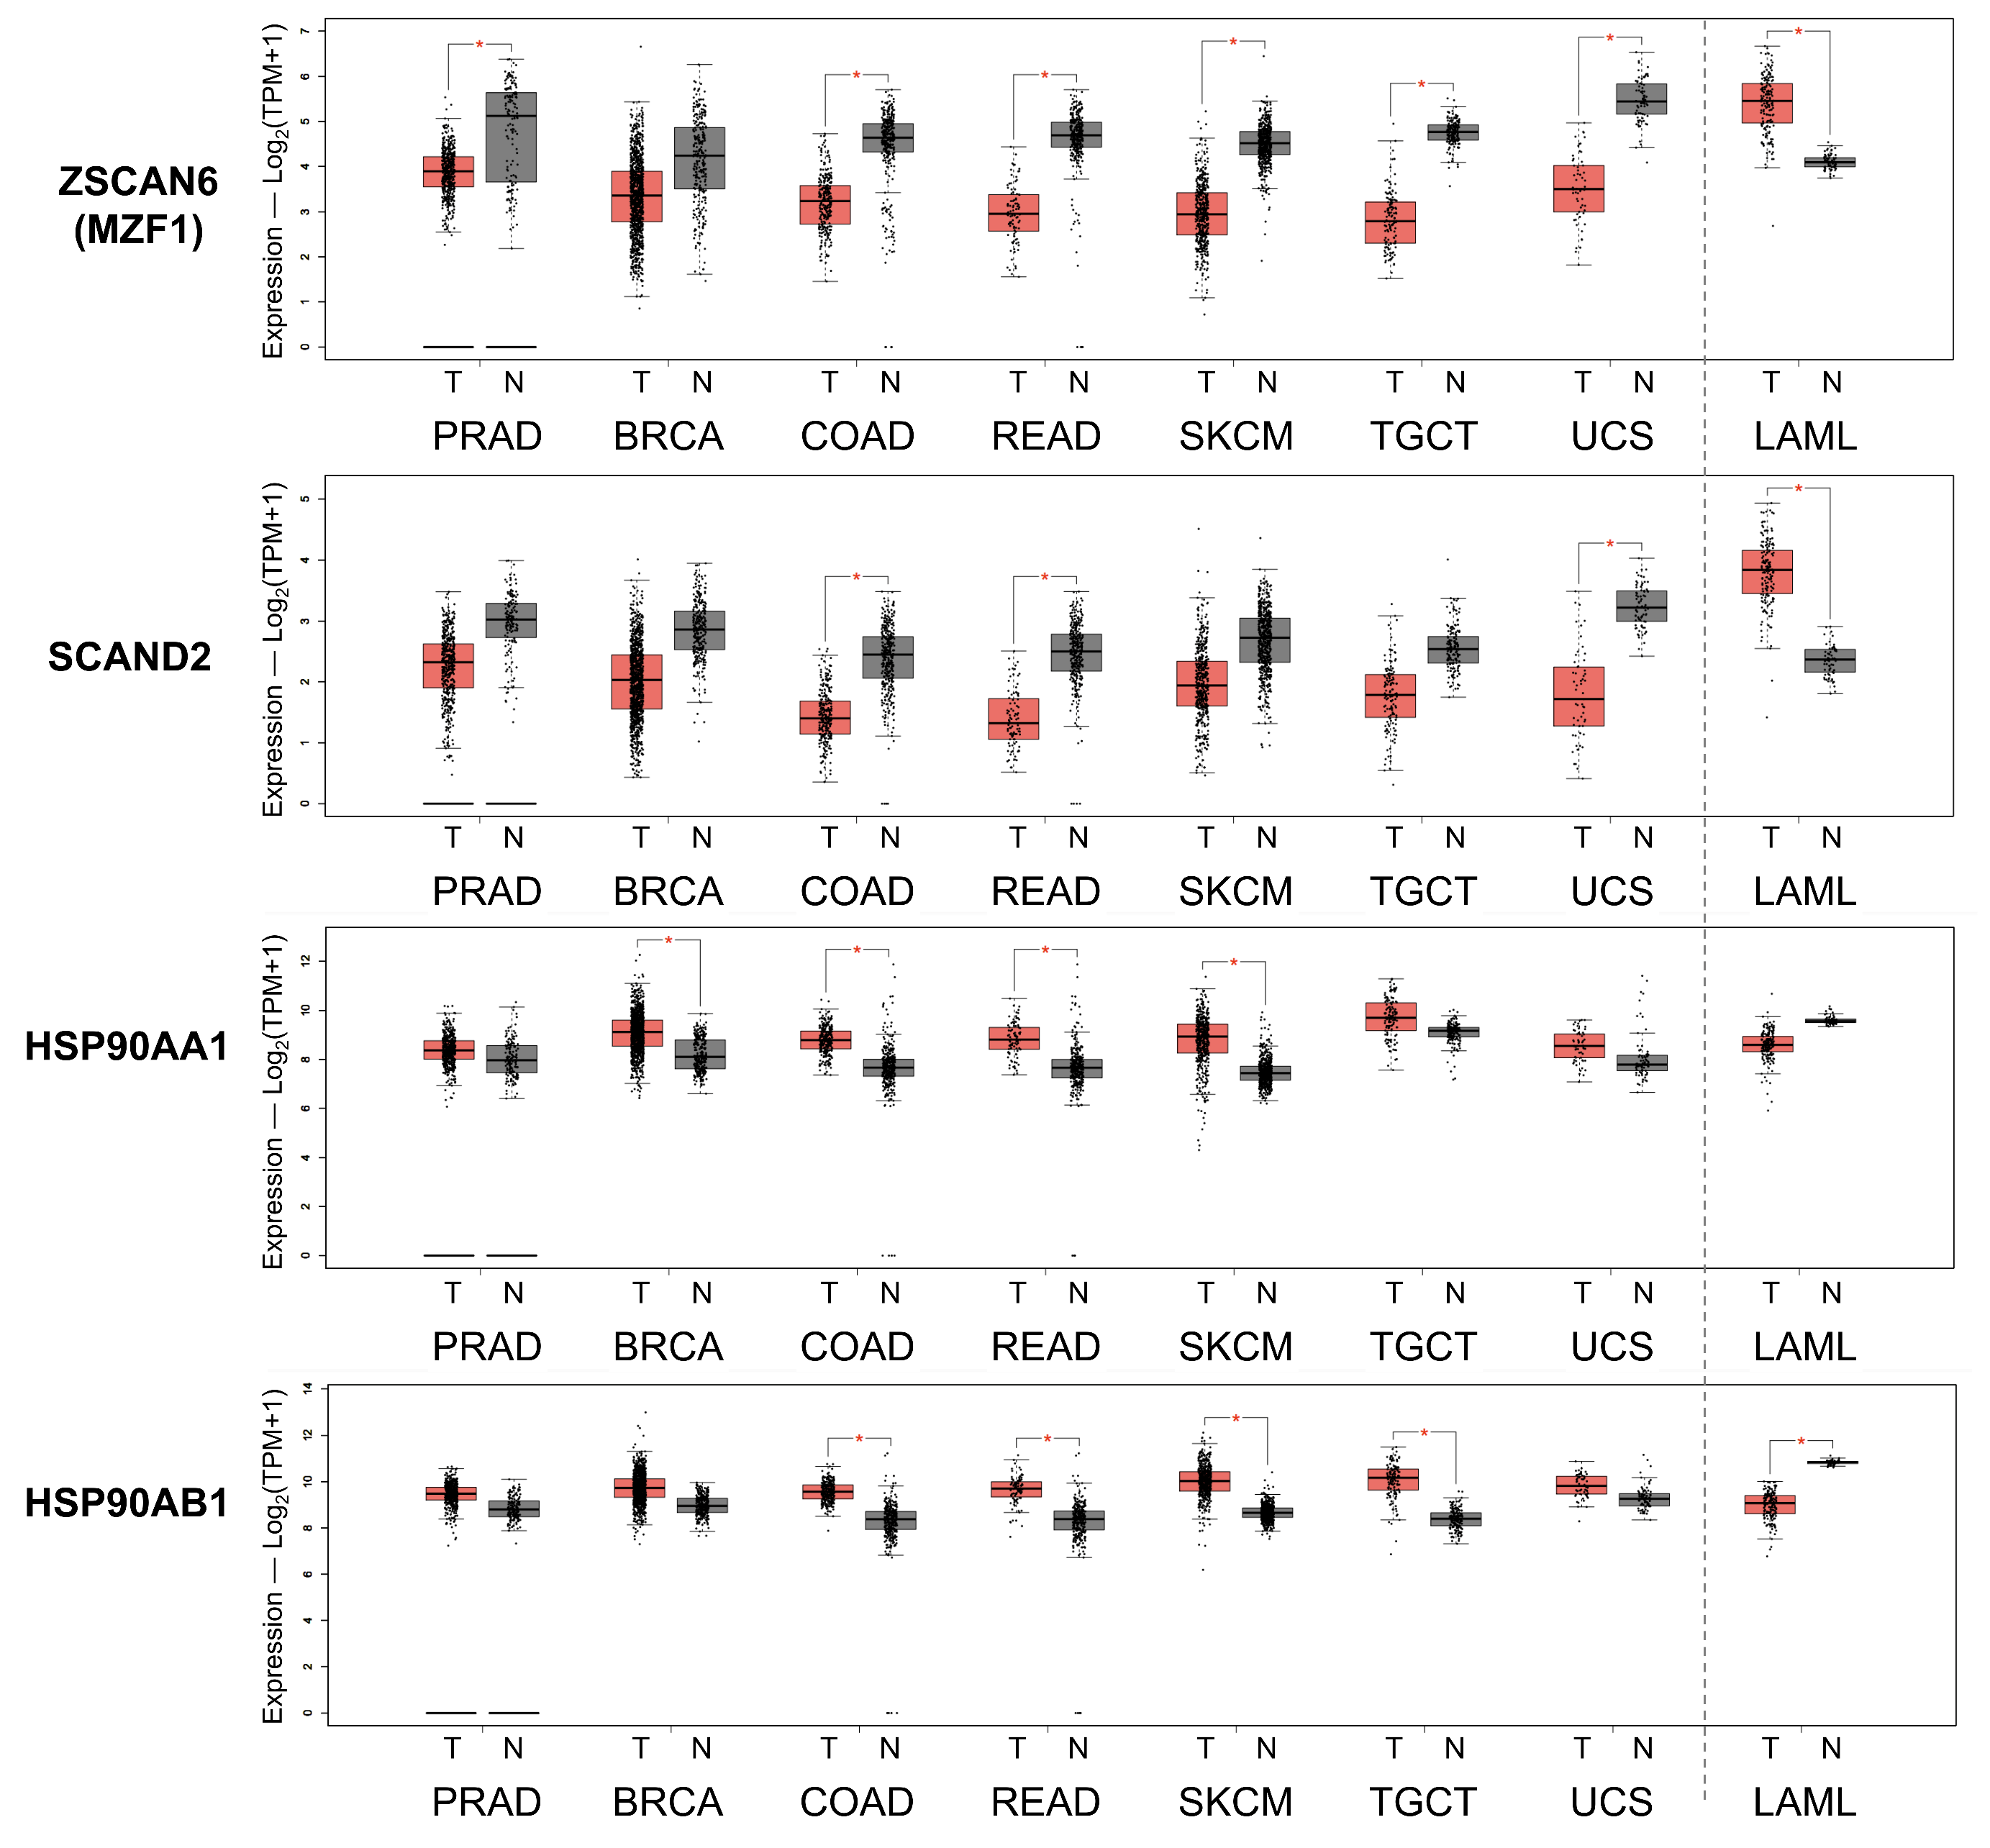
We next hypothesized that the repressing factors SCAND2 and MZF1 were reduced in tumor tissues while HSP90 gene expression was increased in tumor tissues. SCAND2 and MZF1(ZSCAN6) gene expression was lower in prostate adenocarcinoma (PRAD), breast invasive carcinoma (BRCA), colon adenocarcinoma (COAD), rectum adenocarcinoma (READ), skin cutaneous melanoma (SKCM), testicular germ cell tumors (TGCT) and uterine carcinosarcoma (UCS), while HSP90AA1 and HSP90AB1 gene expression was higher in these cancer types compared with paired normal tissues (Figure 7 and Figure S5). Exceptionally, SCAND2 and MZF1(ZSCAN6) gene expression was higher in acute myeloid leukemia (LAML), while the expression levels of HSP90AA1 and HSP90AB1 genes were lower, compared with paired normal tissues.
These data suggested that reduced expression of SCAND2 and MZF1 could result in the elevated expression of HSP90 genes in tumor tissues in many cancer types.

2.7. SCANDs and MZF1(ZSACAN6) Expression Correlates with Enhanced Prognoses Whereas HSP90 Expression Is Correlated with Poor Prognoses in Cancers

We next hypothesized that the repressive transcription factors SCAND1, SCAND2 and MZF1(ZSCAN6) would contribute to enhanced prognosis in cancer patients, whereas high expression of HSP90 genes would likely be involved in a poorer prognosis. High expression levels of SCAND1, SCAND2 and MZF1 genes were significantly correlated with enhanced prognosis of patients suffering from pancreatic ductal adenocarcinoma (DAC) (Figure 8A–C; Table 7). High expression levels of HSP90AA1 and HSP90AB1 (associated with a low MZF1 expression scenario) were significantly correlated with poorer prognosis of patients suffering from pancreatic cancer (Figure 8D–F).
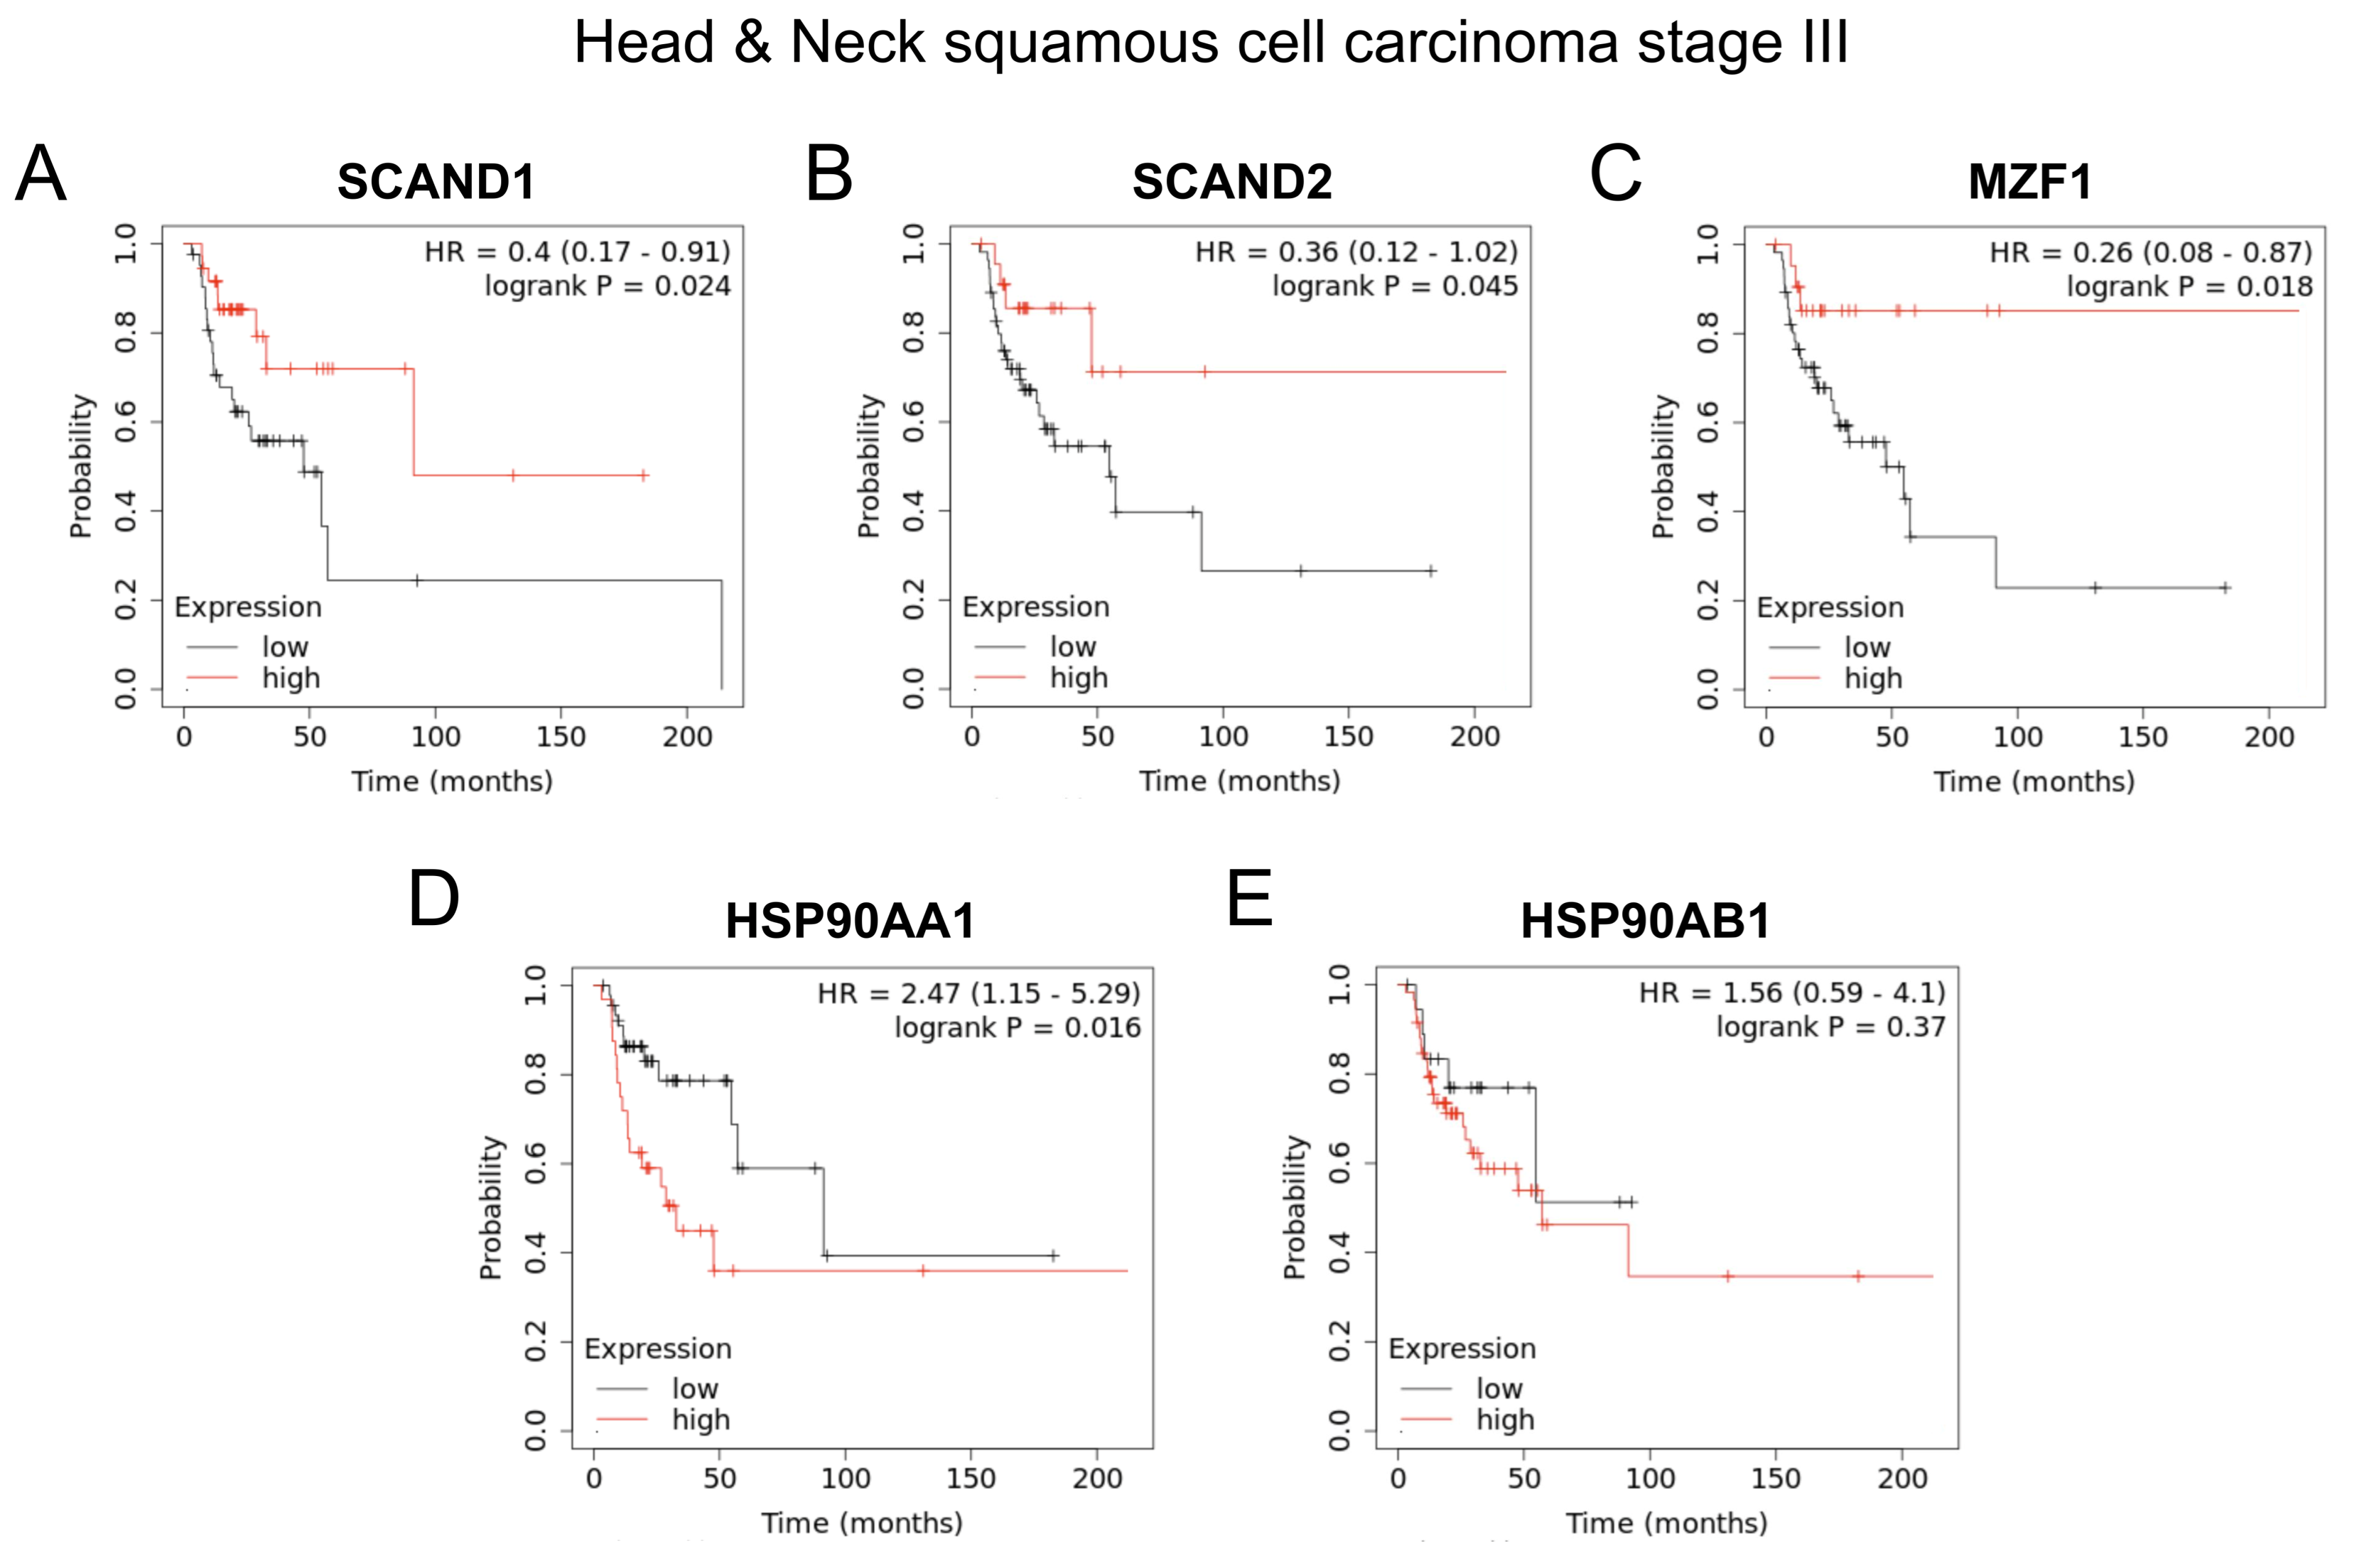
Similarly, high expressions of SCAND2, SCAND1, and MZF1 genes were significantly correlated with enhanced prognosis of patients suffering from stage III head and neck squamous cell carcinoma (SCC) (Figure 9A–C), whereas high expression levels of HSP90AA1 and HSP90AB1 genes were significantly correlated with poorer prognosis of patients suffering from stage III head and neck SCC (Figure 9D,E).
High expression of SCAND2 and MZF1 was significantly correlated with enhanced prognosis of patients suffering from lung adenocarcinoma (Figure S6A–C). Consistent with this, high expression of HSP90AA1 and HSP90AB1 was significantly correlated with poorer prognosis of patients suffering from lung adenocarcinoma (Figure S6D,E).
Moreover, high expression of SCAND2 was correlated with enhanced prognoses in sarcoma and cervical SCC (Table 7).
These data suggested that high expression of SCAND2, SCAND1, and MZF1 genes were superior prognostic markers in several cancer types, including pancreatic cancer, head and neck cancers, lung adenocarcinoma, sarcoma and cervical cancer.

3. Discussion

We have shown that the cell stress-inducible SCAND1 and MZF1 genes repress the stress response of the HSF–HSP system (Figure 1, Figure 2, Figure 3, Figure 4, Figure 5 and Figure 6). SCAND1, SCAND2, and MZF1/ ZSCAN6 are heat-inducible and could form repressing complexes on HSP90 genes (Figure 10) [37,43]. These findings were consistent with the data from clinical tumor specimens. SCAND2 and MZF1 RNA were expressed at higher levels in normal tissues than in paired tumor tissues (Figure 7). In contrast, HSP90 RNA was expressed at higher levels in tumor tissues than in paired normal tissues in many cancer types (Figure 7). These data suggest that SCAND2/MZF1 hetero-oligomers could inhibit the excess stress response of HSP90 expression in normal tissues, whereas loss of expression of these SCAN-TFs could result in the gain of HSP90 in tumor tissues. We showed that high expression of SCAN-TFs (SCAND1, SCAND2, and MZF1) were predictive biomarkers of enhanced prognoses for patients suffering from pancreatic cancer and head and neck cancers (Figure 8 and Figure 9). Moreover, high expression of SCAND2 (and/or lncRNA-SCAND2P) was a predictive biomarker of enhanced prognoses for patients suffering from lung adenocarcinoma, sarcoma, and cervical cancer (Table 7, Figure S6). These data indicate that SCAND/MZF1 repressing complexes are potentially tumor suppressing, contributing to better prognoses of patients suffering from several cancer types.
Our data, for the first time, indicate that SCAND2 RNA expression is a novel biomarker of better prognoses in cancer patients (Table 7, Figure 8 and Figure 9). Only one group has previously reported the existence of the SCAND2 gene [47]. Moreover, SCAND2 has been registered as SCAND2P, a pseudogene for lncRNA (Ref seq ID: NR_004859.1 and NR_003654.2). Gene expression data of SCAND2 (or SCAND2P) were found in many databases. Of note, the protein structure of SCAND2 found in Phosphosite plus is more conserved with the N-terminal region of MZF1(ZSCAN6) than SCAND1 (Figure S1). Moreover, complete coding DNA sequences of SCAND2 mRNA are found in the NCBI database (GenBank ID: AF229246.1 (coding 306 aa, AAG33966.1), AK022844.1 (coding 152 aa, BAB14268.1), and AK290489.1 (coding 152 aa, BAF83178.1)) (Figure 2 and Figure S2). Our research highlights that HSS can shift the transcript balance from the lncRNA to the protein-coding mRNA of SCAND2 (Figure 3 and Figure S3), potentially via changing alternative splicing. SCAND2 and MZF1 RNA were each expressed in normal tissue at higher levels than in tumor tissues (Figure 7), whereas SCAND1 RNA expression did not show this pattern. Therefore, SCAND2 may form more stable hetero-oligomers with MZF1(ZSCAN6) than SCAND1 to repress oncogenic gene expression in tumors. Further functional analysis of SCAND2 is required for this novel gene.
Our data also suggested that cell stress regulates RNA variants of the SCAND2 gene, potentially via alternative RNA splicing, alternative RNA polyadenylation, and/or protein translational control (Figure 2, Figure 3 and Figures S2–S4). Cell stresses, including oxidative stress and cancer therapy-induced stress, have been reported to regulate alternative RNA splicing via the Hu antigen R (HuR), also known as ElavL1 [9,48,49]. We have reported that HSF1 regulates β-catenin RNA, which contains many AU-rich sequences, in mammary cancer cells by controlling HuR/ElavL1 expression [9]. The Hu/Elav RNA-binding protein family, composed of HuR (also known as HuA), HuB, HuC, and HuD), regulate alternative splicing [8,50,51,52], while HuR is the most investigated member that binds to AU-rich sequences of RNA. Cell stress also modulates the function of the splicing regulatory protein RBM4 in translation control [53]. Therefore, alternative expression of SCAND2 RNA variants, including lncRNA-SCAND2P and SCAND2 mRNA, could be regulated by Hu and/or RBM4 RNA-binding proteins under cell-stressed conditions.
Our study also revealed a striking correlation between the expression of HSF1 and the SCAN-TF genes (SCAND1 and MZF1) (Figure 3). Furthermore, we have identified HSF4 as a potential inducer of SCAN-TF gene expression, including SCAND1, SCAND2 and MZF1. HSF4 lacks a leucine zipper 4 (LZ4) domain, resulting in its constitutive trimerization and DNA-binding activity [54]. Several HSF4-BSs were found in the promoter regions of SCAND1, SCAND2, and MZF1 genes (Table 1). Thus, the expression of HSF4 could result in the constitutive expression of SCAND2, SCAND1, and MZF1 without requiring cellular stress. While HSF4 is known to be oncogenic in several cancer types, such as colorectal cancer, hepatocellular carcinoma, and lymphoma [55,56,57], our data suggested that HSF-dependent expression of SCAN-TFs could actually reduce oncogenic gene expression in tumors.
Moreover, our data suggested that the stress-inducible SCAND–MZF1 complex represses the HSP90AA1 gene while also repressing other HSPs and many more stress-responsive genes (Table 6 and Table S2). We have recently shown SCAND1 and MZF1 expression to negatively correlate with EMT driver genes, including ZEB1, CTNNB1 and TGFBR1/2/3, and mitogenic genes encoding kinases in the MEKK–MEK–ERK signaling pathway [43]. Moreover, SCAN-only family genes and MZF1 expression were negatively correlated with the expression of NF-κB signaling molecules and PI3K-AKT signaling molecules. Thus, we have shown that EMT, some oncogenic signaling pathways, and the HSF–HSP gene expression system are all key targets of the SCAND–MZF1 repression complexes.
Our data also suggested that tumors’ stress levels differs among clinical cases (Figure 7). Tumor cells are characteristically exposed to various stresses from the microenvironment, such as immune/inflammatory stress [19], therapeutics [18], hypoxia [22,58,59,60,61], acidification [62,63], hyperthermia [64,65] or heat stress [4,6,19,25,28], endoplasmic reticulum stress [66], nuclear envelope stress [67,68], replication stress [69], oxidative stress [70], mechanical stress, osmotic stress, and genotoxic (DNA damage) [71,72] and proteotoxic stress [1,2,4,73]. Therefore, it might be difficult to determine the types and levels of stresses in each tumor. However, there were strong correlations between the RNA expression of SCAN-TFs and HSP90AA1 in clinical tumor specimens (Figure 6, Figure 7, Figure 8 and Figure 9). These clinical data support the hypothesis that the SCAN-TF complexes repress excessive HSP gene expression and suppress tumors.
In conclusion, we have demonstrated that the cell stress-inducible SCAND and MZF1 repress the stress response in cancer. MZF1 and SCAND1 are mutually inducible and can form a repressive complex on the HSP90 gene promoters. Moreover, cell stress changed the transcript variants from the lncRNA-SCAND2P into protein-coding SCAND2 mRNA. Nevertheless, elevated levels of SCAND2 RNA are novel potential markers of better prognoses in several cancer types, including pancreatic cancer, head and neck cancers, lung adenocarcinoma, sarcoma, and cervical cancer. This effect may ensue from the findings that the SCAND–MZF1 repressive system is important for preventing cancer-related gene expression physiologically while playing a key role in tumor suppression.

4. Materials and Methods

4.1. Cell Culture and Heat Shock Stress

Prostate cancer cell lines DU-145 and PC-3 were provided by ATCC and cultured in DMEM and RPMI medium, respectively, with 10% FBS. For HSS, the medium was replaced with pre-warmed medium at 43 or 37 °C and then put in a water bath at 43 or 37 °C, as described previously [6,28].

4.2. Genome and Promoter Analysis

We used the Subio platform (subioplatform.com, accessed on 20 February 2023) for genome analysis. The human genome (hg38, GRCh38.p14) sequence was downloaded from the UCSC server (hgdownload.soe.ucsc.edu/goldenPath/hg38/chromosomes, accessed on 20 February 2023). We used ‘Find Regions from Seq’ plug-in to seek HSEs (5’-nnAnnTTCnnG-3’ and 5’-GAAnnTTCnnn-3’) in SCAND2P gene. We also used the Eukaryotic Promoter Database (EPD) (epd.epfl.ch//index.php, accessed on 20 February 2023) [68]. Promoter IDs (MZF1_1, SCAND1_1, HSP90AA1_1, and HSP90AB1_1) from −5000 to +1000 bp relative to TSS were analyzed with a cut-off p-value of 0.001. We searched TF-binding motifs using the Library of Transcription Factor Motifs (JASPAR CORE 2018 vertebrates).
To seek HSEs, we used the Eukaryotic Promoter Database (EPD) with a cutoff value of p < 0.001 for MZF1 and SCAND1 genes and the Subio platform for the SCAND2P gene.

4.3. qRT-PCR

Primer pairs for RNA of MZF1, SCAND1, SCAND2, and lncRNA-SCAND2P were designed to cover all transcript variants with the assistance of Primer3Plus (Table S1, Figure S2 and Figure 2). The qRT-PCR was performed as previously described [37,74]. To analyze MZF1 and SCAND1 RNA, total RNA was prepared with DNase I treatment using RNeasy columns (Qiagen, Hilden, Germany). Synthesis of cDNA was carried out using the QuantiTect kit (Qiagen)and a mixture of oligo dT and random primers, then diluted 5-fold in 10 mM Tris-Cl and 0.1 mM EDTA buffer. A step dilution of the cDNA pool was prepared as a standard for relative expression. Aliquots of cDNA (4–10 µL), 0.25 µM of each primer and 10 µL SYBR green 2× Master Mix (Applied Biosystems, Waltham, MA, USA) were mixed and made up to a 20 µL reaction mixture. The qPCR and melting curve analyses were performed using the StepOnePlus Realtime PCR system (Applied Biosystems, Waltham, MA, USA). To analyze SCAND2 mRNA and lncRNA, total RNA was extracted from cells using TRI Reagent (MRC, Cincinnati, OH). After DNase I treatment, cDNA was synthesized using an iScript cDNA synthesis kit (Bio-Rad, Hercules, CA, USA) and quantified using Micro-Spectophotometer CB2800 (CLUBIO). To perform the qPCR, 10 µL of SsoAdvanced Universal SYBR Green Supermix (2×) (Bio-Rad), 0.25 µM of each primer, and 100 ng of cDNA were mixed and made up to a 20 µL reaction mix volume. The qPCR and melting curve analyses were performed using a CFX96 Realtime PCR system (Bio-Rad).

4.4. Plasmids and Transfection

We used pcDNA3.1 (as a control), pcDNA3/MZF1Flag, and pCMV6/SCAND1myc-Flag (variant 1, purchased from OriGene, accession number NM_016558) as previously described [37]. DU-145 cells were transfected with these plasmids using Lipofectamine 2000 (Thermo Fisher Scientific, Waltham, MA, USA) and cultured with 0.8 μg/mL geneticin for 2 weeks to establish stable clones as described previously [43].

4.5. ChIP

ChIP-qPCR was performed as previously described [37]. Briefly, PC-3 cells were cultured in 150 mm dishes and heat-shocked for 0, 15, and 30 min. ChIP was performed using a magnetic beads-based ChIP assay kit (Merck/Millipore, Kenilworth, NJ, USA). Briefly, endogenous proteins/DNA were cross-linked with 5% formaldehyde. Cells were collected by cell scrapers, centrifuged at 600× g for 5 min and resuspended in a ChIP buffer (10 mM Tris, pH 8.0, 200 mM KCl, 1 mM CaCl2, 0.5% NP-40) containing a protease phosphatase inhibitor cocktail (Sigma-Aldrich, Burlington, MA, USA). Cells were treated with 3 cycles of sonication on ice with a sonicator. One cycle was a 5 sec sonication with a 15 sec interval at 100% power. OD260 was measured to obtain brief reference DNA concentrations. Sonicated cells containing 10–20 μg DNA or 1 × 10⁶ cells were treated with MNase at a final concentration of 100 unit/mL in 500 μL of ChIP buffer and incubated at 37 °C for 40 min, then centrifuged at 15,000× g at 4 °C for 10 min. Sheared chromatin DNA in the supernatants was analyzed by 2% agarose gel electrophoresis. For antibody-beads preparation, 20 µL M280 sheep anti-rabbit IgG magnetic beads (Thermo Fisher Scientific) with 2 µg antibodies against MZF1 (C10502, Assay Biotechnology, Fremont, CA, USA), HSF1 (#4356, Cell Signaling Technology, Danvers, MA, USA) or acetylated histone H3 (06-599, Millipore) were mixed in 500 µL ChIP buffer and then rotated for 3 h or overnight. DNA was purified using a QIAquick PCR Purification Kit (Qiagen). Primer pairs for ChIP-qPCR were designed using EPD and Primer3Plus as previously described [37] and listed (Table 8). The qPCR was performed as described above.

4.6. Immunocytochemistry and Confocal Laser Scanning Microscopy (CLSM)

Immunocytochemistry and CLSM were performed as previously described [74,75]. Cells were cultured on 12 mm round coverslips coated with poly-D-Lysine/Laminin (BD Bioscience, Franklin Lakes, NJ). Cells were fixed with 4% paraformaldehyde for 20 min, then permeabilized with 0.1% Triton X-100 in PBS for 10 min. Cells were incubated in a blocking buffer containing 1% bovine serum albumin (for MZF1 and SCAND2) or, alternatively, 3% normal goat serum (for SCAND1) in PBS for 30 min, incubated with primary antibodies at 4 °C overnight and then with secondary antibodies at RT for 1 h in the blocking buffer. Cells were washed thrice with PBS for 5 min between the steps. Cells were mounted within ProLong Gold Antifade Mountant (Thermo Fisher Scientific). Fluorescence images were acquired using Axio Vision CLSM (Zeiss, Oberkochen, Germany) with an AxioCam MR3 (Zeiss) camera for SCAND1, and alternatively, FSX100 inverted microscope (Olympus, Tokyo, Japan) for MZF1 and SCAND2. We used antibodies against MZF1 (C10502, Rb pAb, Assay Biotechnology, Fremont, CA), SCAND1 (ab64828, Rb pAb, Abcam), SCAND2 (5F1, H00054581-M02, Ms mAb, Thermo Fisher Scientific), and anti-rabbit IgG conjugated with Alexa Fluor 488 (Thermo Fisher Scientific).

4.7. Co-Expression Analysis

A data set of prostate adenocarcinomas (Project ID: TCGA-PRAD, PanCancer Atlas; 494 patients/samples) was analyzed with Spearman’s rank correlation coefficient of co-expression using cBioPortal [76,77].

4.8. Gene Expression Profiling of Tumors vs. Paired Normal Tissues

The gene expression profile across tumor samples and paired normal tissues was analyzed using GEPIA2 (gepia2.cancer-pku.cn) to draw box-whisker-scatter plots [78]. Tumor samples from TCGA PanCancer Atlas (gdc.cancer.gov/about-data/publications/pancanatlas, accessed on 20 October 2022) were matched with TCGA normal samples and GTEx data (gtexportal.org, accessed on 20 December 2022) (Table S3) [79]. The p-value cutoff was 0.01 as default. Graphs were expressed as a log scale.

4.9. Kaplan–Meier Analysis

Kaplan–Meier plotting from RNA-seq data was performed using KM plotter (kmplot.com/analysis, accessed on 20 October 2022) [80]. Data from TCGA PanCancer Atlas were analyzed, including the overall survival of patients suffering from pancreatic ductal adenocarcinoma (n = 177), head and neck squamous cell carcinoma (stage III) (n = 78), lung adenocarcinoma (n = 504), sarcoma (n = 259), and cervical SCC (n = 304) with auto-select best cutoff.

4.10. Statistics

Values of two groups were compared with an unpaired Student’s t-test. Values of p < 0.05 or < 0.01 were considered to indicate statistical significance unless otherwise specified. Data were expressed as Mean ± SD unless otherwise specified.

Supplementary Materials

The supporting information can be downloaded at https://www.mdpi.com/article/10.3390/ijms24065168/s1.

Author Contributions

T.E. conceptualized and administered the project. T.E. and S.K.C. provided resources. T.E., M.S. and H.K. provided methodology. T.E., S.K.C. and M.S. acquired funding. T.E., M.S., K.Y. and H.K. investigated and validated experiments. T.E. and M.S. utilized software, analyzed clinical data, performed formal analysis, and visualized data. T.E. curated and interpreted the data. S.K.C., T.E., K.Y. and H.K. supervised and mentored. T.E. and M.S. wrote a draft of the manuscript. T.E. and S.K.C. reviewed and edited the manuscript. All authors have read and agreed to the published version of the manuscript.

Funding

T.E. was supported by JSPS Kakenhi grants 22F22409-TE/MS, 22H03511-HO, 21H03119-TY, 21K08902-HY, 20K09904-CS, 20H03888-HN, 20K20611-MT and the Wesco Scientific Promotion Foundation. M.S. was supported by the Japan Society for the Promotion of Science (JSPS) International Research Fellowship in Japan. S.K.C. was supported by NIH grants R01CA176326 and CA176326-05.

Institutional Review Board Statement

Not applicable.

Informed Consent Statement

Not applicable.

Data Availability Statement

Data are available at the Eukaryotic Promoter Database (epd.epfl.ch//index.php, accessed on 20 February 2023), TCGA PanCancer Atlas (gdc.cancer.gov/about-data/publications/pancanatlas, accessed on 20 October 2022), GTEx (gtexportal.org/home/datasets, accessed on 20 February 2023), cBioPortal (cbioportal.org/, accessed on 20 October 2022), GEPIA2 (gepia2.cancer-pku.cn, accessed on 20 December 2022), and KM plotter (kmplot.com, accessed on 20 October 2022).

Acknowledgments

We appreciate Hotaka Kawai, Kuniaki Okamoto, Kisho Ono, and Thomas Prince for useful discussion, mentorship, technical assistance, and lab management. The last figure was generated using BioRender.

Conflicts of Interest

The authors declare no conflict of interest.

References

  1. Morimoto, R.I. The heat shock response: Systems biology of proteotoxic stress in aging and disease. Cold Spring Harb. Symp. Quant. Biol. 2011, 76, 91–99. [Google Scholar] [CrossRef]
  2. Gomez-Pastor, R.; Burchfiel, E.T.; Thiele, D.J. Regulation of heat shock transcription factors and their roles in physiology and disease. Nat. Rev. Mol. Cell Biol. 2018, 19, 4–19. [Google Scholar] [CrossRef] [PubMed]
  3. Akerfelt, M.; Morimoto, R.I.; Sistonen, L. Heat shock factors: Integrators of cell stress, development and lifespan. Nat. Rev. Mol. Cell Biol. 2010, 11, 545–555. [Google Scholar] [CrossRef]
  4. Murshid, A.; Eguchi, T.; Calderwood, S.K. Stress proteins in aging and life span. Int. J. Hyperth. 2013, 29, 442–447. [Google Scholar] [CrossRef] [PubMed]
  5. Prince, T.L.; Lang, B.J.; Guerrero-Gimenez, M.E.; Fernandez-Munoz, J.M.; Ackerman, A.; Calderwood, S.K. HSF1: Primary Factor in Molecular Chaperone Expression and a Major Contributor to Cancer Morbidity. Cells 2020, 9, 1046. [Google Scholar] [CrossRef] [PubMed]
  6. Eguchi, T.; Sogawa, C.; Ono, K.; Matsumoto, M.; Tran, M.T.; Okusha, Y.; Lang, B.J.; Okamoto, K.; Calderwood, S.K. Cell Stress Induced Stressome Release Including Damaged Membrane Vesicles and Extracellular HSP90 by Prostate Cancer Cells. Cells 2020, 9, 755. [Google Scholar] [CrossRef] [PubMed]
  7. Ciocca, D.R.; Arrigo, A.P.; Calderwood, S.K. Heat shock proteins and heat shock factor 1 in carcinogenesis and tumor development: An update. Arch. Toxicol. 2013, 87, 19–48. [Google Scholar] [CrossRef] [PubMed]
  8. Eguchi, T.; Lang, B.J.; Murshid, A.; Prince, T.; Gong, J.; Calderwood, S.K. Regulatory roles for Hsp70 in cancer incidence and tumor progression. In Frontiers in Structural Biology; Galigniana, M.D., Ed.; Bentham Science: Sharjah, United Arab Emirates, 2018; Volume 1, pp. 1–22. [Google Scholar]
  9. Chou, S.D.; Murshid, A.; Eguchi, T.; Gong, J.; Calderwood, S.K. HSF1 regulation of beta-catenin in mammary cancer cells through control of HuR/elavL1 expression. Oncogene 2015, 34, 2178–2188. [Google Scholar] [CrossRef]
  10. Gong, J.; Weng, D.; Eguchi, T.; Murshid, A.; Sherman, M.Y.; Song, B.; Calderwood, S.K. Targeting the hsp70 gene delays mammary tumor initiation and inhibits tumor cell metastasis. Oncogene 2015, 34, 5460–5471. [Google Scholar] [CrossRef]
  11. Trepel, J.; Mollapour, M.; Giaccone, G.; Neckers, L. Targeting the dynamic HSP90 complex in cancer. Nat. Rev. Cancer 2010, 10, 537–549. [Google Scholar] [CrossRef]
  12. Schopf, F.H.; Biebl, M.M.; Buchner, J. The HSP90 chaperone machinery. Nat. Rev. Mol. Cell Biol. 2017, 18, 345–360. [Google Scholar] [CrossRef] [PubMed]
  13. Tran, M.T.; Okusha, Y.; Feng, Y.; Sogawa, C.; Eguchi, T.; Kadowaki, T.; Sakai, E.; Tsukuba, T.; Okamoto, K. A novel role of HSP90 in regulating osteoclastogenesis by abrogating Rab11b-driven transport. Biochim. Biophys. Acta Mol. Cell Res. 2021, 1868, 119096. [Google Scholar] [CrossRef] [PubMed]
  14. Furuta, K.; Eguchi, T. Roles of Heat Shock Proteins on Antigen Presentation. In Heat Shock Proteins in Human Diseases; Asea, A.A.A., Kaur, P., Eds.; Springer Nature: Cham, Switzerland, 2020; Volume 21, pp. 275–280. [Google Scholar]
  15. Lu, Y.; Eguchi, T.; Sogawa, C.; Taha, E.A.; Tran, M.T.; Nara, T.; Wei, P.; Fukuoka, S.; Miyawaki, T.; Okamoto, K. Exosome-Based Molecular Transfer Activity of Macrophage-Like Cells Involves Viability of Oral Carcinoma Cells: Size Exclusion Chromatography and Concentration Filter Method. Cells 2021, 10, 1328. [Google Scholar] [CrossRef] [PubMed]
  16. Saini, J.; Sharma, P.K. Clinical, Prognostic and Therapeutic Significance of Heat Shock Proteins in Cancer. Curr. Drug Targets 2018, 19, 1478–1490. [Google Scholar] [CrossRef]
  17. Ono, K.; Eguchi, T.; Sogawa, C.; Calderwood, S.K.; Futagawa, J.; Kasai, T.; Seno, M.; Okamoto, K.; Sasaki, A.; Kozaki, K. HSP-enriched properties of extracellular vesicles involve survival of metastatic oral cancer cells. J. Cell Biochem. 2018, 119, 7350–7362. [Google Scholar] [CrossRef]
  18. Sasaya, T.; Kubo, T.; Murata, K.; Mizue, Y.; Sasaki, K.; Yanagawa, J.; Imagawa, M.; Kato, H.; Tsukahara, T.; Kanaseki, T.; et al. Cisplatin-induced HSF1-HSP90 axis enhances the expression of functional PD-L1 in oral squamous cell carcinoma. Cancer Med. 2022, 12, 4605–4615. [Google Scholar] [CrossRef]
  19. Taha, E.A.; Ono, K.; Eguchi, T. Roles of Extracellular HSPs as Biomarkers in Immune Surveillance and Immune Evasion. Int. J. Mol. Sci. 2019, 20, 4588. [Google Scholar] [CrossRef] [PubMed]
  20. Ono, K.; Sogawa, C.; Kawai, H.; Tran, M.T.; Taha, E.A.; Lu, Y.; Oo, M.W.; Okusha, Y.; Okamura, H.; Ibaragi, S.; et al. Triple knockdown of CDC37, HSP90-alpha and HSP90-beta diminishes extracellular vesicles-driven malignancy events and macrophage M2 polarization in oral cancer. J. Extracell. Vesicles 2020, 9, 1769373. [Google Scholar] [CrossRef]
  21. Eguchi, T.; Ono, K.; Kawata, K.; Okamoto, K.; Calderwood, S.K. Regulatory Roles of HSP90-Rich Extracellular Vesicles. In Heat Shock Protein 90 in Human Diseases and Disorders; Asea, A.A.A., Kaur, P., Eds.; Springer Nature: Cham, Swizerland, 2019; Volume 19, pp. 3–17. [Google Scholar]
  22. Eguchi, T.; Sogawa, C.; Okusha, Y.; Uchibe, K.; Iinuma, R.; Ono, K.; Nakano, K.; Murakami, J.; Itoh, M.; Arai, K.; et al. Organoids with Cancer Stem Cell-like Properties Secrete Exosomes and HSP90 in a 3D NanoEnvironment. PLoS ONE 2018, 13, e0191109. [Google Scholar] [CrossRef]
  23. Lu, Y.; Eguchi, T. HSP Stimulation on Macrophages Activates Innate Immune System. In Heat Shock Proteins in Inflammatory Diseases; Asea, A.A.A., Punit, K., Eds.; Springer Nature: Cham, Switzerland, 2021; Volume 22, pp. 53–68. [Google Scholar]
  24. Sheta, M.; Taha, E.A.; Lu, Y.; Eguchi, T. Extracellular Vesicles: New Classification and Tumor Immunosuppression. Biology 2023, 12, 110. [Google Scholar] [CrossRef]
  25. Anckar, J.; Sistonen, L. Regulation of HSF1 function in the heat stress response: Implications in aging and disease. Annu. Rev. Biochem. 2011, 80, 1089–1115. [Google Scholar] [CrossRef] [PubMed]
  26. Mendillo, M.L.; Santagata, S.; Koeva, M.; Bell, G.W.; Hu, R.; Tamimi, R.M.; Fraenkel, E.; Ince, T.A.; Whitesell, L.; Lindquist, S. HSF1 drives a transcriptional program distinct from heat shock to support highly malignant human cancers. Cell 2012, 150, 549–562. [Google Scholar] [CrossRef]
  27. Chou, S.D.; Prince, T.; Gong, J.; Calderwood, S.K. mTOR is essential for the proteotoxic stress response, HSF1 activation and heat shock protein synthesis. PLoS ONE 2012, 7, e39679. [Google Scholar] [CrossRef] [PubMed]
  28. Eguchi, T.; Calderwood, S.K.; Takigawa, M.; Kubota, S.; Kozaki, K. Intracellular MMP3 Promotes HSP Gene Expression in Collaboration With Chromobox Proteins. J. Cell Biochem. 2017, 118, 43–51. [Google Scholar] [CrossRef]
  29. Tadepally, H.D.; Burger, G.; Aubry, M. Evolution of C2H2-zinc finger genes and subfamilies in mammals: Species-specific duplication and loss of clusters, genes and effector domains. BMC Evol. Biol. 2008, 8, 176. [Google Scholar] [CrossRef] [PubMed]
  30. Edelstein, L.C.; Collins, T. The SCAN domain family of zinc finger transcription factors. Gene 2005, 359, 1–17. [Google Scholar] [CrossRef]
  31. Sander, T.L.; Stringer, K.F.; Maki, J.L.; Szauter, P.; Stone, J.R.; Collins, T. The SCAN domain defines a large family of zinc finger transcription factors. Gene 2003, 310, 29–38. [Google Scholar] [CrossRef]
  32. Schumacher, C.; Wang, H.; Honer, C.; Ding, W.; Koehn, J.; Lawrence, Q.; Coulis, C.M.; Wang, L.L.; Ballinger, D.; Bowen, B.R.; et al. The SCAN domain mediates selective oligomerization. J. Biol. Chem. 2000, 275, 17173–17179. [Google Scholar] [CrossRef]
  33. Williams, A.J.; Blacklow, S.C.; Collins, T. The zinc finger-associated SCAN box is a conserved oligomerization domain. Mol. Cell. Biol. 1999, 19, 8526–8535. [Google Scholar] [CrossRef]
  34. Eguchi, T.; Prince, T.; Wegiel, B.; Calderwood, S.K. Role and Regulation of Myeloid Zinc Finger Protein 1 in Cancer. J. Cell. Biochem. 2015, 116, 2146–2154. [Google Scholar] [CrossRef]
  35. Sander, T.L.; Haas, A.L.; Peterson, M.J.; Morris, J.F. Identification of a novel SCAN box-related protein that interacts with MZF1B. The leucine-rich SCAN box mediates hetero- and homoprotein associations. J. Biol. Chem. 2000, 275, 12857–12867. [Google Scholar] [CrossRef]
  36. Perrotti, D.; Melotti, P.; Skorski, T.; Casella, I.; Peschle, C.; Calabretta, B. Overexpression of the zinc finger protein MZF1 inhibits hematopoietic development from embryonic stem cells: Correlation with negative regulation of CD34 and c-myb promoter activity. Mol. Cell. Biol. 1995, 15, 6075–6087. [Google Scholar] [CrossRef] [PubMed]
  37. Eguchi, T.; Prince, T.L.; Tran, M.T.; Sogawa, C.; Lang, B.J.; Calderwood, S.K. MZF1 and SCAND1 Reciprocally Regulate CDC37 Gene Expression in Prostate Cancer. Cancers 2019, 11, 792. [Google Scholar] [CrossRef] [PubMed]
  38. Zheng, L.; Jiao, W.; Mei, H.; Song, H.; Li, D.; Xiang, X.; Chen, Y.; Yang, F.; Li, H.; Huang, K.; et al. miRNA-337-3p inhibits gastric cancer progression through repressing myeloid zinc finger 1-facilitated expression of matrix metalloproteinase 14. Oncotarget 2016, 7, 40314–40328. [Google Scholar] [CrossRef] [PubMed]
  39. Ko, H.; Kim, S.; Yang, K.; Kim, K. Phosphorylation-dependent stabilization of MZF1 upregulates N-cadherin expression during protein kinase CK2-mediated epithelial-mesenchymal transition. Oncogenesis 2018, 7, 27. [Google Scholar] [CrossRef] [PubMed]
  40. Luan, H.; Mohapatra, B.; Bielecki, T.A.; Mushtaq, I.; Mirza, S.; Jennings, T.A.; Clubb, R.J.; An, W.; Ahmed, D.; El-Ansari, R.; et al. Loss of the Nuclear Pool of Ubiquitin Ligase CHIP/STUB1 in Breast Cancer Unleashes the MZF1-Cathepsin Pro-oncogenic Program. Cancer Res. 2018, 78, 2524–2535. [Google Scholar] [CrossRef] [PubMed]
  41. Verma, N.K.; Gadi, A.; Maurizi, G.; Roy, U.B.; Mansukhani, A.; Basilico, C. Myeloid Zinc Finger 1 and GA Binding Protein Co-Operate with Sox2 in Regulating the Expression of Yes-Associated Protein 1 in Cancer Cells. Stem. Cells 2017, 35, 2340–2350. [Google Scholar] [CrossRef] [PubMed]
  42. Wu, L.; Han, L.; Zhou, C.; Wei, W.; Chen, X.; Yi, H.; Wu, X.; Bai, X.; Guo, S.; Yu, Y.; et al. TGF-beta1-induced CK17 enhances cancer stem cell-like properties rather than EMT in promoting cervical cancer metastasis via the ERK1/2-MZF1 signaling pathway. FEBS J. 2017, 284, 3000–3017. [Google Scholar] [CrossRef]
  43. Eguchi, T.; Csizmadia, E.; Kawai, H.; Sheta, M.; Yoshida, K.; Prince, T.L.; Wegiel, B.; Calderwood, S.K. SCAND1 Reverses Epithelial-to-Mesenchymal Transition (EMT) and Suppresses Prostate Cancer Growth and Migration. Cells 2022, 11, 3993. [Google Scholar] [CrossRef]
  44. Tsai, S.J.; Hwang, J.M.; Hsieh, S.C.; Ying, T.H.; Hsieh, Y.H. Overexpression of myeloid zinc finger 1 suppresses matrix metalloproteinase-2 expression and reduces invasiveness of SiHa human cervical cancer cells. Biochem. Biophys. Res. Commun. 2012, 425, 462–467. [Google Scholar] [CrossRef]
  45. Wu, D.; Tan, H.; Su, W.; Cheng, D.; Wang, G.; Wang, J.; Ma, D.A.; Dong, G.M.; Sun, P. MZF1 mediates oncogene-induced senescence by promoting the transcription of p16(INK4A). Oncogene 2022, 41, 414–426. [Google Scholar] [CrossRef] [PubMed]
  46. Noll, L.; Peterson, F.C.; Hayes, P.L.; Volkman, B.F.; Sander, T. Heterodimer formation of the myeloid zinc finger 1 SCAN domain and association with promyelocytic leukemia nuclear bodies. Leuk. Res. 2008, 32, 1582–1592. [Google Scholar] [CrossRef] [PubMed]
  47. Dupuy, D.; Aubert, I.; Dupérat, V.G.; Petit, J.; Taine, L.; Stef, M.; Bloch, B.; Arveiler, B. Mapping, characterization, and expression analysis of the SM-20 human homologue, c1orf12, and identification of a novel related gene, SCAND2. Genomics 2000, 69, 348–354. [Google Scholar] [CrossRef]
  48. Anufrieva, K.S.; Shender, V.O.; Arapidi, G.P.; Pavlyukov, M.S.; Shakhparonov, M.I.; Shnaider, P.V.; Butenko, I.O.; Lagarkova, M.A.; Govorun, V.M. Therapy-induced stress response is associated with downregulation of pre-mRNA splicing in cancer cells. Genome Med. 2018, 10, 49. [Google Scholar] [CrossRef] [PubMed]
  49. Akaike, Y.; Masuda, K.; Kuwano, Y.; Nishida, K.; Kajita, K.; Kurokawa, K.; Satake, Y.; Shoda, K.; Imoto, I.; Rokutan, K. HuR regulates alternative splicing of the TRA2beta gene in human colon cancer cells under oxidative stress. Mol. Cell Biol. 2014, 34, 2857–2873. [Google Scholar] [CrossRef]
  50. Zhou, H.L.; Hinman, M.N.; Barron, V.A.; Geng, C.; Zhou, G.; Luo, G.; Siegel, R.E.; Lou, H. Hu proteins regulate alternative splicing by inducing localized histone hyperacetylation in an RNA-dependent manner. Proc. Natl. Acad. Sci. USA 2011, 108, E627–E635. [Google Scholar] [CrossRef]
  51. Lee, S.; Wei, L.; Zhang, B.; Goering, R.; Majumdar, S.; Wen, J.; Taliaferro, J.M.; Lai, E.C. ELAV/Hu RNA binding proteins determine multiple programs of neural alternative splicing. PLoS Genet. 2021, 17, e1009439. [Google Scholar] [CrossRef]
  52. Izquierdo, J.M. Hu antigen R (HuR) functions as an alternative pre-mRNA splicing regulator of Fas apoptosis-promoting receptor on exon definition. J. Biol. Chem. 2008, 283, 19077–19084. [Google Scholar] [CrossRef]
  53. Lin, J.-C.; Hsu, M.; Tarn, W.-Y. Cell stress modulates the function of splicing regulatory protein RBM4 in translation control. Proc. Natl. Acad. Sci. USA 2007, 104, 2235–2240. [Google Scholar] [CrossRef]
  54. Nakai, A.; Tanabe, M.; Kawazoe, Y.; Inazawa, J.; Morimoto, R.I.; Nagata, K. HSF4, a new member of the human heat shock factor family which lacks properties of a transcriptional activator. Mol. Cell. Biol. 1997, 17, 469–481. [Google Scholar] [CrossRef]
  55. Zhang, W.; Zhang, X.; Cheng, P.; Yue, K.; Tang, M.; Li, Y.; Guo, Q.; Zhang, Y. HSF4 promotes tumor progression of colorectal cancer by transactivating c-MET. Mol. Cell. Biochem. 2022. [Google Scholar] [CrossRef] [PubMed]
  56. Ma, P.; Tang, W.G.; Hu, J.W.; Hao, Y.; Xiong, L.K.; Wang, M.M.; Liu, H.; Bo, W.H.; Yu, K.H. HSP4 triggers epithelial-mesenchymal transition and promotes motility capacities of hepatocellular carcinoma cells via activating AKT. Liver Int. 2020, 40, 1211–1223. [Google Scholar] [CrossRef] [PubMed]
  57. Jin, X.; Eroglu, B.; Cho, W.; Yamaguchi, Y.; Moskophidis, D.; Mivechi, N.F. Inactivation of heat shock factor Hsf4 induces cellular senescence and suppresses tumorigenesis in vivo. Mol. Cancer Res. 2012, 10, 523–534. [Google Scholar] [CrossRef]
  58. Eguchi, T.; Sheta, M.; Fujii, M.; Calderwood, S.K. Cancer Extracellular Vesicles, Tumoroid Models, and Tumor Microenvironment. Semin. Cancer Biol. 2022, 86, 112–126. [Google Scholar] [CrossRef] [PubMed]
  59. Namba, Y.; Sogawa, C.; Okusha, Y.; Kawai, H.; Itagaki, M.; Ono, K.; Murakami, J.; Aoyama, E.; Ohyama, K.; Asaumi, J.; et al. Depletion of Lipid Efflux Pump ABCG1 Triggers the Intracellular Accumulation of Extracellular Vesicles and Reduces Aggregation and Tumorigenesis of Metastatic Cancer Cells. Front. Oncol. 2018, 8, 376. [Google Scholar] [CrossRef] [PubMed]
  60. Yoshida, S.; Kawai, H.; Eguchi, T.; Sukegawa, S.; Oo, M.W.; Anqi, C.; Takabatake, K.; Nakano, K.; Okamoto, K.; Nagatsuka, H. Tumor Angiogenic Inhibition Triggered Necrosis (TAITN) in Oral Cancer. Cells 2019, 8, 761. [Google Scholar] [CrossRef]
  61. Gilkes, D.M.; Semenza, G.L.; Wirtz, D. Hypoxia and the extracellular matrix: Drivers of tumour metastasis. Nat. Rev. Cancer 2014, 14, 430–439. [Google Scholar] [CrossRef]
  62. Boedtkjer, E.; Pedersen, S.F. The Acidic Tumor Microenvironment as a Driver of Cancer. Annu. Rev. Physiol. 2020, 82, 103–126. [Google Scholar] [CrossRef]
  63. Fais, S.; Venturi, G.; Gatenby, B. Microenvironmental acidosis in carcinogenesis and metastases: New strategies in prevention and therapy. Cancer Metastasis Rev. 2014, 33, 1095–1108. [Google Scholar] [CrossRef]
  64. Ischia, J.; So, A.I. The role of heat shock proteins in bladder cancer. Nat. Rev. Urol. 2013, 10, 386–395. [Google Scholar] [CrossRef]
  65. Torigoe, T.; Tamura, Y.; Sato, N. Heat shock proteins and immunity: Application of hyperthermia for immunomodulation. Int. J. Hyperth. 2009, 25, 610–616. [Google Scholar] [CrossRef] [PubMed]
  66. Wiersma, V.R.; Michalak, M.; Abdullah, T.M.; Bremer, E.; Eggleton, P. Mechanisms of Translocation of ER Chaperones to the Cell Surface and Immunomodulatory Roles in Cancer and Autoimmunity. Front. Oncol. 2015, 5, 7. [Google Scholar] [CrossRef] [PubMed]
  67. Kamikawa, Y.; Saito, A.; Imaizumi, K. Impact of Nuclear Envelope Stress on Physiological and Pathological Processes in Central Nervous System. Neurochem. Res. 2022, 47, 2478–2487. [Google Scholar] [CrossRef] [PubMed]
  68. Panagaki, D.; Croft, J.T.; Keuenhof, K.; Larsson Berglund, L.; Andersson, S.; Kohler, V.; Buttner, S.; Tamas, M.J.; Nystrom, T.; Neutze, R.; et al. Nuclear envelope budding is a response to cellular stress. Proc. Natl. Acad. Sci. USA 2021, 118, e2020997118. [Google Scholar] [CrossRef]
  69. Xu, B.; Sun, Z.; Liu, Z.; Guo, H.; Liu, Q.; Jiang, H.; Zou, Y.; Gong, Y.; Tischfield, J.A.; Shao, C. Replication stress induces micronuclei comprising of aggregated DNA double-strand breaks. PLoS ONE 2011, 6, e18618. [Google Scholar] [CrossRef]
  70. Ahn, S.G.; Thiele, D.J. Redox regulation of mammalian heat shock factor 1 is essential for Hsp gene activation and protection from stress. Genes Dev. 2003, 17, 516–528. [Google Scholar] [CrossRef]
  71. Gong, J.L.; Lang, B.J.; Weng, D.S.; Eguchi, T.; Murshid, A.; Borges, T.J.; Doshi, S.; Song, B.Z.; Stevenson, M.A.; Calderwood, S.K. Genotoxic stress induces Sca-1-expressing metastatic mammary cancer cells. Mol. Oncol. 2018, 12, 1249–1263. [Google Scholar] [CrossRef]
  72. Hitomi, K.; Okada, R.; Loo, T.M.; Miyata, K.; Nakamura, A.J.; Takahashi, A. DNA Damage Regulates Senescence-Associated Extracellular Vesicle Release via the Ceramide Pathway to Prevent Excessive Inflammatory Responses. Int. J. Mol. Sci. 2020, 21, 3720. [Google Scholar] [CrossRef]
  73. Guang, M.H.Z.; Kavanagh, E.L.; Dunne, L.P.; Dowling, P.; Zhang, L.; Lindsay, S.; Bazou, D.; Goh, C.Y.; Hanley, C.; Bianchi, G.; et al. Targeting Proteotoxic Stress in Cancer: A Review of the Role that Protein Quality Control Pathways Play in Oncogenesis. Cancers 2019, 11, 66. [Google Scholar] [CrossRef]
  74. Okusha, Y.; Eguchi, T.; Tran, M.T.; Sogawa, C.; Yoshida, K.; Itagaki, M.; Taha, E.A.; Ono, K.; Aoyama, E.; Okamura, H.; et al. Extracellular Vesicles Enriched with Moonlighting Metalloproteinase Are Highly Transmissive, Pro-Tumorigenic, and Trans-Activates Cellular Communication Network Factor (CCN2/CTGF): CRISPR against Cancer. Cancers 2020, 12, 881. [Google Scholar] [CrossRef]
  75. Taha, E.A.; Sogawa, C.; Okusha, Y.; Kawai, H.; Oo, M.W.; Elseoudi, A.; Lu, Y.; Nagatsuka, H.; Kubota, S.; Satoh, A.; et al. Knockout of MMP3 Weakens Solid Tumor Organoids and Cancer Extracellular Vesicles. Cancers 2020, 12, 1260. [Google Scholar] [CrossRef] [PubMed]
  76. Vargas, J.N.S.; Hamasaki, M.; Kawabata, T.; Youle, R.J.; Yoshimori, T. The mechanisms and roles of selective autophagy in mammals. Nat. Rev. Mol. Cell Biol. 2022, 24, 167–185. [Google Scholar] [CrossRef] [PubMed]
  77. Gao, J.; Aksoy, B.A.; Dogrusoz, U.; Dresdner, G.; Gross, B.; Sumer, S.O.; Sun, Y.; Jacobsen, A.; Sinha, R.; Larsson, E.; et al. Integrative analysis of complex cancer genomics and clinical profiles using the cBioPortal. Sci. Signal 2013, 6, pl1. [Google Scholar] [CrossRef] [PubMed]
  78. Li, C.; Tang, Z.; Zhang, W.; Ye, Z.; Liu, F. GEPIA2021: Integrating multiple deconvolution-based analysis into GEPIA. Nucleic. Acids Res. 2021, 49, W242–W246. [Google Scholar] [CrossRef] [PubMed]
  79. Tan, M.H.; Li, Q.; Shanmugam, R.; Piskol, R.; Kohler, J.; Young, A.N.; Liu, K.I.; Zhang, R.; Ramaswami, G.; Ariyoshi, K.; et al. Dynamic landscape and regulation of RNA editing in mammals. Nature 2017, 550, 249–254. [Google Scholar] [CrossRef] [PubMed]
  80. Nagy, A.; Munkacsy, G.; Gyorffy, B. Pancancer survival analysis of cancer hallmark genes. Sci. Rep. 2021, 11, 6047. [Google Scholar] [CrossRef]
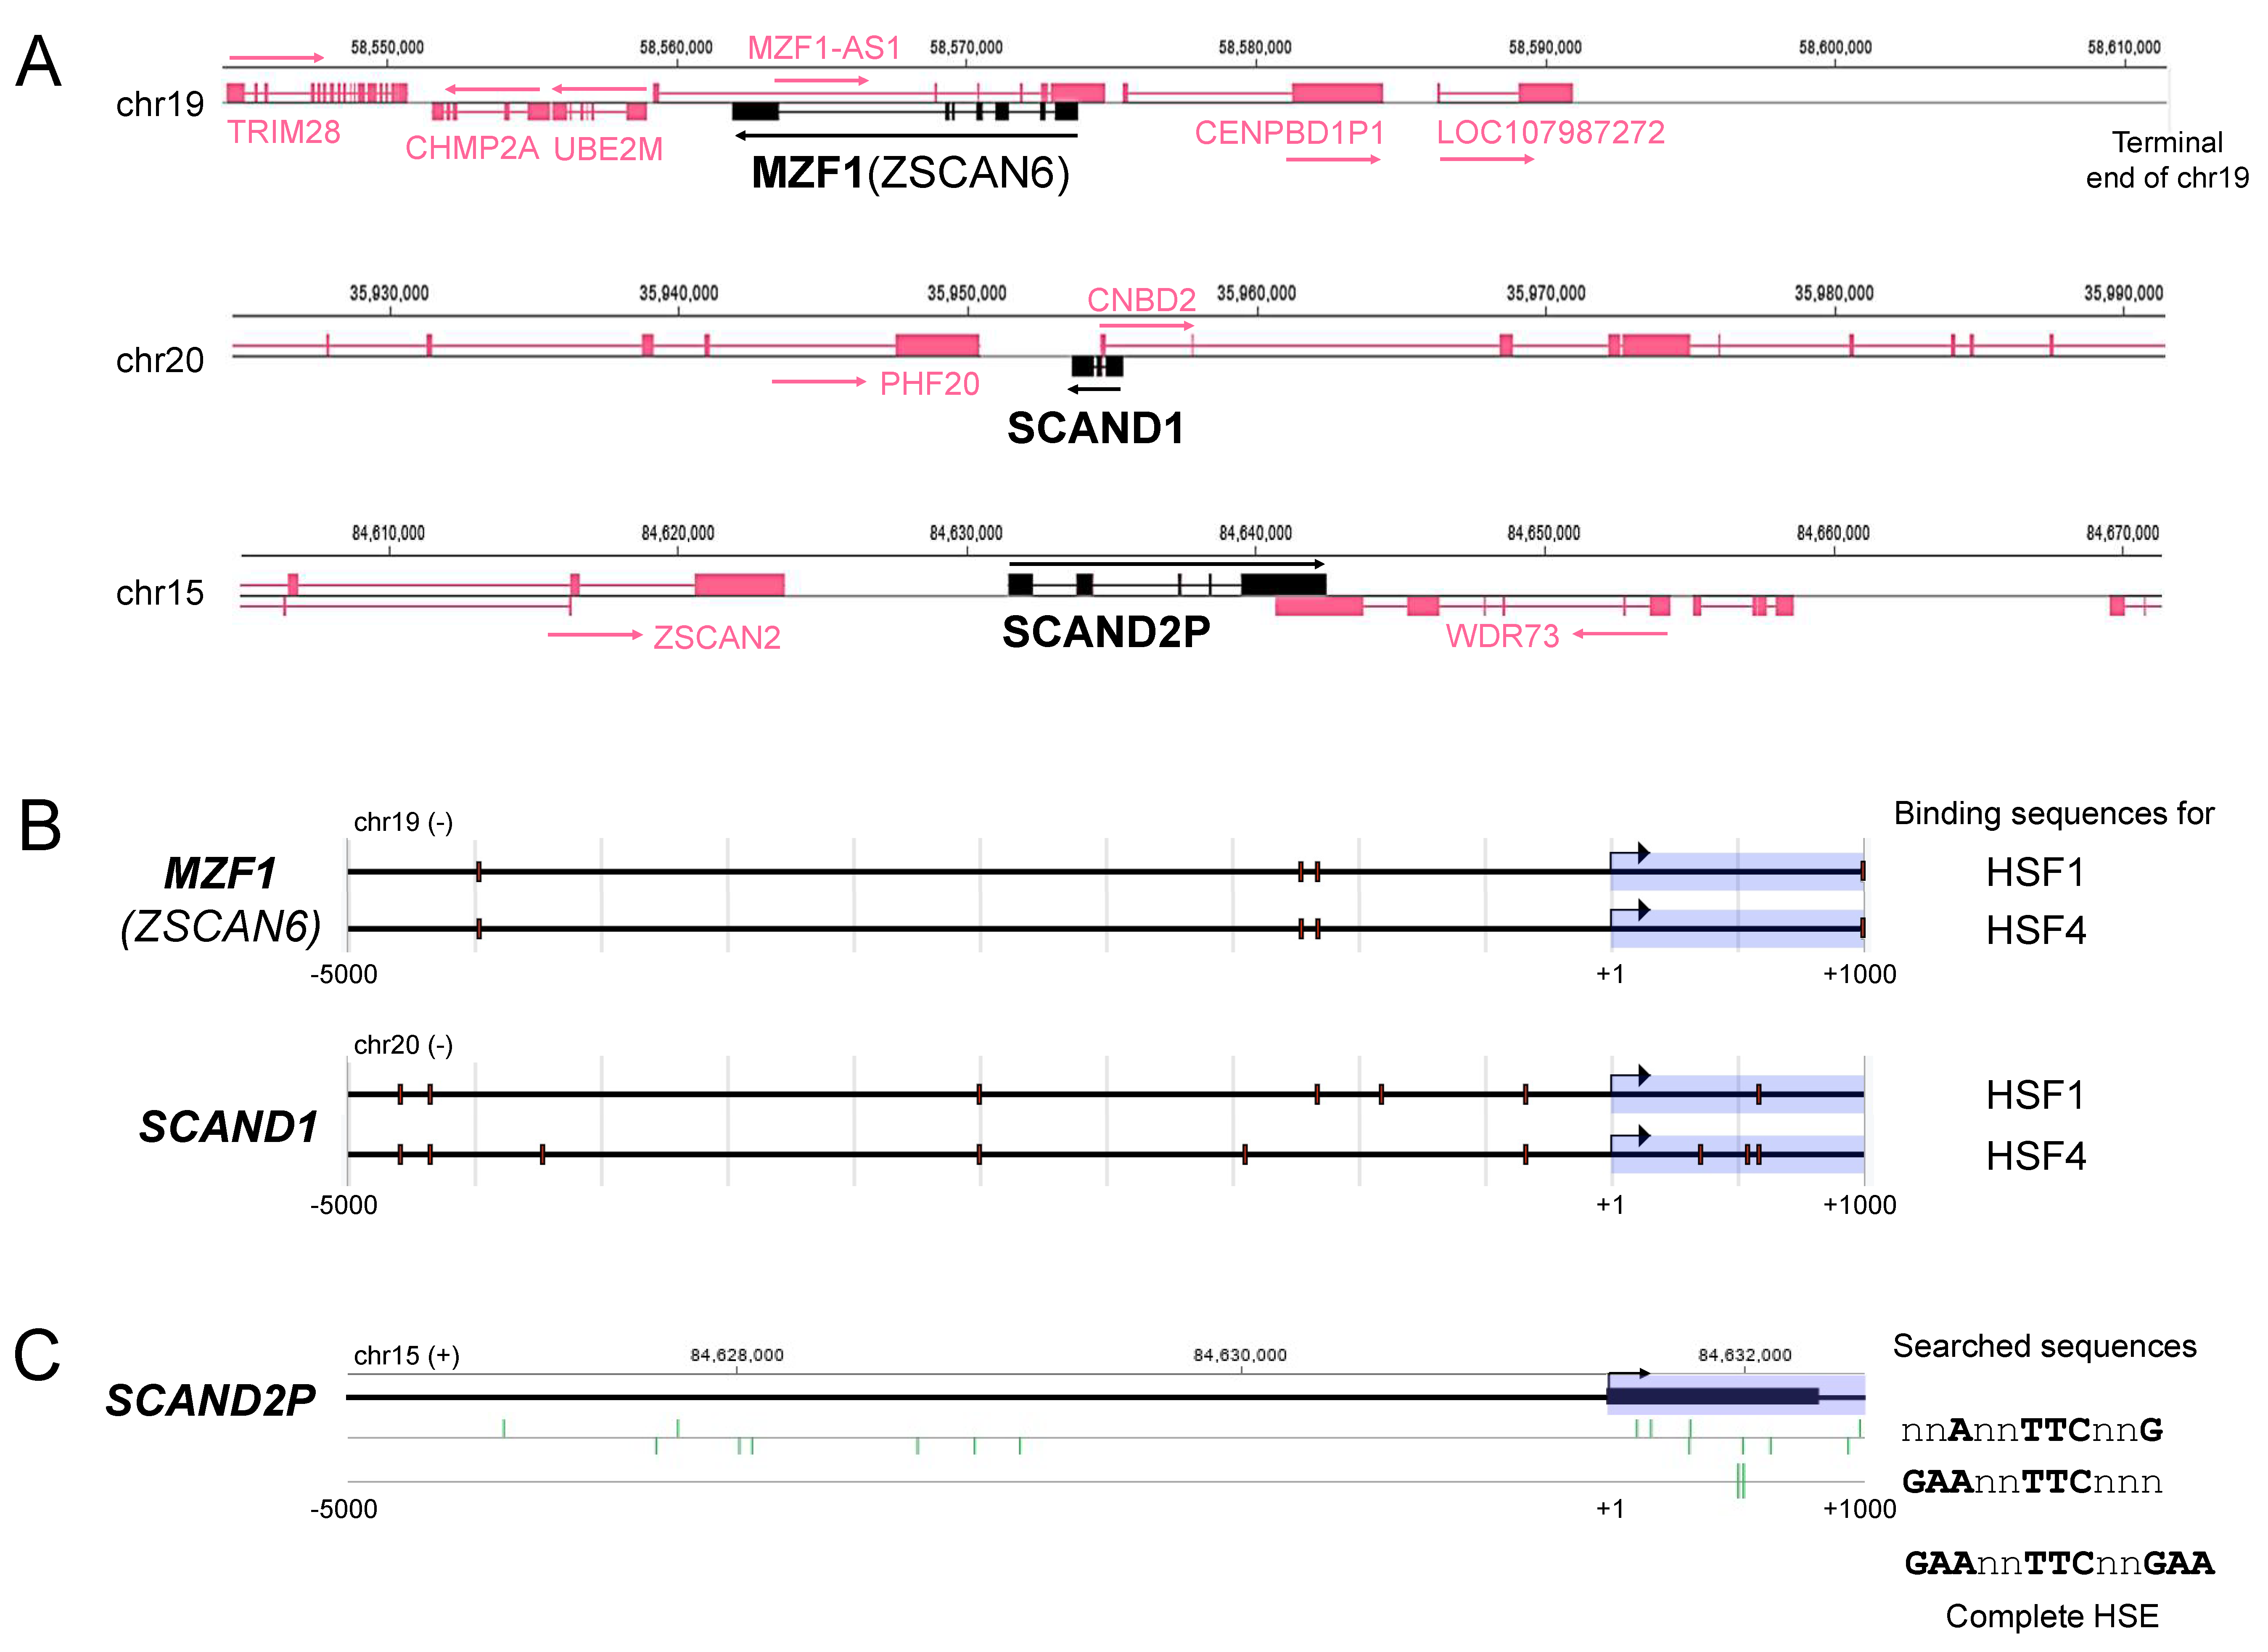
Figure 1. Gentic loci of MZF1(ZSCAN6), SCAND1, and SCAND2P in the human genome. (A) Locations and structures of MZF1, SCAND1, and SCAND2P genes on human chromosomes (hg38). (B,C) Mapping of heat shock elements (HSEs) in the promoter regions (−5000 to +1000) of (B) MZF1, SCAND1, and (C) SCAND2P genes.
Ijms 24 05168 g001
Figure 2. Alternative splicing variants and primer mapping of (A) MZF1(ZSCAN6), (B) SCAND1, and (C) SCAND2 genes. Complete coding DNA sequence (CDS) of SCAND2 mRNA and lncRNA-SCAND2 overlapped in the genome. Ex., exon numbers. Primer positions were mapped, e.g., F1 and R1.
Ijms 24 05168 g002
Figure 3. Heat shock stress induces the expression of MZF1(ZSCAN6), SCAND1, and SCAND2 but eliminates lncRNA-SCAND2P in DU-145 prostate cancer cells. (AD) qRT-PCR analysis for MZF1 (A), SCAND1 (B), and SCAND2 (C) RNA and lncRNA-SCAND2P (D) upon HSS. LncRNA-SCAND2P was detected under the NH37 condition but lost after HSS. NH37, non-heated at 37 °C. HS43, heat-shocked at 43 °C for 30 min. ** p < 0.01, n = 3. (EG) immunocytochemistry of MZF1 (E), SCAND1 (F), and SCAND2 (G) expressed with or without heat shock. (H) Co-expression correlation between HSF1 or HSF4 vs. MZF1, SCAND1, and SCAND2 in patient-derived prostate adenocarcinoma (494 samples, TCGA PanCancer Atlas).
Ijms 24 05168 g003
Figure 4. Co-expression correlation between MZF1, SCAND1, and SCAND2 in prostate cancer. (A) SCAND1 vs. MZF1, (B) SCAND2 vs. MZF1, (C) SCAND1 vs. SCAND2 in prostate adenocarcinoma specimens derived from patients (494 samples, TCGA PanCancer Atlas).
Ijms 24 05168 g004
Figure 5. Heat shock stress induces HSF1 and MZF1(ZSCAN6) binding to HSP90 genes. (A,B) Promoter regions (−5000 to +1000) of the HSP90AA1 gene (A) and the HSP90AB1 gene (B) mapped with binding sites of HSFs and MZF1(ZSCAN6). Black vertical bars indicate binding sites. Hatched boxes indicate regions analyzed by ChIP-qPCR. (CE) ChIP-qPCR assay. PC-3 cells were treated with heat shock at 43 °C (HS43) for 15 or 30 min or non-heated (NH), and chromatin was fixed. ChIP was performed using antibodies against HSF1 (C), MZF1/ZSCAN6 (D) and acetylated histone H3 (H3ac) (E) for qPCR of HSP90 genes.
Ijms 24 05168 g005
Figure 6. MZF1 and SCAND1 blocked the heat shock response of the HSP90AA1 gene. (A) qRT-PCR for HSP90AA1 gene. Stable DU-145 cells transfected with pcDNA3.1 vector, pcDNA/MZF1-Flag, and pCMV/SCAND1-Flag were treated with or without HSS for 30 min. ** p < 0.01, n = 3. (BD) Co-expression correlation between HSP90AA1 vs. MZF1(ZSCAN6) (B), SCAND1 (C) and SCAND2 (D) genes in prostate adenocarcinoma (494 samples, TCGA PanCancer Atlas).
Ijms 24 05168 g006
Figure 7. Gene expression levels of ZSCAN6(MZF1), SCAND2, and HSP90 in various tumor types vs. paired normal tissues. Red box, tumor tissues (T). Gray box, normal tissues (N). Prostate adenocarcinoma (PRAD), breast invasive carcinoma (BRCA), colon adenocarcinoma (COAD), rectum adenocarcinoma (READ), skin cutaneous melanoma (SKCM), testicular germ cell tumors (TGCT), uterine carcinosarcoma (UCS), and acute myelo1id leukemia (LAML). Patient-derived clinical samples from TCGA PanCancer Atlas and GTEx were analyzed using GEPIA2. * p < 0.01.
Ijms 24 05168 g007
Figure 8. Kaplan–Meier plots showing prognostic values of SCANDs, MZF1, and HSP90 gene expression in pancreatic cancer. Data were from TCGA PanCancer Atlas, pancreatic adenocarcinoma (PAAD), n = 177. High expression of SCANDs and MZF1 genes (AC) are correlated with better prognoses whereas high expression of HSP90 genes (DF) are correlated with poor prognosis of pancreatic DAC. Data in panels A and C were published in: Eguchi, T., et al., 2022 [43].
Ijms 24 05168 g008
Figure 9. Kaplan–Meier plots showing prognostic values of SCANDs, MZF1, and HSP90 gene expression in head and neck cancers. Data were from TCGA PanCancer Atlas, head and neck squamous cell carcinoma (HNSC) (stage III), n = 78. High expressions of SCANDs and MZF1 (AC) are correlated with better prognosis, whereas high expressions of HSP90 (D,E) are correlated with poor prognosis of head and neck SCC. Data in panels A and C were published in: Eguchi, T., et al., 2022 [43].
Ijms 24 05168 g009
Figure 10. Stress-inducible SCAN transcription factors SCAND and MZF1 repress HSP90 gene expression. Cell stress activates HSF1 that binds to HSEs in the promoter regions of the HSP90 genes (HSP90AA1 and HSP90AB1), ZSCAN6(MZF1) gene, and SCAND genes (SCAND1 and SCAND2). MZF1 induces SCAND1 expression. Cell stress also switches the SCAND2 transcript variants from lncRNA-SCAND2P to SCAND2 mRNA. Hetero-oligomers of MZF1 and SCAND bind to and repress HSP90 genes. High expression of HSP90 is a biomarker of poorer prognosis, while SCAN-TF complexes repress the transcription of HSP90 gene and enhance the prognosis of cancer patients.
Ijms 24 05168 g010
Table 1. The numbers of binding sites for HSF1, HSF4 and MZF1 in the promoter regions of SCAND1 and MZF1 genes.
Gene Promoter 1HSF1-BSHSF4-BSMZF1-BSMZF1-BS var.2
SCAND179515
MZF1442730
1 Promoter regions from −5000 to +1000 were analyzed. Numbers of binding sequences with p-values > 0.001 were counted.
Table 2. Co-expression correlation between HSFs, MZF1, and SCANDs in prostate adenocarcinomas.
GeneCorrelated GeneSpearman’s Correlation 1p-Value 2q-Value 3
HSF1 vs.MZF10.3759.52 × 10–187.37 × 10⁻¹⁷
HSF1 vs.SCAND10.5186.73 × 10–352.92 × 10⁻³³
HSF1 vs.SCAND20.09254.12 × 10–26.42 × 10⁻²
HSF4 vs.MZF10.7051.97 × 10–743.03 × 10–72
HSF4 vs.SCAND10.5853.99 × 10–461.86 × 10–44
HSF4 vs.SCAND20.555.55 × 10–401.89 × 10–38
1 Spearman’s correlation > 0.3 were shown in bold. 2 p-Values < 1 × 10–15 were shown in bold. 3 q-Values < 1 × 10–15 were shown in bold. n = 494.
Table 3. Co-expression correlation between HSFs, MZF1, and SCANDs in prostate adenocarcinomas.
GeneCorrelated GeneSpearman’s Correlation 1p-Value 2q-Value 3
MZF1 vs.SCAND10.5481.27 × 10–396.16 × 10–38
MZF1 vs.SCAND20.5241.01 × 10–353.95 × 10⁻³⁴
SCAND1 vs.SCAND20.1702.20 × 10–44.16 × 10⁻⁴
1 Spearman’s correlation > 0.5 were shown in bold. 2 p-Values < 1 × 10–30 were shown in bold. 3 q-Values < 1 × 10–30 were shown in bold. n = 494.
Table 4. The number of binding sites for HSF1, HSF4 and MZF1 in the promoter regions of the HSP90AA1 and HSP90AB1 genes.
PromoterHSF1-BSHSF4-BSMZF1-BSMZF1-BS var.2
HSP90AA19122218
HSP90AB1882228
Promoter regions from −5000 to +1000 were analyzed. Numbers of binding sequences with p-values > 0.001 were counted.
Table 5. The negative correlation of gene expression of HSP90AA1 vs. MZF1, SCANDs, and HSFs in prostate adenocarcinoma specimens.
GeneCorrelated GeneSpearman’s Correlation 1p-Value 2q-Value 3
HSP90AA1 vs.MZF1−0.3213.63 × 10–133.35 × 10⁻¹¹
HSP90AA1 vs.SCAND2−0.324.34 × 10–133.88 × 10⁻¹¹
HSP90AA1 vs.SCAND1−0.1882.86 × 10–51.71 × 10⁻⁴
HSP90AA1 vs.HSF4−0.2416.97 × 10–89.73 × 10⁻⁷
HSP90AA1 vs.HSF1−0.0453.21 × 10–14.38 × 10⁻¹
HSP90AA1 vs.HSF2−0.01647.17 × 10–17.94 × 10⁻¹
HSP90AA1 vs.HSF5−0.002979.48 × 10–10.963 × 10⁻¹
1 Spearman’s correlation < –0.15 were shown in bold. 2 p-Values < 1 × 10⁻⁴ were shown in bold. 3 q-Values < 1 × 10⁻³ were shown in bold. n = 494.
Table 6. The negative correlation of HSPs vs. MZF1, SCAND1, and SCAND2 gene expression in prostate adenocarcinoma specimens.
vs. MZF1vs. SCAND1vs. SCAND2
Correlated GeneSpearman’s Correlation 1p-Value 2Spearman’s Correlationp-ValueSpearman’s Correlationp-Value
HSPA13−0.4481.75 × 10–25−0.5727.79 × 10–440.3574.18 × 10–16
HSPA4−0.3583.41 × 10–16−0.3037.97 × 10–120.3941.52 × 10–19
HSPA4L−0.3261.58 × 10–13−0.4112.66 × 10–21−0.03414.52 × 10–1
HSP90AA1−0.3213.63 × 10–13−0.1882.86 × 10–50.324.34 × 10–13
HSPH1−0.3001.42 × 10–11−0.1912.20 × 10–50.3121.67 × 10–12
1 Spearman’s correlation < –0.25 were shown in bold. 2 p-Values < 1 × 10⁻¹⁰ were shown in bold.
Table 7. SCAND1, SCAND2, and MZF1 expression correlate with enhanced prognoses in cancer.
Cancer TypeLog-Rank PN
SCAND2SCAND1MZF1
Pancreatic adenocarcinoma0.00018 ***0.0041 **0.0009 **177
Head & Neck SCC (stage III)0.045 *0.024 *0.018 *78
Lung adenocarcinoma0.00032 ***0.320.21504
Sarcoma0.0096 **0.110.14259
Cervical SCC0.015 *0.340.21304
* p < 0.05, ** p < 0.05, *** p < 0.0001.
Table 8. Primer sequences for ChIP-qPCR.
Primer NameSequences (5′ to 3′)
HSP90AA1 h −100FGGCTGGGGAGGGTTCTTC
HSP90AA1 h +200RGAGGCCTCCGGAATAGAAAG
HSP90AB1 h −800FCCTGAGGATTGGGCTGGTA
HSP90AB1 h −430RCATCTGCCCTACACATCTCG
HSP90AB1 h +600FGTCTCCAGCACCCGATACTC
HSP90AB1 h +900RGAACAGGACCAAACCCAAGA
Disclaimer/Publisher’s Note: The statements, opinions and data contained in all publications are solely those of the individual author(s) and contributor(s) and not of MDPI and/or the editor(s). MDPI and/or the editor(s) disclaim responsibility for any injury to people or property resulting from any ideas, methods, instructions or products referred to in the content.