

Variability of Functional Groups of Rhizosphere Fungi of Norway Spruce (Picea abies (L.) H.Karst.) in the Boreal Range: The Wigry National Park, Poland

 , ,
, ,  ,
,  , , , , , , and
Abstract
1. Introduction
2. Results
3. Discussion
4. Materials and Methods
4.1. Sampling Site Description
4.2. Sampling
4.3. DNA Extraction and PCR Amplification
4.4. Sequence Processing and Statistical Analysis
4.5. Statistical Analyses
5. Conclusions
Author Contributions
Funding
Institutional Review Board Statement
Informed Consent Statement
Data Availability Statement
Acknowledgments
Conflicts of Interest
References
- Philippot, L.; Raaijmakers, J.M.; Lemanceau, P.; van der Putten, W.H. Going Back to the Roots: The Microbial Ecology of the Rhizosphere. Nat. Rev. Microbiol. 2013, 11, 789–799. [Google Scholar] [CrossRef] [PubMed]
- Turner, T.R.; Ramakrishnan, K.; Walshaw, J.; Heavens, D.; Alston, M.; Swarbreck, D.; Osbourn, A.; Grant, A.; Poole, P.S. Comparative Metatranscriptomics Reveals Kingdom Level Changes in the Rhizosphere Microbiome of Plants. ISME J. 2013, 7, 2248–2258. [Google Scholar] [CrossRef] [PubMed]
- Carroll, G. Fungal Endophytes in Stems and Leaves: From Latent Pathogen to Mutualistic Symbiont. Ecology 1988, 69, 2–9. [Google Scholar] [CrossRef]
- Menkis, A.; Burokienė, D.; Stenlid, J.; Stenström, E. High-Throughput Sequencing Shows High Fungal Diversity and Community Segregation in the Rhizospheres of Container-Grown Conifer Seedlings. Forests 2016, 7, 44. [Google Scholar] [CrossRef]
- Otsing, E.; Barantal, S.; Anslan, S.; Koricheva, J.; Tedersoo, L. Litter Species Richness and Composition Effects on Fungal Richness and Community Structure in Decomposing Foliar and Root Litter. Soil. Biol. Biochem. 2018, 125, 328–339. [Google Scholar] [CrossRef]
- LeBlanc, N.; Kinkel, L.L.; Kistler, H.C. Soil Fungal Communities Respond to Grassland Plant Community Richness and Soil Edaphics. Microb. Ecol. 2015, 70, 188–195. [Google Scholar] [CrossRef]
- Peay, K.G.; Kennedy, P.G.; Talbot, J.M. Dimensions of Biodiversity in the Earth Mycobiome. Nat. Rev. Microbiol. 2016, 14, 434–447. [Google Scholar] [CrossRef]
- Tedersoo, L.; Bahram, M.; Zobel, M. How Mycorrhizal Associations Drive Plant Population and Community Biology. Science 2020, 367, eaba1223. [Google Scholar] [CrossRef]
- Khoshru, B.; Moharramnejad, S.; Gharajeh, N.H.; Asgari Lajayer, B.; Ghorbanpour, M. Plant Microbiome and Its Important in Stressful Agriculture. In Plant Microbiome Paradigm; Springer International Publishing: Cham, Switzerland, 2020; pp. 13–48. [Google Scholar]
- Lindahl, B.D.; Tunlid, A. Ectomycorrhizal Fungi—Potential Organic Matter Decomposers, yet Not Saprotrophs. New Phytol. 2015, 205, 1443–1447. [Google Scholar] [CrossRef]
- Van der Heijden, M.G.A.; Horton, T.R. Socialism in Soil? The Importance of Mycorrhizal Fungal Networks for Facilitation in Natural Ecosystems. J. Ecol. 2009, 97, 1139–1150. [Google Scholar] [CrossRef]
- Figueiredo, A.F.; Boy, J.; Guggenberger, G. Common Mycorrhizae Network: A Review of the Theories and Mechanisms Behind Underground Interactions. Front. Fungal Biol. 2021, 2, 48. [Google Scholar] [CrossRef]
- Rhodes, C.J. The Whispering World of Plants: ‘The Wood Wide Web’. Sci. Prog. 2017, 100, 331–337. [Google Scholar] [CrossRef] [PubMed]
- Wipf, D.; Krajinski, F.; van Tuinen, D.; Recorbet, G.; Courty, P. Trading on the Arbuscular Mycorrhiza Market: From Arbuscules to Common Mycorrhizal Networks. New Phytol. 2019, 223, 1127–1142. [Google Scholar] [CrossRef] [PubMed]
- Deslippe, J.R.; Hartmann, M.; Simard, S.W.; Mohn, W.W. Long-Term Warming Alters the Composition of Arctic Soil Microbial Communities. FEMS Microbiol. Ecol. 2012, 82, 303–315. [Google Scholar] [CrossRef]
- Bücking, H.; Mensah, J.A.; Fellbaum, C.R. Common Mycorrhizal Networks and Their Effect on the Bargaining Power of the Fungal Partner in the Arbuscular Mycorrhizal Symbiosis. Commun. Integr. Biol. 2016, 9, e1107684. [Google Scholar] [CrossRef]
- Bingham, M.A.; Simard, S.W. Do Mycorrhizal Network Benefits to Survival and Growth of Interior Douglas-Fir Seedlings Increase with Soil Moisture Stress? Ecol. Evol. 2011, 1, 306–316. [Google Scholar] [CrossRef]
- Seiwa, K.; Negishi, Y.; Eto, Y.; Hishita, M.; Masaka, K.; Fukasawa, Y.; Matsukura, K.; Suzuki, M. Successful Seedling Establishment of Arbuscular Mycorrhizal-Compared to Ectomycorrhizal-Associated Hardwoods in Arbuscular Cedar Plantations. For. Ecol. Manag. 2020, 468, 118155. [Google Scholar] [CrossRef]
- Cairney, J.W.; Meharg, A.A. Interactions between Ectomycorrhizal Fungi and Soil Saprotrophs: Implications for Decomposition of Organic Matter in Soils and Degradation of Organic Pollutants in the Rhizosphere. Can. J. Bot. 2002, 80, 803–809. [Google Scholar] [CrossRef]
- Termorshuizen, A.J. Ecology of Fungal Plant Pathogens. Microbiol. Spectr. 2016, 4. [Google Scholar] [CrossRef]
- Berendsen, R.L.; Pieterse, C.M.J.; Bakker, P.A.H.M. The Rhizosphere Microbiome and Plant Health. Trends Plant Sci. 2012, 17, 478–486. [Google Scholar] [CrossRef]
- Sharma, S.; Ghoshal, C.; Arora, A.; Samar, W.; Nain, L.; Paul, D. Strain Improvement of Native Saccharomyces Cerevisiae LN ITCC 8246 Strain Through Protoplast Fusion To Enhance Its Xylose Uptake. Appl. Biochem. Biotechnol. 2021, 193, 2455–2469. [Google Scholar] [CrossRef] [PubMed]
- Korenblum, E.; Dong, Y.; Szymanski, J.; Panda, S.; Jozwiak, A.; Massalha, H.; Meir, S.; Rogachev, I.; Aharoni, A. Rhizosphere Microbiome Mediates Systemic Root Metabolite Exudation by Root-to-Root Signaling. Proc. Natl. Acad. Sci. USA 2020, 117, 3874–3883. [Google Scholar] [CrossRef] [PubMed]
- Peay, K.G.; Belisle, M.; Fukami, T. Phylogenetic Relatedness Predicts Priority Effects in Nectar Yeast Communities. Proc. R. Soc. B Biol. Sci. 2012, 279, 749–758. [Google Scholar] [CrossRef]
- Nara, K.; Nakaya, H.; Wu, B.; Zhou, Z.; Hogetsu, T. Underground Primary Succession of Ectomycorrhizal Fungi in a Volcanic Desert on Mount Fuji. New Phytol. 2003, 159, 743–756. [Google Scholar] [CrossRef]
- Gossner, M.M.; Getzin, S.; Lange, M.; Pašalić, E.; Türke, M.; Wiegand, K.; Weisser, W.W. The Importance of Heterogeneity Revisited from a Multiscale and Multitaxa Approach. Biol. Conserv. 2013, 166, 212–220. [Google Scholar] [CrossRef]
- Wright, J.S. Plant Diversity in Tropical Forests: A Review of Mechanisms of Species Coexistence. Oecologia 2002, 130, 1–14. [Google Scholar] [CrossRef] [PubMed]
- Behnke-Borowczyk, J.; Kowalkowski, W.; Kartawik, N.; Baranowska, M.; Barzdajn, W. The Soil Fungal Communities in Nurseries Producing Abies Alba. Balt. For. 2020, 26, 426. [Google Scholar] [CrossRef]
- Seppä, H.; Alenius, T.; Bradshaw, R.H.W.; Giesecke, T.; Heikkilä, M.; Muukkonen, P. Invasion of Norway Spruce (Picea Abies) and the Rise of the Boreal Ecosystem in Fennoscandia. J. Ecol. 2009, 97, 629–640. [Google Scholar] [CrossRef]
- Jevšenak, J.; Tychkov, I.; Gričar, J.; Levanič, T.; Tumajer, J.; Prislan, P.; Arnič, D.; Popkova, M.; Shishov, V.V. Growth-Limiting Factors and Climate Response Variability in Norway Spruce (Picea Abies L.) along an Elevation and Precipitation Gradients in Slovenia. Int. J. Biometeorol. 2021, 65, 311–324. [Google Scholar] [CrossRef]
- Hentschel, R.; Rosner, S.; Kayler, Z.E.; Andreassen, K.; Børja, I.; Solberg, S.; Tveito, O.E.; Priesack, E.; Gessler, A. Norway Spruce Physiological and Anatomical Predisposition to Dieback. For. Ecol. Manag. 2014, 322, 27–36. [Google Scholar] [CrossRef]
- Tedersoo, L.; Bahram, M.; Põlme, S.; Kõljalg, U.; Yorou, N.S.; Wijesundera, R.; Ruiz, L.V.; Vasco-Palacios, A.M.; Thu, P.Q.; Suija, A.; et al. Global Diversity and Geography of Soil Fungi. Science 2014, 346, 1256688. [Google Scholar] [CrossRef]
- Nguyen, N.H.; Song, Z.; Bates, S.T.; Branco, S.; Tedersoo, L.; Menke, J.; Schilling, J.S.; Kennedy, P.G. FUNGuild: An Open Annotation Tool for Parsing Fungal Community Datasets by Ecological Guild. Fungal Ecol. 2016, 20, 241–248. [Google Scholar] [CrossRef]
- Zanne, A.E.; Abarenkov, K.; Afkhami, M.E.; Aguilar-Trigueros, C.A.; Bates, S.; Bhatnagar, J.M.; Busby, P.E.; Christian, N.; Cornwell, W.K.; Crowther, T.W.; et al. Fungal Functional Ecology: Bringing a Trait-based Approach to Plant-associated Fungi. Biol. Rev. 2020, 95, 409–433. [Google Scholar] [CrossRef] [PubMed]
- Kohout, P.; Charvátová, M.; Štursová, M.; Mašínová, T.; Tomšovský, M.; Baldrian, P. Clearcutting Alters Decomposition Processes and Initiates Complex Restructuring of Fungal Communities in Soil and Tree Roots. ISME J. 2018, 12, 692–703. [Google Scholar] [CrossRef]
- Baldrian, P.; Kolařík, M.; Štursová, M.; Kopecký, J.; Valášková, V.; Větrovský, T.; Žifčáková, L.; Šnajdr, J.; Rídl, J.; Vlček, Č.; et al. Active and Total Microbial Communities in Forest Soil Are Largely Different and Highly Stratified during Decomposition. ISME J. 2012, 6, 248–258. [Google Scholar] [CrossRef]
- Kwaśna, H.; Behnke-Borowczyk, J.; Gornowicz, R.; Łakomy, P. Effects of Preparation of Clear-cut Forest Sites on the Soil Mycobiota with Consequences for Scots Pine Growth and Health. For. Pathol. 2019, 49, e12494. [Google Scholar] [CrossRef]
- Kwaśna, H.; Łakomy, P.; Gornowicz, R.; Borowczyk-Behnke, J.; Kuźmiński, R. Wpływ Sposobu Przygotowania Gleby Na Aktywność Biologiczną Gleby Względem Patogenów Korzeni w 40-Letnim Drzewostanie Sosnowym. Sylwan 2015, 159, 125–177. [Google Scholar]
- Hilszczańska, D.; Sierota, Z. Wplyw Inokulum Mikoryzowego Grzyba Thelephora Terrestris Na Wzrost Sadzonek Sosny Zwyczajnej Pinus Sylvestris L. II. Badania Polowe. Sylwan 2006, 150, 20–28. [Google Scholar]
- Hayward, J.; Horton, T.R.; Nuñez, M.A. Ectomycorrhizal Fungal Communities Coinvading with Pinaceae Host Plants in Argentina: Gringos Bajo El Bosque. New Phytol. 2015, 208, 497–506. [Google Scholar] [CrossRef] [PubMed]
- Guo, Q.; Duan, Y.; Meng, N.; Liu, Y.; Luo, G. The N-Terminus of Sec3 Is Required for Cell Wall Integrity in Yeast. Biochimie 2020, 177, 30–39. [Google Scholar] [CrossRef]
- Hibbett, D.S.; Binder, M. Evolution of Complex Fruiting–Body Morphologies in Homobasidiomycetes. Proc. R. Soc. Lond. B Biol. Sci. 2002, 269, 1963–1969. [Google Scholar] [CrossRef] [PubMed]
- Zmitrovich, I. Conspectus systematis Polyporacearum v. 1.0. Folia Cryptogam. Petropolitanfa 2018, 6, 3–145. [Google Scholar]
- Dettman, J.R.; Eggertson, Q. Phylogenomic Analyses of Alternaria Section Alternaria: A High-Resolution, Genome-Wide Study of Lineage Sorting and Gene Tree Discordance. Mycologia 2021, 113, 1218–1232. [Google Scholar] [CrossRef] [PubMed]
- Zhang, S.; Zhang, J.; Wang, C.; Chen, X.; Zhao, X.; Jing, H.; Liu, H.; Li, Z.; Wang, L.; Shi, J. COVID-19 and Ischemic Stroke: Mechanisms of Hypercoagulability (Review). Int. J. Mol. Med. 2021, 47, 21. [Google Scholar] [CrossRef] [PubMed]
- Simmons, E.G. Alternaria Themes and Variations (287–304): Species on Caryophyllaceae. Mycotaxon 2002, 82, 1–40. [Google Scholar]
- Díaz, G.A.; Mostert, L.; Halleen, F.; Lolas, M.; Gutierrez, M.; Ferrada, E.; Latorre, B.A. Diplodia Seriata Associated with Botryosphaeria Canker and Dieback in Apple Trees in Chile. Plant Dis. 2019, 103, 1025. [Google Scholar] [CrossRef]
- Elena, G.; Luque, J. Seasonal Susceptibility of Grapevine Pruning Wounds and Cane Colonization in Catalonia, Spain Following Artificial Infection with Diplodia Seriata and Phaeomoniella Chlamydospora. Plant Dis. 2016, 100, 1651–1659. [Google Scholar] [CrossRef]
- Swart, W.J. and Wingfield, M.J. Biology and Control of Sphaeropsis sapinea on Pinus species in South Africa. Plant Dis. 1991, 75, 761–766. [Google Scholar] [CrossRef]
- Oliva, J.; Rommel, S.; Fossdal, C.G.; Hietala, A.M.; Nemesio-Gorriz, M.; Solheim, H.; Elfstrand, M. Transcriptional Responses of Norway Spruce (Picea Abies) Inner Sapwood against Heterobasidion Parviporum. Tree Physiol. 2015, 35, 1007–1015. [Google Scholar] [CrossRef]
- Kovalchuk, A.; Wen, Z.; Sun, H.; Asiegbu, F.O. Heterobasidion Annosum s.l.: Biology, Genomics, and Pathogenicity Factors. In Forest Microbiology; Elsevier: Amsterdam, The Netherlands, 2022; pp. 345–359. [Google Scholar]
- Sierota, Z. Heterobasidion Root Rot in Forests on Former Agricultural Lands in Poland: Scale of Threat and Prevention. Sci. Res. Essays 2013, 8, 2298–2305. [Google Scholar]
- Misiek, M.; Hoffmeister, D. Sesquiterpene Aryl Ester Natural Products in North American Armillaria Species. Mycol. Prog. 2012, 11, 7–15. [Google Scholar] [CrossRef]
- Zeiner, C.A.; Purvine, S.O.; Zink, E.M.; Paša-Tolić, L.; Chaput, D.L.; Haridas, S.; Wu, S.; LaButti, K.; Grigoriev, I.V.; Henrissat, B.; et al. Comparative Analysis of Secretome Profiles of Manganese(II)-Oxidizing Ascomycete Fungi. PLoS ONE 2016, 11, e0157844. [Google Scholar] [CrossRef] [PubMed]
- Sieber, T.N. Pyrenochaeta Ligni-Putridi Sp. Nov., a New Coelomycete Associated with Butt Rot of Picea Abies in Switzerland. Mycol. Res. 1995, 99, 274–276. [Google Scholar] [CrossRef]
- Infantino, A.; Pucci, N. A PCR-Based Assay for the Detection and Identification of Pyrenochaeta Lycopersici. Eur. J. Plant Pathol. 2005, 112, 337–347. [Google Scholar] [CrossRef]
- Butin, H. Tree Diseases and Disorders: Causes, Biology, and Control in Forest and Amenity Trees; Oxford University Press: Oxford, UK, 1995. [Google Scholar]
- Sivanesan, A. Acantharia, Gibbera and Their Anamorphs. Trans. Br. Mycol. Soc. 1984, 82, 507–529. [Google Scholar] [CrossRef]
- Kowalski, T.; Andruch, K. Mycobiota in Needles of Abies Alba with and without Symptoms of Herpotrichia Needle Browning. For. Pathol. 2012, 42, 183–190. [Google Scholar] [CrossRef]
- Barr, M.E. Notes on Some “Dimeriaceous” Fungi. Mycotaxon 1997, 64, 149–171. [Google Scholar]
- Harman, G.; Khadka, R.; Doni, F.; Uphoff, N. Benefits to Plant Health and Productivity From Enhancing Plant Microbial Symbionts. Front. Plant Sci. 2021, 11, 610065. [Google Scholar] [CrossRef]
- Schmidt, S.; Moser, M.; Sperandio, M. The Molecular Basis of Leukocyte Recruitment and Its Deficiencies. Mol. Immunol. 2013, 55, 49–58. [Google Scholar] [CrossRef]
- Bálint, M.; Schmidt, P.; Sharma, R.; Thines, M.; Schmitt, I. An Illumina Metabarcoding Pipeline for Fungi. Ecol. Evol. 2014, 4, 2642–2653. [Google Scholar] [CrossRef]
- Vilgalys, R.; Hester, M. Rapid Genetic Identification and Mapping of Enzymatically Amplified Ribosomal DNA from Several Cryptococcus Species. J. Bacteriol. 1990, 172, 4238–4246. [Google Scholar] [CrossRef] [PubMed]
- Aronesty, E. Comparison of Sequencing Utility Programs. Open Bioinforma J. 2013, 7, 1–8. [Google Scholar] [CrossRef]
- Benson, D.A.; Cavanaugh, M.; Clark, K.; Karsch-Mizrachi, I.; Ostell, J.; Pruitt, K.D.; Sayers, E.W. GenBank. Nucleic Acids Res. 2018, 46, D41–D47. [Google Scholar] [CrossRef] [PubMed]
- Kubartová, A.; Ottosson, E.; Dahlberg, A.; Stenlid, J. Patterns of Fungal Communities among and within Decaying Logs, Revealed by 454 Sequencing. Mol. Ecol. 2012, 21, 4514–4532. [Google Scholar] [CrossRef]
- Raja, H.A.; Miller, A.N.; Pearce, C.J.; Oberlies, N.H. Fungal Identification Using Molecular Tools: A Primer for the Natural Products Research Community. J. Nat. Prod. 2017, 80, 756–770. [Google Scholar] [CrossRef]
- Põlme, S.; Abarenkov, K.; Henrik Nilsson, R.; Lindahl, B.D.; Clemmensen, K.E.; Kauserud, H.; Nguyen, N.; Kjøller, R.; Bates, S.T.; Baldrian, P.; et al. FungalTraits: A User-Friendly Traits Database of Fungi and Fungus-like Stramenopiles. Fungal Divers. 2020, 105, 1–16. [Google Scholar] [CrossRef]
- Oksanen, J.; Friendly, M.; Kindt, R. Measurement of Biodiversity (MoB) View Project. Available online: https://cran.r-project.org/web/packages/vegan/vegan.pdf (accessed on 1 May 2023).
- R Core Team. R: A Language and Environment for Statistical Computing. R Foundation for Statistical Computing. 2022. Available online: https://www.R-project.org (accessed on 3 May 2023).


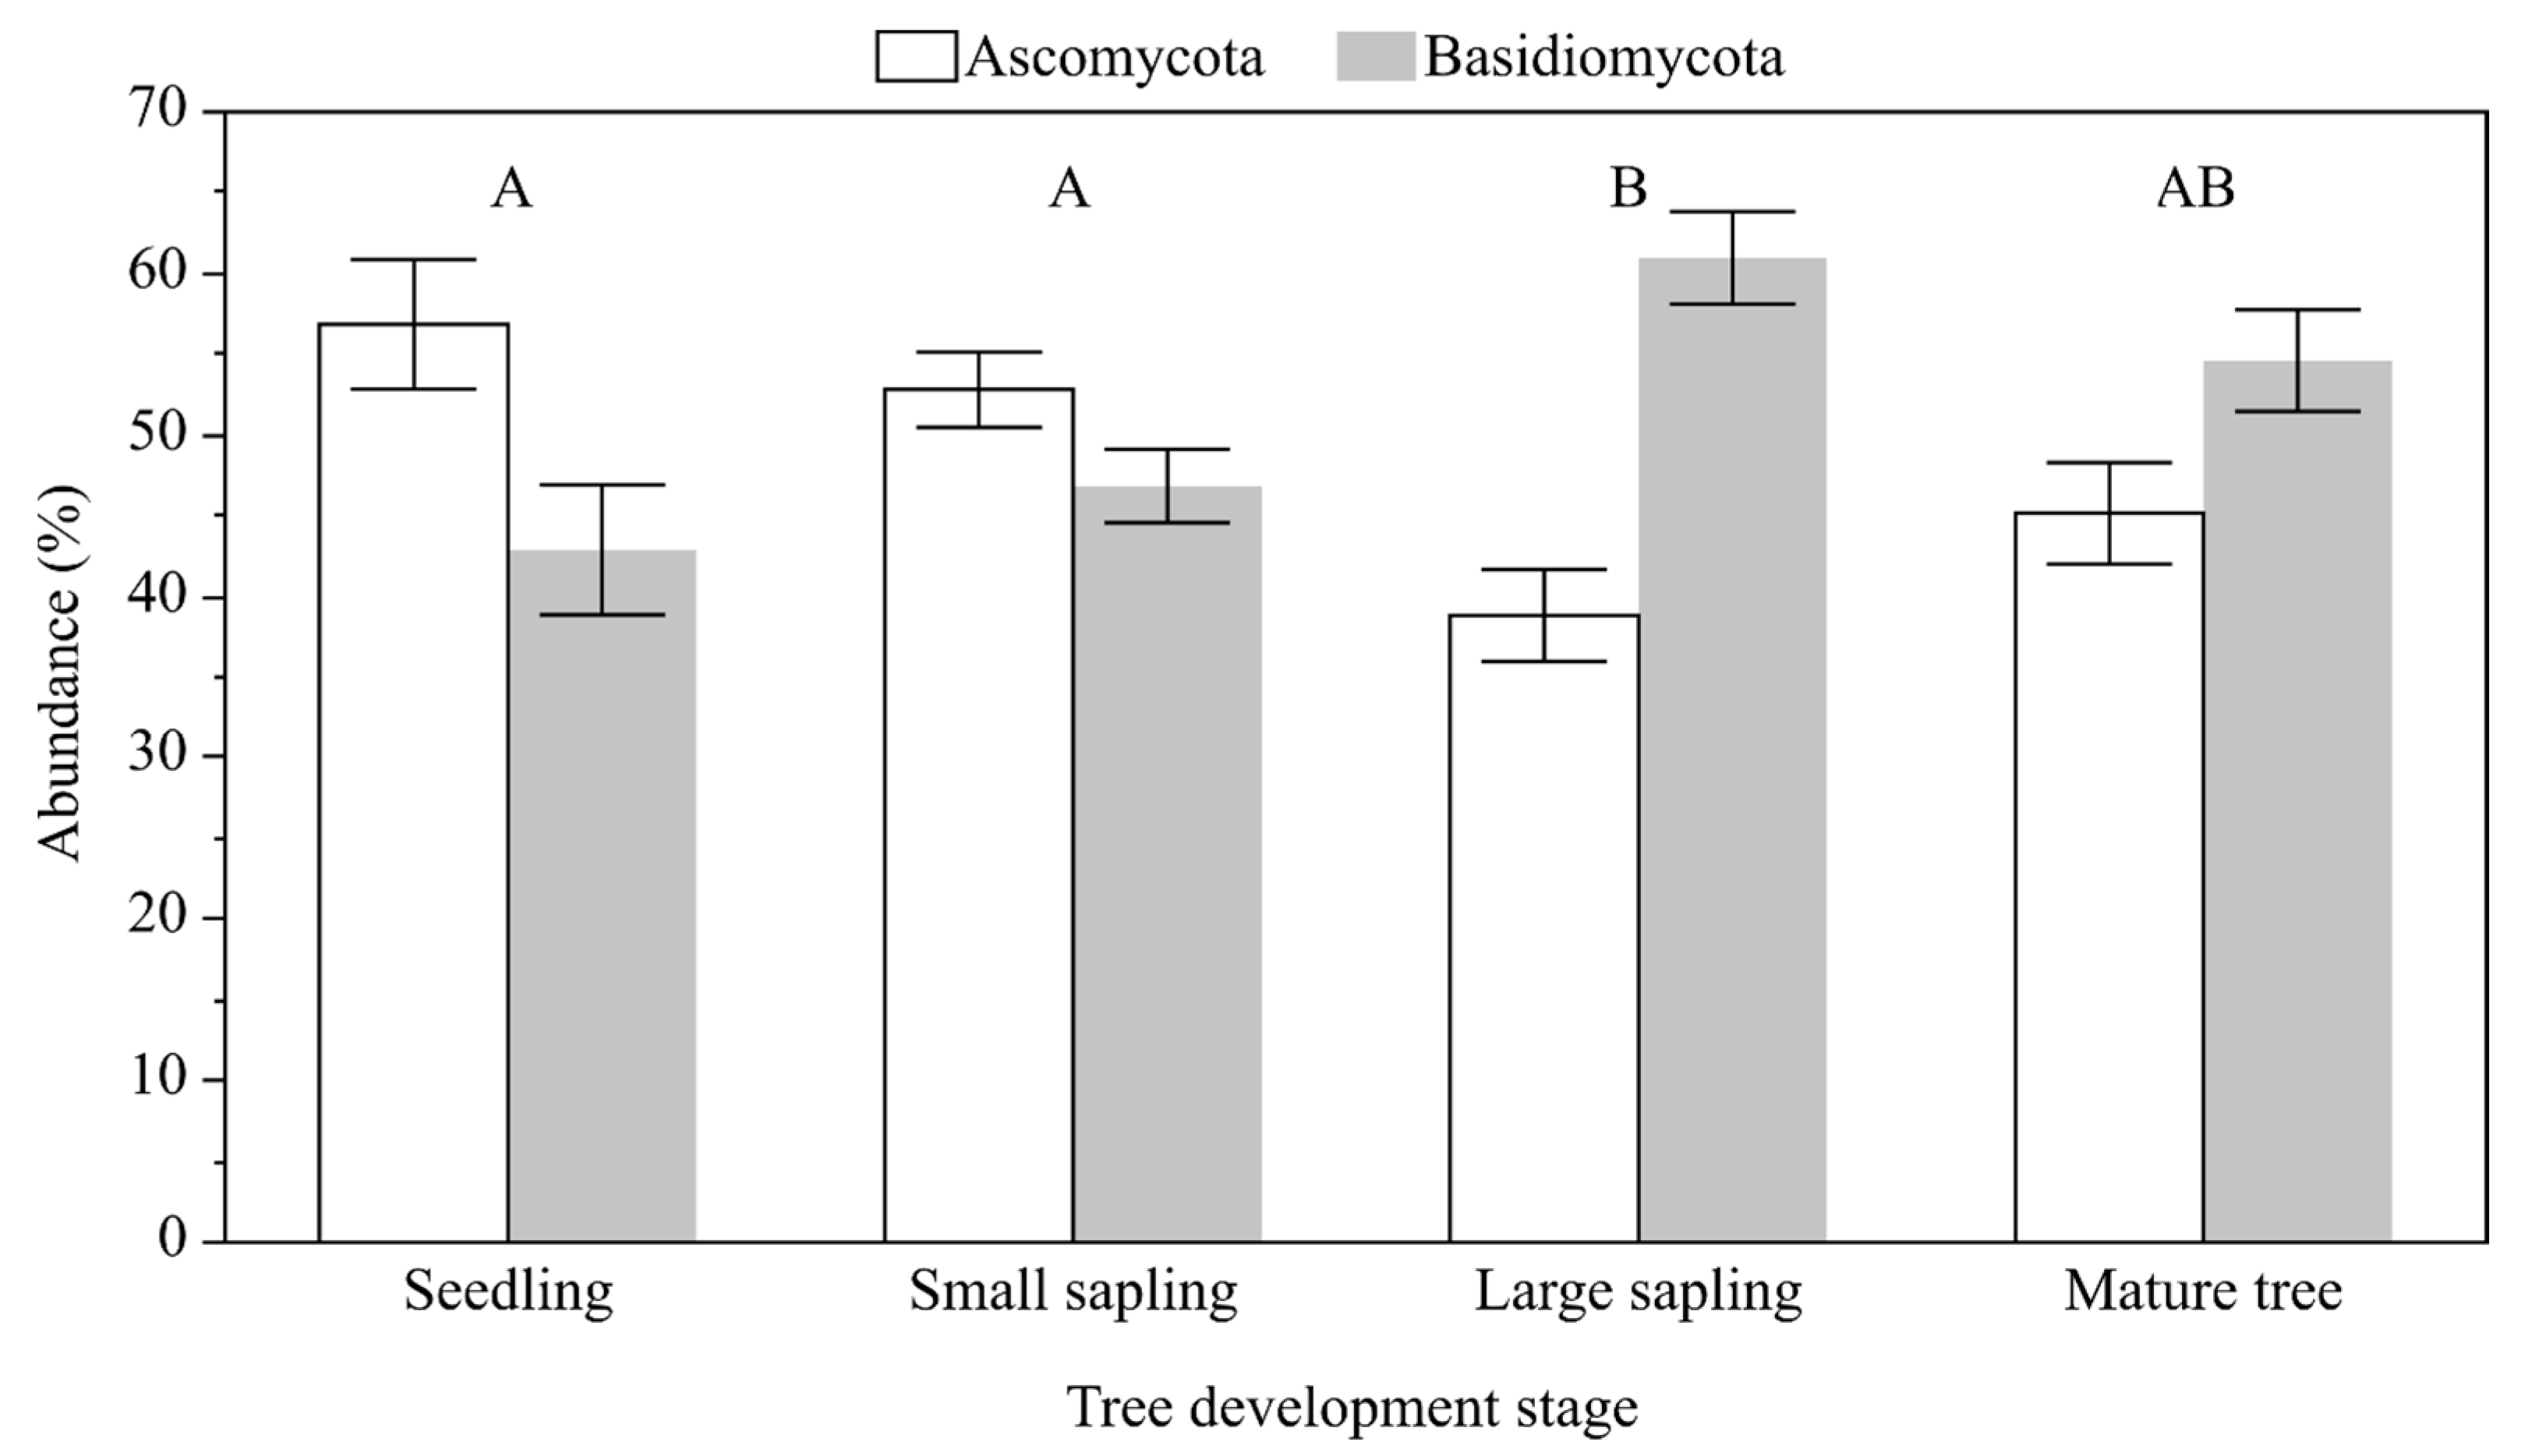
| Source of Variation | Df | F | P (α) |
|---|---|---|---|
| TDS | 3 | 5.474 | 0.003 |
| S | 2 | 2.055 | 0.140 |
| TDS × S | 6 | 0.404 | 0.872 |
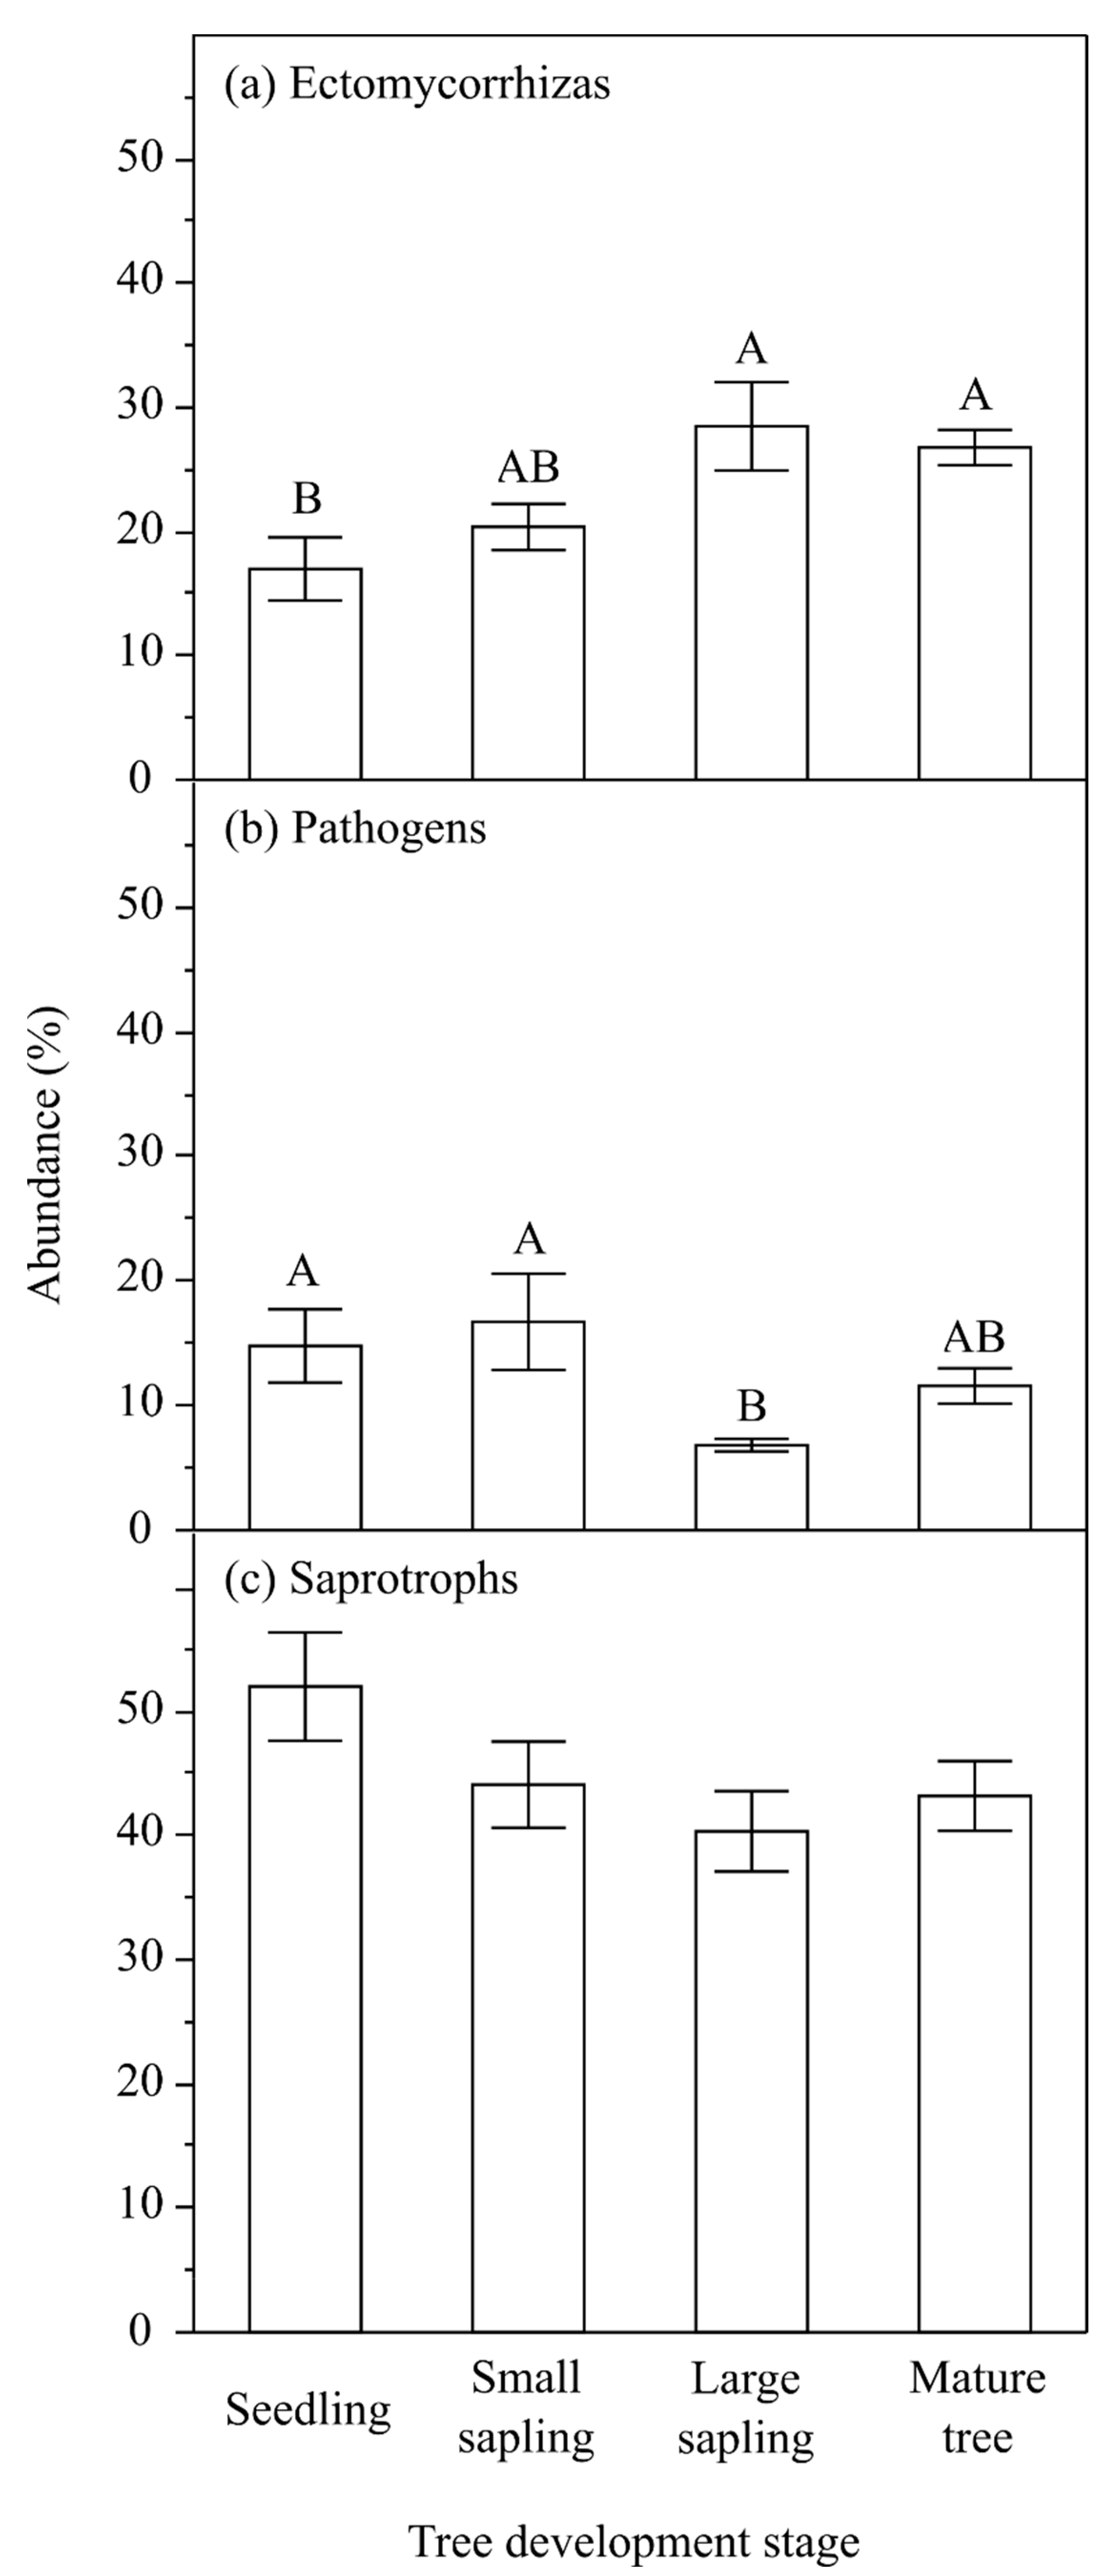
| Source of Variation | Df | Ectomycorrhizas | Pathogens | Saprotrophs | |||
|---|---|---|---|---|---|---|---|
| F | P (α) | F | P (α) | F | P (α) | ||
| TDS | 3 | 5.616 | 0.002 | 3.942 | 0.014 | 2.598 | 0.063 |
| S | 2 | 1.363 | 0.266 | 0.984 | 0.382 | 5.522 | 0.007 |
| TDS × S | 6 | 1.538 | 0.187 | 1.766 | 0.127 | 1.792 | 0.122 |
| Tree Development Stage | Chao1 | Shannon | Simpson | ||||
|---|---|---|---|---|---|---|---|
| Mean (Standard Error) | |||||||
| Seedlings | 718 (61) b | 3.91 (0.230) | 0.986 (0.044) | ||||
| Small saplings | 1213 (128) a | 4.06 (0.209) | 0.923 (0.023) | ||||
| Large saplings | 845 (76) b | 3.92 (0.195) | 0.901 (0.036) | ||||
| Mature trees | 891 (89) ab | 4.23 (0.219) | 0.932 (0.030) | ||||
| Analysis of Variance | |||||||
| Source of Variation | Df | F | P (α) | F | P (α) | F | P (α) |
| TDS | 3 | 5.307 | 0.003 | 2.249 | 0.097 | 0.270 | 0.847 |
| S | 2 | 1.296 | 0.283 | 2.477 | 0.096 | 0.122 | 0.886 |
| TDS × S | 6 | 1.046 | 0.408 | 2.126 | 0.071 | 2.012 | 0.083 |
| Protection Zone, Compartment, GPS Location | Area [ha] | Forest Stratum | Cover [%] | Species Composition * [Age in Years] |
|---|---|---|---|---|
| Lipniak, 15f 54°08′53.4″ N 23°05′15.5″ E | 9.75 | Overstorey | 80 | Pa (116), Ps (116) |
| II stratum | 20 | Pa (75), Pa (50), Bp (50), Tc (50) | ||
| Large saplings | 10 | Pa (25) | ||
| Small saplings | ns | Pa (5), Qr (3), Ap (3), Tc (3) | ||
| Undergrowth | 50 | Lx, Ca, Fa, Sa, Ev | ||
| Mikołajewo, 210c 54°02′10.5″ N 23°08′55.0″ E | 6.55 | Overstorey | 70 | Pa (141), Ps (141), Pa (101) |
| II stratum | 30 | Pa (76), Pa (46), Qr (46), Pt (46) | ||
| III stratum | 20 | Pa (31), Qr (31) | ||
| Large saplings | 30 | Pa (21), Pa (11), Qr (21) | ||
| Small saplings | 10 | Pa (4), Qr (4) | ||
| Undergrowth | 30 | Ca, Sa, Lx, Fa, Ev | ||
| Powały, 390c 53°59′59.7″ N 23°02′12.9″ E | 7.98 | Overstorey | 60 | Ps (121), Pa (85), Pa (121), Bp (121), |
| Bp (85), Qr (85) | ||||
| II stratum | 30 | Pa (35), Pa (50), Bp (35), Bv (50), | ||
| Qr (50), Jc (35) | ||||
| Large saplings | 10 | Pa (15), Bp (15), Qr (15) | ||
| Small saplings | ns | Pa (3), Bp (3), Qr (3) | ||
| Undergrowth | 30 | Ca, Sa |
Disclaimer/Publisher’s Note: The statements, opinions and data contained in all publications are solely those of the individual author(s) and contributor(s) and not of MDPI and/or the editor(s). MDPI and/or the editor(s) disclaim responsibility for any injury to people or property resulting from any ideas, methods, instructions or products referred to in the content. |
© 2023 by the authors. Licensee MDPI, Basel, Switzerland. This article is an open access article distributed under the terms and conditions of the Creative Commons Attribution (CC BY) license (https://creativecommons.org/licenses/by/4.0/).
Share and Cite
Behnke-Borowczyk, J.; Korzeniewicz, R.; Łukowski, A.; Baranowska, M.; Jagiełło, R.; Bułaj, B.; Hauke-Kowalska, M.; Szmyt, J.; Behnke, J.M.; Robakowski, P.; et al. Variability of Functional Groups of Rhizosphere Fungi of Norway Spruce (Picea abies (L.) H.Karst.) in the Boreal Range: The Wigry National Park, Poland. Int. J. Mol. Sci. 2023, 24, 12628. https://doi.org/10.3390/ijms241612628
Behnke-Borowczyk J, Korzeniewicz R, Łukowski A, Baranowska M, Jagiełło R, Bułaj B, Hauke-Kowalska M, Szmyt J, Behnke JM, Robakowski P, et al. Variability of Functional Groups of Rhizosphere Fungi of Norway Spruce (Picea abies (L.) H.Karst.) in the Boreal Range: The Wigry National Park, Poland. International Journal of Molecular Sciences. 2023; 24(16):12628. https://doi.org/10.3390/ijms241612628
Chicago/Turabian StyleBehnke-Borowczyk, Jolanta, Robert Korzeniewicz, Adrian Łukowski, Marlena Baranowska, Radosław Jagiełło, Bartosz Bułaj, Maria Hauke-Kowalska, Janusz Szmyt, Jerzy M. Behnke, Piotr Robakowski, and et al. 2023. "Variability of Functional Groups of Rhizosphere Fungi of Norway Spruce (Picea abies (L.) H.Karst.) in the Boreal Range: The Wigry National Park, Poland" International Journal of Molecular Sciences 24, no. 16: 12628. https://doi.org/10.3390/ijms241612628
APA StyleBehnke-Borowczyk, J., Korzeniewicz, R., Łukowski, A., Baranowska, M., Jagiełło, R., Bułaj, B., Hauke-Kowalska, M., Szmyt, J., Behnke, J. M., Robakowski, P., & Kowalkowski, W. (2023). Variability of Functional Groups of Rhizosphere Fungi of Norway Spruce (Picea abies (L.) H.Karst.) in the Boreal Range: The Wigry National Park, Poland. International Journal of Molecular Sciences, 24(16), 12628. https://doi.org/10.3390/ijms241612628