
Heavy Metals and Essential Metals Are Associated with Cerebrospinal Fluid Biomarkers of Alzheimer’s Disease

 , , , , ,
  ,
, 
 ,
, 
Abstract
1. Introduction
2. Results
2.1. Correlation
2.2. Principal Component Analysis
2.3. Redescription Mining
3. Discussion
4. Materials and Methods
4.1. Participants and Sample Collection
4.2. Analysis of Macro- and Microelements by Inductively Coupled Plasma Mass Spectroscopy
4.3. Analysis of AD Biomarkers in CSF
4.4. Statistical Analysis
4.4.1. Correlation and Principal Component Analysis
4.4.2. Redescription Mining
Supplementary Materials
Author Contributions
Funding
Institutional Review Board Statement
Informed Consent Statement
Data Availability Statement
Conflicts of Interest
Abbreviations
References
- Ashok, A.; Rai, N.K.; Tripathi, S.; Bandyopadhyay, S. Exposure to As-, Cd-, and Pb-mixture induces Aβ, amyloidogenic APP processing and cognitive impairments via oxidative stress-dependent neuroinflammation in young rats. Toxicol. Sci. 2015, 143, 64–80. [Google Scholar] [CrossRef]
- Elonheimo, H.M.; Andersen, H.R.; Katsonouri, A.; Tolonen, H. Environmental substances associated with Alzheimer’s disease —A scoping review. Int. J. Environ. Res. Public Health 2021, 18, 11839. [Google Scholar] [CrossRef]
- Sunderman, F., Jr. Nasal toxicity, carcinogenicity, and olfactory uptake of metals. Ann. Clin. Lab. Sci. 2001, 31, 3–24. [Google Scholar]
- Bush, A.I. The metal theory of Alzheimer’s disease. J. Alzheimers Dis. 2013, 33 (Suppl. S1), S277–S281. [Google Scholar] [CrossRef]
- Babić Leko, M.; Jurasović, J.; Nikolac Perković, M.; Španić, E.; Sekovanić, A.; Orct, T.; Lukinović Škudar, V.; Bačić Baronica, K.; Kiđemet-Piskač, S.; Vogrinc, Ž.; et al. The association of essential metals with APOE genotype in Alzheimer’s disease. J. Alzheimers Dis. 2021, 82, 661–672. [Google Scholar] [CrossRef]
- Zubčić, K.; Hof, P.R.; Šimić, G.; Jazvinšćak Jembrek, M. The role of copper in tau-related pathology in Alzheimer’s disease. Front. Mol. Neurosci. 2020, 13, 572308. [Google Scholar] [CrossRef]
- Wisessaowapak, C.; Visitnonthachai, D.; Watcharasit, P.; Satayavivad, J. Prolonged arsenic exposure increases tau phosphorylation in differentiated SH-SY5Y cells: The contribution of GSK3 and ERK1/2. Environ. Toxicol. Pharmacol. 2021, 84, 103626. [Google Scholar] [CrossRef]
- Shati, A.A.; Alfaifi, M.Y. Trans-resveratrol inhibits tau phosphorylation in the brains of control and cadmium chloride-treated rats by activating PP2A and PI3K/Akt induced-inhibition of GSK3β. Neurochem. Res. 2019, 44, 357–373. [Google Scholar] [CrossRef]
- Yano, K.; Hirosawa, N.; Sakamoto, Y.; Katayama, H.; Moriguchi, T. Aggregations of amyloid β-proteins in the presence of metal ions. Toxicol. Lett. 2003, 144, 134. [Google Scholar] [CrossRef]
- Wallin, C.; Sholts, S.B.; Österlund, N.; Luo, J.; Jarvet, J.; Roos, P.M.; Ilag, L.; Gräslund, A.; Wärmländer, S.K.T.S. Alzheimer’s disease and cigarette smoke components: Effects of nicotine, PAHs, and Cd(II), Cr(III), Pb(II), Pb(IV) ions on amyloid-β peptide aggregation. Sci. Rep. 2017, 7, 14423. [Google Scholar] [CrossRef] [PubMed]
- Gu, H.; Territo, P.R.; Persohn, S.A.; Bedwell, A.A.; Eldridge, K.; Speedy, R.; Chen, Z.; Zheng, W.; Du, Y. Evaluation of chronic lead effects in the blood brain barrier system by DCE-CT. J. Trace Elem. Med. Biol. 2020, 62, 126648. [Google Scholar] [CrossRef] [PubMed]
- Augusti, P.R.; Conterato, G.M.M.; Somacal, S.; Sobieski, R.; Spohr, P.R.; Torres, J.V.; Charão, M.F.; Moro, A.M.; Rocha, M.P.; Garcia, S.C.; et al. Effect of astaxanthin on kidney function impairment and oxidative stress induced by mercuric chloride in rats. Food Chem. Toxicol. 2008, 46, 212–219. [Google Scholar] [CrossRef] [PubMed]
- Yin, X.; Sun, J.; Mei, Y.; Guo, X.; Chen, S.-I.; Wang, Z.-I.; Yang, L. Effect of Hg2+ on voltage-dependent calcium channels and intracellular free calcium in trigeminal ganglion neurons of rats. Chin. J. Ind. Hyg. Occup. Dis. 2008, 26, 542–545. [Google Scholar]
- Mao, J.; Yang, J.; Zhang, Y.; Li, T.; Wang, C.; Xu, L.; Hu, Q.; Wang, X.; Jiang, S.; Nie, X.; et al. Arsenic trioxide mediates HAPI microglia inflammatory response and subsequent neuron apoptosis through p38/JNK MAPK/STAT3 pathway. Toxicol. Appl. Pharmacol. 2016, 303, 79–89. [Google Scholar] [CrossRef] [PubMed]
- Chattopadhyay, S.; Bhaumik, S.; Purkayastha, M.; Basu, S.; Nag Chaudhuri, A.; Das Gupta, S. Apoptosis and necrosis in developing brain cells due to arsenic toxicity and protection with antioxidants. Toxicol. Lett. 2002, 136, 65–76. [Google Scholar] [CrossRef]
- Bashir, S.; Sharma, Y.; Irshad, M.; Gupta, S.D.; Dogra, T.D. Arsenic-induced cell death in liver and brain of experimental rats. Basic Clin. Pharmacol. Toxicol. 2006, 98, 38–43. [Google Scholar] [CrossRef]
- Babić Leko, M. Predictive Value of Biomarkers in Early Detection and Differential Diagnosis of Alzheimer’s Disease. Ph.D. Thesis, School of Medicine, University of Zagreb, Zagreb, Croatia, 2017. [Google Scholar]
- Fasae, K.D.; Abolaji, A.O.; Faloye, T.R.; Odunsi, A.Y.; Oyetayo, B.O.; Enya, J.I.; Rotimi, J.A.; Akinyemi, R.O.; Whitworth, A.J.; Aschner, M. Metallobiology and therapeutic chelation of biometals (copper, zinc and iron) in Alzheimer’s disease: Limitations, and current and future perspectives. J. Trace Elem. Med. Biol. 2021, 67, 126779. [Google Scholar] [CrossRef]
- Ritchie, C.W.; Bush, A.I.; Mackinnon, A.; Macfarlane, S.; Mastwyk, M.; MacGregor, L.; Kiers, L.; Cherny, R.; Li, Q.-X.; Tammer, A.; et al. Metal-protein attenuation with iodochlorhydroxyquin (clioquinol) targeting Aβ amyloid deposition and toxicity in Alzheimer disease: A pilot phase 2 clinical trial. Arch. Neurol. 2003, 60, 1685–1691. [Google Scholar] [CrossRef]
- Ayton, S.; Lei, P.; Bush, A.I. Metallostasis in Alzheimer’s disease. Free Radic. Biol. Med. 2013, 62, 76–89. [Google Scholar] [CrossRef]
- Li, C.; Wang, J.; Zhou, B. The metal chelating and chaperoning effects of clioquinol: Insights from yeast studies. J. Alzheimers Dis. 2010, 21, 1249–1262. [Google Scholar] [CrossRef]
- Galbrun, E. Methods for Redescription Mining. Ph.D. Thesis, University of Helsinki, Helsinki, Finland, 2013. [Google Scholar]
- Hock, C.; Drasch, G.; Golombowski, S.; Müller-Spahn, F.; Willershausen-Zönnchen, B.; Schwarz, P.; Hock, U.; Growdon, J.H.; Nitsch, R.M. Increased blood mercury levels in patients with Alzheimer’s disease. J. Neural Transm. 1998, 105, 59–68. [Google Scholar] [CrossRef] [PubMed]
- Squitti, R.; Barbati, G.; Rossi, L.; Ventriglia, M.; Dal Forno, G.; Cesaretti, S.; Moffa, F.; Caridi, I.; Cassetta, E.; Pasqualetti, P.; et al. Excess of nonceruloplasmin serum copper in AD correlates with MMSE, CSF β-amyloid, and h-tau. Neurology 2006, 67, 76–82. [Google Scholar] [CrossRef] [PubMed]
- Kessler, H.; Pajonk, F.G.; Bach, D.; Schneider-Axmann, T.; Falkai, P.; Herrmann, W.; Multhaup, G.; Wiltfang, J.; Schäfer, S.; Wirths, O.; et al. Effect of copper intake on CSF parameters in patients with mild Alzheimer’s disease: A pilot phase 2 clinical trial. J. Neural Transm. 2008, 115, 1651–1659. [Google Scholar] [CrossRef] [PubMed]
- Strozyk, D.; Launer, L.J.; Adlard, P.A.; Cherny, R.A.; Tsatsanis, A.; Volitakis, I.; Blennow, K.; Petrovitch, H.; White, L.R.; Bush, A.I. Zinc and copper modulate Alzheimer Aβ levels in human cerebrospinal fluid. Neurobiol. Aging 2009, 30, 1069–1077. [Google Scholar] [CrossRef] [PubMed]
- Banerjee, G.; Forsgard, N.; Ambler, G.; Keshavan, A.; Paterson, R.W.; Foiani, M.S.; Toombs, J.; Heslegrave, A.; Thompson, E.J.; Lunn, M.P.; et al. Cerebrospinal fluid metallomics in cerebral amyloid angiopathy: An exploratory analysis. J. Neurol. 2022, 269, 1470–1475. [Google Scholar] [CrossRef]
- Kushnir, M.M.; Michno, W.; Rockwood, A.L.; Blennow, K.; Strathmann, F.G.; Hanrieder, J. Association of PTHrP levels in CSF with Alzheimer’s disease biomarkers. Clin. Mass Spectrom. 2018, 14, 124–129. [Google Scholar] [CrossRef]
- Ma, L.Z.; Wang, Z.X.; Wang, Z.T.; Hou, X.H.; Shen, X.N.; Ou, Y.N.; Dong, Q.; Tan, L.; Yu, J.T. Serum calcium predicts cognitive decline and clinical progression of Alzheimer’s disease. Neurotoxicol. Res. 2021, 39, 609–617. [Google Scholar] [CrossRef]
- Krishnan, S.; Rani, P. Evaluation of selenium, redox status and their association with plasma amyloid/tau in Alzheimer’s disease. Biol. Trace Elem. Res. 2014, 158, 158–165. [Google Scholar] [CrossRef]
- Vinceti, M.; Chiari, A.; Eichmüller, M.; Rothman, K.J.; Filippini, T.; Malagoli, C.; Weuve, J.; Tondelli, M.; Zamboni, G.; Nichelli, P.F.; et al. A selenium species in cerebrospinal fluid predicts conversion to Alzheimer’s dementia in persons with mild cognitive impairment. Alzheimers Res. Ther. 2017, 9, 100. [Google Scholar] [CrossRef]
- Gerhardsson, L.; Blennow, K.; Lundh, T.; Londos, E.; Minthon, L. Concentrations of metals, β-amyloid and tau-markers in cerebrospinal fluid in patients with Alzheimer’s disease. Dement. Geriatr. Cogn. Disord. 2009, 28, 88–94. [Google Scholar] [CrossRef]
- Tong, Y.; Yang, H.; Tian, X.; Wang, H.; Zhou, T.; Zhang, S.; Yu, J.; Zhang, T.; Fan, D.; Guo, X.; et al. High manganese, a risk for Alzheimer’s disease: High manganese induces amyloid-β related cognitive impairment. J. Alzheimers Dis. 2014, 42, 865–878. [Google Scholar] [CrossRef]
- Mohammed, R.S.; Ibrahim, W.; Sabry, D.; El-Jaafary, S.I. Occupational metals exposure and cognitive performance among foundry workers using tau protein as a biomarker. Neurotoxicology 2020, 76, 10–16. [Google Scholar] [CrossRef]
- Mielke, M.M.; Zandi, P.P.; Blennow, K.; Gustafson, D.; Sjögren, M.; Rosengren, L.; Skoog, I. Low serum potassium in mid life associated with decreased cerebrospinal fluid Aβ42 in late life. Alzheimer Dis. Assoc. Disord. 2006, 20, 30–36. [Google Scholar] [CrossRef]
- Shams, M.; Martola, J.; Charidimou, A.; Granberg, T.; Ferreira, D.; Westman, E.; Wintermark, M.; Iv, M.; Larvie, M.; Kristoffersen Wiberg, M.; et al. Cerebrospinal fluid metals and the association with cerebral small vessel disease. J. Alzheimer’s Dis. 2020, 78, 1229–1236. [Google Scholar] [CrossRef]
- Biekofsky, R.R.; Feeney, J. Cooperative cyclic interactions involved in metal binding to pairs of sites in EF-hand proteins. FEBS Lett. 1998, 439, 101–106. [Google Scholar] [CrossRef]
- Gifford, J.L.; Walsh, M.P.; Vogel, H.J. Structures and metal-ion-binding properties of the Ca2+-binding helix–loop–helix EF-hand motifs. Biochem. J. 2007, 405, 199–221. [Google Scholar] [CrossRef]
- Li, C.; Pan, W.; Braunewell, K.H.; Ames, J.B. Structural analysis of Mg2+ and Ca2+ binding, myristoylation, and dimerization of the neuronal calcium sensor and visinin-like protein 1 (VILIP-1). J. Biol. Chem. 2011, 286, 6354–6366. [Google Scholar] [CrossRef]
- Akke, M.; Forsén, S.; Chazin, W.J. 15N NMR assignments of (Cd2+,)2-calbindin D9k and comparison with (Ca2+)2-calbindin D9k. Cadmium as a substitute for calcium in calcium-binding proteins. Magn. Reson. Chem. 1993, 31, S128–S132. [Google Scholar] [CrossRef]
- Baksheeva, V.E.; Tsvetkov, P.O.; Zalevsky, A.O.; Vladimirov, V.I.; Gorokhovets, N.V.; Zinchenko, D.V.; Permyakov, S.E.; Devred, F.; Zernii, E.Y. Zinc modulation of neuronal calcium sensor proteins: Three modes of interaction with different structural outcomes. Biomolecules 2022, 12, 956. [Google Scholar] [CrossRef]
- Baudier, J.; Glasser, N.; Gerard, D. Ions binding to S100 proteins. I. Calcium- and zinc-binding properties of bovine brain S100αα, S100a (αβ), and S100b (ββ) protein: Zn2+ regulates Ca2+ binding on S100b protein. J. Biol. Chem. 1986, 261, 8192–8203. [Google Scholar] [CrossRef]
- Donato, H.; Mani, R.S.; Kay, C.M. Spectral studies on the cadmium-ion-binding properties of bovine brain S-100b protein. Biochem. J. 1991, 276, 13–18. [Google Scholar] [CrossRef]
- Ogoma, Y.; Kobayashi, H.; Fujii, T.; Kondo, Y.; Hachimori, A.; Shimizu, T.; Hatano, M. Binding study of metal ions to S100 protein: 43Ca, 25Mg, 67Zn and 39K n.m.r. Int. J. Biol. Macromol. 1992, 14, 279–286. [Google Scholar] [CrossRef]
- Ehnert-Russo, S.L.; Gelsleichter, J. Mercury accumulation and effects in the brain of the Atlantic sharpnose shark (Rhizoprionodon terraenovae). Arch. Environ. Contam. Toxicol. 2020, 78, 267–283. [Google Scholar] [CrossRef]
- Weng, Z.; Liu, Z.; Zhang, S.; Tao, H.; Ji, X. Zinc protection in fetal rats for maternal mercury exposure-induced growth retardation is probably associated with S100B expression. J. Obstet. Gynaecol. Res. 2017, 43, 73–77. [Google Scholar] [CrossRef]
- Yilmaz, F.M.; Yilmaz, H.; Tutkun, E.; Uysal, S.; Carman, K.B.; Ilber, D.; Ercan, M. Serum biochemical markers of central nerve system damage in children with acute elemental mercury intoxicatıon. Clin. Toxicol. 2014, 52, 32–38. [Google Scholar] [CrossRef]
- de Paula Fonseca Arrifano, G.; Del Carmen Rodriguez Martin-Doimeadios, R.; Jiménez-Moreno, M.; Augusto-Oliveira, M.; Souza-Monteiro, J.R.; Paraense, R.; Machado, C.R.; Farina, M.; Macchi, B.; do Nascimento, J.L.M.; et al. Assessing mercury intoxication in isolated/remote populations: Increased S100B mRNA in blood in exposed riverine inhabitants of the Amazon. Neurotoxicology 2018, 68, 151–158. [Google Scholar] [CrossRef]
- Paknejad, B.; Shirkhanloo, H.; Aliomrani, M. Is there any relevance between serum heavy metal concentration and BBB leakage in multiple sclerosis patients? Biol. Trace Elem. Res. 2019, 190, 289–294. [Google Scholar] [CrossRef]
- Golmohammadi, J.; Jahanian-Najafabadi, A.; Aliomrani, M. Chronic oral arsenic exposure and its correlation with serum S100B concentration. Biol. Trace Elem. Res. 2019, 189, 172–179. [Google Scholar] [CrossRef]
- Baek, S.Y.; Cho, J.H.; Kim, E.S.; Kim, H.J.; Yoon, S.; Kim, B.S.; Kim, J.B.; Lee, C.R.; Yoo, C.; Lee, J.H.; et al. CDNA array analysis of gene expression profiles in brain of mice exposed to manganese. Ind. Health 2004, 42, 315–320. [Google Scholar] [CrossRef]
- Hassan, T.; Nassar, M.; Elhadi, S.M.; Radi, W.K. Effect of magnesium sulfate therapy on patients with aneurysmal subarachnoid hemorrhage using serum S100B protein as a prognostic marker. Neurosurg. Rev. 2012, 35, 421–427. [Google Scholar] [CrossRef]
- Li, X.; Han, X.; Yang, J.; Bao, J.; Di, X.; Zhang, G.; Liu, H. Magnesium sulfate provides neuroprotection in eclampsia-like seizure model by ameliorating neuroinflammation and brain edema. Mol. Neurobiol. 2017, 54, 7938–7948. [Google Scholar] [CrossRef]
- El Farargy, M.S.; Soliman, N.A. A randomized controlled trial on the use of magnesium sulfate and melatonin in neonatal hypoxic ischemic encephalopathy. J. Neonatal. Perinatal. Med. 2019, 12, 379–384. [Google Scholar] [CrossRef]
- Jonsson, B.H.; Orhan, F.; Bruno, S.; Oliveira, A.O.; Sparding, T.; Landen, M.; Sellgren, C.M. Serum concentration of zinc is elevated in clinically stable bipolar disorder patients. Brain Behav. 2022, 12, e2472. [Google Scholar] [CrossRef]
- Vahidnia, A.; van der Voet, G.B.; de Wolff, F.A. Arsenic neurotoxicity—A review. Hum. Exp. Toxicol. 2007, 26, 823–832. [Google Scholar] [CrossRef]
- Strong, M.J.; Gaytan-Garcia, S. Proximal sciatic axotomy does not inhibit the induction of neurofilamentous inclusions following intracisternal aluminum chloride exposure. J. Neuropathol. Exp. Neurol. 1996, 55, 419–423. [Google Scholar] [CrossRef] [PubMed][Green Version]
- Vinceti, M.; Michalke, B.; Malagoli, C.; Eichmüller, M.; Filippini, T.; Tondelli, M.; Bargellini, A.; Vinceti, G.; Zamboni, G.; Chiari, A. Selenium and selenium species in the etiology of Alzheimer’s dementia: The potential for bias of the case-control study design. J. Trace Elem. Med. Biol. 2019, 53, 154–162. [Google Scholar] [CrossRef]
- González-Domínguez, R.; García-Barrera, T.; Gómez-Ariza, J.L. Characterization of metal profiles in serum during the progression of Alzheimer’s disease. Metallomics 2014, 6, 292–300. [Google Scholar] [CrossRef]
- Paglia, G.; Miedico, O.; Cristofano, A.; Vitale, M.; Angiolillo, A.; Chiaravalle, A.E.; Corso, G.; Di Costanzo, A. Distinctive pattern of serum elements during the progression of Alzheimer’s disease. Sci. Rep. 2016, 6, 22769. [Google Scholar] [CrossRef]
- Cardoso, B.R.; Hare, D.J.; Bush, A.I.; Li, Q.X.; Fowler, C.J.; Masters, C.L.; Martins, R.N.; Ganio, K.; Lothian, A.; Mukherjee, S.; et al. Selenium levels in serum, red blood cells, and cerebrospinal fluid of Alzheimer’s disease patients: A report from the Australian Imaging, Biomarker & Lifestyle Flagship Study of Ageing (AIBL). J. Alzheimers Dis. 2017, 57, 183–193. [Google Scholar] [CrossRef]
- Ashraf, A.; Stosnach, H.; Parkes, H.G.; Hye, A.; Powell, J.; Soinine, H.; Tsolaki, M.; Vellas, B.; Lovestone, S.; Aarsland, D.; et al. Pattern of altered plasma elemental phosphorus, calcium, zinc, and iron in Alzheimer’s disease. Sci. Rep. 2019, 9, 3147. [Google Scholar] [CrossRef]
- Socha, K.; Klimiuk, K.; Naliwajko, S.K.; Soroczyńska, J.; Puścion-jakubik, A.; Markiewicz-żukowska, R.; Kochanowicz, J. Dietary habits, selenium, copper, zinc and total antioxidant status in serum in relation to cognitive functions of patients with Alzheimer’s disease. Nutrients 2021, 13, 287. [Google Scholar] [CrossRef]
- Guo, X.; Lie, Q.; Liu, Y.; Jia, Z.; Gong, Y.; Yuan, X.; Liu, J. Multifunctional selenium quantum dots for the treatment of Alzheimer’s disease by reducing Aβ-neurotoxicity and oxidative stress and alleviate neuroinflammation. ACS Appl. Mater. Interfaces 2021, 13, 30261–30273. [Google Scholar] [CrossRef]
- Kitazawa, M.; Cheng, D.; Laferla, F.M. Chronic copper exposure exacerbates both amyloid and tau pathology and selectively dysregulates cdk5 in a mouse model of AD. J. Neurochem. 2009, 108, 1550–1560. [Google Scholar] [CrossRef]
- Zhou, L.-X.; Du, J.-T.; Zeng, Z.-Y.; Wu, W.-H.; Zhao, Y.-F.; Kanazawa, K.; Ishizuka, Y.; Nemoto, T.; Nakanishi, H.; Li, Y.-M. Copper (II) modulates in vitro aggregation of a tau peptide. Peptides 2007, 28, 2229–2234. [Google Scholar] [CrossRef]
- Giasson, B.I.; Sampathu, D.M.; Wilson, C.A.; Vogelsberg-Ragaglia, V.; Mushynski, W.E.; Lee, V.M.Y. The environmental toxin arsenite induces tau hyperphosphorylation. Biochemistry 2002, 41, 15376–15387. [Google Scholar] [CrossRef]
- Pakzad, D.; Akbari, V.; Sepand, M.R.; Aliomrani, M. Risk of neurodegenerative disease due to tau phosphorylation changes and arsenic exposure via drinking water. Toxicol. Res. 2021, 10, 325–333. [Google Scholar] [CrossRef]
- Zheng, F.; Li, Y.; Zhang, F.; Sun, Y.; Zheng, C.; Luo, Z.; Wang, Y.L.; Aschner, M.; Zheng, H.; Lin, L.; et al. Cobalt induces neurodegenerative damages through Pin1 inactivation in mice and human neuroglioma cells. J. Hazard. Mater. 2021, 419, 126378. [Google Scholar] [CrossRef]
- Kryukov, G.V.; Castellano, S.; Novoselov, S.V.; Lobanov, A.V.; Zehtab, O.; Guigó, R.; Gladyshev, V.N. Characterization of mammalian selenoproteomes. Science 2003, 300, 1439–1443. [Google Scholar] [CrossRef]
- Burgoyne, R.D.; Haynes, L.P. Understanding the physiological roles of the neuronal calcium sensor proteins. Mol. Brain 2012, 5, 2. [Google Scholar] [CrossRef] [PubMed]
- Pitts, M.W.; Hoffmann, P.R. Endoplasmic reticulum-resident selenoproteins as regulators of calcium signaling and homeostasis. Cell Calcium 2018, 70, 76–86. [Google Scholar] [CrossRef]
- Faraco, G.; Hochrainer, K.; Segarra, S.G.; Schaeffer, S.; Santisteban, M.M.; Menon, A.; Jiang, H.; Holtzman, D.M.; Anrather, J.; Iadecola, C. Dietary salt promotes cognitive impairment through tau phosphorylation. Nature 2019, 574, 686–690. [Google Scholar] [CrossRef] [PubMed]
- Souza, L.A.C.; Trebak, F.; Kumar, V.; Satou, R.; Kehoe, P.G.; Yang, W.; Wharton, W.; Earley, Y.F. Elevated cerebrospinal fluid sodium in hypertensive human subjects with a family history of Alzheimer’s disease. Physiol. Genomics 2020, 52, 133–142. [Google Scholar] [CrossRef] [PubMed]
- Mohamed, S.A.; Herrmann, K.; Adlung, A.; Paschke, N.; Hausner, L.; Frölich, L.; Schad, L.; Groden, C.; Ulrich, H.K. Evaluation of sodium (23Na) MR-imaging as a biomarker and predictor for neurodegenerative changes in patients with Alzheimer’s disease. In Vivo 2021, 35, 429–435. [Google Scholar] [CrossRef] [PubMed]
- Li, T.; Xie, Y.; Bowe, B.; Xian, H.; Al-Aly, Z. Serum phosphorus levels and risk of incident dementia. PLoS ONE 2017, 12, e0171377. [Google Scholar] [CrossRef] [PubMed]
- Park, J.C.; Han, S.H.; Byun, M.S.; Yi, D.; Lee, J.H.; Park, K.; Lee, D.Y.; Mook-Jung, I. Low serum phosphorus correlates with cerebral Aβ deposition in cognitively impaired subjects: Results from the KBASE study. Front. Aging Neurosci. 2017, 9, 362. [Google Scholar] [CrossRef]
- Chiu, S.S.; Khan, A.S.; Badmaev, V.; Terpstra, K.; Cernovsky, Z.; Varghese, J.; Khazaeipool, Z.; Elias, H.; Carriere, A.; Husni, M.; et al. Exploratory study of sublimed sulfur, in cognitively normal subjects and in Alzheimer’s dementia (AD) subjects: Implications for sulfur targeting hydrogen sulfide (H2S)/homocysteine (Hcy) and beta-galactosidase (GALAC)/autophagy signaling in AD. J. Syst. Integr. Neurosci. 2017, 3, 1–10. [Google Scholar] [CrossRef][Green Version]
- Paul, B.D. Neuroprotective roles of the reverse transsulfuration pathway in Alzheimer’s disease. Front. Aging Neurosci. 2021, 13, 659402. [Google Scholar] [CrossRef]
- Heafield, M.T.; Fearn, S.; Steventon, G.B.; Waring, R.H.; Williams, A.C.; Sturman, S.G. Plasma cysteine and sulphate levels in patients with motor neurone, Parkinson’s and Alzheimer’s disease. Neurosci. Lett. 1990, 110, 216–220. [Google Scholar] [CrossRef]
- Giovinazzo, D.; Bursac, B.; Sbodio, J.I.; Nalluru, S.; Vignane, T.; Snowman, A.M.; Albacarys, L.M.; Sedlak, T.W.; Torregrossa, R.; Whiteman, M.; et al. Hydrogen sulfide is neuroprotective in Alzheimer’s disease by sulfhydrating GSK3β and inhibiting tau hyperphosphorylation. Proc. Natl. Acad. Sci. USA 2021, 118, e2017225118. [Google Scholar] [CrossRef]
- Disbrow, E.; Stokes, K.Y.; Ledbetter, C.; Patterson, J.; Kelley, R.; Pardue, S.; Reekes, T.; Larmeu, L.; Batra, V.; Yuan, S.; et al. Plasma hydrogen sulfide: A biomarker of Alzheimer’s disease and related dementias. Alzheimers Dement. 2021, 17, 1391–1402. [Google Scholar] [CrossRef]
- Nakamura, S.; Shioya, K.; Hiraoka, B.Y.; Suzuki, N.; Hoshino, T.; Fujiwara, T.; Yoshinari, N.; Ansai, T.; Yoshida, A. Porphyromonas gingivalis hydrogen sulfide enhances methyl mercaptan-induced pathogenicity in mouse abscess formation. Microbiology 2018, 164, 529–539. [Google Scholar] [CrossRef] [PubMed]
- Ekundayo, T.C.; Olasehinde, T.A.; Okaiyeto, K.; Okoh, A.I. Microbial pathogenesis and pathophysiology of Alzheimer’s disease: A systematic assessment of microorganisms’ implications in the neurodegenerative disease. Front. Neurosci. 2021, 15, 648484. [Google Scholar] [CrossRef] [PubMed]
- Španić, E.; Langer Horvat, L.; Ilić, K.; Hof, P.R.; Šimić, G. NLRP1 inflammasome activation in the hippocampal formation in Alzheimer’s disease: Correlation with neuropathological changes and unbiasedly estimated neuronal loss. Cells 2022, 11, 2223. [Google Scholar] [CrossRef] [PubMed]
- Ficiarà, E.; Boschi, S.; Ansari, S.; D’Agata, F.; Abollino, O.; Caroppo, P.; Di Fede, G.; Indaco, A.; Rainero, I.; Guiot, C. Machine learning profiling of Alzheimer’s disease patients based on current cerebrospinal fluid markers and iron content in biofluids. Front. Aging Neurosci. 2021, 13, 52. [Google Scholar] [CrossRef] [PubMed]
- Boban, M.; Malojčić, B.; Mimica, N.; Vuković, S.; Zrilić, I.; Hof, P.R.; Šimić, G. The reliability and validity of the mini-mental state examination in the elderly Croatian population. Dement. Geriatr. Cogn. Disord. 2012, 33, 385–392. [Google Scholar] [CrossRef]
- McKhann, G.M.; Knopman, D.S.; Chertkow, H.; Hyman, B.T.; Jack, C.R.; Kawas, C.H.; Klunk, W.E.; Koroshetz, W.J.; Manly, J.J.; Mayeux, R.; et al. The diagnosis of dementia due to Alzheimer’s disease: Recommendations from the National Institute on Aging-Alzheimer’s Association workgroups on diagnostic guidelines for Alzheimer’s disease. Alzheimers Dement. 2011, 7, 263–269. [Google Scholar] [CrossRef]
- Petersen, R.C.; Smith, G.E.; Waring, S.C.; Ivnik, R.J.; Tangalos, E.G.; Kokmen, E. Mild cognitive impairment: Clinical characterization and outcome. Arch. Neurol. 1999, 56, 303–308. [Google Scholar] [CrossRef]
- Mihelčić, M.; Džeroski, S.; Lavrač, N.; Šmuc, T. Redescription mining augmented with random forest of multi-target predictive clustering trees. J. Intell. Inf. Syst. 2018, 50, 63–96. [Google Scholar] [CrossRef]
- Mihelčić, M.; Džeroski, S.; Lavrač, N.; Šmuc, T. A framework for redescription set construction. Expert Syst. Appl. 2017, 68, 196–215. [Google Scholar] [CrossRef][Green Version]
- Jaccard, P. The distribution of the flora in the Alpine zone. New Phytol. 1912, 11, 37–50. [Google Scholar] [CrossRef]
- Mihelčić, M.; Šmuc, T. Approaches for multi-view redescription mining. IEEE Access 2021, 9, 19356–19378. [Google Scholar] [CrossRef]


| In CSF | p-tau181 | p-tau199 | p-tau231 | VILIP-1 | YKL-40 | S100B | NFL | PAPP-A | Aβ1–42, Aβ1–42/p-tau181 or Albumin |
|---|---|---|---|---|---|---|---|---|---|
| Fe | rS = 0.26, p < 0.001(193) *B | rs = 0.258, p < 0.001 (193) *F | rs = 0.236, p = 0.001 (193) *C | rs = 0.407, p < 0.001 (193)* | rs = 0.32, p < 0.001 (178)* | rs = 0.286, p < 0.001 (158) *E | rs = 0.344, p < 0.001 (118)* | rs = 0.243, p = 0.001 (178)* | rs = 0.314, p < 0.001 (142) (albumin)* |
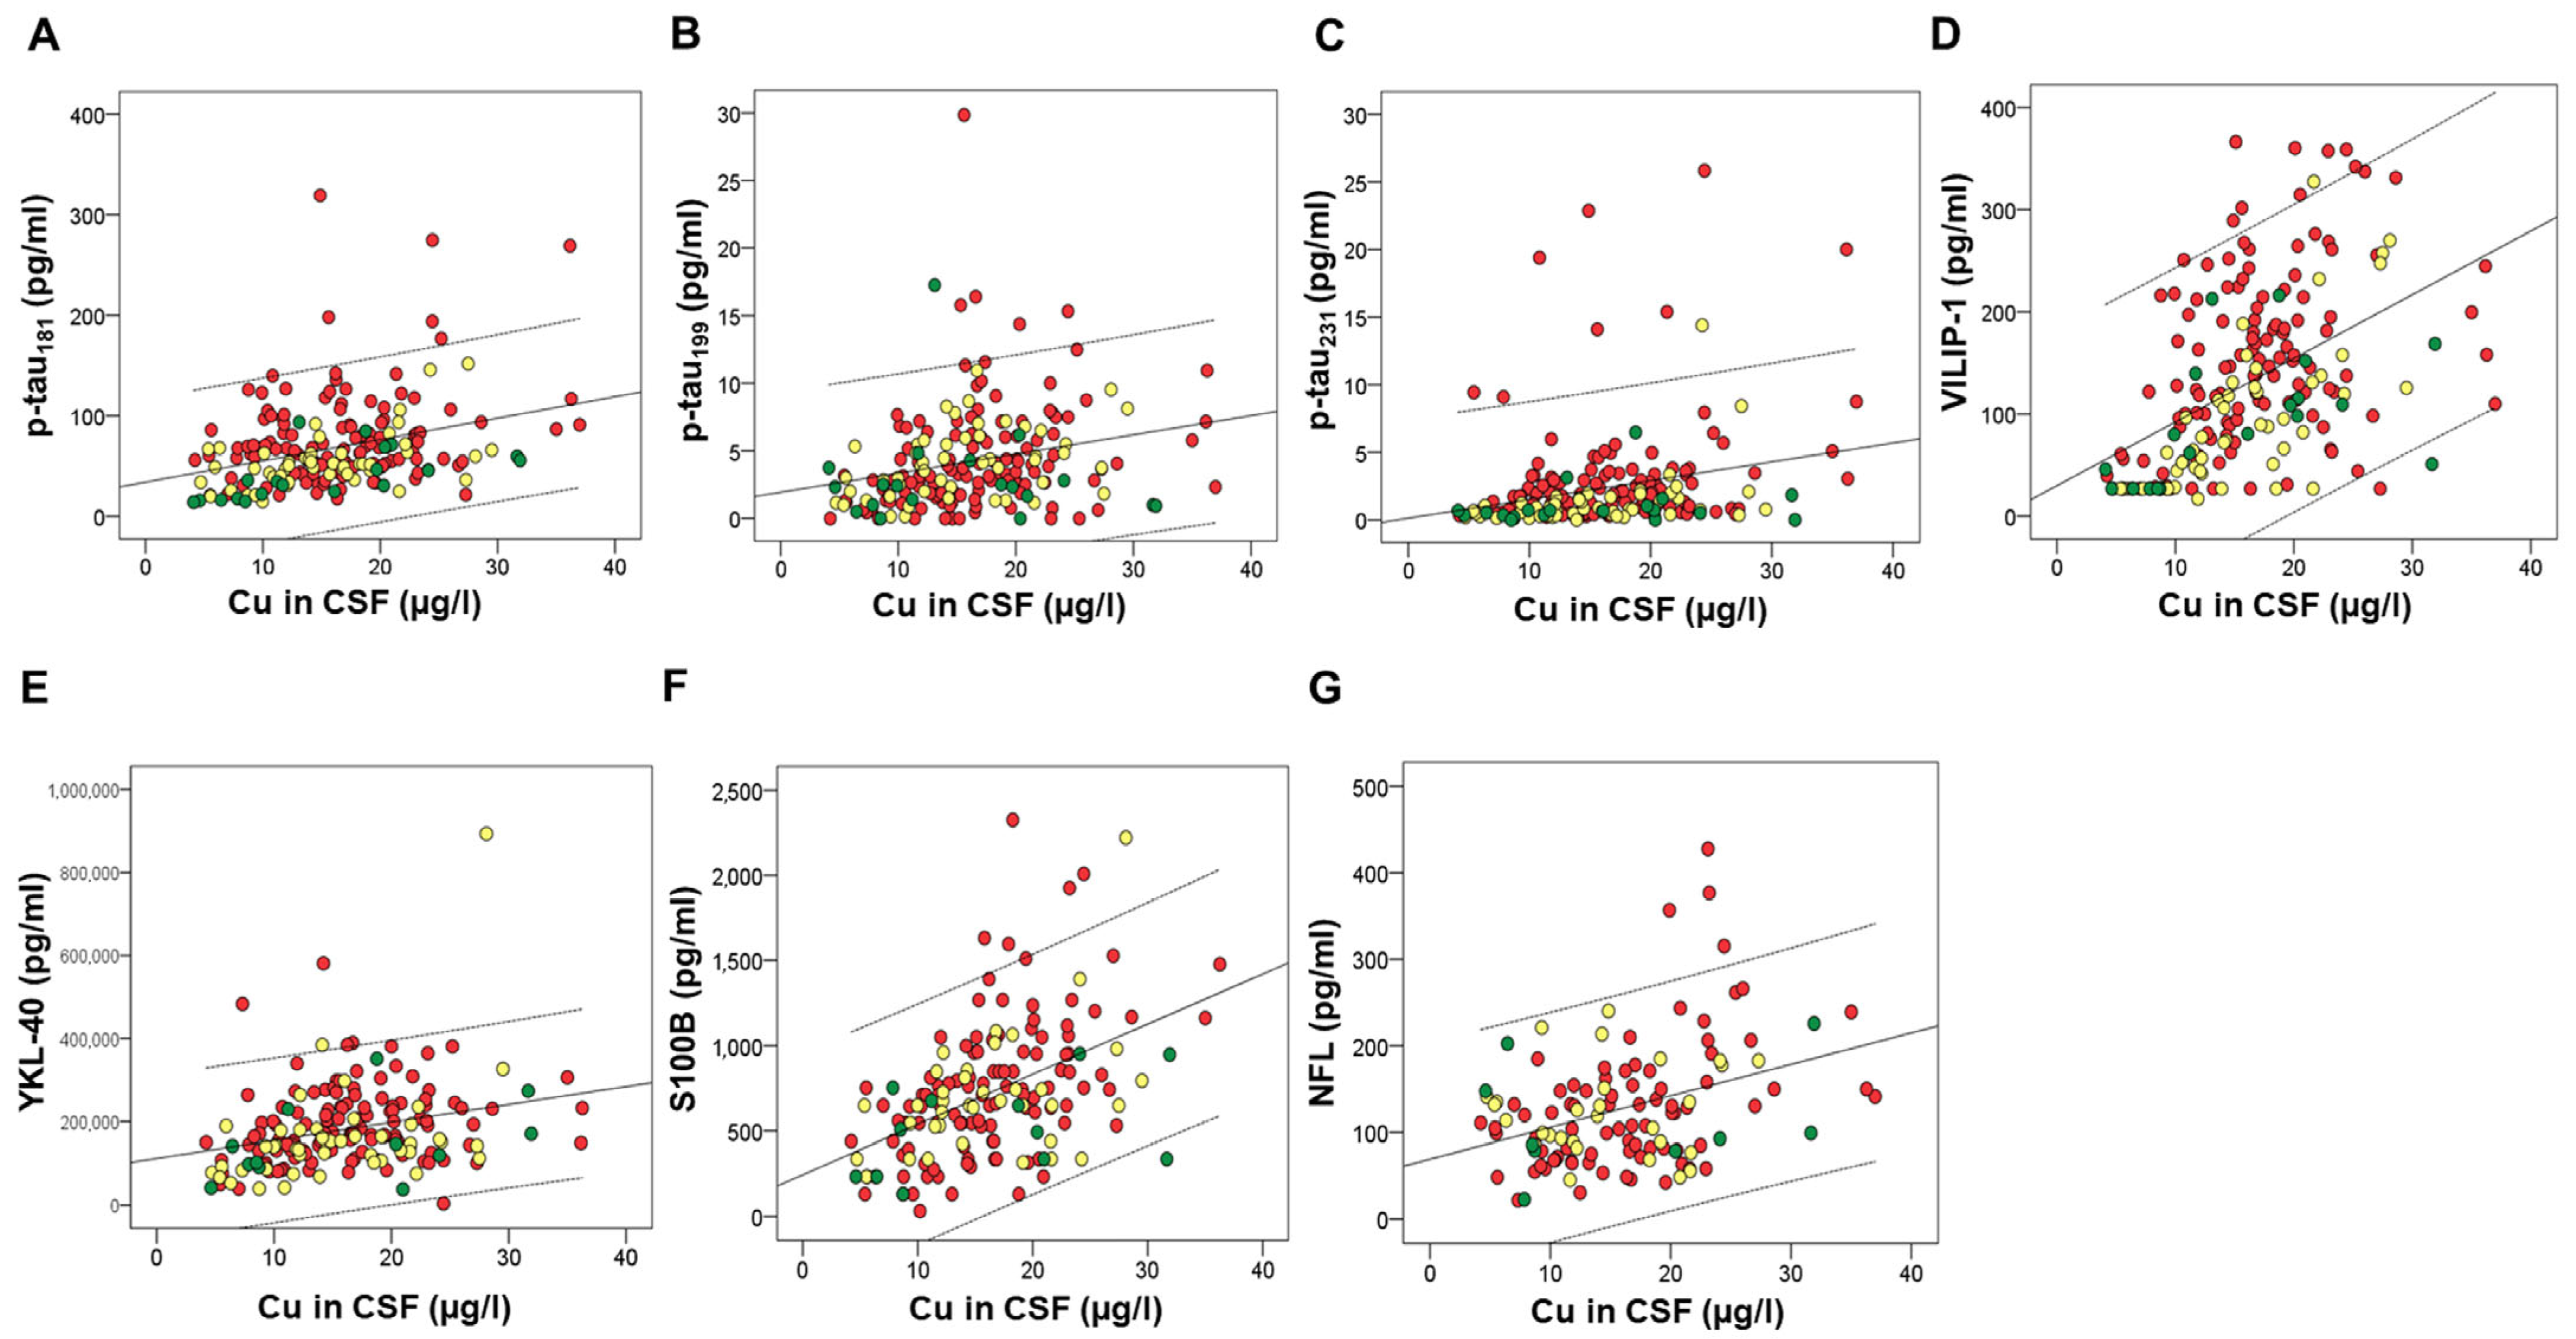
| Cu | rs = 0.321, p < 0.001 (193)* | rs = 0.334, p < 0.001 (193)* | rs = 0.303, p < 0.001 (193)* | rs = 0.537, p < 0.001 (193)* | rs = 0.309, p < 0.001 (178)* | rs = 0.483, p < 0.001 (158)* | rs = 0.323, p < 0.001 (118)* | rs = 0.435, p < 0.001 (178)* | rs = 0.439, p < 0.001 (142) (albumin)* |
| S | rs = 0.246, p = 0.001 (193) *A | rs = 0.322, p < 0.001 (193) *A | rs = 0.549, p < 0.001 (193)* | rs = 0.394, p < 0.001 (178)* | rs = 0.611, p < 0.001 (159)* | rs = 0.381, p < 0.001 (119)* | rs = 0.523, p < 0.001 (178)* | rs = 0.49, p < 0.001 (142) (albumin)* r = −0.25, p < 0.001 (192) (Aβ1–42/p-tau181) *B | |
| K | rS = 0.239, p = 0.001 (193) *G | rs = 0.27, p < 0.001 (193)* | rs = 0.541, p < 0.001 (193)* | rs = 0.26, p < 0.001 (178) *C | rs = 0.311, p < 0.001 (159)* | rs = 0.302, p = 0.001 (119)* | rs = 0.288, p < 0.001 (178)* | ||
| Se | rs = 0.466, p < 0.001 (193)* | rs = 0.399, p < 0.001 (193)* | rs = 0.344, p < 0.001 (193)* | rs = 0.614, p < 0.001 (193)* | rs = 0.277, p < 0.001 (178) *H | rs = 0.398, p < 0.001 (159)* | rs = 0.322, p < 0.001 (178)* | r = 0.294, p < 0.001 (142) (albumin) *B | |
| Co | rS = 0.223, p = 0.002 (193) *B | rs = 0.359, p < 0.001 (192)* | rs = 0.446, p < 0.001 (192)* | rs = 0.284, p < 0.001 (179) *A | rs = 0.42, p < 0.001 (159)* | rs = 0.315, p < 0.001 (119)* | rs = 0.476, p < 0.001 (177)* | r = 0.349, p < 0.001 (142) (albumin) *A | |
| Mn | rs = 0.23, p = 0.001 (193) *B | rs = 0.261, p < 0.001 (193)* | rs = 0.33, p < 0.001 (193)* | rs = 0.274, p < 0.001 (159) *B | rs = 0.318, p < 0.001 (178)* | ||||
| Ni (CSF) | rs = 0.253, p < 0.001 (188)* | r = 0.307, p < 0.001 (188)* | rs = 0.309, p < 0.001 (188)* | rs = 0.252, p = 0.001 (178) *C | rs = 0.306, p < 0.001 (173)* | rs = 0.29, p < 0.001 (139) (albumin) *C | |||
| Ni (plasma) | r = 0.353, p < 0.001 (123)* | r = 0.376 p < 0.001 (135)* | rs = 0.288, p = 0.001 (134) (albumin)* | ||||||
| Na (CSF) | rs = 0.3, p < 0.001 (193) *A | rs = 0.590, p < 0.001 (193) *A | rs = 0.356, p < 0.001 (178)* | rs = 0.422, p < 0.001 (159)* | rs = 0.325, p < 0.001 (119)* | rs = 0.338, p < 0.001 (178)* | |||
| Na (plasma) | r = 0.321, p < 0.001 (123) | ||||||||
| Mg | rs = 0.255, p < 0.001 (193) *A | rs = 0.550, p < 0.001 (193) *A | rs = 0.29, p < 0.001 (178)* | rs = 0.37, p < 0.001 (159)* | rs = 0.366, p < 0.001 (119)* | rs = 0.345, p < 0.001 (178)* | |||
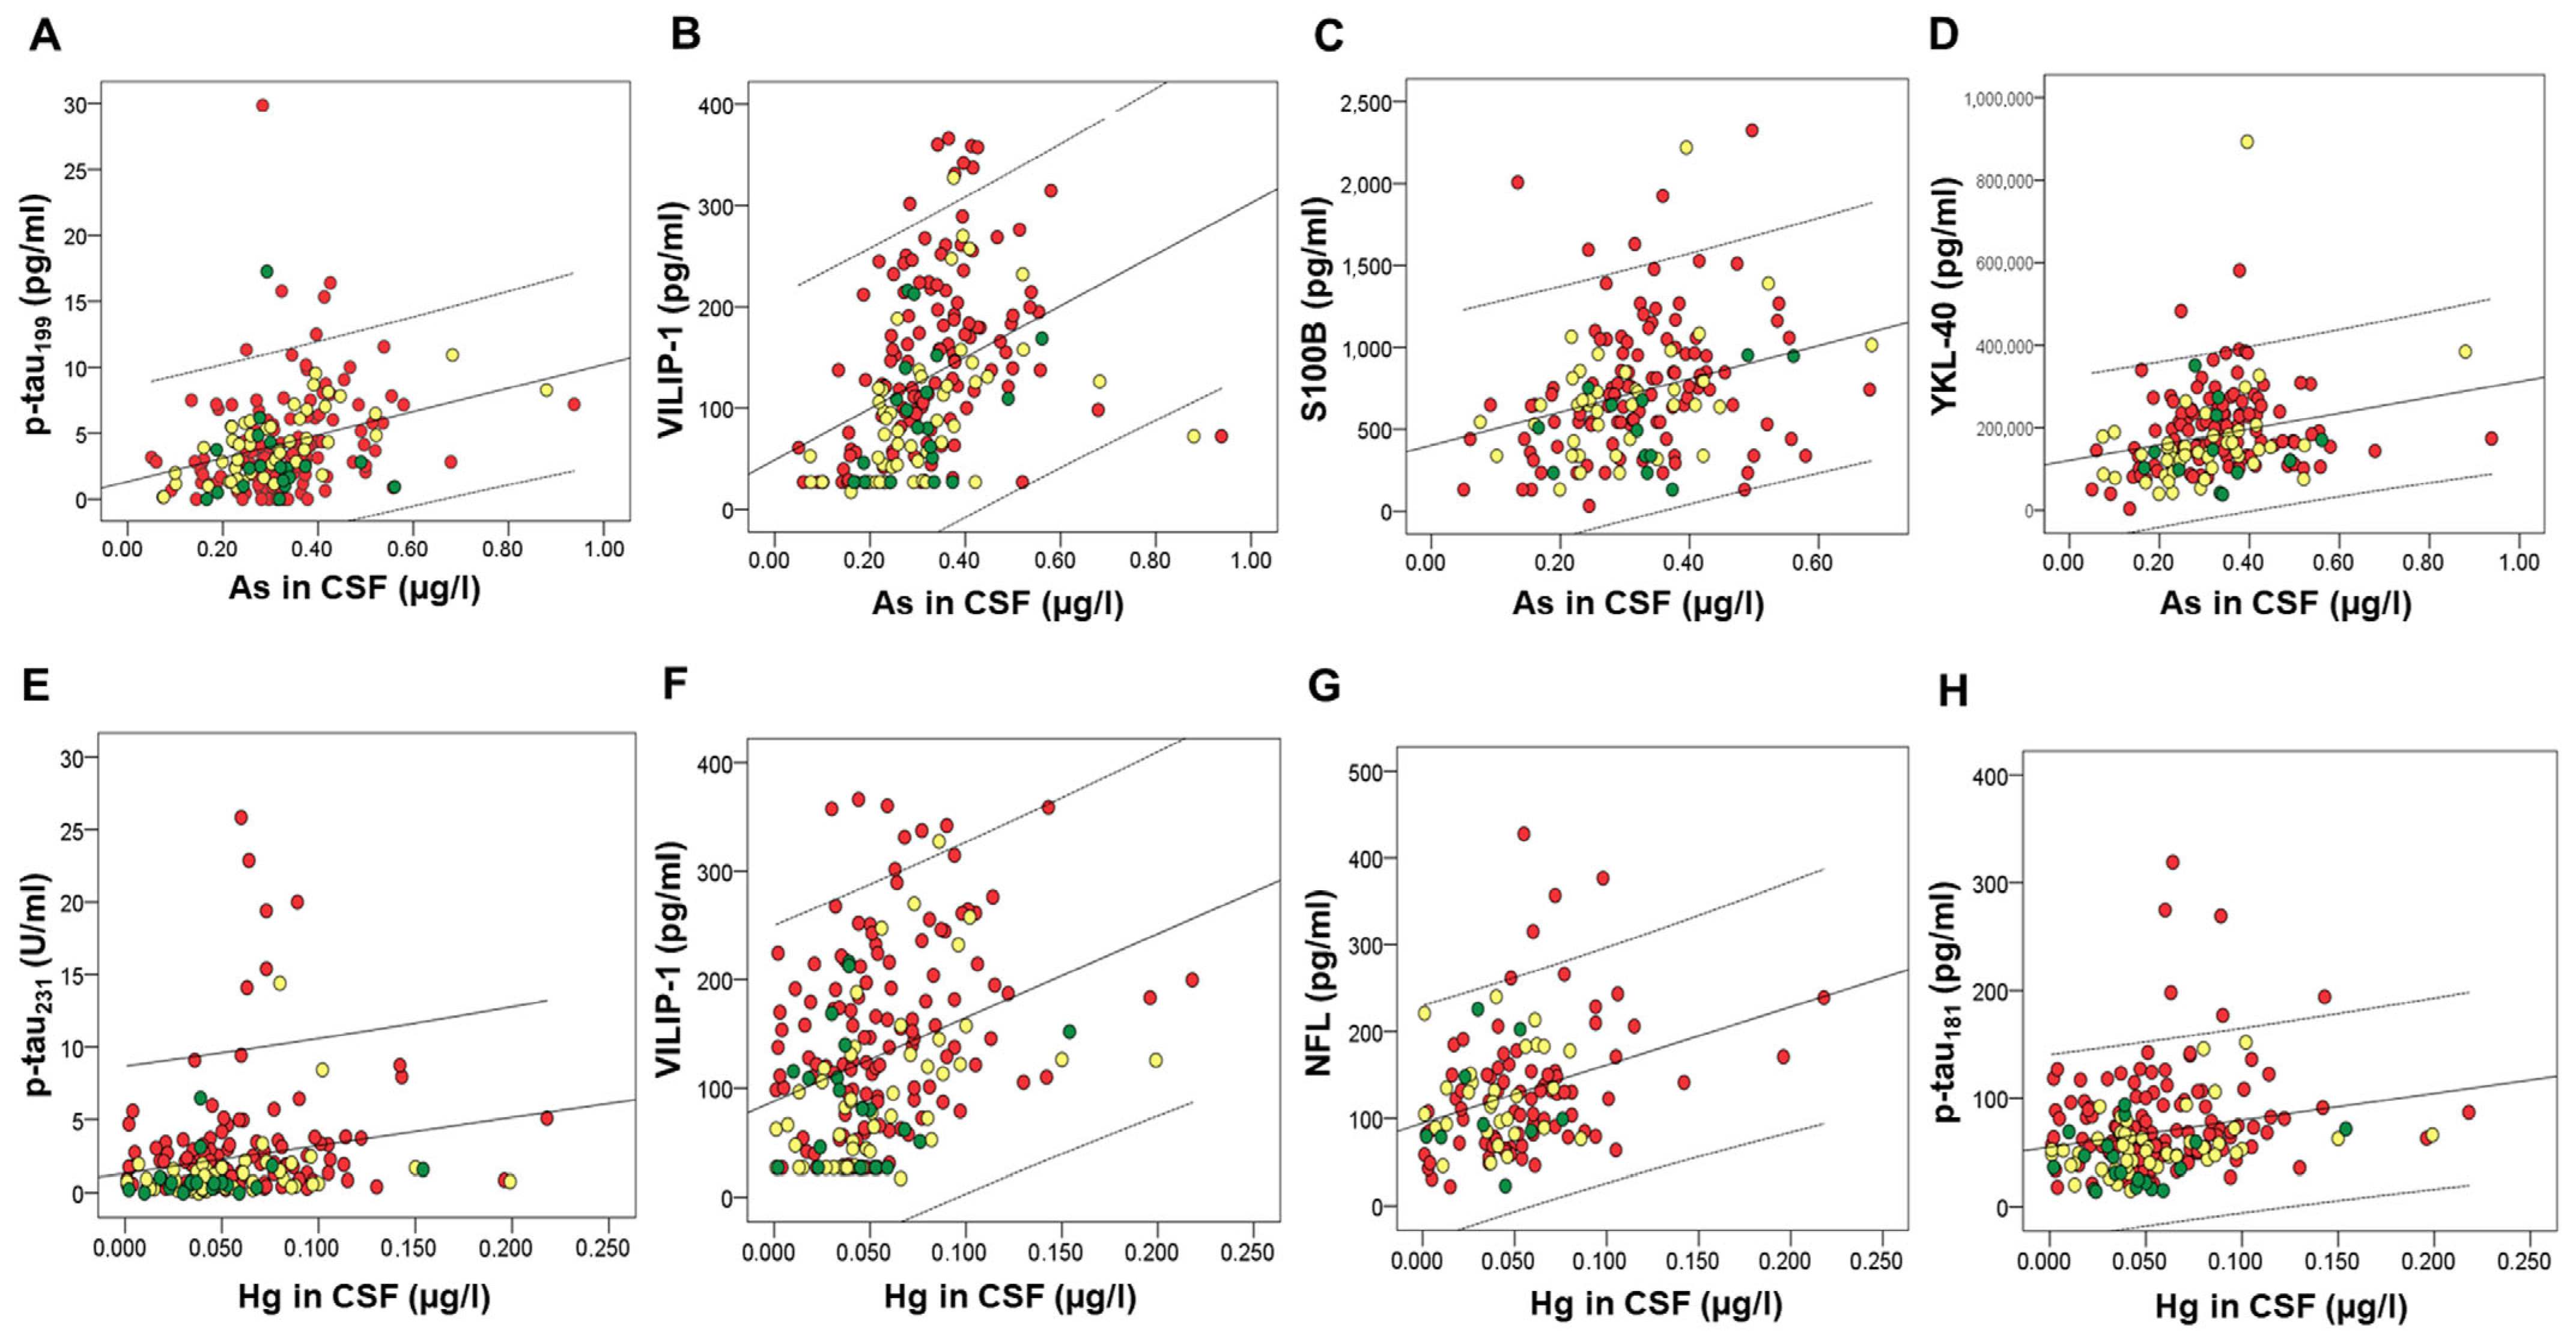
| As | rs = 0.384, p < 0.001 (192)* | rs = 0.521, p < 0.001 (192)* | rs = 0.32, p < 0.001 (177)* | rs = 0.344, p < 0.001 (157)* | |||||
| Hg | rs = 0.228, p = 0.001 (192)* | rs = 0.262, p < 0.001 (192)* | rs = 0.347, p < 0.001 (192)* | rs = 0.331, p < 0.001 (117)* | |||||
| Tl | r = 0.233, p = 0.001 (193)* | rs = 0.253, p < 0.001 (193)* | rs = 0.299, p < 0.001 (159)* | r = 0.334, p < 0.001 (119)* | rs = 0.37, p < 0.001 (178)* | ||||
| P | rs = 0.444, p < 0.001 (76)* | rs = 0.506, p < 0.001 (72)* | rs = 0.825, p < 0.001 (37)* | rs = 0.382, p < 0.001 (82)* | rS = 0.414, p < 0.001 (89) (Aβ)* | ||||
| Li (CSF) | rs = 0.227, p = 0.001 (193) *A | rs = 0.281, p < 0.001 (178)* | rs = 0.368, p < 0.001 (159) *B | rs = 0.290, p = 0.001 (119)* | rs = 0.318, p < 0.001 (178) *A | ||||
| Li (plasma) | r = −0.413, p < 0.001 (123) | r = −0.47 p < 0.001 (135) | rs = −0.287, p = 0.001 (134) (albumin) A | ||||||
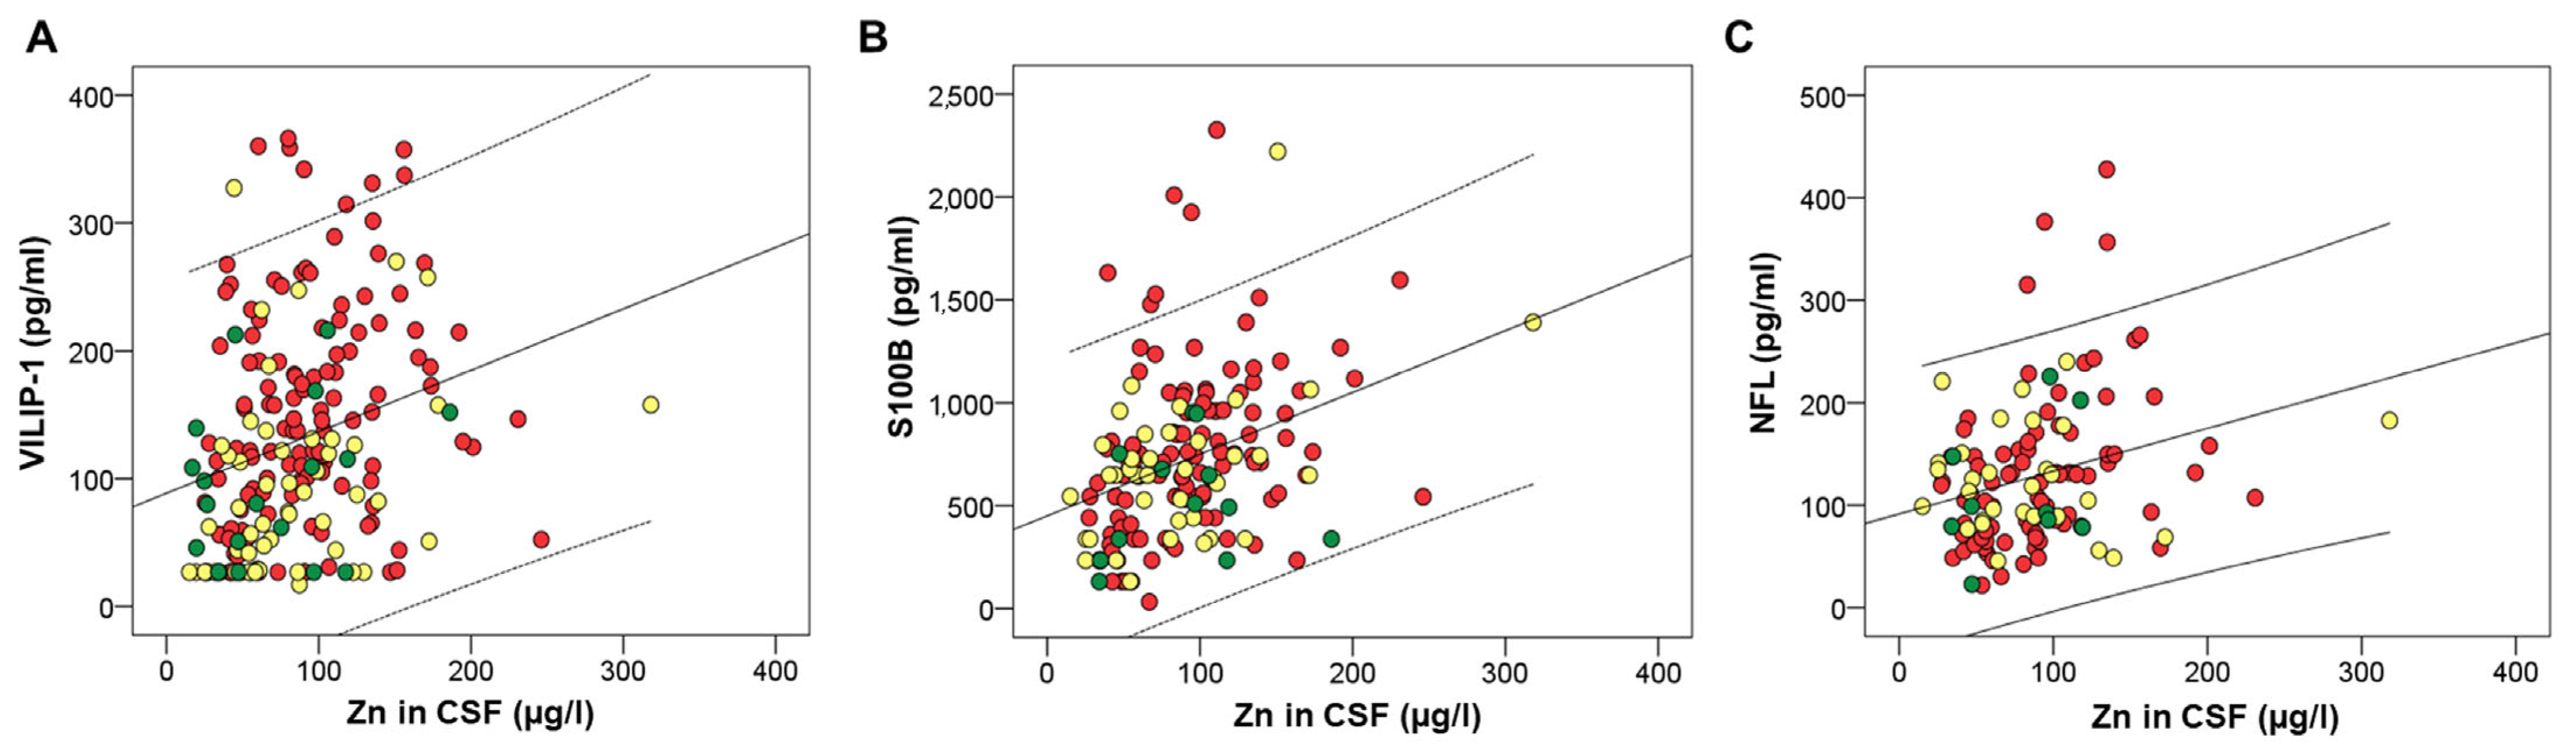
| Zn | r = 0.327, p < 0.001 (193)* | r = 0.376, p < 0.001 (158)* | r = 0.295, p = 0.001 (118)* | r = 0.322, p < 0.001 (178)* | r = 0.375, p < 0.001 (142) (albumin) | ||||
| Mo | r = 0.408, p < 0.001 (193)* | r = 0.269, p < 0.001 (178)* | r = 0.29, p < 0.001 (159)* | r = 0.336, p < 0.001 (178)* | |||||
| Ba | r = 0.25, p < 0.001 (191) *B | r = 0.374, p < 0.001 (157) | r = 0.294, p = 0.001 (117) B | ||||||
| Ca | rs = 0.404, p < 0.001 (193) | rs = 0.295, p < 0.001 (159)* | rs = 0.342, p < 0.001 (119) * | r = 0.25, p = 0.001 (178) | |||||
| B | rs = 0.258, p < 0.001 (193) *B | rs = 0.299, p = 0.001 (119) *B | |||||||
| Pb | r = −0.285, p < 0.001 (178)* | ||||||||
| Sr | r = 0.405, p < 0.001 (119)* |
| Factors | CSF Macro- and Microelements (Factor Loadings) |
|---|---|
| Factor 1 | As (0.470), Ba (0.611), Ca (0.845), Co (0.646), Cu (0.800), Fe (0.712), K (0.897), Mg (0.919), Mn (0.702), Na (0.870), Ni (0.562), S (0.748), Se (0.825), Sr (0.590), Tl (0.584), Zn (0.641) |
| Factor 2 | Al (0.565), Cd (0.664), Pb (0.871) |
| Factor 3 | B (0.595), Li (0.584) |
| Factor 4 | None loaded |
| Factor 5 | Hg (−0.505), Mo (0.601) |
| Factor 6 | None loaded |
| Factors | Plasma Macro- and Microelements (Factor Loadings) |
|---|---|
| Factor 1 | Ca (0.848), Co (0.491), Cu (0.59), Mg (0.659), Mn (0.577), Na (0.831), P (0.735), S (0.844), Se (0.728), Tl (0.35), Zn (0.569) |
| Factor 2 | B (0.571), Cd (0.604), Li (0.649), Mo (0.580), Pb (0.38) |
| Factor 3 | As (0.634), Hg (0.651) |
| Factor 4 | Ni (0.617) |
| Factor 5 | Sr (−0.595) |
| Factor 6 | Fe (0.478) |
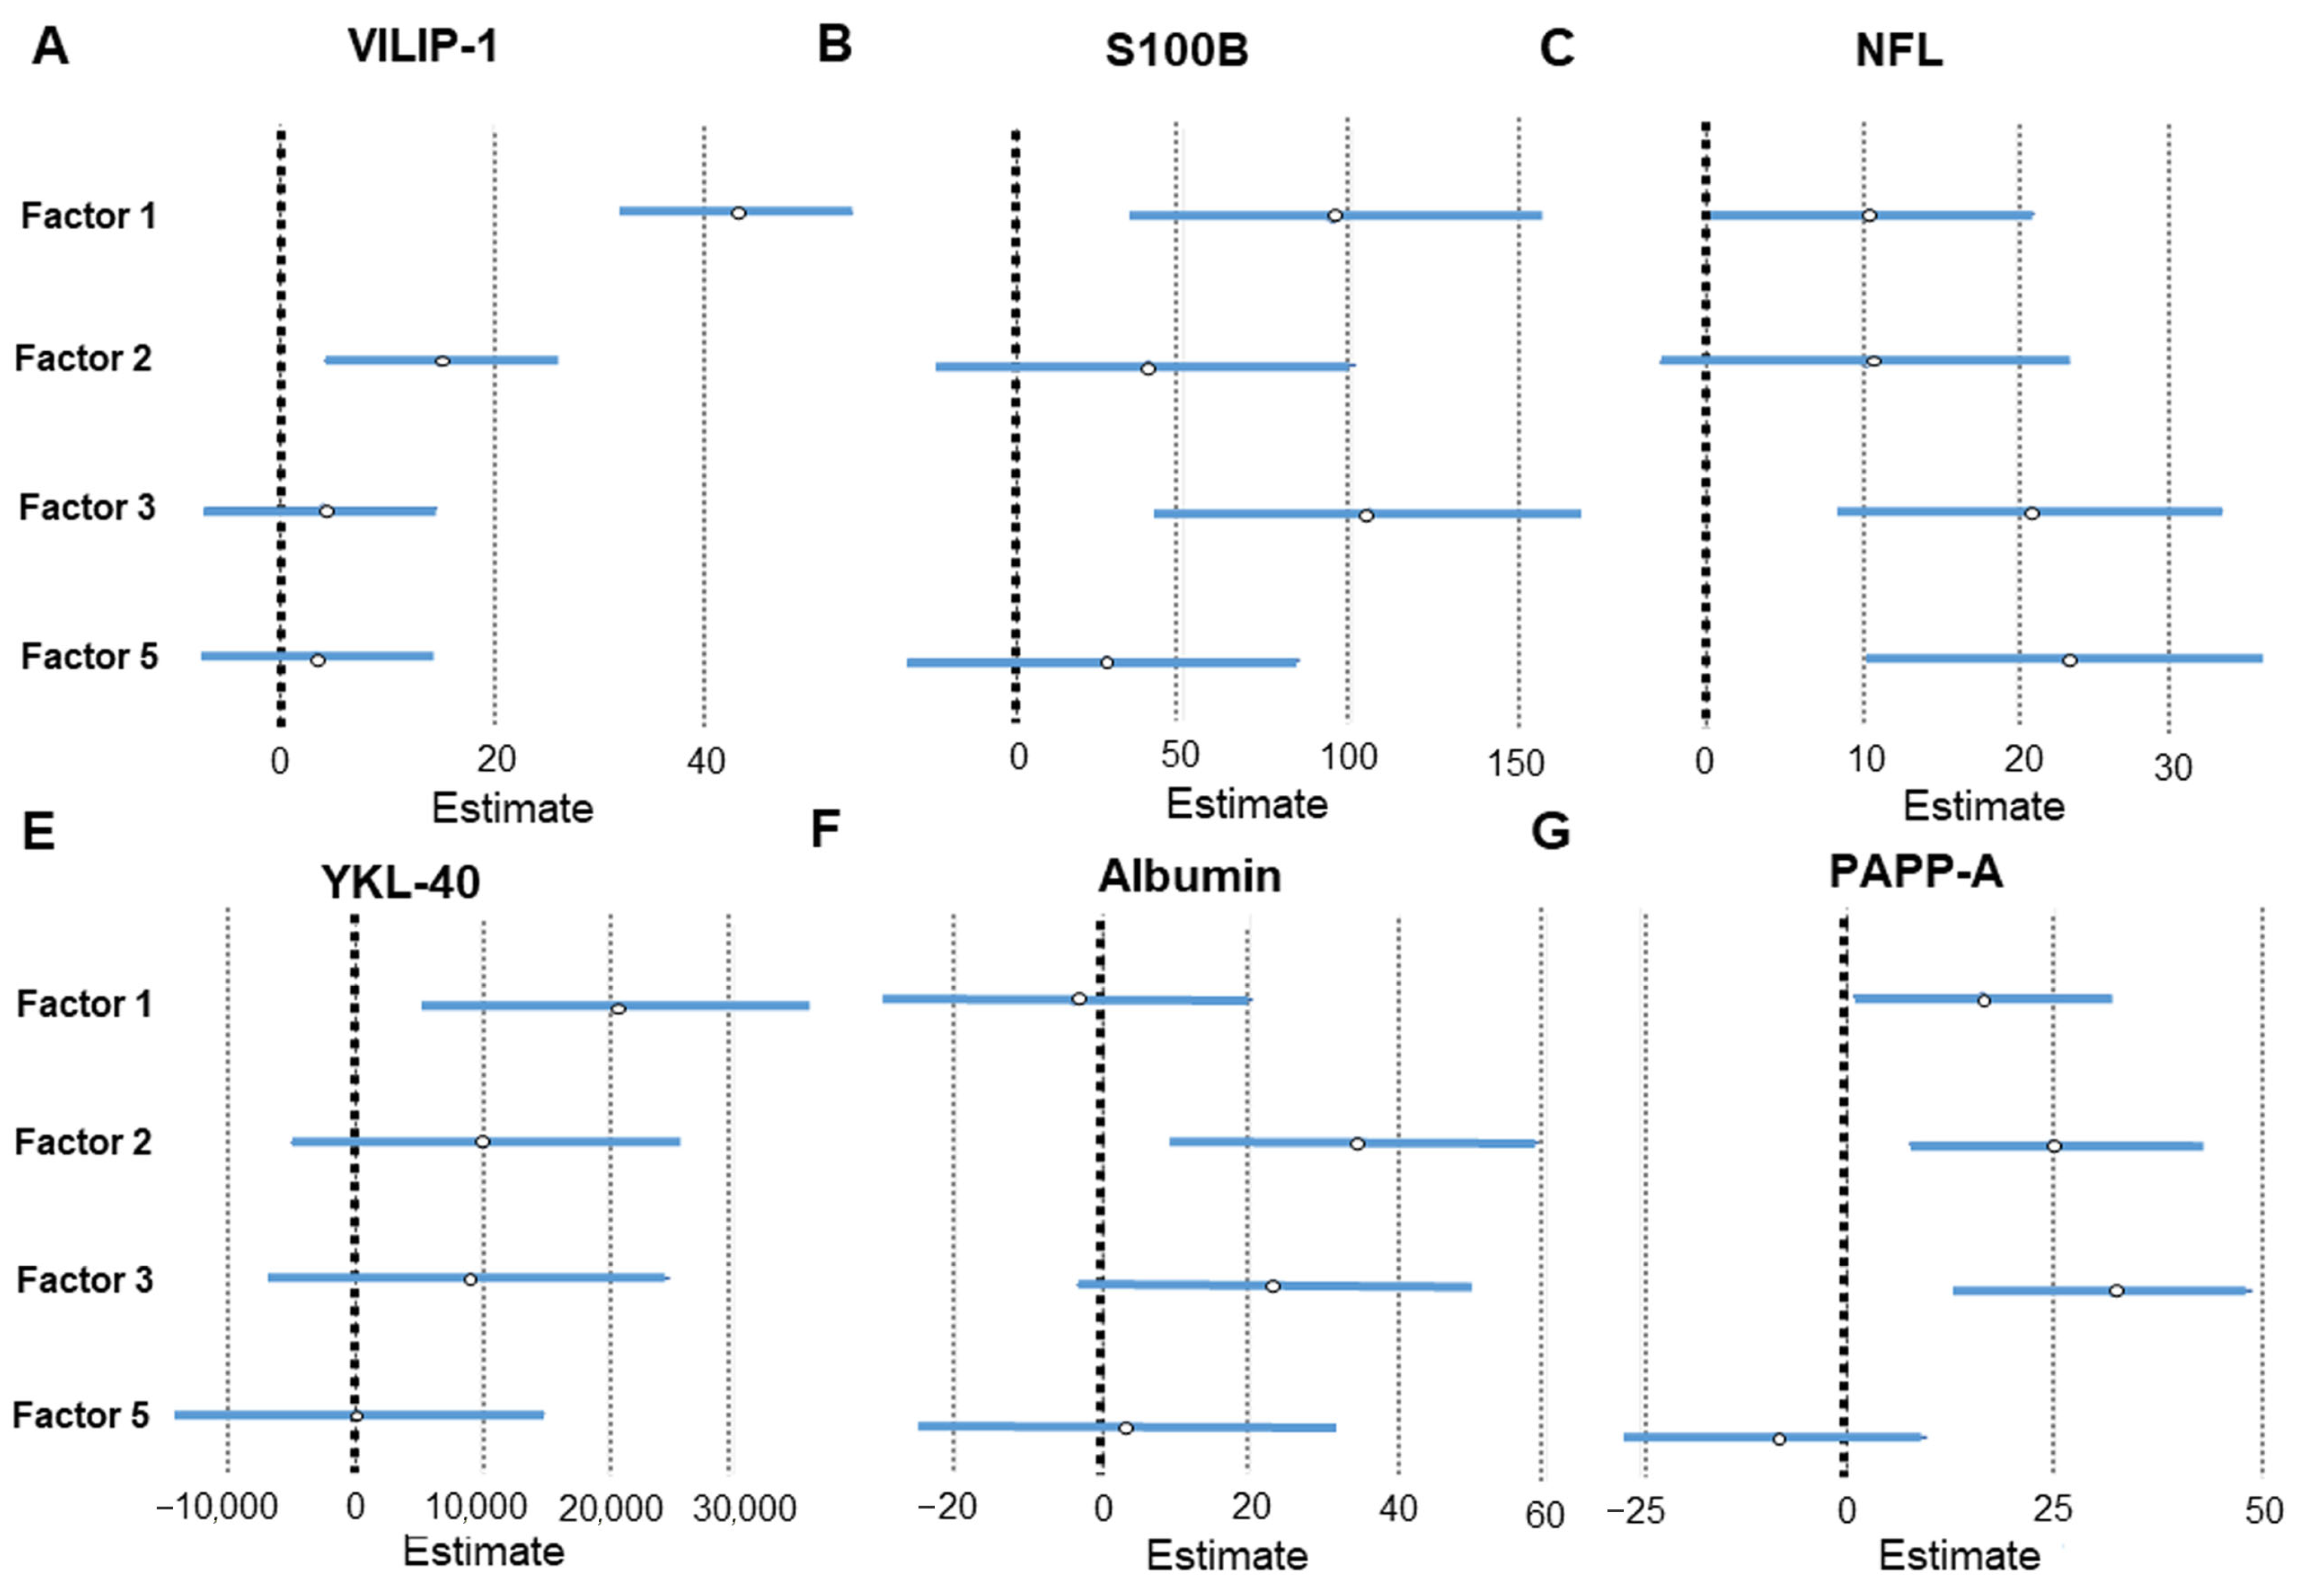
| Factor | CSF AD Biomarker | Linear Regression Analysis |
|---|---|---|
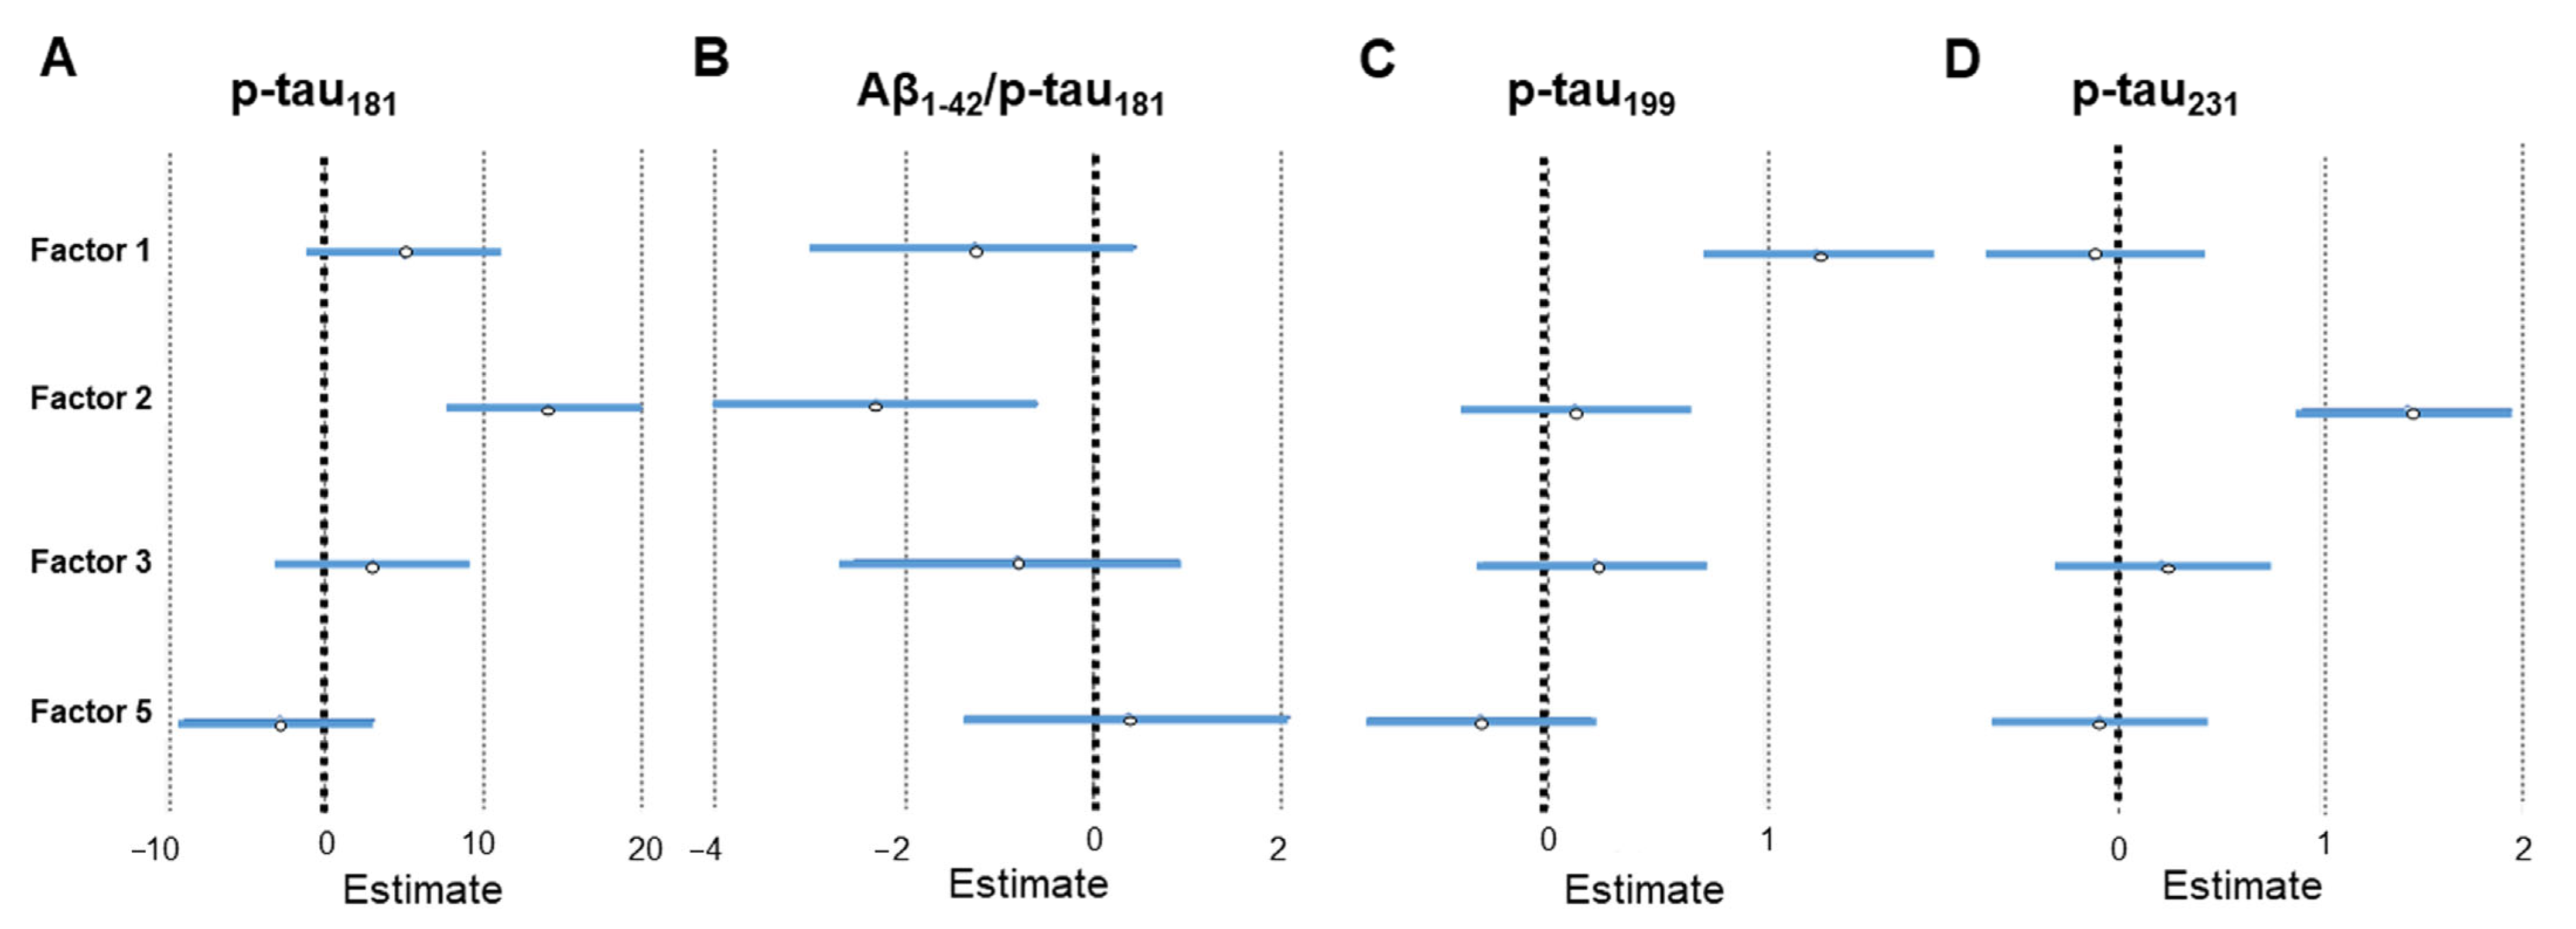
| Factor 2 (Al, Cd, and Pb) | p-tau181 | β = 0.321, SE = 3.064, p < 0.001 |
| p-tau231 | β = 0.375, SE = 0.263, p < 0.001 | |
| VILIP-1 | β = 0.173, SE = 5.531, p = 0.007 | |
| PAPP-A | β = 0.21, SE = 8.659, p = 0.005 | |
| albumin | β = 0.231, SE = 12.494, p = 0.007 | |
| Aβ1–42/p-tau181 | β = −0.192, SE = 0.873, p = 0.009 | |
| Factor 1 (As, Ba, Ca, Co, Cu, Fe, K, Mg, Mn, Na, Ni, S, Se, Sr, Tl, and Zn) | p-tau199 | β = 0.331, SE = 0.262, p < 0.001 |
| VILIP-1 | β = 0.495, SE = 5.531, p < 0.001 | |
| YKL-40 | β = 0.205, SE = 7663.241, p = 0.007 | |
| S100B | β = 0.24, SE = 30.022, p = 0.002 | |
| PAPP-A | β = 0.148, SE = 7.893, p = 0.041 | |
| Factor 3 (B and Li) | S100B | β = 0.259, SE = 31.29, p = 0.001 |
| NFL | β = 0.285, SE = 6.257, p = 0.001 | |
| PAPP-A | β = 0.275, SE = 8.551, p < 0.001 | |
| Factor 5 (Hg and Mo) | NFL | β = 0.312, SE = 6.388, p < 0.001 |
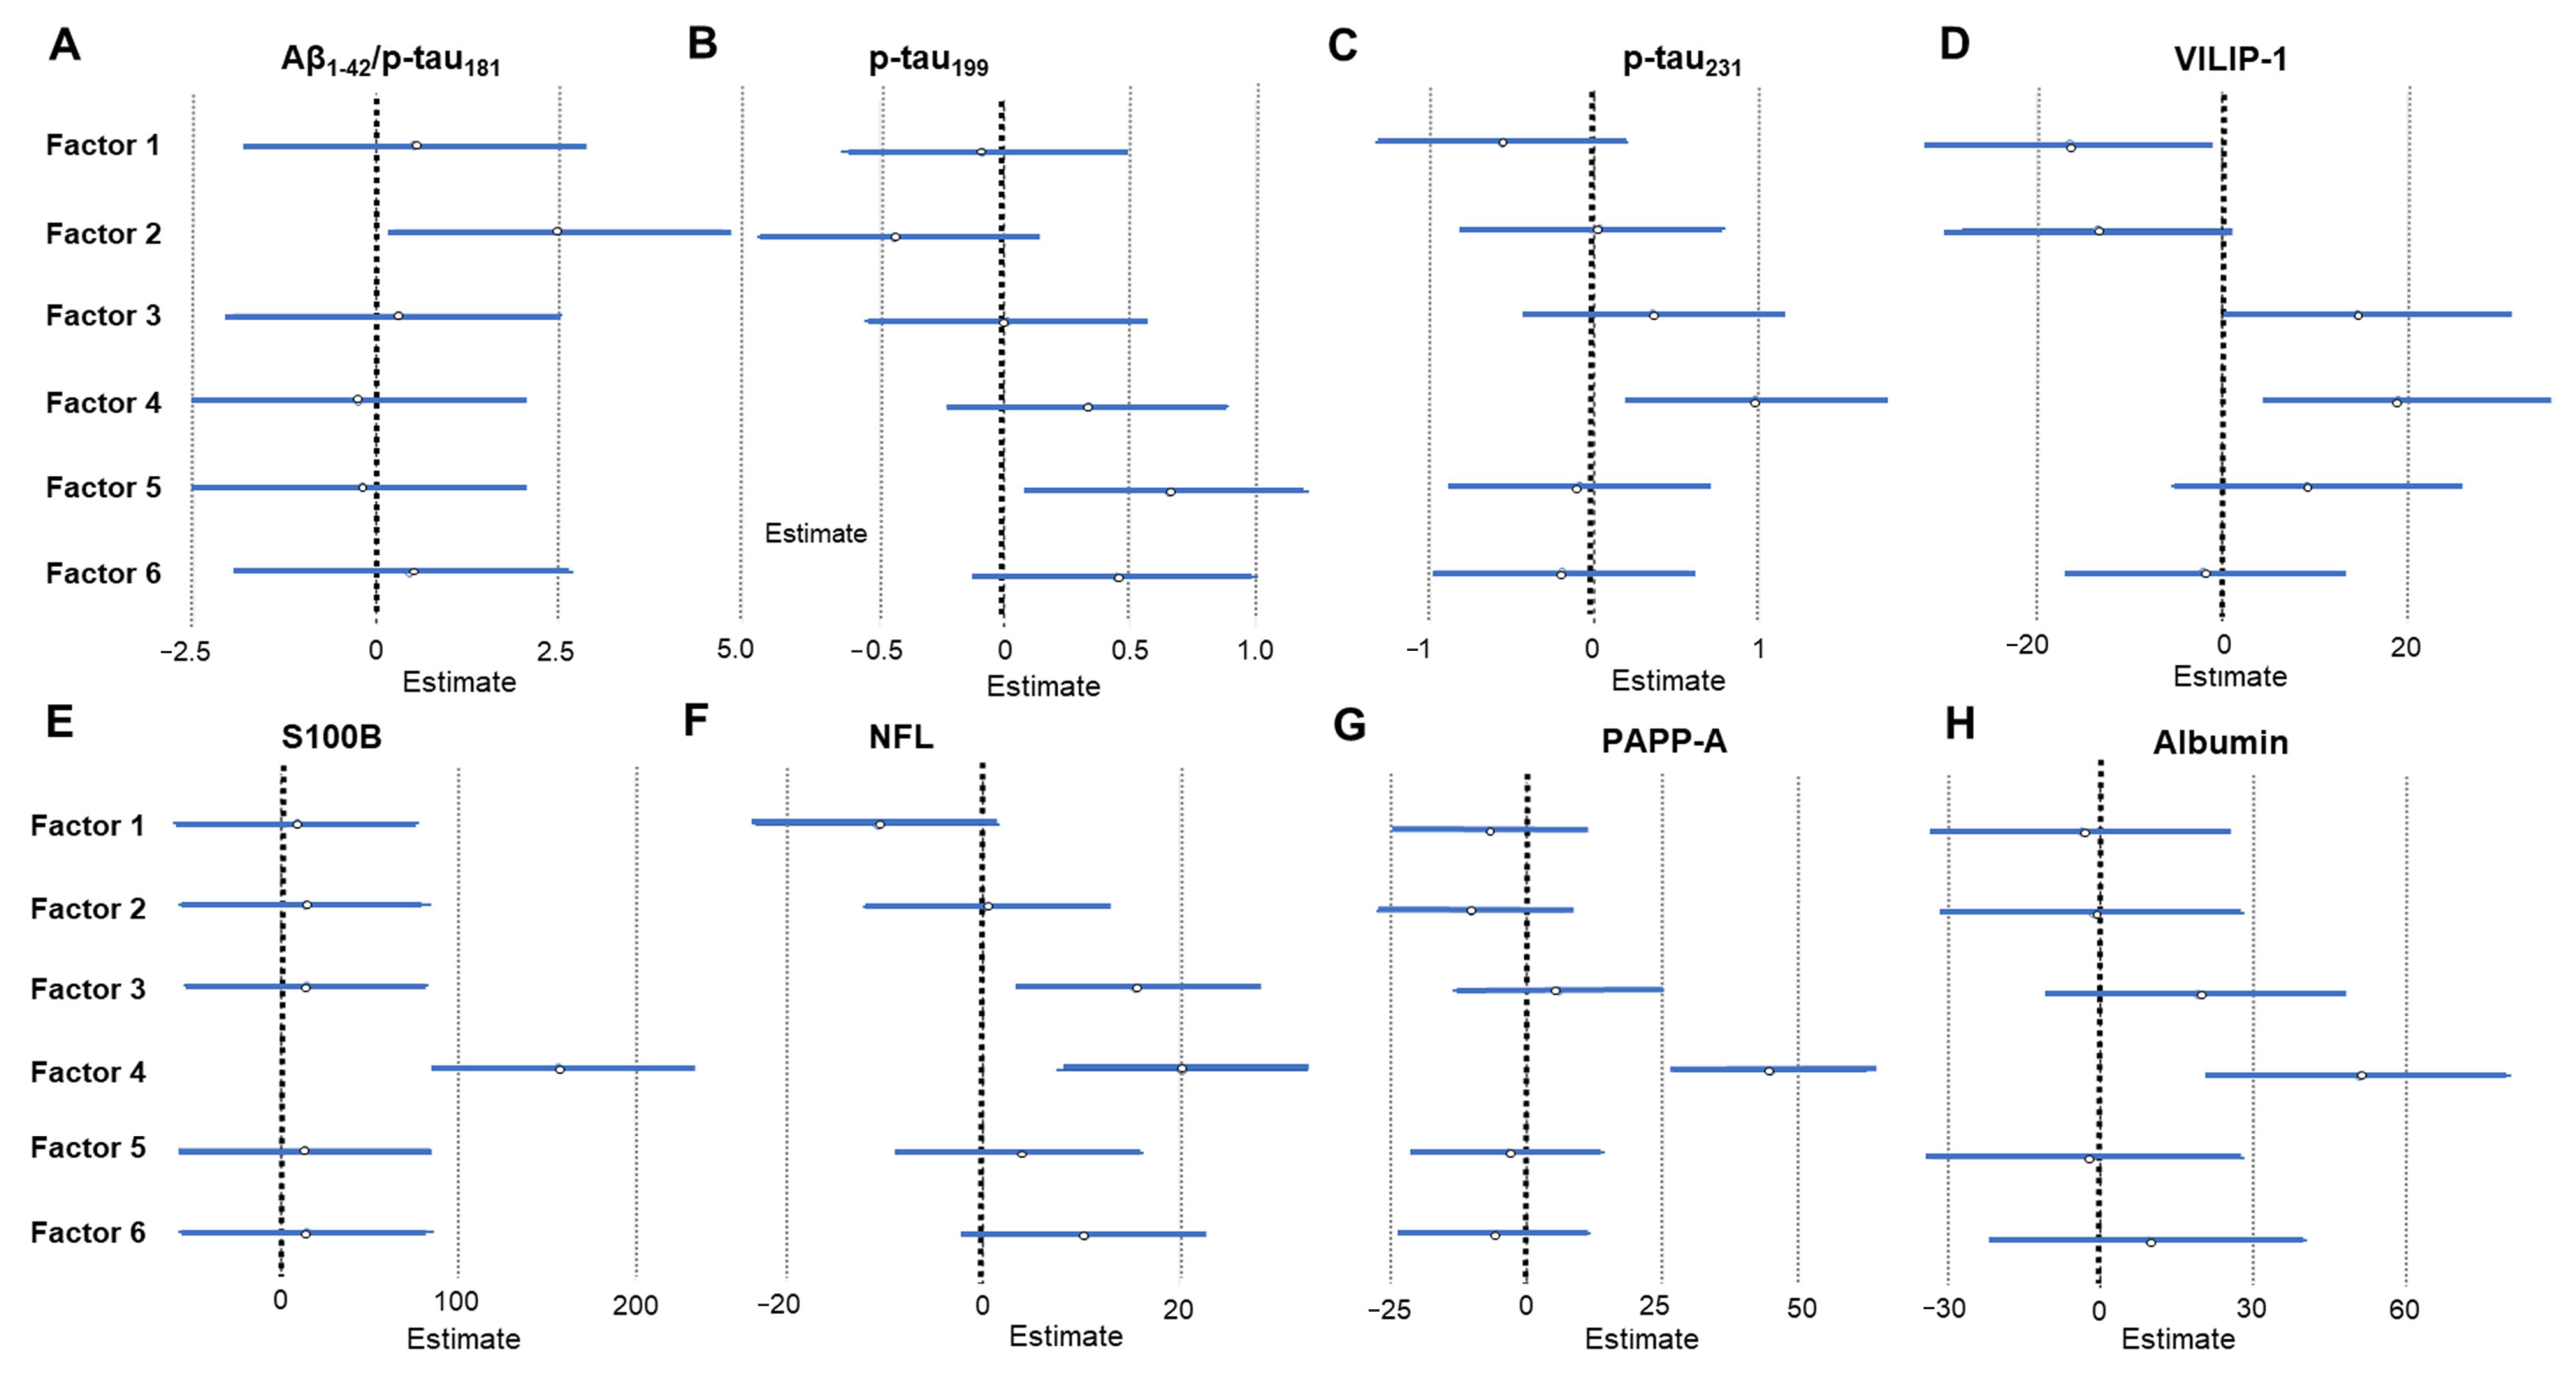
| Factor | CSF AD Biomarker | Linear Regression Analysis |
|---|---|---|
| Factor 1 (Ca, Co, Cu, Mg, Mn, Na, P, S, Se, Tl, and Zn) | VILIP-1 | β = −0.191, SE = 7.341, p = 0.028 |
| Factor 2 (B, Cd, Li, Mo and Pb) | Aβ1–42/p-tau181 | β = 0.192, SE = 0.873, p = 0.009 |
| Factor 3 (As and Hg) | VILIP-1 | β = 0.17, SE = 7.341, p = 0.05 |
| NFL | β = 0.237, SE = 6.109, p = 0.013 | |
| Factor 4 (Ni) | p-tau231 | β = 0.224, SE = 0.39, p = 0.014 |
| VILIP-1 | β = 0.222, SE = 7.341, p = 0.011 | |
| S100B | β = 0.405, SE = 36.065, p < 0.001 | |
| NFL | β = 0.295, SE = 6.450, p = 0.002 | |
| PAPP-A | β = 0.428, SE = 8.945, p < 0.001 | |
| albumin | β = 0.306, SE = 15.086, p = 0.001 | |
| Factor 5 (Sr) | p-tau199 | β = 0.204, SE = 0.284, p = 0.023 |
| Redescription Specific for: | HC (%) | MCI (%) | AD (%) | W1R | W2R | JS | p-Value |
|---|---|---|---|---|---|---|---|
| Macro- and Microelements in CSF | |||||||
| AD | 5.3% | 6% | 36% | VILIP-1 (121.28–366.14) MMSE (13–25) Aβ1–42 (275–1246) | As in CSF (0.34–2.62) S in CSF (14.3–40.2) | 0.56977 | 1.548 × 10⁻⁷ * |
| AD | 5.3% | 6% | 31.2% | VILIP-1 (121.28–366.14) MMSE (13–25) Aβ1–42 (275–1246) | As in CSF (0.34–2.62) K in CSF (120–243) S in CSF (14.3–40.2) Cd in CSF (0.01–0.033) | 0.5584 | 5.711 × 10⁻⁸ * |
| AD | 21% | 44% | 70.4% | YKL-40 (102,044.391955–893,335.0) VILIP-1 (62.52–366.14) | K in CSF (94.0–243) | 0.7125 | 0.003 * |
| AD | 15.7% | 38% | 63.2% | S100B (234.16–2325.45) VILIP-1 (62.52–366.14) MMSE (10–29) | Zn in CSF (33.0–318.1) K in CSF (94–243) | 0.65584 | 0.002 * |
| AD | 15.8% | 38% | 63.2% | S100B (234.16–2325.45) VILIP-1 (62.52–366.14) MMSE (10–29) | Mg in CSF (22.45–52.21) Zn in CSF (33–318.1) | 0.66013 | 0.002 * |
| AD&MCI | 5.3% | 46% | 59.2% | VILIP-1 (62.52–366.14) MMSE (10–29) | Na in CSF (2545–5335) Li in CSF (0.21–49.93) Cu in CSF (9.9–36.98) | 0.64901 | 0.004 * |
| AD&MCI | 5.3% | 38% | 50.4% | VILIP-1 (62.52–366.14) MMSE (10–29) | Se in CSF (1.1–3.35) Cu in CSF (10.7–36.27) Co in CSF (0.046–0.219) Ba in CSF (0.98–110.4) Cd in CSF (0.004–0.033) | 0.60145 | 3.545 × 10⁻⁴ * |
| AD&MCI | 5.3% | 34% | 52% | S100B (234.16–2325.45) VILIP-1 (62.52–366.14) MMSE (10–29) | Co in CSF (0.046–0.219) Se in CSF (1.1–3.35) Zn in CSF (27.9–246.1) | 0.58865 | 0.003 * |
| AD&MCI | 5.3% | 34% | 51.2% | S100B (234.16–2325.45) VILIP-1 (62.52–366.14) MMSE (10–29) | Li in CSF (0.21–49.93) Zn in CSF (33–318.1) Cu in CSF (10.2–36.98) Na in CSF (2545.0–5335) | 0.59854 | 0.001 * |
| AD&MCI | 5.3% | 42% | 46.4% | VILIP-1 (62.52–366.14) MMSE (10–29) | Se in CSF (1.1–3.35) Zn in CSF (27.9–111) Ba in CSF (0.62–105.83) | 0.55944 | 0.003 * |
| AD&MCI | 5.3% | 44% | 60.8% | VILIP-1 (62.52–366.14) MMSE (10–29) | Co in CSF (0.046–0.219) Se in CSF (1.1–3.35) Zn in CSF (27.9–246.1) | 0.66 | 0.002 * |
| AD&MCI | 5.3% | 38% | 56% | VILIP-1 (62.52–366.14) MMSE (10–29) | Cu in CSF (10.3–36.27) Co in CSF (0.046–0.219) Fe in CSF (19.1–111.3) S in CSF (12.7–32) Ba in CSF (1.61–110.4) | 0.61644 | 0.002 * |
| AD&MCI | 5.3% | 38% | 56% | VILIP-1 (62.52–366.14) MMSE (10–29) | Cu in CSF (10.3–36.27) Co in CSF (0.046–0.219) Fe in CSF (19.1–111.3) S in CSF (12.7–32) Ba in CSF (1.61–110.4) | 0.616434 | 0.002 * |
| AD&MCI | 5.3% | 36% | 45.6% | VILIP-1 (62.52–366.14) MMSE (10–29) | Se in CSF (1.1–3.69) Li in CSF (0.39–49.93) Ba in CSF (3.2–110.4) | 0.55882 | 4.295 × 10⁻⁴ * |
| AD&MCI | 5.3% | 38% | 52.8% | VILIP-1 (62.52–366.14) MMSE (10–29) | Se in CSF (1.1–3.35) Zn in CSF (27.9–246.1) Co in CSF (0.046–0.219) Cd in CSF (0.004–0.033) | 0.6014 | 0.001 * |
| AD&MCI | 5.3% | 34% | 50.4% | VILIP-1 (62.52–366.14) MMSE (10–29) | S in CSF (9.6–32) Se in CSF (1.1–3.35) Co in CSF (0.046–0.219) Ba in CSF (0.98–110.4) Cd in CSF (0.004–0.033) | 0.59124 | 3.177 × 10⁻⁴ * |
| AD&MCI | 5.3% | 34% | 56.8% | S100B (234.16–2325.45) VILIP-1 (62.52–366.14) MMSE (10–29) | Zn in CSF (28–246.1) Cu in CSF (9.92–36.27) Na in CSF (2063–4873) Co in CSF (0.046–0.219) | 0.58940 | 0.01 * |
| AD&MCI | 5.3% | 38% | 56.8% | VILIP-1 (62.52–366.14) MMSE (10–29) | Cu in CSF (10.3–36.27) Co in CSF (0.046–0.219) S in CSF (12.7–32) Ba in CSF (1.61–110.4) | 0.61486 | 0.004 * |
| AD&MCI | 0% | 36% | 48.8% | VILIP-1 (62.52–366.14) MMSE (10–29) | Hg in CSF (0.025–1.063) Cu in CSF (10.3–36.16) Co in CSF (0.046–0.219) Fe in CSF (19.1–111.3) S in CSF (12.7–32) Ba in CSF (1.61–110.4) | 0.5411 | 0.009 * |
| AD&MCI | 5.3% | 30% | 44% | S100B (234.16–2325.45) VILIP-1 (62.52–366.14) MMSE (10–29) | Se in CSF (1.1–3.35) Cu in CSF (10.7–36.27) Co in CSF (0.046–0.219) Ba in CSF (0.98–110.4) Cd in CSF (0.004–0.033) | 0.568 | 2.255 × 10⁻⁴ * |
| AD&MCI | 5.3% | 36% | 48% | S100B (234.16–2325.45) VILIP-1 (62.52–366.14) MMSE (10–29) | Li in CSF (0.25–49.93) Zn in CSF (33–318.1) Cu in CSF (10.2–36.98) Na in CSF (2196–5335) | 0.57246 | 0.002 * |
| AD&MCI | 5.3% | 30% | 44.8% | S100B (234.16–2325.45) VILIP-1 (62.52–366.14) MMSE (10–29) | Se in CSF (1.1–3.35) Zn in CSF (27.9–246.1) Co in CSF (0.046–0.219) Cd in CSF (0.004–0.033) | 0.54545 | 0.002 * |
| AD&MCI | 5.3% | 26% | 50.4% | S100B (234.16–2325.45) VILIP-1 (62.52–366.14) MMSE (10–29) | Zn in CSF (33–246.1) Cu in CSF (10.3–36.27) Co in CSF (0.046–0.219) S in CSF (12.7–32) Ba in CSF (1.61–110.4) | 0.56618 | 0.002 * |
| AD&MCI | 15.8% | 52% | 76% | VILIP-1 (62.52–366.14) MMSE (10–29) | K in CSF (94–243) | 0.77019 | 0.002 * |
| AD&MCI | 15.8% | 54% | 76.8% | VILIP-1 (62.52–366.14) MMSE (10–29) | Na in CSF (2527–5492) | 0.76829 | 0.003 * |
| AD&MCI | 15.8% | 46% | 68% | VILIP-1 (62.52–366.14) MMSE (10–29) | Se in CSF (12.7–40.8) | 0.70253 | 0.005 * |
| AD&MCI | 15.8% | 52% | 71.2% | VILIP-1 (62.52–366.14) MMSE (10–29) | Se in CSF (1.1–3.69) Zn in CSF (27.9–318.1) | 0.78146 | 1.676 × 10⁻⁴ * |
| AD&MCI | 15.8% | 44% | 66.4% | VILIP-1 (62.52–366.14) MMSE (10–29) | Cd in CSF (0.004–0.033) Mg in CSF (22.45–52.21) Fe in CSF (15.5–116.3) | 0.71053 | 0.001 * |
| AD&MCI | 15.8% | 56% | 78.4% | VILIP-1 (62.52–366.14) MMSE (10–29) | Cu in CSF (9.35–36.98) S in CSF (7.8–40.8) | 0.7771 | 0.004 * |
| AD&MCI | 15.8% | 52% | 75.2% | VILIP-1 (62.52–366.14) MMSE (10–29) | Mg in CSF (22.45–52.21) S in CSF (7.9–40.8) | 0.76398 | 0.002 * |
| AD&MCI | 15.8% | 40% | 60% | S100B (234.16–2325.45) VILIP-1 (62.52–366.14) MMSE (10–29) | Zn in CSF (33–318.1) Cu in CSF (9.92–36.98) Fe in CSF (15.5–116.3) Al in CSF (0.9–6.75) Na in CSF (2063–5335) | 0.65772 | 0.001 * |
| AD&MCI | 15.8% | 42% | 64.8% | S100B (234.16–2325.45) VILIP-1 (62.52–366.14) MMSE (10–29) | Na in CSF (2063–5492) Zn in CSF (28–318.1) Cu in CSF (9.92–36.98) | 0.67308 | 0.002 * |
| AD&MCI | 10.5% | 34% | 50.4% | VILIP-1 (62.52–366.14) YKL-40 (102,044.391955–893,335.0) Aβ1–42 (272.94–1568.0) | Li in CSF (0.21–49.93) Se in CSF (0.89–3.69) Cu in CSF (10.7–36.98) K in CSF (94–243) Ba in CSF (1.61–110.4) | 0.63077 | 1.050 × 10⁻⁴ * |
| HC&MCI | 47.4% | 42% | 28.8% | APOE genotype = ɛ3ɛ3 Aβ1–42 (275–1672.36) | Pb in CSF (0.56–14.83) Ba in CSF (0.98–110.4) | 0.51163 | 0.001 * |
| HC&MCI | 42.1% | 50% | 18.4% | VILIP-1 (17.2–89.68) | K in CSF (37–134) S in CSF (4.2–17.6) | 0.51852 | 4.439 × 10⁻⁵ * |
| HC&MCI | 42.1% | 50% | 15.2% | VILIP-1 (17.2–89.68) p-tau231 (0–1.978) t-tau (44–598.0) | Se in CSF (0.36–1.97) K in CSF (37–134) S in CSF (4.2–17.6) | 0.5 | 3.855 × 10⁻⁵ * |
| HC&MCI | 47.4% | 30% | 14.4% | VILIP-1 (17.2–89.68) | Se in CSF (0.36–1.09) Mn in CSF (0.4–3.58) | 0.53846 | 5.472 × 10⁻⁸ * |
| HC&MCI | 52.6% | 56% | 33.6% | VILIP-1 (17.2–121.08) p-tau181 (16–145.9) | As in CSF (0.05–0.33) Fe in CSF (8.8–74.1) | 0.625 | 7.274 × 10⁻⁵ * |
| HC&MCI | 47.4% | 30% | 12.8% | VILIP-1 (17.2–89.68) p-tau231 (0–1.978) t-tau (44–598) | Mn in CSF (0.4–3.58) Se in CSF (0.36–1.09) | 0.53333 | 6.249 × 10⁻⁸ * |
| HC&MCI | 42.1% | 50% | 16% | VILIP-1 (17.2–89.68) p-tau231 (0–1.978) t-tau (44–598) | Se in CSF (0.36–1.97) K in CSF (37–140) S in CSF (4.2–17.7) | 0.50476 | 3.487 × 10⁻⁵ * |
| HC&MCI | 47.4% | 30% | 13.6% | t-tau (44–598) VILIP-1 (17.2–89.68) | Mn in CSF (0.4–3.58) Se in CSF (0.36–1.09) | 0.53947 | 4.804 × 10⁻⁸ * |
| HC&MCI | 42.1% | 50% | 19.2% | VILIP-1 (17.2–89.68) | K in CSF (37–140) S in CSF (4.2–17.7) Se in CSF (0.36–1.97) | 0.53774 | 1.584 × 10⁻⁵ * |
| HC&MCI | 42.1% | 50% | 16% | VILIP-1 (17.2–89.68) t-tau (44.0–598) | Se in CSF (0.36–1.97) K in CSF (37–134) S in CSF (4.2–17.6) Na in CSF (958–3658.0) | 0.50962 | 3.108 × 10⁻⁵ * |
| HC&MCI | 42.1% | 50% | 17.6% | VILIP-1 (17.2–89.68) t-tau (44–598) | Se in CSF (0.36–1.97) K in CSF (37–140) S in CSF (4.2–17.7) | 0.52381 | 1.910 × 10⁻⁵ * |
| HC&MCI | 42% | 50% | 18.4% | VILIP-1 (17.2–89.68) | Se in CSF (0.36–1.97) K in CSF (37–140) S in CSF (4.2–17.7) | 0.53333 | 1.682 × 10⁻⁵ * |
| HC | 42.1% | 22% | 12.8% | PAPP-A (23.64–345.15) VILIP-1 (17.2–89.12) p-tau231 (0–1.978) p-tau199 (0–5.781) | Se in CSF (0.36–1.09) Mn in CSF (0.4–3.58) | 0.5303 | 3.716 × 10⁻⁸ * |
| HC | 42.1% | 24% | 12.8% | VILIP-1 (17.2–89.12) p-tau231 (0–1.978) PAPP-A (23.64–345.15) | Mn in CSF (0.4–3.58) Se in CSF (0.36–1.09) | 0.51429 | 1.133 × 10⁻⁷ * |
| HC | 42.1% | 22% | 12.8% | VILIP-1 (17.2–89.12) p-tau231 (0–1.978) p-tau199 (0–5.781) PAPP-A (23.64–345.15) | Mn in CSF (0.4–2.51) Se in CSF (0.36–1.09) As in CSF (0.06–0.34) | 0.55556 | 7.250 × 10⁻⁹ * |
| Redescription Specific for: | HC (%) | MCI (%) | AD (%) | W1R | W2R | JS | p-Value | |
|---|---|---|---|---|---|---|---|---|
| Macro- and Microelements in Plasma | ||||||||
| AD | 0% | 8.6% | 30.1% | Albumin (58.44–411) PAPP-A (122.39–511.26) MMSE (5–28) Age (49–82) p-tau181 (23.19–126.71) T-tau (313.77–1992) | Ca in plasma (67.9–87.5) Na in plasma (3713–4033) Li in plasma (15–48) Cd in plasma (0.02–0.07) Ni in plasma (1.33–2.24) | 0.64583 | 2.475 × 10⁻⁸ * | |
| AD | 0% | 8.6% | 32.3% | Albumin (58.44–411) S100B (293.15–1596.64) PAPP-A (141–529.35) MMSE (5–28) Age (53–82) p-tau181 (23.19–126.71) t-tau (207.85–1992) | Li in plasma (14–29) Sr in plasma (16.1–44.7) Cu in plasma (779–1456) Ca in plasma (67.4–85.3) Pb in plasma (102.8–150) Hg in plasma (0.04–1.51) | 0.6346 | 2.9642 × 10⁻⁸ * | |
| AD | 6.6% | 22.9% | 50.5% | t-tau (207.85–1992) YKL-40 (4000–298,634) | Ca in plasma (73.6–90.4) Mg in plasma (22.3–43.6) Na in plasma (3131–4033) B in plasma (12.3–70.6) Mn in plasma (0.78–2.35) | 0.57143 | 0.002 * | |
| AD | 0% | 5.7% | 32.3% | Albumin (58.44–413.96) S100B (293.15–1925.01) PAPP-A (118.65–529.35) MMSE (5–28) p-tau181 (23.19–126.71) T-tau (211–1992) Aβ1–42 (136.3–1230.43) | Na in plasma (3716–4023) Li in plasma (15–32) Ca in plasma (67.3–87.5) | 0.51613 | 4.924 × 10⁻⁶ * | |
| AD | 0% | 14.3% | 41.9% | PAPP-A (122.39–529.35) YKL-40 (4000–364,460) MMSE (15–28) p-tau231 (0.432–25.83) T-tau (77.46–1992) | Li in plasma (14–32) Cd in plasma (0.01–0.07) Se in plasma (41.5–95.4) Mn in plasma (0.85–2.35) | 0.53659 | 2.812 × 10⁻⁴ * | |
| AD | 6.6% | 8.6% | 40.9% | PAPP-A (122.39–529.35) YKL-40 (67,043.38–364,460) MMSE (5–28) Age (49–82) p-tau181 (23.19–127) T-tau (207.85–1992) | Ca in plasma (67.3–87.5) Mg in plasma (22.2–32.2) Na in plasma (3671–4039) Mo in plasma (0.72–12.02) As in plasma (0.52–24.8) Zn in plasma (522–942) Ni in plasma (1.33–4.09) Mn in plasma (0.83–2.35) | 0.61111 | 6.127 × 10⁻⁶ * | |
| AD | 0% | 22.9% | 41% | T-tau (207.85–1992) MMSE (5–28) Age (49–82) p-tau231 (0.357–9.09) PAPP-A (122.39–529.35) | Cd in plasma (0–0.07) Ni in plasma (1.33–4.02) Mn in plasma (0.75–2.35) Ca in plasma (67.4–87.5) P in plasma (102.8–160.5) Na in plasma (3139–4033) | 0.64474 | 5.877 × 10⁻⁶ * | |
| AD | 6.6% | 17.1% | 41.9% | PAPP-A (122.39–529.35) YKL-40 (4000–384,387.22) p-tau231 (0.432–25.83) p-tau199 (0–15.781) p-tau181 (21.6–319.16) | Li in plasma (14–32) Cd in plasma (0.01–0.07) Se in plasma (41.5–95.4) Mn in plasma (0.85–2.35) | 0.51111 | 0.001 * | |
| AD | 6.6% | 22.9% | 45.2% | YKL-40 (4000–280,873) T-tau (313.77–2259) NFL (30.607–315.19) | Li in plasma (15–134) Mo in plasma (0.58–12.02) Mn in plasma (0.78–2.35) Ca in plasma (73.6–90.4) Mg in plasma (22.3–43.6) Na in plasma (3131–4033) B in plasma (12.3–70.6) | 0.54839 | 0.001 * | |
| AD | 6.6% | 20% | 45% | PAPP-A (122.39–529.35) T-tau (313.77–1992) | Ca in plasma (67.4–87.5) Mg in plasma (22.3–32.2) Na in plasma (3215–4033) B in plasma (12.3–70.6) Hg in plasma (0.04–3.25) Mo in plasma (0.72–12.02) Zn in plasma (522–942) Ni in plasma (1.11–4.09) Mn in plasma (0.8–2.35) | 0.54945 | 8.267 × 10⁻⁴ * | |
| AD&MCI | 6.6% | 45.7% | 45.2% | S100B (130.89–1267.47) Age (49–83) NFL (42.473–266.028) | Mo in plasma (0.83–12.02) Pb in plasma (103.9–223.7) As in plasma (0.48–3.2) | 0.56731 | 0.006 * | |
| AD&MCI | 0% | 22.8% | 41.9% | t-tau (207.85–1992) MMSE (5–28) Age (49–82) p-tau181 (23.19–126.71) PAPP-A (122.39–529.35) | Cd in plasma (0.01–0.07) Ni in plasma (1.33–4.02) Mn in plasma (0.83–2.35) Ca in plasma (67.4–85.1) Pb in plasma (102.8–160.5) | 0.63514 | 4.880 × 10⁻⁶ * | |
| AD&MCI | 6.6% | 48% | 43% | S100B (130.89–1267.47) Age (49–83) NFL (42.473–266.028) | Se in plasma (70.2–169.9) Co in plasma (0.26–1.07) Pb in plasma (103.9–223.7) | 0.55769 | 0.007 * | |
| AD&MCI | 6.6% | 31.4% | 53.8% | T-tau (235–2259) YKL-40 (4000–298634) MMSE (5–28) | Pb in plasma (0.12–1.21) Mn in plasma (0.75–2.35) Fe in plasma (742–3939) B in plasma (12.3–56.6) | 0.59048 | 0.008 * | |
| AD&MCI | 6.6% | 28.6% | 47.3% | PAPP-A (132.89–529.35) p-tau181 (21.6–319.16) p-tau199 (0.44–17.266) Aβ1–42 (136.3–696.0) | Mg in plasma (18.6–30.3) B in plasma (12.3–64.4) Pb in plasma (0.18–3.36) Cd in plasma (0.01–0.07) Zn in plasma (522–942) Ni in plasma (0.95–4.09) Mn in plasma (0.8–3.24) Ca in plasma (66.4–87.5) | 0.56122 | 0.002 * | |
| AD&MCI | 6.6% | 40% | 44.1% | NFL (42.473–266.028) S100B (130.89–1267.47) PAPP-A (23.64–312.85) Age (49–83) | Li in plasma (16–174) P in plasma (103.9–249.4) As in plasma (0.48–24.8) Mg in plasma (21.8–43.6) Hg in plasma (0.04–2.23) | 0.58333 | 0.001 * | |
| AD&MCI | 6.6% | 31.4% | 46.2% | PAPP-A (132.89–529.35) p-tau181 (21.6–319.16) Aβ1–42 (136.3–696) | Ca in plasma (66.4–85.3) Mg in plasma (20.8–30.3) B in plasma (12.3–70.6) Cd in plasma (0.01–0.07) Mo in plasma (0.72–12.02) Zn in plasma (522–942) Cu in plasma (500–1120) Ni in plasma (1.11–4.09) Co in plasma (0.26–1.07) | 0.55556 | 0.003 * | |
| Macro- and Microelements in CSF and Plasma | ||||||||
| Redescription specific for: | HC (%) | MCI (%) | AD (%) | W1R | W2R | W3R | JS | p-Value |
| AD&MCI | 6.6% | 45.7% | 66% | Age (60–91) t-tau (148.21–1992) | Zn in plasma (507–942) S in plasma (654–896) Na in plasma (3248–4043) B in plasma (15.5–213.1) | Se in CSF (0.69–3.69) | 0.59848 | 0.003 * |
| AD&MCI | 6.6% | 45.7% | 60.2% | NFL (22–220.86) YKL-40 (81,665–483,135.59) p-tau231 (0.357–22.87) p-tau181 (23.19–319.16) | B in plasma (12.3–70.6) Co in plasma (0.27–1.07) P in plasma (78.1–249.4) Pb in plasma (0.1–3.36) | Se in CSF (0.74–3.69) Li in CSF (0.03–8.36) | 0.54074 | 1.933 × 10⁻⁴ * |
| AD&MCI | 6.6% | 40% | 61.3% | Albumin (73.84–1683.65) Age (64–91) p-tau181 (37.62–319.16) | S in plasma (452–945) Zn in plasma (492–1115) | Co in CSF (0.081–0.872) | 0.5 | 0.009 * |
| AD&MCI | 6.6% | 54.3% | 72% | Age (63–91) p-tau181 (23.19–319.16) | Pb in plasma (0.09–3.36) Mn in plasma (0.82–3.22) Li in plasma (16–174) | Se in CSF (0.82–3.69) | 0.64444 | 8.697 × 10⁻⁴ * |
| AD&MCI | 6.6% | 45.7% | 64.6% | Age (60–91) t-tau (148.21 <= 1992) | Ca in plasma (67.4–85.1) Mg in plasma (22.2–32.2) Na in plasma (3149–4039) | Se in CSF (0.69–3.69) | 0.50327 | 0.009 * |
| AD&MCI | 6.6% | 45.7% | 72% | Age (60–91) p-tau231 (0.278–25.83) | Na in plasma (2578–4012) B in plasma (15.5–213.1) Pb in plasma (0.1–3.36) | Li in CSF (0.05–21.32) Cu in CSF (10.6–36.98) | 0.5283 | 0.002 * |
| AD&MCI | 26% | 65.7% | 79.6% | p-tau231 (0.278–25.83) t-tau (88–2259) | Na in plasma (3149–4769) Mo in plasma (0.81–12.02) | Mg in CSF (13.92–42.7) Se in CSF (0.69–3.15) | 0.66887 | 0.004 * |
| AD&MCI | 20% | 65.7% | 75.4% | p-tau231 (0.278–25.83) t-tau (88–2259) | Na in plasma (3149–4023) Pb in plasma (0.09–3.36) Mo in plasma (0.81–12.02) | Cu in CSF (8.77–36.98) | 0.63576 | 0.009 * |
| AD&MCI | 20% | 65.7% | 75.3% | p-tau231 (0–7.941) p-tau181 (21.27–194) Aβ1–42 (136.3–1347) | B in plasma (7.9–70.6) Hg in plasma (0.04–3.25) | Ni in CSF (0.26–2.03) Fe in CSF (11.9–111.3) | 0.70073 | 0.006 * |
| AD&MCI | 20% | 60% | 75.3% | p-tau231 (0.288–25.83) t-tau (88–2259) | Ca in plasma (63.4–85.1) Mo in plasma (0.81–12.02) Zn in plasma (507–1115) | Mg in CSF (13.92–42.7) Se in CSF (0.69–3.15) | 0.62667 | 0.009 * |
| AD&MCI | 20% | 51.4% | 74.2% | Age (63–91) p-tau181 (23.19–319.16) | Mg in plasma (15.4–30.4) Mn in plasma (0.51–3.22) | Se in CSF (0.82–3.69) | 0.65217 | 0.004 * |
| HC | 93.3% | 71.4% | 63.4% | VILIP-1 (17.2–224.29) | Sr in plasma (14.6–44.7) Ca in plasma (71.4–108.2) | Cd in CSF (0.005–0.045) Na in CSF (958.0–4481.0) | 0.64474 | 0.006 * |
Disclaimer/Publisher’s Note: The statements, opinions and data contained in all publications are solely those of the individual author(s) and contributor(s) and not of MDPI and/or the editor(s). MDPI and/or the editor(s) disclaim responsibility for any injury to people or property resulting from any ideas, methods, instructions or products referred to in the content. |
© 2022 by the authors. Licensee MDPI, Basel, Switzerland. This article is an open access article distributed under the terms and conditions of the Creative Commons Attribution (CC BY) license (https://creativecommons.org/licenses/by/4.0/).
Share and Cite
Babić Leko, M.; Mihelčić, M.; Jurasović, J.; Nikolac Perković, M.; Španić, E.; Sekovanić, A.; Orct, T.; Zubčić, K.; Langer Horvat, L.; Pleić, N.; et al. Heavy Metals and Essential Metals Are Associated with Cerebrospinal Fluid Biomarkers of Alzheimer’s Disease. Int. J. Mol. Sci. 2023, 24, 467. https://doi.org/10.3390/ijms24010467
Babić Leko M, Mihelčić M, Jurasović J, Nikolac Perković M, Španić E, Sekovanić A, Orct T, Zubčić K, Langer Horvat L, Pleić N, et al. Heavy Metals and Essential Metals Are Associated with Cerebrospinal Fluid Biomarkers of Alzheimer’s Disease. International Journal of Molecular Sciences. 2023; 24(1):467. https://doi.org/10.3390/ijms24010467
Chicago/Turabian StyleBabić Leko, Mirjana, Matej Mihelčić, Jasna Jurasović, Matea Nikolac Perković, Ena Španić, Ankica Sekovanić, Tatjana Orct, Klara Zubčić, Lea Langer Horvat, Nikolina Pleić, and et al. 2023. "Heavy Metals and Essential Metals Are Associated with Cerebrospinal Fluid Biomarkers of Alzheimer’s Disease" International Journal of Molecular Sciences 24, no. 1: 467. https://doi.org/10.3390/ijms24010467
APA StyleBabić Leko, M., Mihelčić, M., Jurasović, J., Nikolac Perković, M., Španić, E., Sekovanić, A., Orct, T., Zubčić, K., Langer Horvat, L., Pleić, N., Kiđemet-Piskač, S., Vogrinc, Ž., Pivac, N., Diana, A., Borovečki, F., Hof, P. R., & Šimić, G. (2023). Heavy Metals and Essential Metals Are Associated with Cerebrospinal Fluid Biomarkers of Alzheimer’s Disease. International Journal of Molecular Sciences, 24(1), 467. https://doi.org/10.3390/ijms24010467