Article

Genome-Wide Characterization of High-Affinity Nitrate Transporter 2 (NRT2) Gene Family in Brassica napus

1
College of Agronomy and Biotechnology, Southwest University, Chongqing 400716, China
2
Academy of Agricultural Sciences, Southwest University, Chongqing 400716, China
*
Author to whom correspondence should be addressed.
Int. J. Mol. Sci. 2022, 23(9), 4965; https://doi.org/10.3390/ijms23094965
Submission received: 7 April 2022 / Revised: 25 April 2022 / Accepted: 28 April 2022 / Published: 29 April 2022
(This article belongs to the Special Issue Molecular Genetics and Plant Breeding 2.0)

Abstract

:
Nitrate transporter 2 (NRT2) plays an essential role in Nitrogen (N) uptake, transport, utilization, and stress resistance. In this study, the NRT2 gene family in two sequenced Brassica napus ecotypes were identified, including 31 genes in ‘Zhongshuang11’ (BnaZSNRT2s) and 19 in ‘Darmor-bzh’ (BnaDarNRT2s). The candidate genes were divided into three groups (Group I−III) based on phylogenetic analyses, supported by a conserved intron-exon structure in each group. Collinearity analysis revealed that the large expansion of BnaZSNRT2s attributed to allopolyploidization of ancestors Brassica rapa and Brassica oleracea, and small-scale duplication events in B. napus. Transcription factor (TF) binding site prediction, cis-element analysis, and microRNA prediction suggested that the expressions of BnaZSNRT2s are regulated by multiple factors, and the regulatory pattern is relatively conserved in each group and is tightly connected between groups. Expression assay showed the diverse and differentiated spatial-temporal expression profiles of BnaZSNRT2s in Group I, but conserved patterns were observed in Group II/III; and the low nitrogen (LN) stress up-regulated expression profiles were presented in Group I−III, based on RNA-seq data. RT-qPCR analyses confirmed that BnaZSNRT2.5A-1 and BnaZSNRT2.5C-1 in Group II were highly up-regulated under LN stress in B. napus roots. Our results offer valid information and candidates for further functional BnaZSNRT2s studies.

1. Introduction

Nitrogen (N), mainly in the form of nitrate, is a crucial element for plant development and a vital factor affecting diverse plant bioprocesses, such as photosynthesis and protein synthesis [1,2]. Thus, it is substantially required by crops to form agricultural production [3,4,5,6]. Normally, sufficient N conditions can protect crop yield and quality in variable environments [7]. However, the distributions of biologically available N, including nitrate, ammonium, and small peptides, are uneven in natural and agricultural land worldwide [8]. In this case, large amounts of fertilizer were generally applied in production, and approximately 60% of the annual fertilizer consumption is N, which ensures more than 40% of the population’s basic food needs [6,9]. On the other hand, excessive N fertilizer application brings a series of environmental damages, such as acid rain [10], water eutrophication [11,12], the greenhouse effect [13,14], and poor soil fertility [15]. Hence, analyses concerning increasing the efficiency in N absorption and utilization perform crucial roles in crop yield, quality, and even environmental protection.
NITRATE TRANSPORTER 2 (NRT2) homologous proteins are typical high-affinity nitrate transporters in the plant kingdom and are responsible for the nitrate uptake process in plants. In general, NRT2 proteins (NRT2s) have a typical membrane topology connected by a cytosolic loop, including 1 MFS domain that exhibits dual affinities for nitrate [16] and 12 transmembrane domains [17], which are usually located on the cell plasma membrane [18]. In Arabidopsis, there are 7 NRT2 genes (AtNRT2s) that were divided into three groups [6,19]; with Group I containing 5 members while Groups II/III only include 1 member each. In Group I, AtNRT2.1 and AtNRT2.2 play vital roles in nitrate uptake in roots [20]; AtNRT2.4 acts a key role in nitrate uptake under low nitrogen (LN) stress in both shoots and roots [21]; AtNRT2.6 is involved in biotic and abiotic stresses [22]; whereas AtNRT2.3 remains to be functional elucidated yet. In Group II, AtNRT2.5 plays an essential role in severe nitrogen starvation response. The expression of AtNRT2.5 was highly induced after a long N starvation, and then it acted as the major transporter for high-affinity nitrate uptake [23]. In Group III, AtNRT2.7 is expressed in tonoplast and contributes to the N accumulation in seeds [24]. Notably, except for AtNRT2.7, all of the other AtNRT2 transporters could interact with AtNAR2.1, enhancing the nitrate uptake capacity of AtNRT2s [25]. Similarly, the homologs of AtNRT2s in other plants were widely demonstrated to perform numerous roles in N uptake, transport, and utilization processes across developmental stages. For instance, in rice, OsNRT2.3a plays a key role in increasing N use efficiency and field [26]. In wheat, TaNRT2.5 is expressed in the embryo and shell and acts in nitrate accumulation in seeds [27]. In maize, ZmNRT2.1 regulates nitrate uptake along the root axis [28]. Together, NRT2 homologs play key roles in nitrate uptake and even utilization in plants. Thus, systematically identifying the NRT2 gene families in plant genomes and exploring their roles involved in nitrate utilization processes may contribute to promoting the N utilization efficiency (NUE) and crop yields without resorting to excessive N fertilizer.
Brassica napus (B. napus; AnAnCnCn, 2n = 38) is a significant oil crop worldwide which was an allopolyploid produced by Brassica rapa (B. rapa; AnAn, n = 10) and Brassica oleracea (B. oleracea; CnCn, n = 9) ~7500 years ago [29,30]. So far, the genomes of 2 B. napus ecotypes have been sequenced, namely ‘Darmor-bzh’ and ‘Zhongshuang 11’ (ZS11). B. napus rely on the amount of N in the production, which needs more N fertilizer to produce a unit of yield than wheat and rice [31,32]. However, the NUE of B. napus is much lower than wheat and rice, causing a mass of N loss [33,34]. Given the important roles in N utilization-related processes, identifying the NRT2 encoding genes at a genome-wide level and exploring their roles in N uptake and utilization processes in B. napus has potential research significance and application value, aiming to improve the NUE and even the yield and quality of B. napus.
In our study, we conducted global analyses of the NRT2 gene family in 2 ecotypes of B. napus genomes (‘Darmor-bzh’ and ‘ZS11’) at the genome-wide level, accompanied by a series of bioinformatics assays of the candidates, including sequence structure, phylogenetic relationship, chromosomal location, collinearity relationship, gene duplication, regulatory mechanism prediction, etc. Then, we analyzed the spatial-temporal expression profiles of candidates in 52 B. napus (ZS11) tissues/organs across distinct developmental stages. Moreover, the LN stress expression patterns of the candidates in B. napus (ZS11) seedling roots were analyzed by RNA-Seq and RT-qPCR methods, respectively. Our findings constitute the first step toward further research on the molecular functions of NRT2s in B. napus.

2. Results

2.1. Identification of NRT2 Genes in B. napus

To identify the NRT2s in B. napus genome, we performed preparatory BLASTP and Tblastn searches using the protein sequences of Arabidopsis NRT2 protein (AtNRT2s) [35] as queries. Two sequenced genome databases of B. napus varieties in GENOSCOPE (Darmor–bzh, http://www.genoscope.cns.fr/brassicanapus/, accessed on 19 August 2014) [30] and BnPIR (Zhongshuang 11, ZS11, http://cbi.hzau.edu.cn/bnapus/, accessed on 10 September 2020) [29] were used. After excluding the redundant sequences, the remainders were further verified by SMART (http://smart.embl-heidelberg.de/, accessed on 26 October 2020) and ExPASy (https://web.expasy.org/compute_pi/, accessed on 23 February 2022) online software to ensure the candidates contain the typical sequence features of this gene family. Finally, we obtained 19 candidate genes from the ‘Darmor-bzh’ genome (BnaDarNRT2s) and 31 candidates from the ‘ZS11’ genome (BnaZSNRT2s) with relative complete functional domains. Then, we named them based on the Arabidopsis homologous NRT2s and their chromosome locations in B. napus, such as the four homologs of AtNRT2.1 gene in An subgenome were named as BnaZSNRT2.1A-1 to BnaZSNRT2.1A-4 whereas these in Cn were named as BnaZSNRT2.1C-1 to BnaZSNRT2.1C-4 (Table 1 and Table S1).
As shown in Table 1 and Table S1, the length of BnaDarNRT2 proteins (BnaDarNRT2s) and BnaZSNRT2 proteins (BnaZSNRT2s) ranged from 154 to 506 amino acids and 113 to 567 amino acids. The average value was 427.16 and 472.26, and the standard deviation (SD) was 99.54 and 126.73, respectively. Isoelectric point (pI) of BnaDarNRT2s and BnaZSNRT2s varied from 7.54 to 9.93 and 6.02 to 9.93, with an average value of 8.94 and 8.65, and the SD was 0.57 and 0.87, respectively. Their molecular weight (MW) varied from 17.09 to 54.83 kDa and 12.19 to 61.87 kDa, with the average value being 46.44 and 51.25, and the SD 10.7 and 13.75, respectively. Subcellular localization analysis showed that nearly all 19 BnaDarNRT2s and 30 BnaZSNRT2s were located on the cell membrane. Only BnaZSNRT2.6C-5 was located on chloroplast/cytoplasm, which suggested their potential function features in the nitrate utilization process.

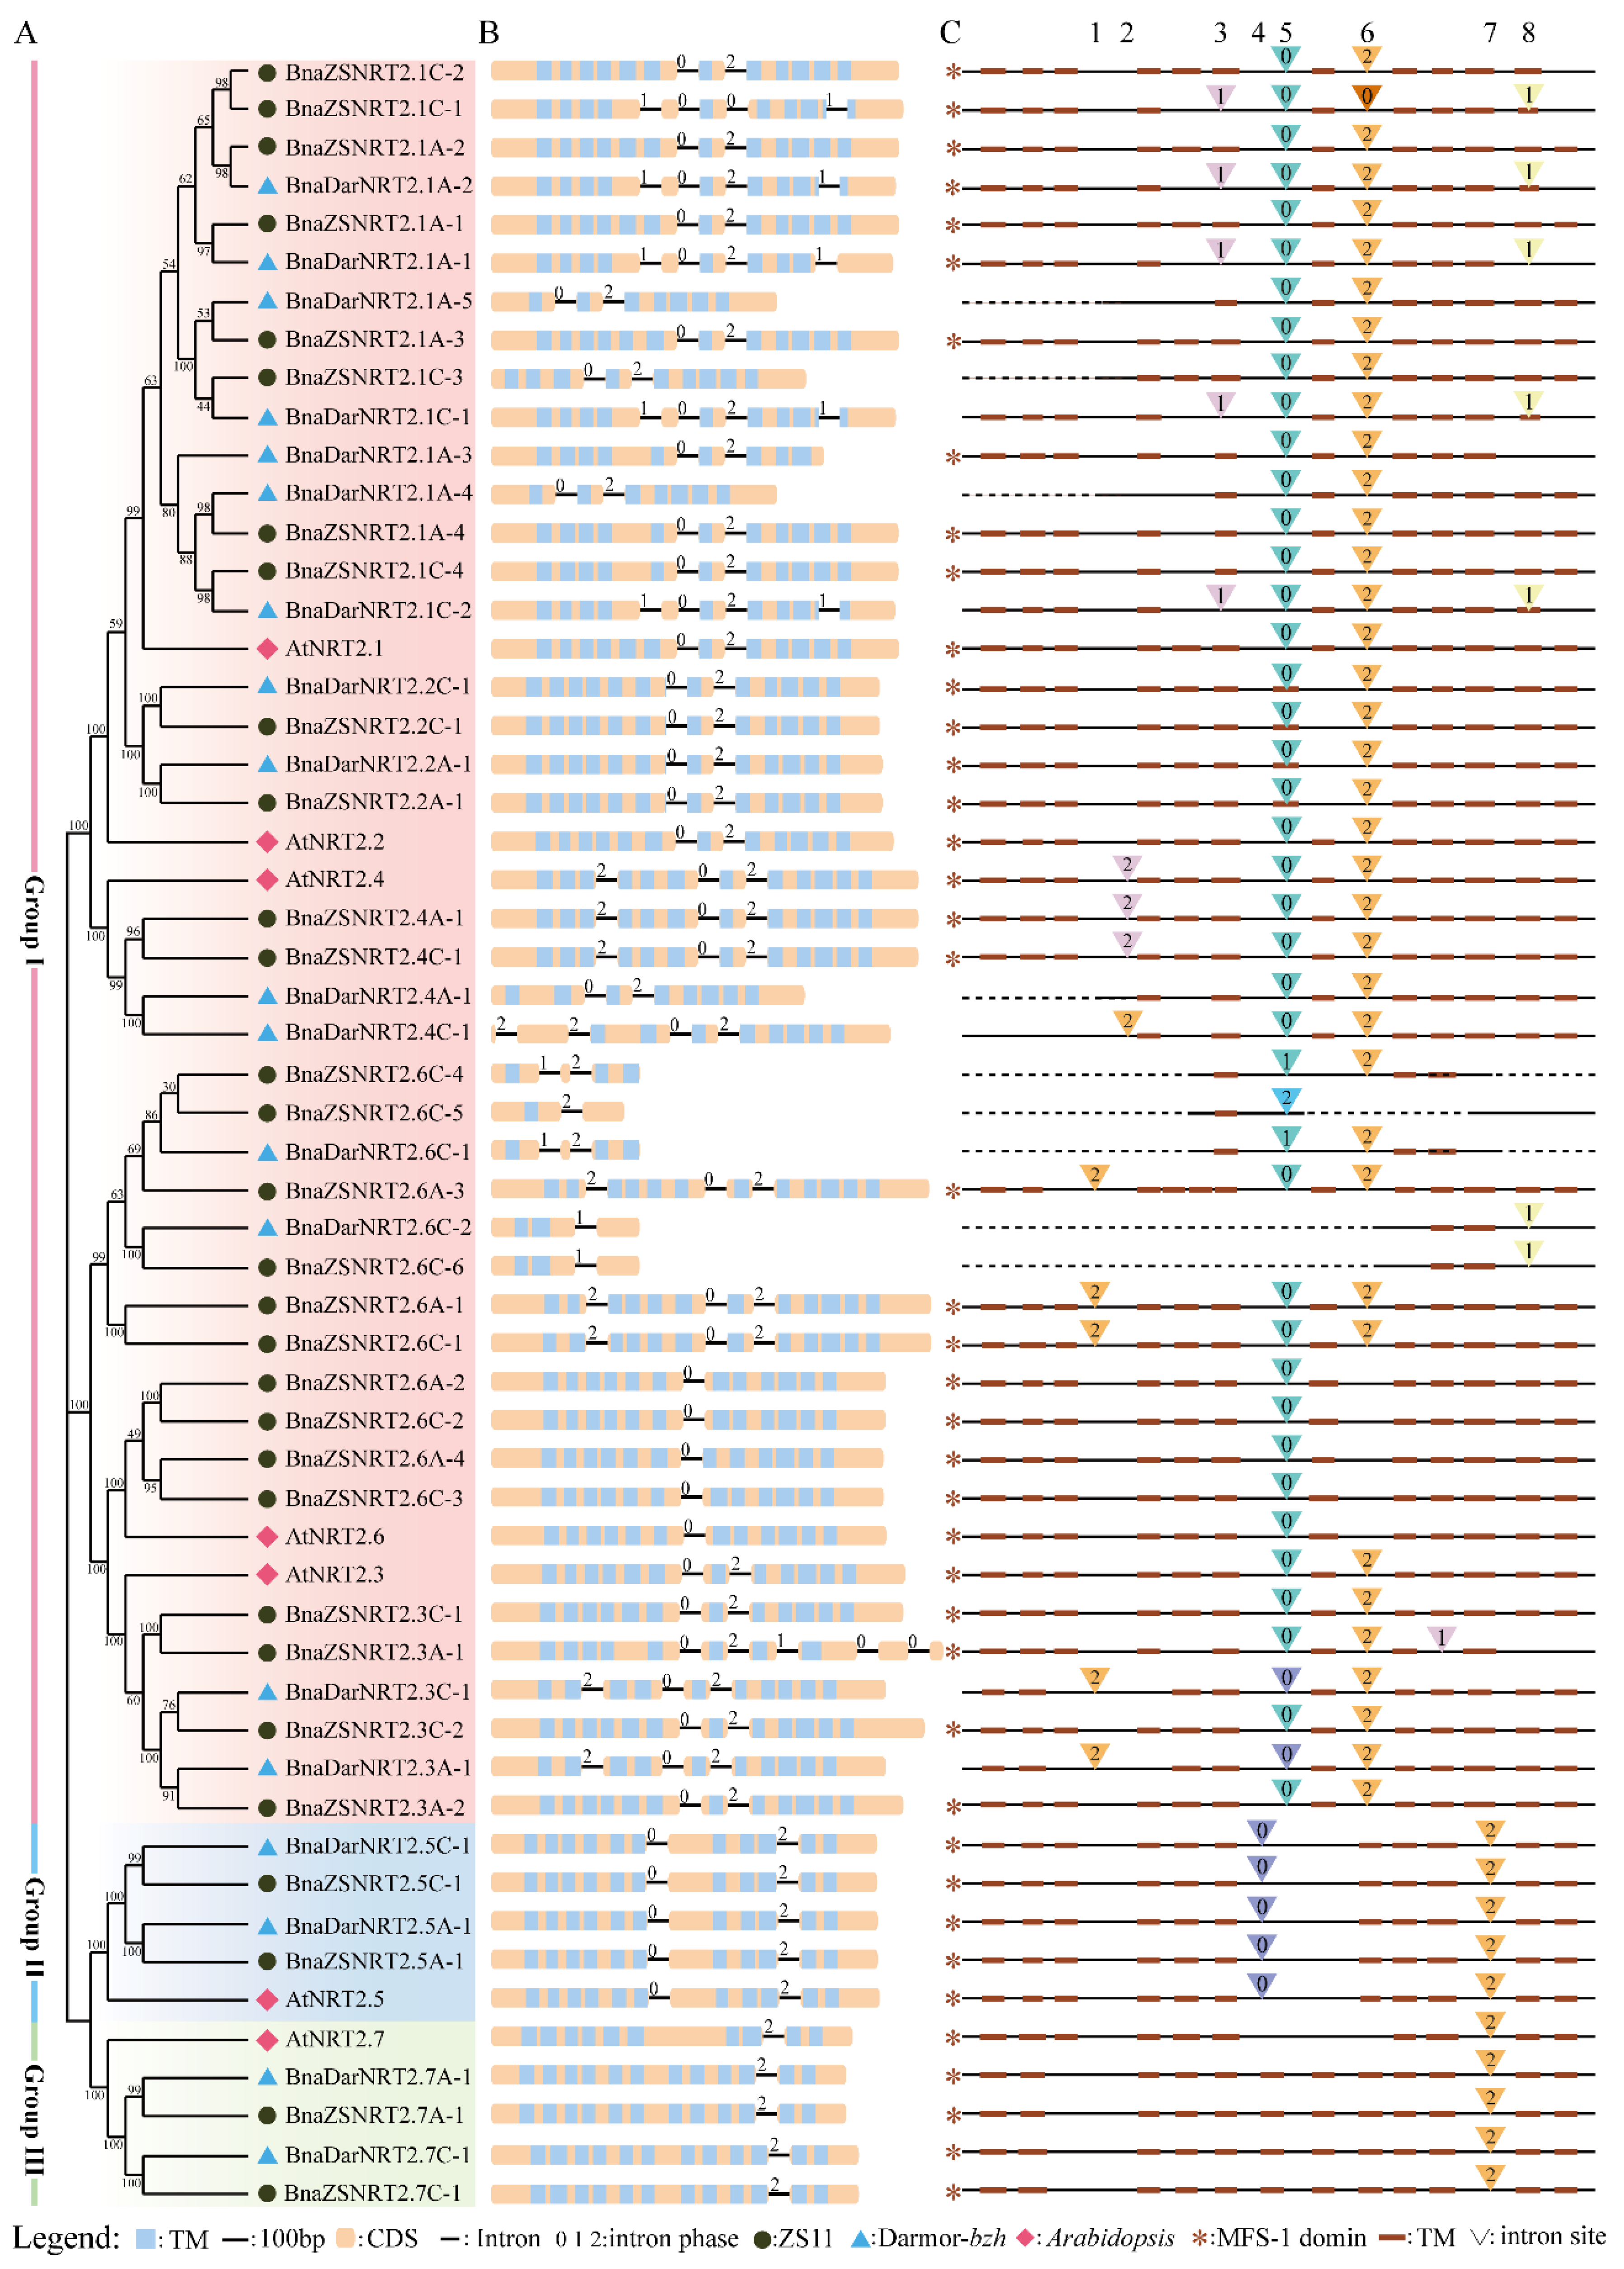
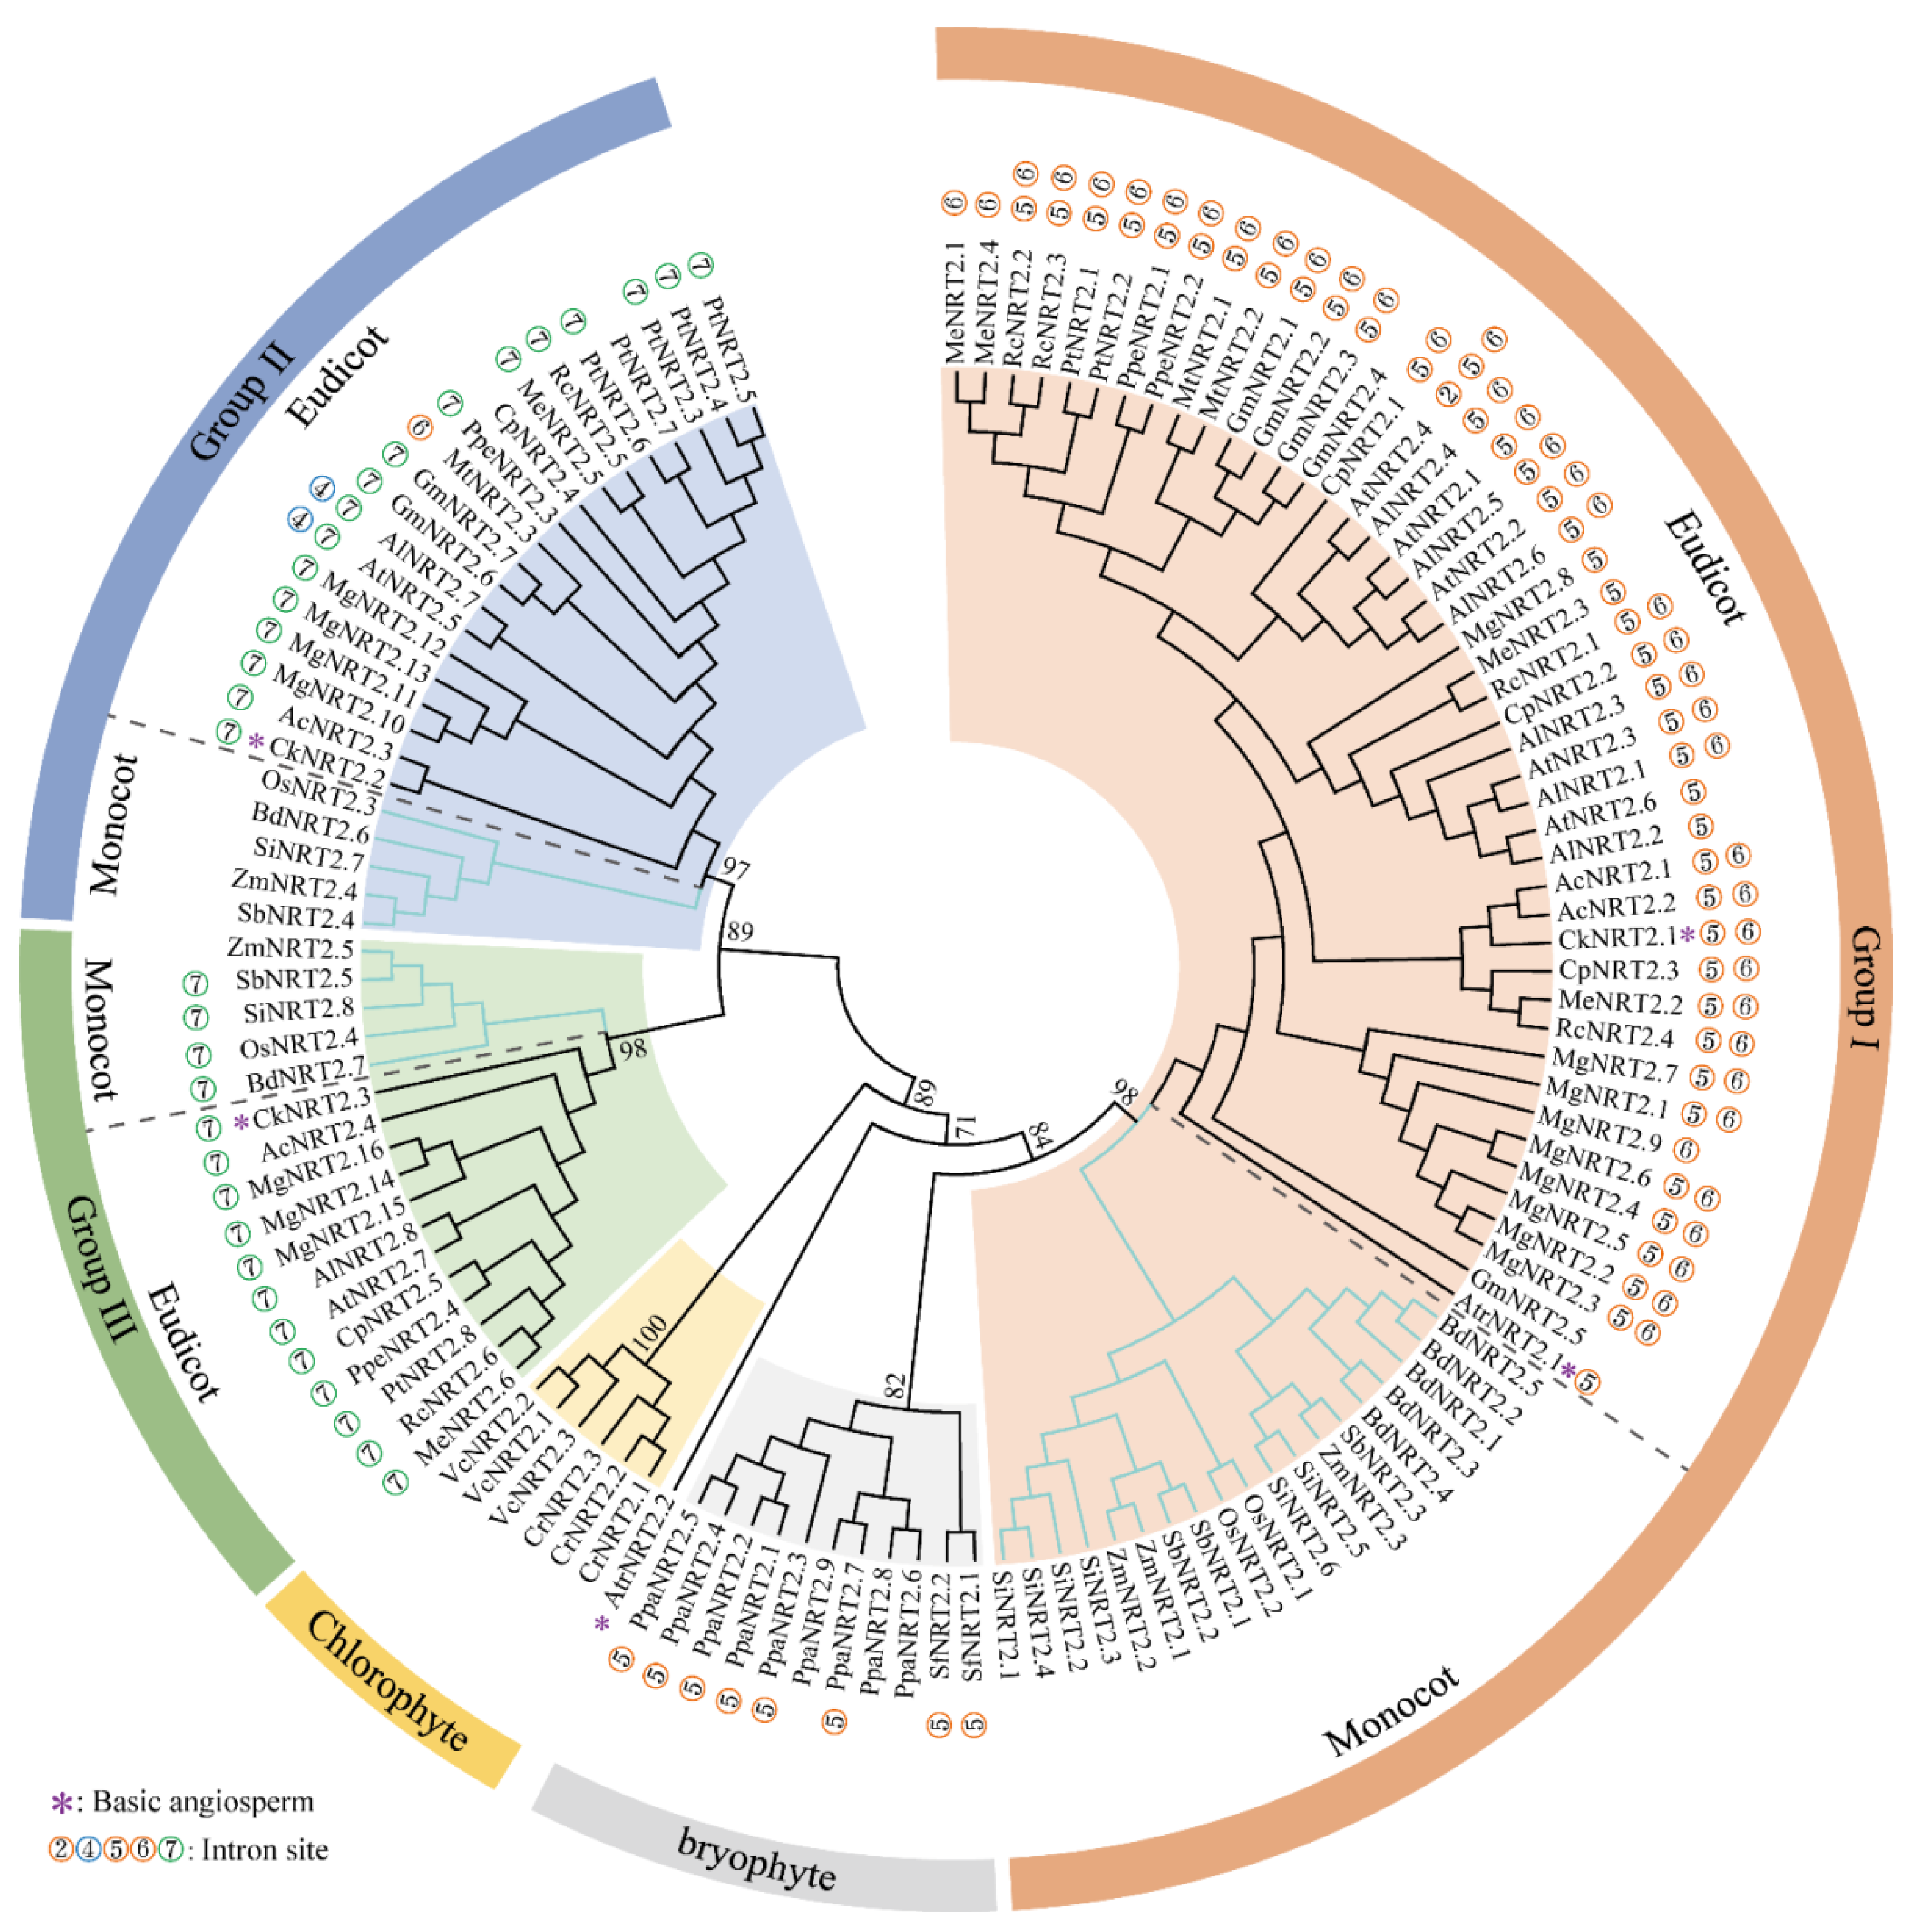
2.2. Phylogenetic and Sequence Structure Analysis of B. napus NRT2 Gene Family

To investigate the phylogenetic relationship of the candidate NRT2s, a neighbor-joining (NJ) phylogenetic tree of the 19 BnaDarNRT2s, 31 BnaZSNRT2s, and 7 AtNRT2s was generated based on the multi-alignment of the whole-length protein sequences (Figure 1A). Due to technical reasons (having no common information site(s) between sequences), BnaZSNRT2.8C-1 was excluded from the phylogenetic tree because of severe sequence deletion. According to the topology and bootstrap values of the NJ tree, the candidates were separated into three groups: Group I–III. Group I was the largest, which contained 15 BnaDarNRT2s, 26 BnaZSNRT2s, and 5 AtNRT2s; Group II/III both contained 2 BnaDarNRT2s, 2 BnaZSNRT2s, and 1 AtNRT2s. The number of BnaDarNRT2s and BnaZSNRT2s in Group II and III was equal, while the number of homologs between these two ecotypes was quite different in Group I. Excepting for 11 homologous gene pairs, there are 4 BnaDarNRT2s and 15 BnaZSNRT2s having non-homologs in Group I. In general, the AtNRT2s have homologs in both ecotypes, and the AtNRT2s in Group I have more homologs in ‘ZS11’ than in ‘Darmor-bzh’, excepting AtNRT2.6, which only has BnaZSNRT2s homologs. Subsequently, we analyzed the sequence identity and similarity of the full-length DNA, CDS, and protein sequences of each homologous gene pair (Table S2). The results showed that the sequence identity and similarity in Group II/III were very high, with the protein sequence identity ranging from 84.6–100% in each group, while that was decreased in Group I (ranging from 62.10–100%). These results indicated that the gene number, sequence features, and even functions of the homologous gene pairs in Group II and III were highly conserved during evolution, while those in Group I may undergo functional diversification.
Sequence structure feature observed 8 relatively conserved intron insertion sites in terms of conserved insertion site and phase, namely intron “1” to “8” (Figure 1C). The intron number of NRT2s varies in Group I−III or even within a group, while members of Group I had 1 to 5 introns, Group II had 2 introns, and Group III had 1 intron. Although the number of introns was diverse in the three groups, the intron insertion site and phase were generally conserved within each group. Members of Group II contained intron “4” and “7”, which were conserved in this group. Similarly, the intron patterns were also completely conserved in group III, members of which contained intron “7”. By contrast, the intron number, insertion site, and phase in Group I were diverse and relatively less conserved, which contained 6 relative conserved intron sites, “1–3”, “5”, “6”, and “8”. Among them, intron “5” (39/46, ~85%) and “6” (37/46, ~80%) were highly conserved in this group, with several aberrations due merely to the severe sequence missing and flanking sequence diversity. In contrast, the rest introns (“1”, “2”, “3”, and “8”) were only conserved within several genes. Together, the exon-intron structures of Group II and III were highly conserved in comparison with that of Group I. The intron “7” was shared and completely conserved in Group II and III, implying the close relationship between these two groups. Moreover, almost all introns were located outside of the transmembrane domains (TMs), except introns “5” and “8” in Group I.
The protein domain prediction using HMMER online software (https://www.ebi.ac.uk/Tools/hmmer/, accessed on 19 November 2021) showed that 42 of the 50 members (84%) of BnaDarNRT2s and BnaZSNRT2s have 8 to 12 TMs (Figure 1B). Most members of Group I (34/41, ~82.93%) had 8 to 12 TMs, all members of Group II possessed 11 TMs, and nearly all of Group III had 12 TMs except AtNRT2.7 (10 TMs). The MFS-1 domain existed in most candidates (Figure 1C), which was located in the middle region, covering nearly all TMs. Moreover, the distribution and characteristics of the MFS-1 and TM domains were highly conserved within each group, especially in Groups II and III (Figure S1). Our results demonstrated that the protein domains were relatively conserved in the NRT2 gene family, and they were highly conserved in the same group.

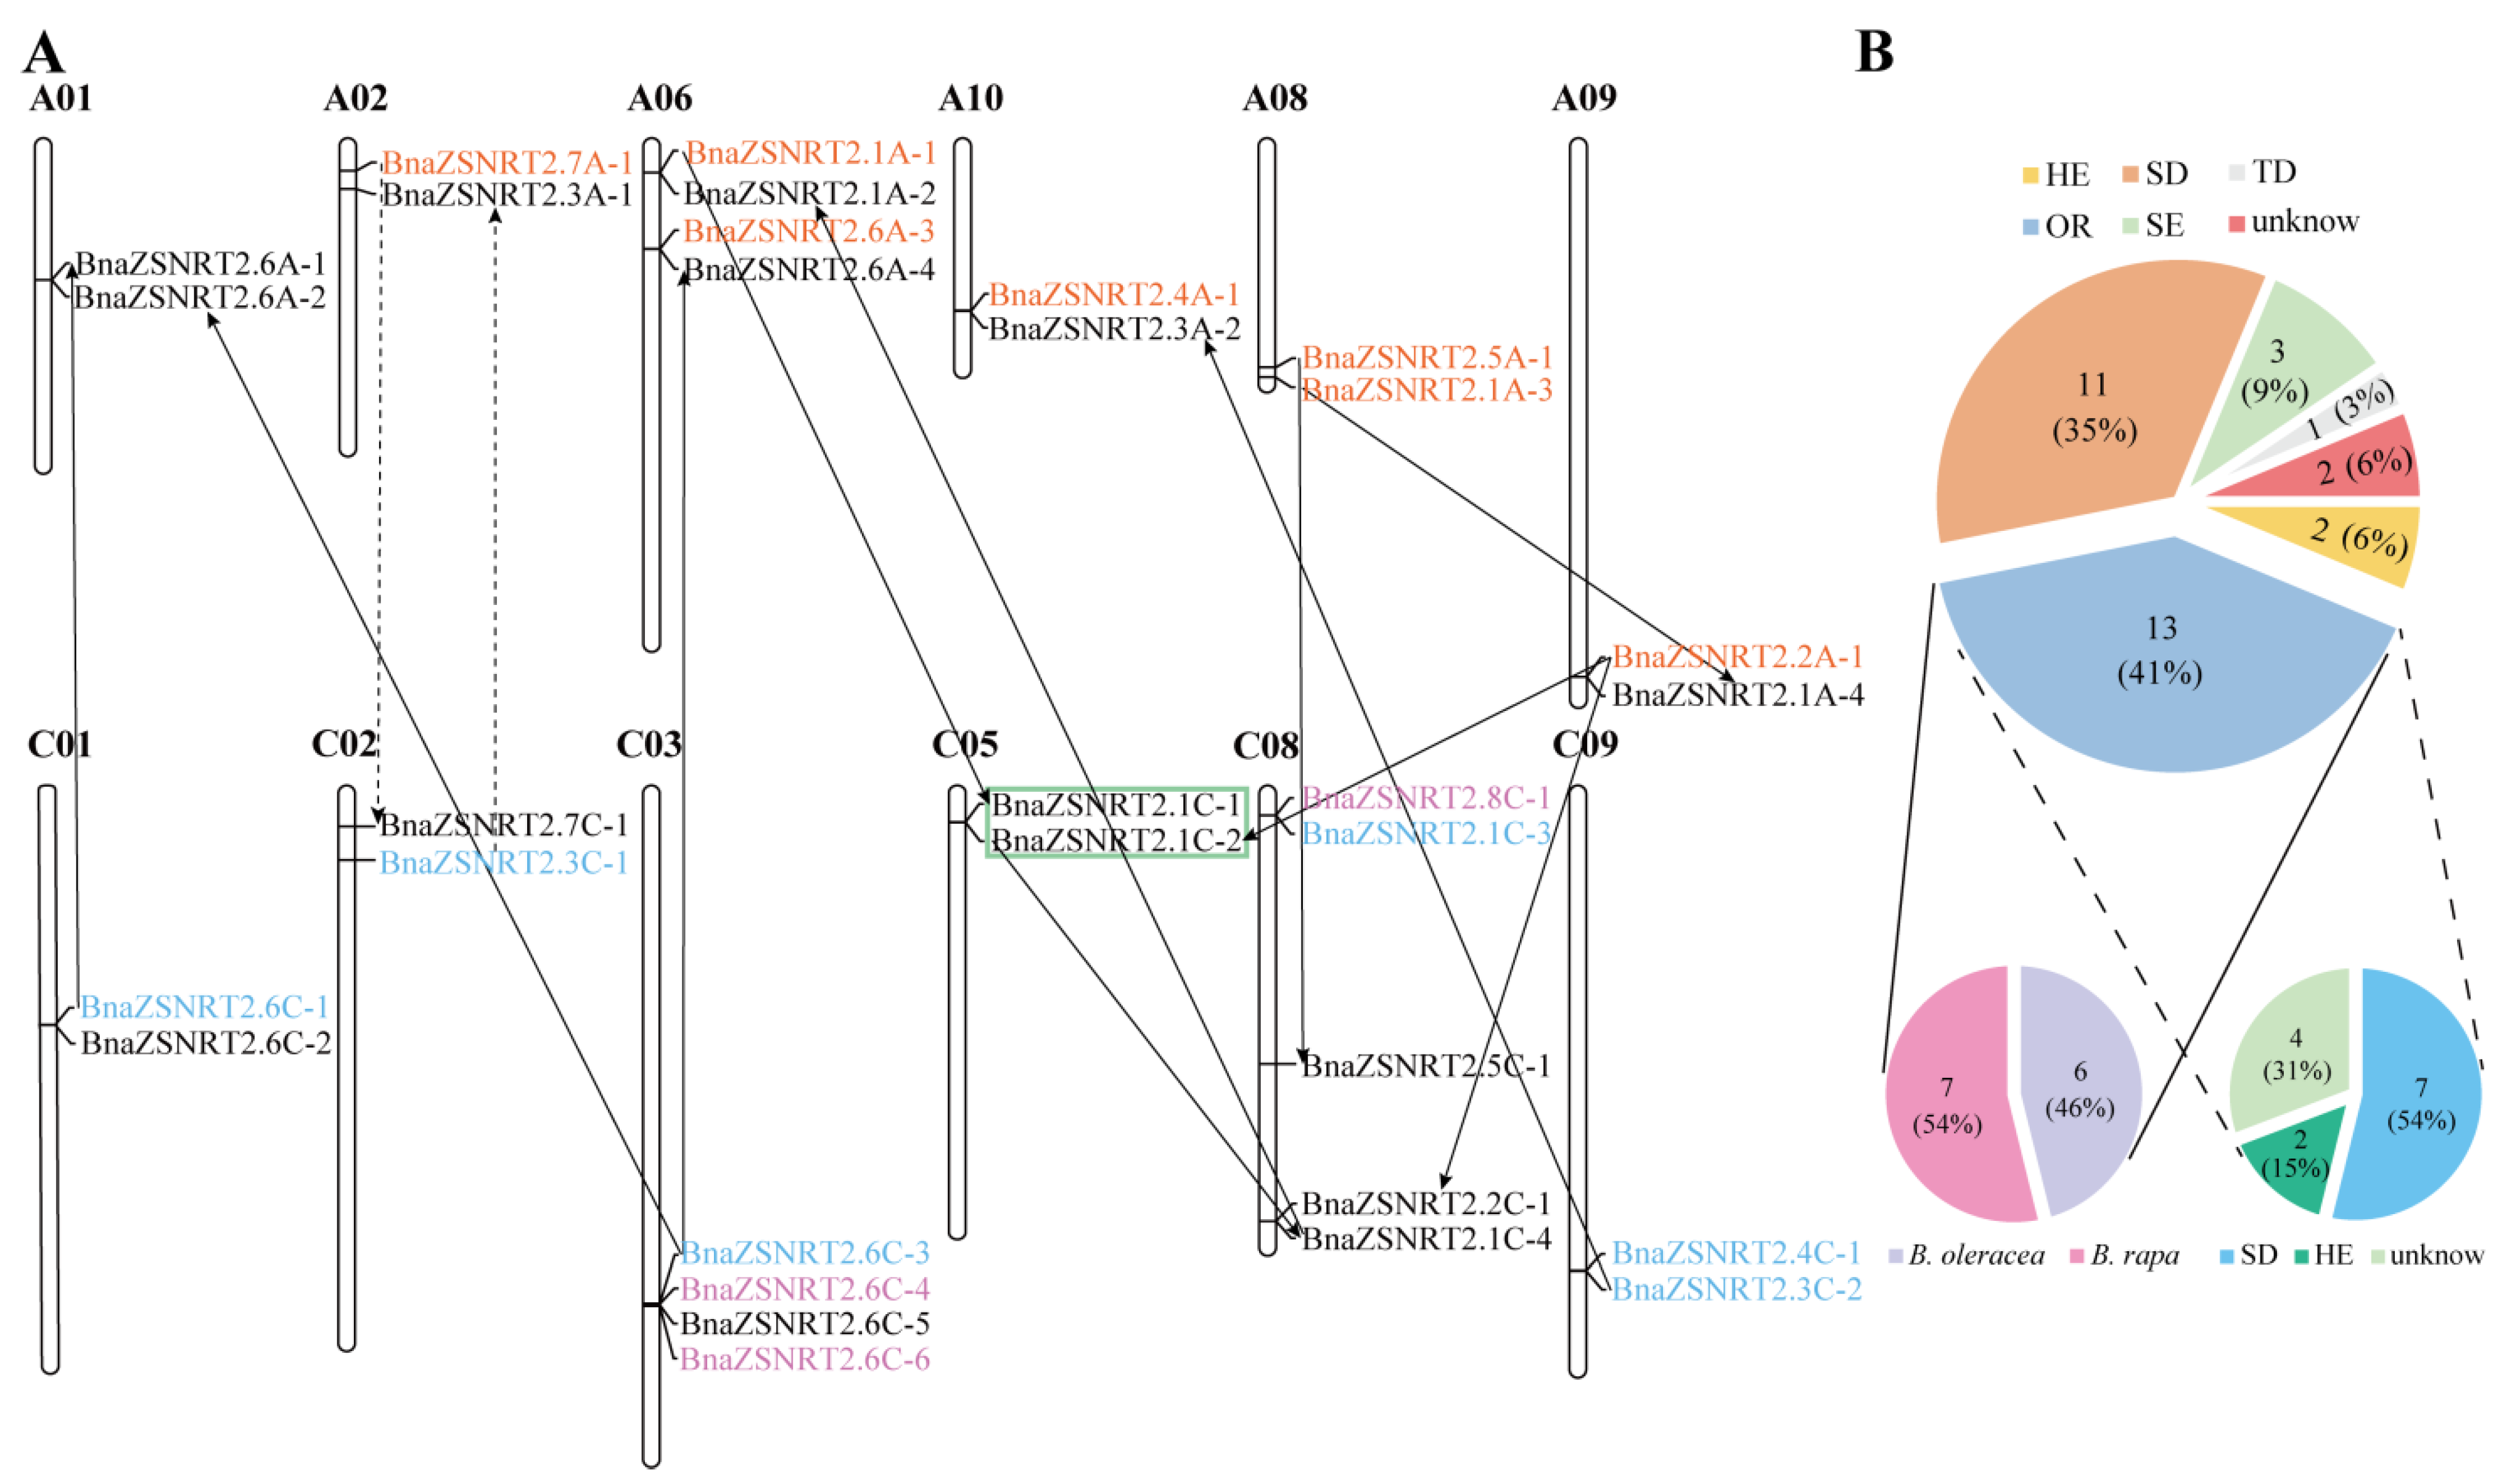
2.3. Chromosomal Location and Collinearity Relationship in BnaZSNRT2s

As shown in Figure 2A, the 31 BnaZSNRT2s were scattered on 12 of the 19 B. napus chromosomes. There are 5, 4, and 4 BnaZSNRT2s located on chromosomes Cn08, An06, and Cn03, respectively; each of the last 9 chromosomes contained 2 BnaZSNRT2s. The numbers of BnaZSNRT2s on An-subgenome (14 genes) and Cn-subgenome (17 genes) showed a biased trend, with more genes on Cn-subgenome.
The number of NRT2s in B. napus genome is larger than in the other species reported, e.g., Arabidopsis (7 genes) [35], poplar (6 genes) [36], barley (10 genes) [37]. This may because B. napus (AnAnCnCn, 2n = 38) was newly originated from the hybridization event between Brassica rapa (AnAn, n = 10) and Brassica oleracea (CnCn, n = 9) ~7500 years ago [30], and Brassicaceae species underwent a whole-genome triplication (WGT) event [38]. Therefore, in theory, B. rapa, B. oleracea, and B. napus genomes may have 21, 21, and 42 NRT2s expanded from the 7 AtNRT2s. In fact, only 14, 14, 19, and 31 genes were identified in B. rapa, B. oleracea, ‘Darmor-bzh’, and ‘ZS11’, respectively (Table S3), indicating that many NRT2s may have been lost during evolution. Theoretically, 5 AtNRT2s in Group I should expand to 30 BnaZSNRT2s/BnaDarNRT2s, and 1 AtNRT2 in Group II/III should expand to 6 homologs in B. napus, respectively. In fact, 27, 2, and 2 genes were identified in Group I−III in the ‘ZS11’ecotype, and 15, 2, and 2 genes were identified in Group I−III in the ‘Darmor-bzh’ ecotype, indicating that ‘ZS11’ retained 12 genes more than ‘Darmor-bzh’ in Group I, and the two ecotypes both lost 4 genes in Group II/III.
Collinearity relationship analysis found that 29 of the 31 (~93.55%) BnaZSNRT2s had the collinearity relationship in B. napus, B. rapa, and/or B. oleracea, except for BnaZSNRT2.6C-2 and BnaZSNRT2.6C-5 (Figure 2B, Table S4). Among the 29 BnaZSNRT2s, 13 genes (~44.83%) were inherited from allopolyploidy between B. rapa and B. oleracea, including 7 genes (~24.14%) were inherited from B. rapa and 6 genes (~20.69%) were from B. oleracea; the last 16 (~55.17%) BnaZSNRT2s were originated from other duplication events within B. napus genome, including 11 (68.75%) genes from segmental duplication (SD), 3 (18.75%) genes from the segmental exchange (SE), and 2 (12.5%) genes from homologous exchange (HE) events. Only 1 tandem duplication (TD) event was identified (BnaZSNRT2.1C-1/BnaZSNRT2.1C-2). Moreover, all the 3 genes from the SE event were from An-subgenome, which replaced the genes on Cn-subgenome in ‘ZS11’. This demonstrated bias retention for genes derived from B. rapa in B. napus after allopolyploidy. Furthermore, 9 (69.23%) of the 13 BnaZSNRT2s derived from allopolyploidy have undergone small-scale duplications in the B. napus genome as well, including 2 genes that experienced two SD events, 5 genes underwent one SD event, and the other 2 genes underwent one HE events, implying that the larger number of BnaZSNRT2s expansion might mainly attribute to allopolyploidy and subsequent SD events in B. napus. Additionally, the sequence similarity and identity of the full-length DNA, CDS, and protein sequences of the 8 duplicated gene pairs in B. napus were very high, and the sequence identities were on average ~85.74%, ~91.49%, and ~94.25%, respectively (Table S5). This indicated that the duplicated genes are functionally redundant.
Taken together, our results proved that ‘ZS11’ showed a higher retention rate than ‘Darmor-bzh’; allopolyploidy and SD events (24/29, ~83%) mainly contributed to the massive expansion of BnaZSNRT2s with these derived from B. rapa were inclined to be reserved in B. napus genome. In the following sections, we will focus on the features of the candidate genes in the native variety ZS11 ecotype.

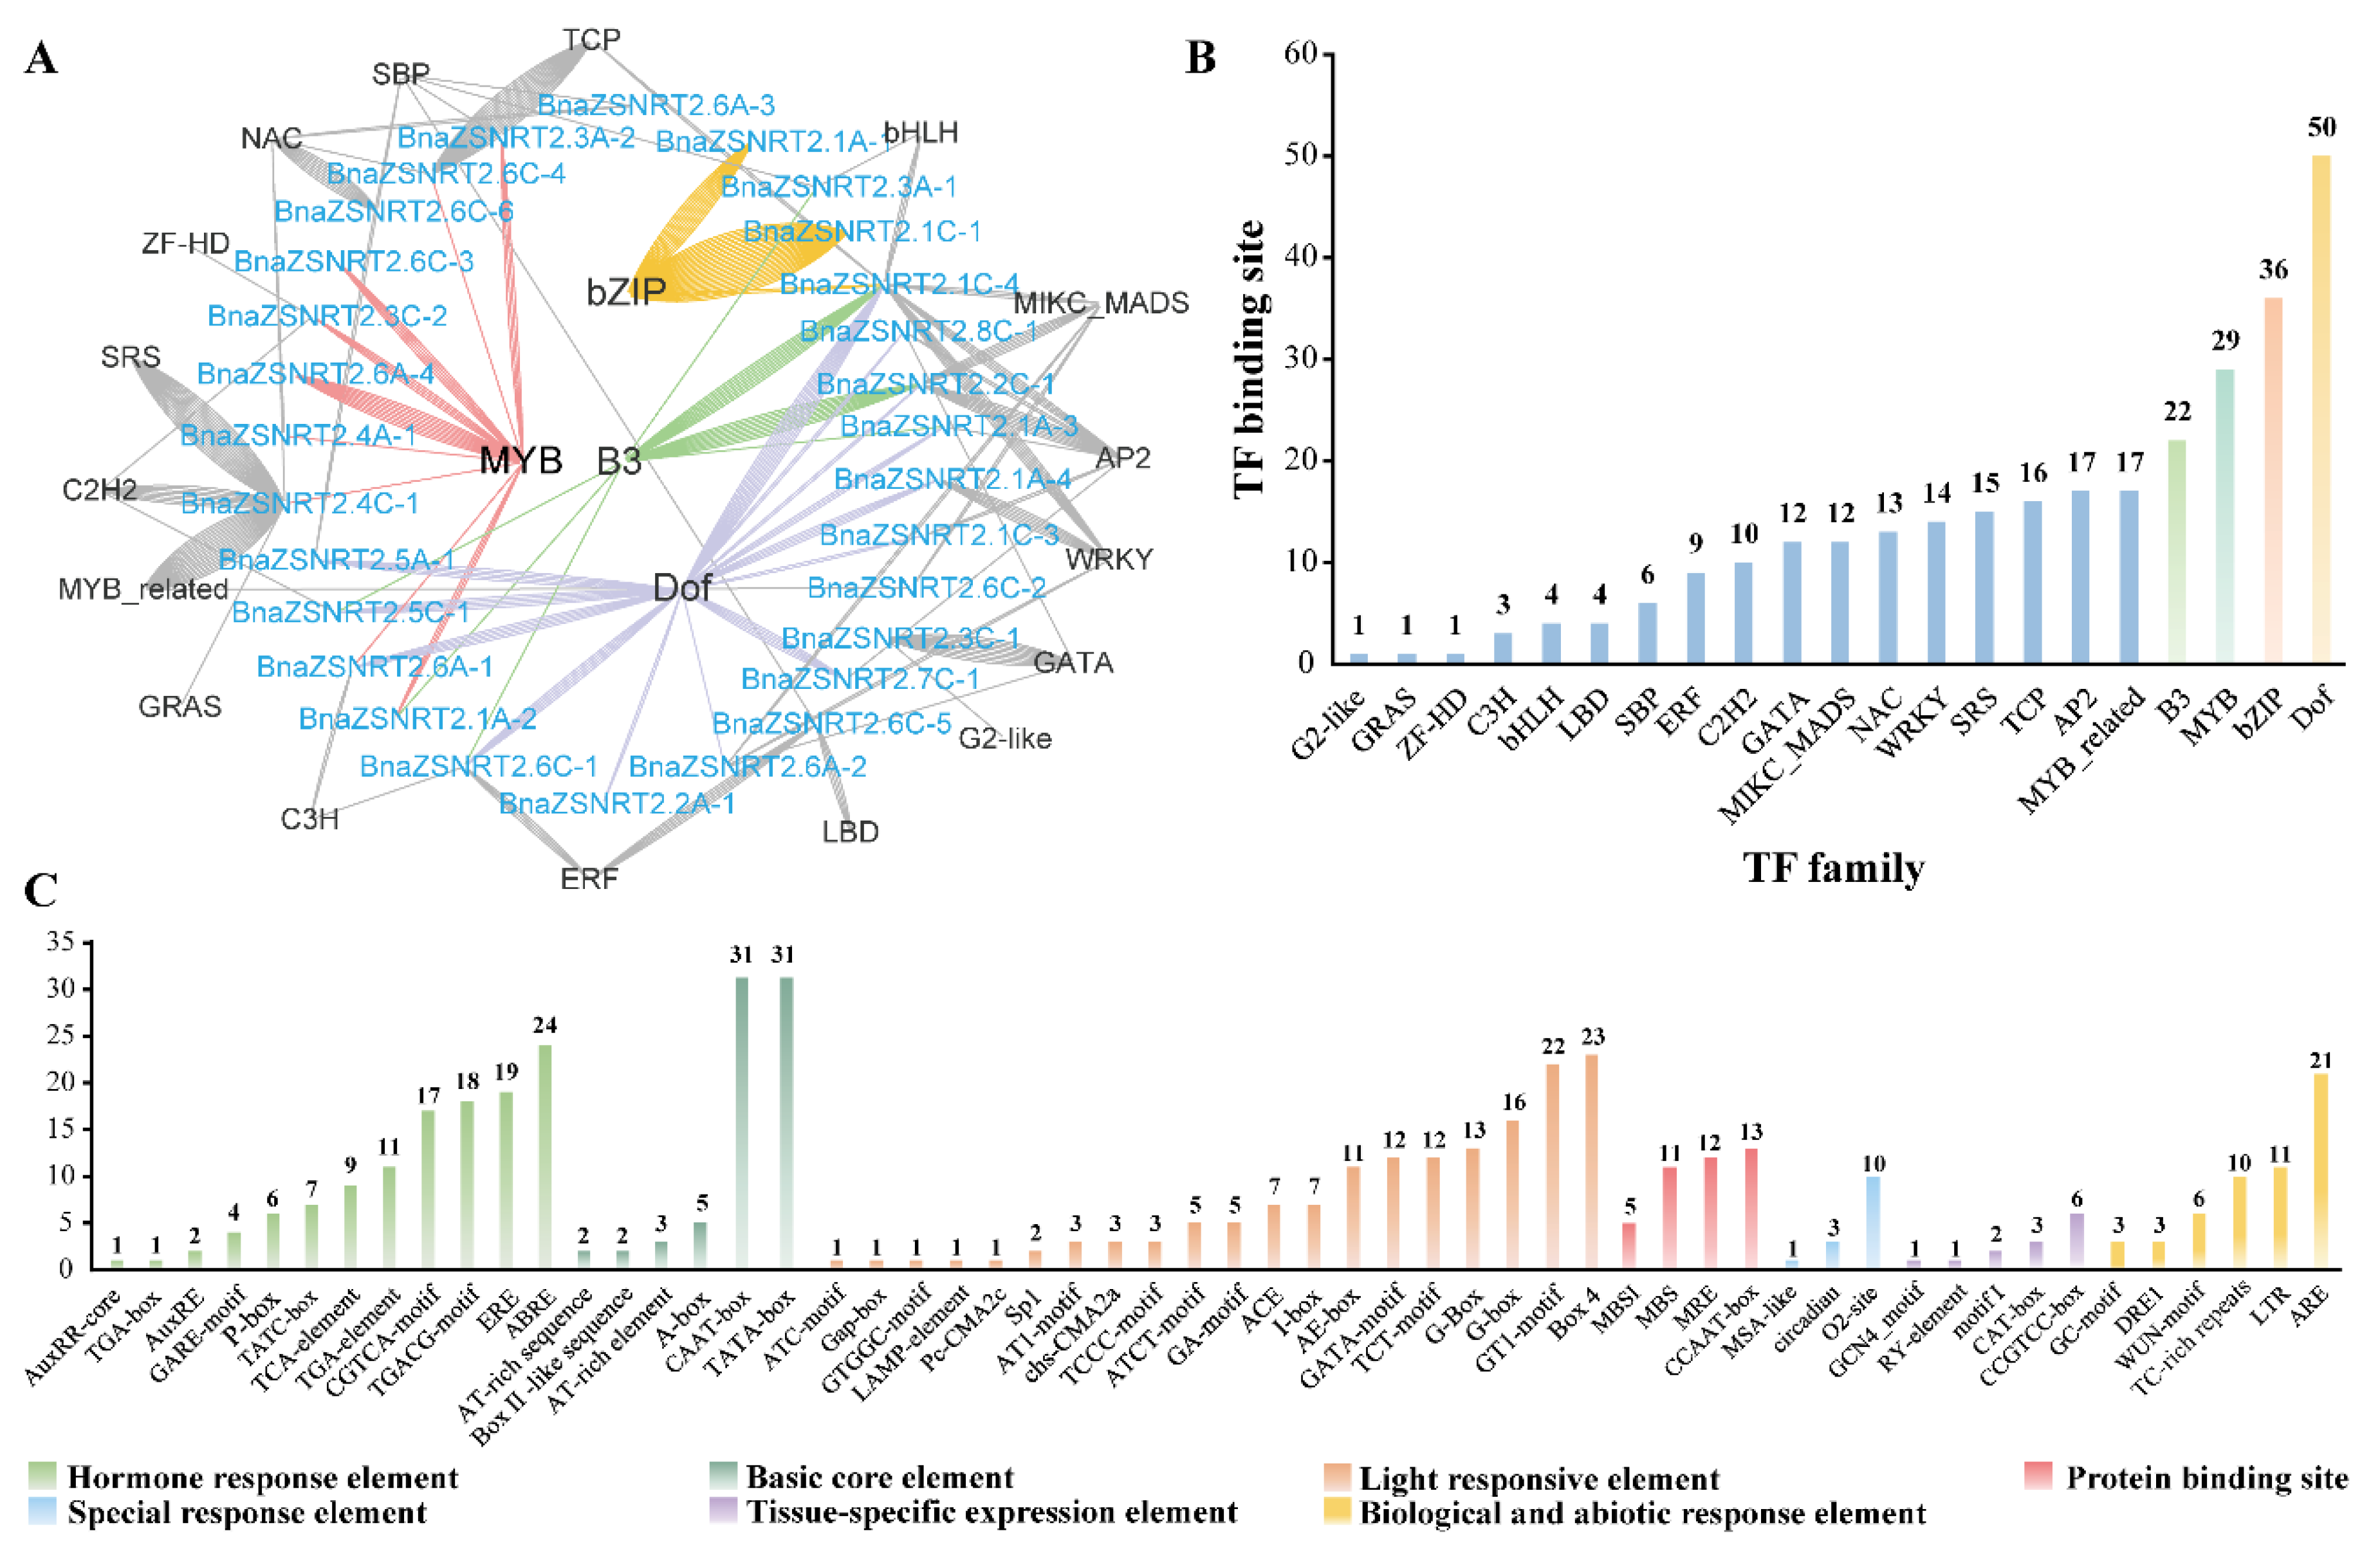
2.4. Potential Regulatory Mechanism in the Promoter Regions of BnaZSNRT2s

The transcription factor (TF) binding sites in the promoter sequences (−1500bp) of the 31 BnaZSNRT2s were predicted by the online PlantTFDB software, and then a regulatory network was generated (Figure 3A). A total of 292 TF binding sites were predicted among 29 BnaZSNRT2s, excepting BnaZSNRT2.7A-1 and BnaZSNRT2.1C-2 (Table S6), which belonged to 21 TF families, with Dof (50 sites), bZIP (36 sites), MYB (29 sites) and B3 (22 sites) families contained most sites (Figure 3B). In Group I, the candidates belong to 21 TF families that might regulate 26 BnaZSNRT2s with 5 TF families may only regulate 1 gene respectively (e.g., G2like, GRAS, SRS), whereas the last 16 TF families (e.g., Dof, MYB, B3) regulate multi-genes respectively. In Group II, B3, Dof, and C2H2 families might regulate BnaZSNRT2.5C-1; SBP and Dof might regulate BnaZSNRT2.5A-1. In Group III, both Dof and AP2 might regulate BnaZSNRT2.7C-1. The complicated regulatory network by TF in Group I might indicate the diverse expression profiles of BnaZSNRT2s.
To understand the potential regulatory mechanism, we subsequently predicted cis-acting elements on the −1500bp upstream promoter regions of the 31 BnaZSNRT2s by PlantCARE online software. A total of 2941 cis-acting elements were found, classified into 56 types (Table S7). Except for the common basic core elements (e.g., A-box, TATA-box) and light-responsive elements (e.g., ACE), the rest were divided into five major groups, including hormone response element, protein binding site, special response element, tissue-specific expression element, and biological and abiotic response elements (Figure 3C). In the hormone response element group, 12 types of cis-elements were predicted, and 35, 24, and 19 BnaZSNRT2s might be involved in MeJA (TGACG-motif, CGTCA-motif), abscisic acid (ABRE), and ethylene (ERE) responsive processes. In the protein binding site group, all types of cis-acting elements were related to MYB binding site. In the special response element group, 10 BnaZSNRT2s might be involved in zein metabolism regulation (O2-site). In the tissue-specific expression element group, 9 BnaZSNRT2s might be related to meristem activation and expression (CCGTCC-box, CAT-box). In the biotic and abiotic-response cis-element group, 21, 11, and 10 BnaZSNRT2s might be involved in anoxia (ARE), low temperature (LTR), and defense and stress (TC-rich repeats) responsive processes. Moreover, we found that the predicted cis-acting elements in each group of the NRT2 gene family were similar in B. napus (Table S7). In Groups II and III, 53% (9/17) and 70% (12/17) of the cis-acting elements existed in all members, respectively (Table S7). In Group I, 31% (17/55) of the cis-acting elements were presented in the majority of candidates (Table S7). These results indicate a complex regulatory network of BnaZSNRT2s responding to multi-factors and a relatively conserved regulation mechanism in each group, especially in Groups II and III.
In conclusion, our results suggested that BnaZSNRT2s may closely respond to plant hormones and abiotic stresses and may be regulated by many TF family members.

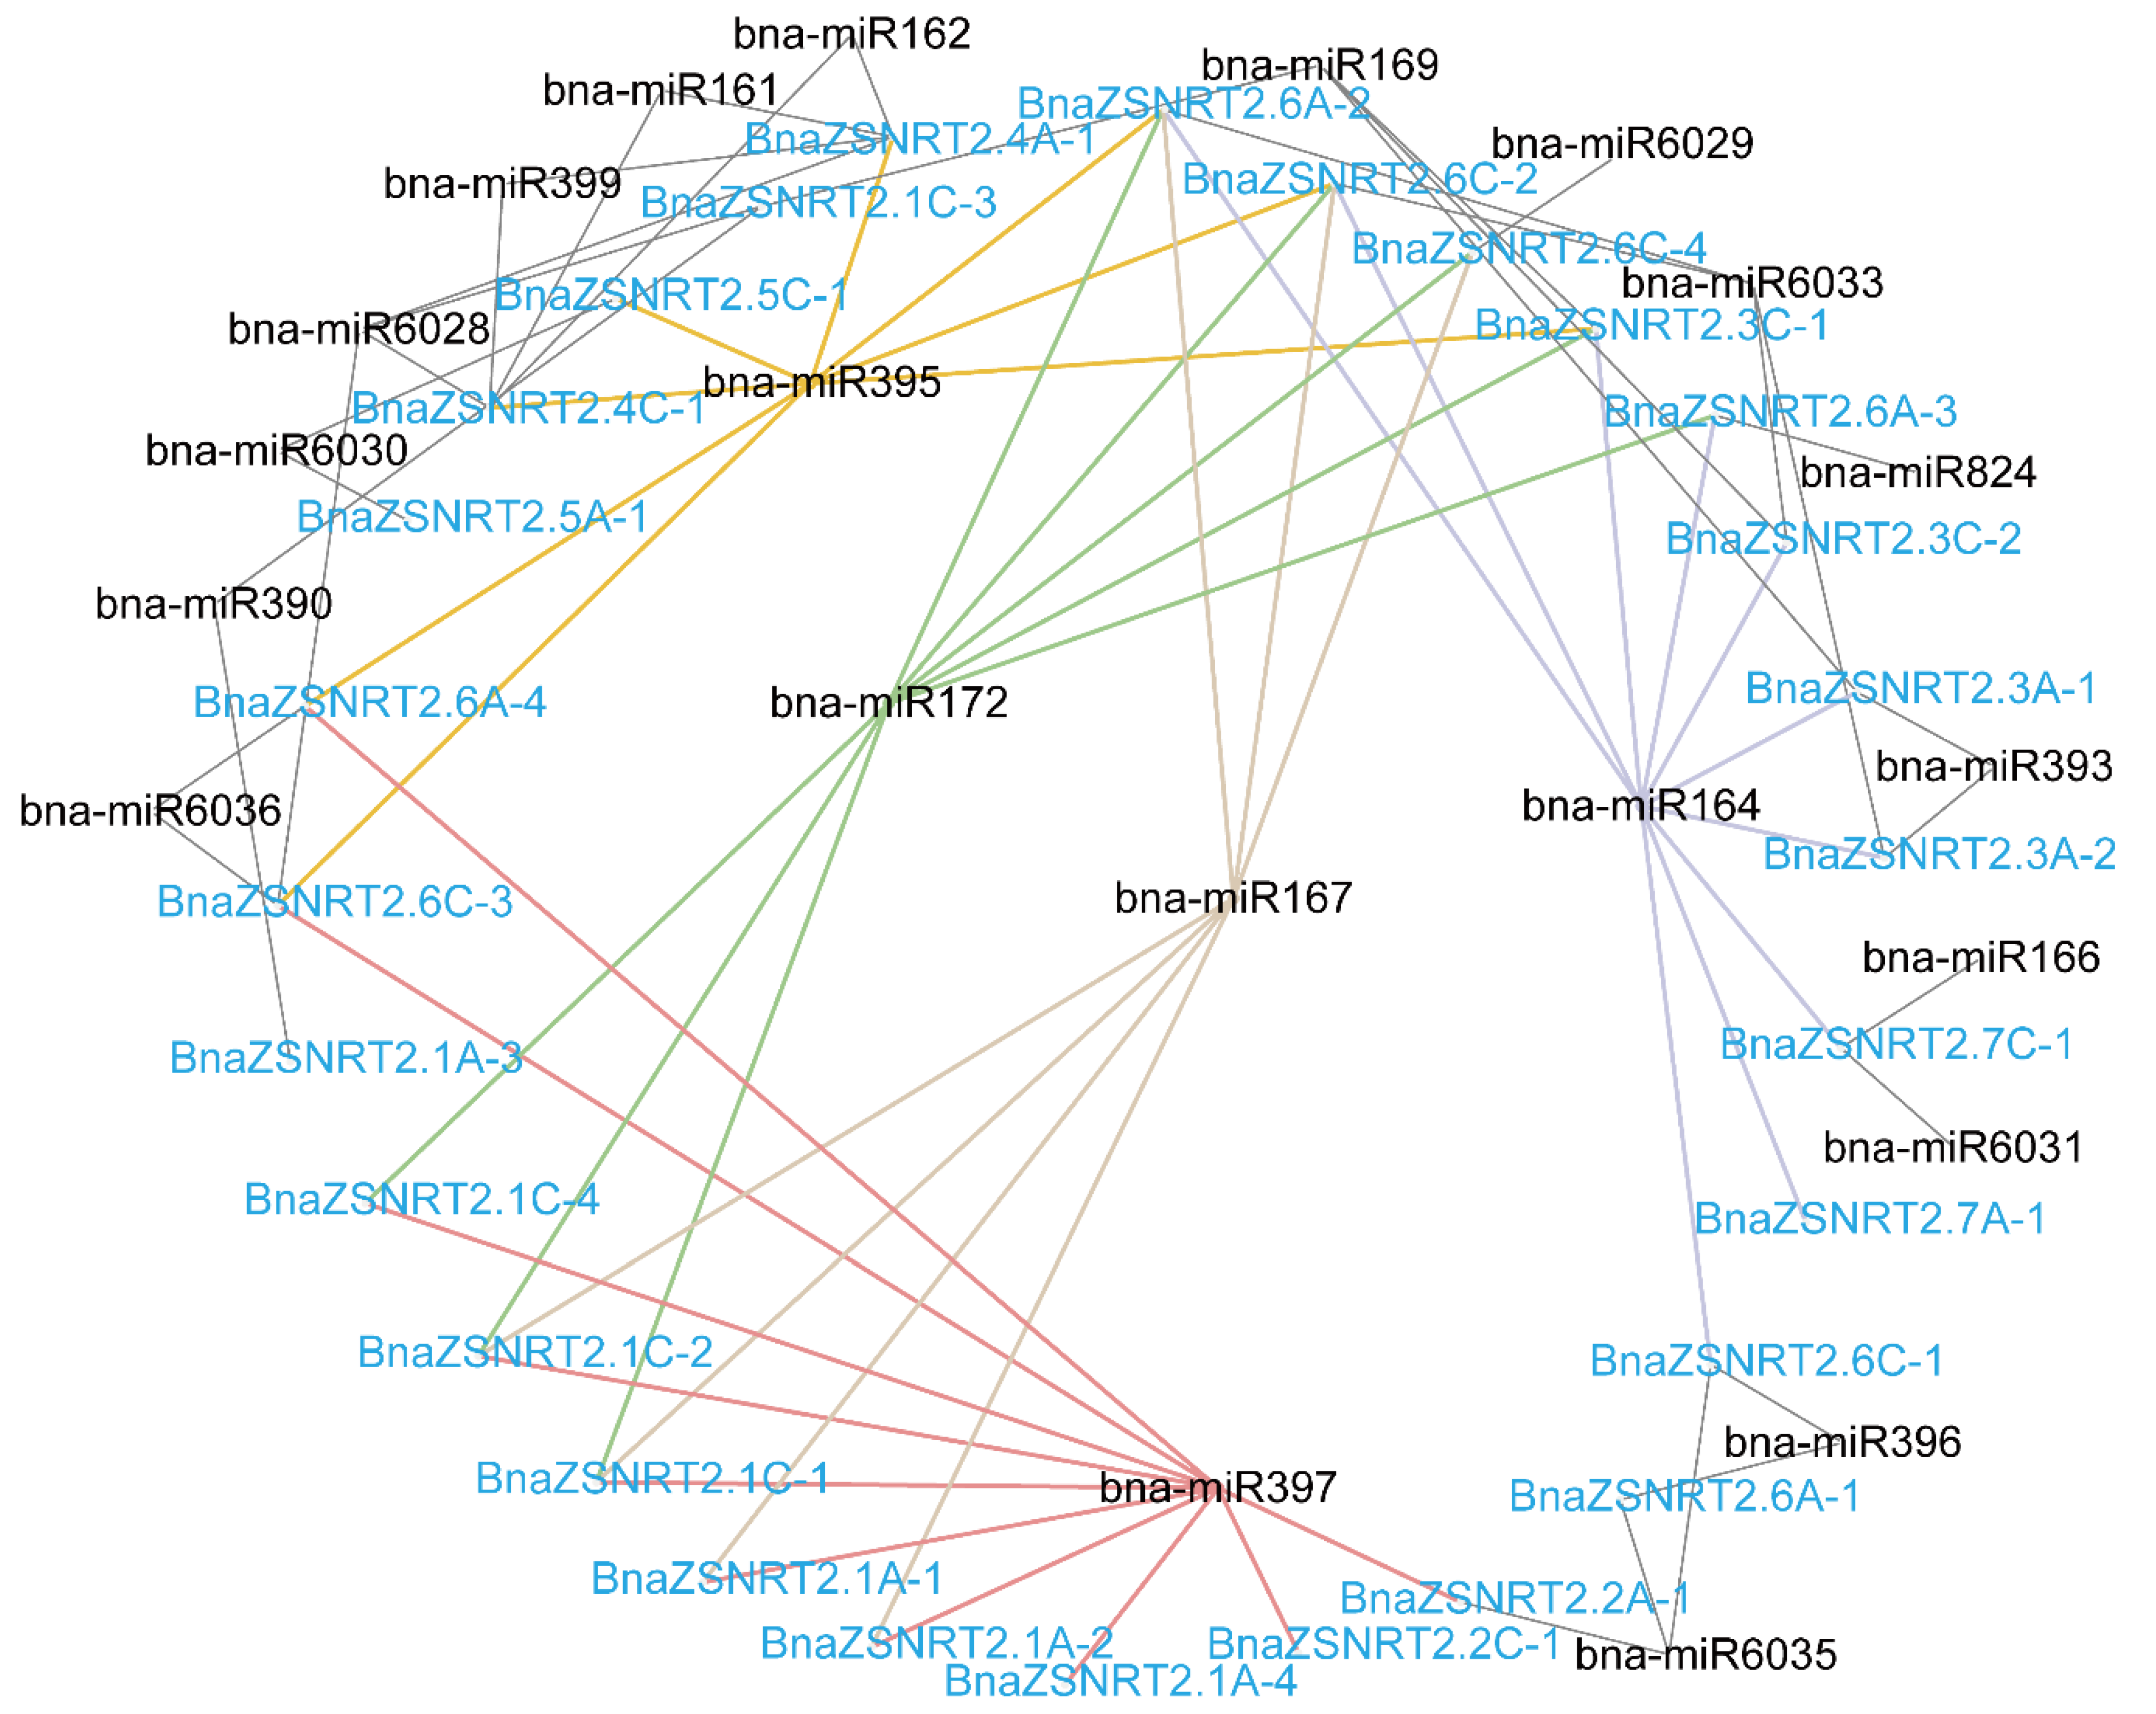
2.5. Potential miRNAs Targets of BnaZSNRT2s

We predicted the potential miRNA targets in the CDS sequences of the candidate 31 BnaZSNRT2s by psRNATarget online software (Table S8, Figure 4). Accordingly, 21 miRNAs were found to have potential targets in 28 BnaZSNRT2s, except for BnaZSNRT2.6C-5, BnaZSNRT2.6C-6, and BnaZSNRT2.8C-1. In Group II, miR6030 might target both BnaZSNRT2.5A-1 and BnaZSNRT2.5C-1; meanwhile, the latter might also be the target of miR395. In Group III, miR164 might target both BnaZSNRT2.7A-1 and BnaZSNRT2.7C-1, and the latter might be the targets of miR166 and miR6031 as well. In Group I, a relatively complex regulation by multi-miRNAs was observed, where 16 BnaZSNRT2s might be targeted by 3 to 5 miRNAs, and miR397, miR164, miR172, miR395, and miR167 might target 10, 8, 8, 7, and 7 BnaZSNRT2s in this group, respectively. Moreover, single miRNA tends to target multiple BnaZSNRT2s in Group I−III, and the type of miRNA regulating each group was relatively conserved, indicating the relatively conserved expression and function in the same group. Additionally, miR164 might target 2 genes in Group III and 8 genes in Group I; miR395 might target 1 gene in Group II and 7 genes in Group I. The regulation of NRT2 homologs by miRNAs in Group I is more complicated than in Group II/III, implicating the diverse expression profile and function of Group I members.

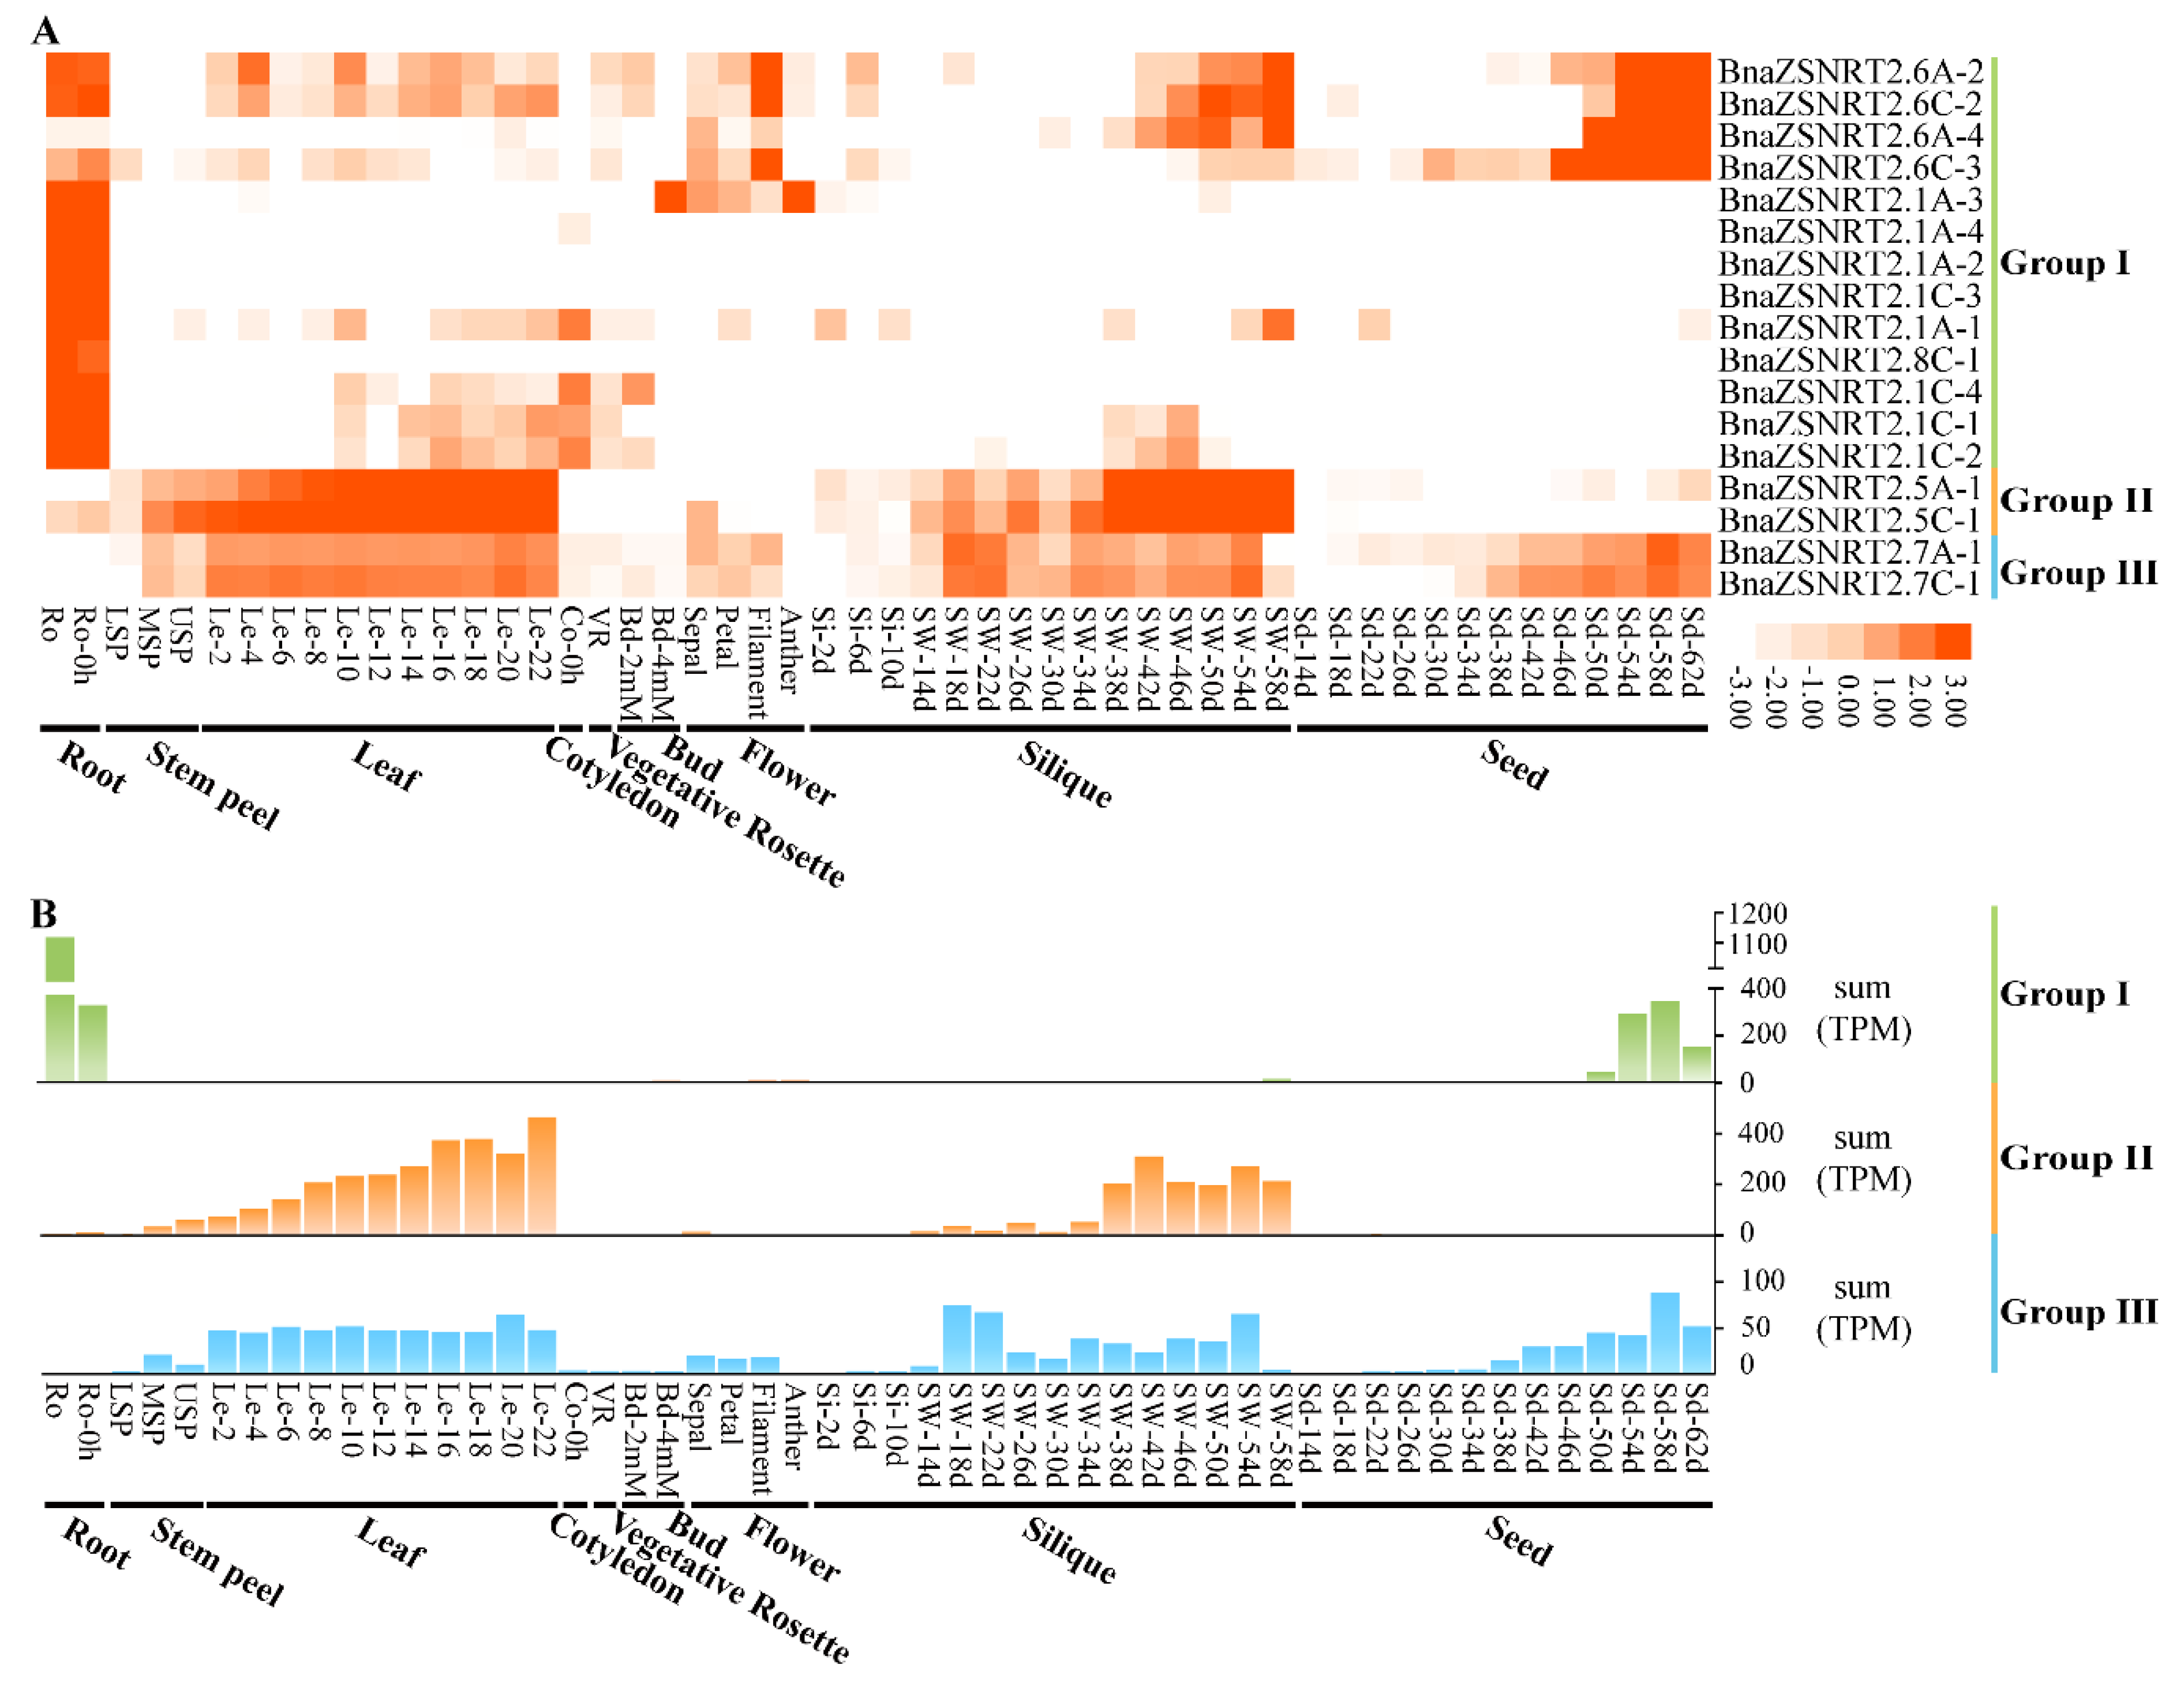
2.6. Spatial-Temporal Expressions of BnaZSNRT2s in Different Developmental Stages of B. napus

To study the expression patterns of BnaZSNRT2s in extensive tissues/organs across distinct developmental stages in B. napus, a public RNA-seq dataset BnTIR (http://yanglab.hzau.edu.cn, accessed on 10 September 2020) including 52 samples was applied. Except for 14 genes with no detectable expression levels (TPM < 1) in all tissues investigated, the remaining 17 genes belonging to Group I−III have obvious preferential expression profiles in ‘ZS11’. The genes in the three groups generally have distinct expression profiles (Figure 5A). In general, the homologs in the same group had conserved expression patterns, implicating their potentially functional conservation and redundancy. In Group I, nearly all of the 13 genes were commonly highly expressed in roots (except BnaZSNRT2.6A-4) and showed uneven expression levels in shoot tissues with 4 genes (BnaZSNRT2.6A-2, BnaZSNRT2.6C-2, BnaZSNRT2.6A-4, and BnaZSNRT2.6C-3) having higher expression levels in the late developmental stages of silique and seed tissues as well. This implicated that the homologs in Group I might perform diverse functions in B. napus. In contrast, the expression profiles were highly conserved in the last two groups. In Group II, the 2 members (BnaZSNRT2.5A-1 and BnaZSNRT2.5C-1) were highly expressed in leaf and silique tissues with a gradually increased in leaf (Figure 5B). Similarly, the 2 members of Group III (BnaZSNRT2.7A-1 and BnaZSNRT2.7C-1) were highly expressed in leaf, silique, and seed tissues, and the expression levels were stable in leaf instead of silique and seed tissues (Figure 5B). The similar expression patterns between Group II and III indicated their close relationship and even similar functions. Given the general biological functions of the organs in the plant, we speculated that members of Group I may be related to the N uptake and transport in roots, while members of Group II and III may involve in N transport, storage, and/or accumulation in B. napus. Additionally, the Pearson correlation coefficient of 6 (75%) sister pairs was ≥0.8 (Table S5), indicating their expression conservation and even functional redundancy.

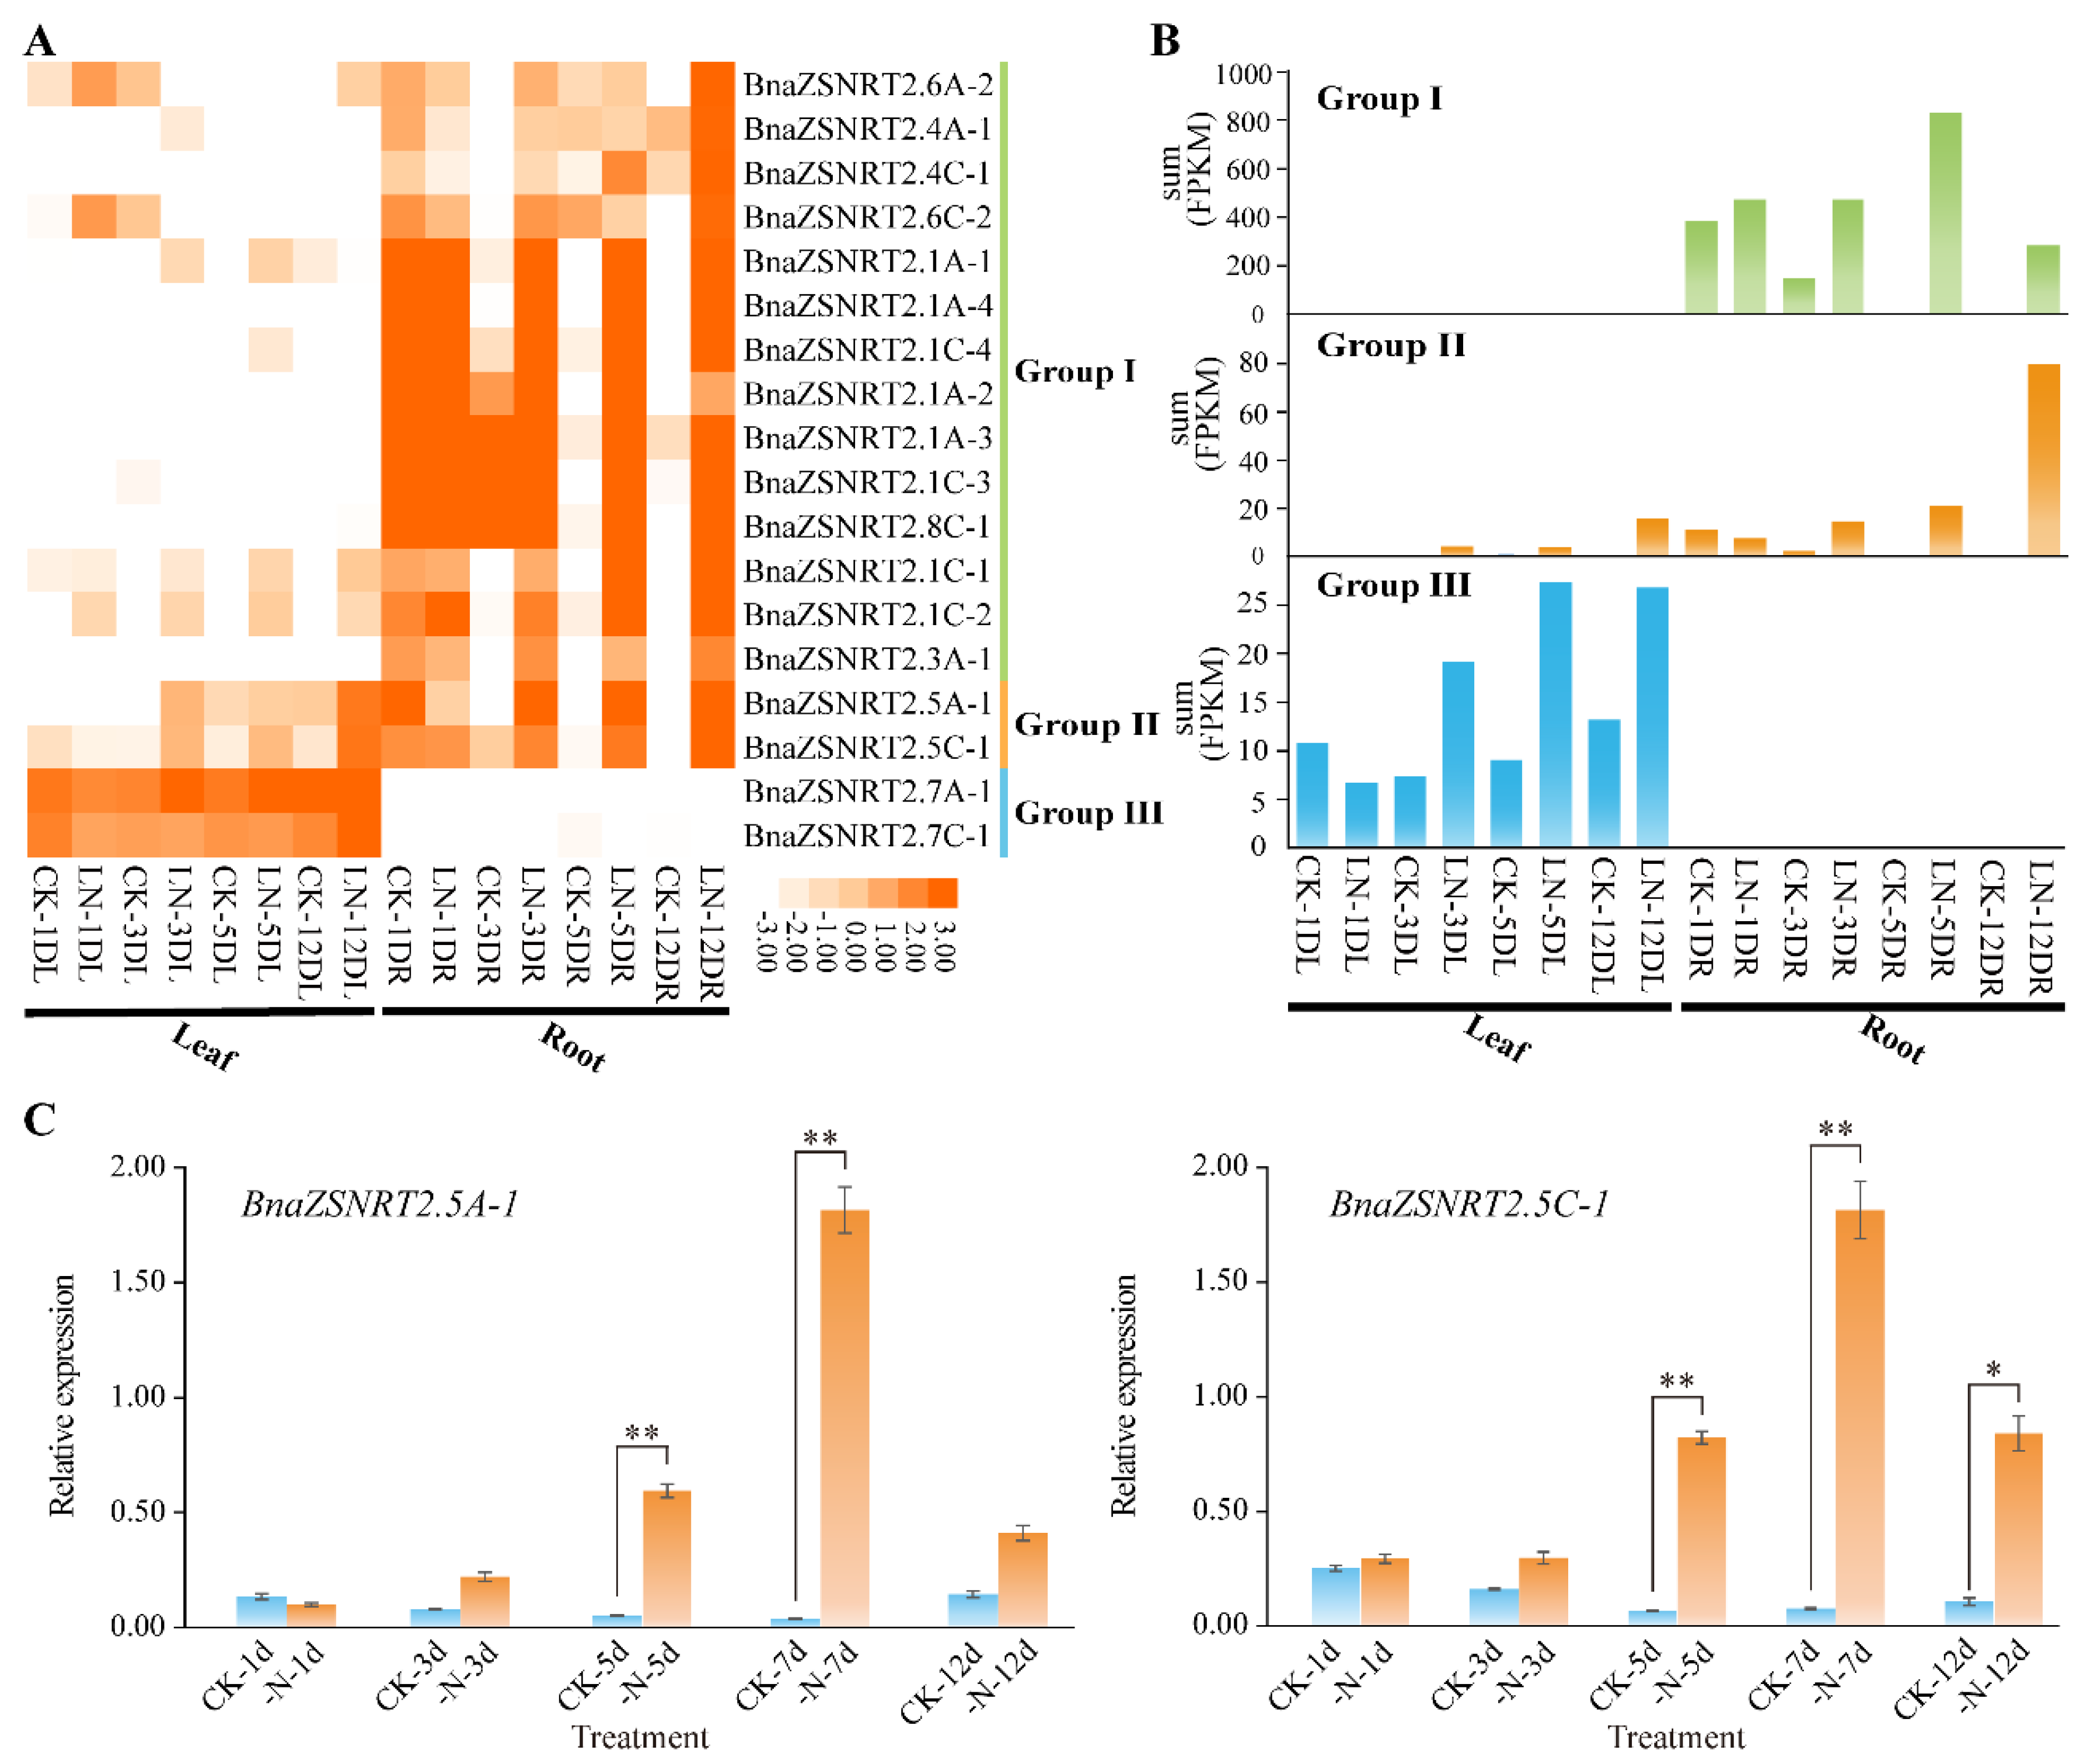
2.7. Expression Profile of BnaZSNRT2s under LN Stress

To discover the potential functions of BnaZSNRT2s in the N utilization process in B. napus, an LN stress RNA-seq dataset (PRJNA612634) was applied in this study. Excepting 13 BnaZSNRT2s that were not expressed (FPKM < 1) in all samples, the last 18 expressed BnaZSNRT2s belong to three groups (Figure 6A). Consistent with the large number, up to 14 members in Group I had detectable transcript accumulation (FPKM ≥ 1) in the dataset, which was preferentially expressed in roots. Their expressions were significantly up-regulated under LN treatment after 3-, 5-, and 12-days (Figure 6B). Moreover, their expression patterns were somewhat different: BnaZSNRT2.6A-2, BnaZSNRT2.4A-1, BnaZSNRT2.6C-2, and BnaZSNRT2.4C-1 were obviously preferentially up-regulated after 12 days LN treatment in roots; BnaZSNRT2.1A-2, BnaZSNRT2.1A-3, BnaZSNRT2.1C-3, and BnaZSNRT2.8C-1 were significantly up-regulated after 5- and 12-days LN treatments; and the rest 6 members were up-regulated after 3-, 5- and 12-days LN treatment. This implicated the expression profile diversification of the homologs in Group I. Consistent with the spatial-temporal expression profile (Figure 5), the genes in Group II (BnaZSNRT2.5A-1 and BnaZSNRT2.5C-1) and III (BnaZSNRT2.7A-1 and BnaZSNRT2.7C-1) had highly conserved expression patterns under LN treatments respectively. The expressions of BnaZSNRT2.7A-1 and BnaZSNRT2.7C-1 in Group III were slightly up-regulated after 3-, 5- and 12-days LN treatment (Figure 6B). Whereas the expression levels of BnaZSNRT2.5A-1 and BnaZSNRT2.5C-1 in Group II were dramatically increased in roots after 12-days of LN treatment. Their expression levels were both peaked in leaf and roots after 12-day LN treatment, showing long-term N deficiency expression profiles. Notably, BnaZSNRT2.5A-1 and BnaZSNRT2.5C-1 showed very low expression levels in normal conditions in roots (Figure 5A), but their expressions were significantly up-regulated in roots under LN stress (Figure 6A), indicating their potential roles in roots in response to LN stress. To confirm the LN-induced expression profiles of BnaZSNRT2.5A-1 and BnaZSNRT2.5C-1 obtained from the RNA-seq dataset, an RT-qPCR assay was further applied. As shown in Figure 6C, the expression profiles of BnaZSNRT2.5A-1 and BnaZSNRT2.5C-1 were similar and were significantly up-regulated after long-term LN treatments, supporting the credibility of RNA-seq analysis. Notably, a peak expression level was observed at 7 days under LN treatment in the RT-qPCR assay, suggesting their expression trend under the LN stress condition.

3. Discussion

3.1. A Conserved Patterns of NRT2s Intron Insertion Patterns and Phylogeny

Numerous studies have indicated that the intron insertion patterns were commonly conserved in each gene family or subfamily in plants [39,40,41]. In this study, we identified 19 BnaDarNRT2s and 31 BnaZSNRT2s in two B. napus ecotypes. A total of 8 intron insertion sites were observed in BnaDarNRT2s, BnaZSNRT2s, and AtNRT2s, with “5” and “6” were nearly absolutely conserved in Group I, “4” and “7” were completely conserved in Group II, and “7” were conserved in Group III (Figure 1C). To our knowledge, this is the first time to focus on the intron insertion patterns of this family in plants. To further confirm our results in Arabidopsis and B. napus, we expand the analyses to 21 plant species, consisting of chlorophyte, bryophyte, basic angiosperm, monocots, and eudicots (Figure 7, Table S9). We found that the intron patterns of this gene family generally tracked with accepted taxonomy across viridiplantae in an evolutionary context. For the 8 intron insertion sites, especially the highly conserved “4”, “5”, “6”, and “7” sites, none were distributed in chlorophyte. The intron “5” was first found in Bryophyte and was conserved in P. patens and S. fallax and investigated. Introns “5”, “6”, and “7” were observed as early as in basic angiosperm A. trichopoda and C. kanehirae; all of the 4 sites were observed in angiosperms while all of the investigated dicots genes had introns, and introns “4”, “5”, “6” and “7” were widely observed. However, only 24.1% (7/29) of monocot genes had introns with 5 genes sharing intron “7”. Notably, intron “4” was only distributed in Brassicaceae, indicating a new origin in this lineage. Overall, the intron insertion sites might be firstly derived after the divergence of chlorophyte and embryophyte, and intron “5” might be an ancestor and widely distributed in embryophyte except for monocots. An obvious bias trend between monocots and dicots was observed according to the divergence of intron sites.
To date, the NRT2 gene family has been identified in numerous plant genomes, such as Brachypodium [42], rice [43], barley [37], M. esculenta [44], and A. thaliana [35]. These studies generally classified this gene family into three groups, namely I−III. To gain insights into the evolutionary mechanisms and sequence features of the NRT2 gene family in the plant kingdom, we further identified the candidates in 22 plant genomes in Phytozome v13 ranging from chlorophyte to angiosperms, including C. reinhardtii, V. carterigenomes, P. patens, S. fallax, A. trichopoda, C. kanehirae, A. coerulea, A. lyrata, A. thaliana, C. papaya, G. max, M. esculenta, M. guttatus, M. truncatula, P. persica, P. trichocarpa, R. communis, B. distachyon, O. sativa, S. bicolor, S. italica and Z. mays. The NRT2s were observed in all of these species, with the number ranging from 2 (A. trichopod and S. fallax) to 16 (M. guttatus) (Table S9). Consistent with previous studies [45,46], based on the systematic identification and phylogenetic analyses, we divided this gene family into five groups, including Group I (homologs of AtNRT2.1AtNRT2.4 and AtNRT2.6), Group II (homologs of AtNRT2.5), Group III (homologs of AtNRT2.7), chlorophyte-specific group (Group IV), and bryophyte-specific group (Group V) (Figure 7). Interestingly, we found that the intron distribution trend was highly consistent with the phylogenetic relationship of this gene family in viridiplantae: the genes with both introns “5” and “6” in angiosperms except monocots were observed in Group I. The genes with both introns “4” and “7” were clustered in Group II, and those with only intron “7” were in Group III. Notably, though the genes in dicots and monocots were commonly clustered into each of the angiosperm-specific groups (I−III), members of these two lineages shared the same intron pattern only in Group III, and the monocot genes in the last two groups were generally intron-less instead. Overall, our analyses indicated that the intron patterns might reflect the phylogeny of NRT2s even in an evolutionary context.

3.2. Expression and Function Characteristics of NRT2s in Plants

In this study, we revealed that the genes in Group I have a wide and less conserved expression pattern in B. napus, most of which were expressed in roots, whereas those in Groups II and III have a higher and conserved expression profile in the acrial part, especially in leaves and siliques (Figure 5). A similar situation was observed in many other eudicots [19,35,36,37,42,44,47,48]. For example, in Group I, many members were expressed abundantly in roots and a few other organs, such as MtNRT2.1 in M. truncatula [47], MeNRT2.1MeNRT2.4 in M. esculenta [44], and AtNRT2.1, AtNRT2.3, AtNRT2.4 and AtNRT2.6 in A. thaliana [35]; In Group II, the genes generally showed strong transcripts in shoot tissues (e.g., stems and leaves) and weak expression levels in roots, such as poplar PtNRT2.5A and PtNRT2.5B [36], M. truncatula MtNRT2.3 [47], and M. esculenta MeNRT2.5 [44]; while members of Group III were specially expressed in shoots, such as PtNRT2.7 [36] and AtNRT2.7 [35]. Notably, the expression profiles of this gene family in monocots are different from that of dicots, especially those of Group II and III that showed higher expression levels in both roots and leaves (e.g., HvNRT2.10 [37], BdNRT2.5 in B. distachyon [42], OsNRT2.3 in rice [48]; BdNRT2.7 [42] and OsNRT2.4 [48]), whereas the expression pattern of Group I was similar to eudicots, such as HvNRT2.2HvNRT2.9 in barley [37] and OsNRT2.1/OsNRT2.2 in rice [48]. Together, the spatial-temporal expression profile of NRT2s in Group I was generally similar between monocots and eudicots, whereas those of Group II and III were distinct.
Consistent with their critical roles in nitrate transporters, the NRT2s generally responded positively to external nitrate or N deficiency in numerous plants. For example, AtNRT2.1/AtNRT2.4/AtNRT2.6, MeNRT2.12.4, HvNRT2.22.9 and OsNRT2.12.2 in Group I, and AtNRT2.5, MeNRT2.5, HvNRT2.1, and OsNRT2.3 in Group II were up-regulated under low nitrate or LN treatment in roots [35,37,43,44]. At the same time, AtNRT2.7 in Group III was intensively induced by limited nitrate supply in shoots [35]. Similarly, we found that the BnaZSNRT2s in Group I and II were significantly up-regulated in roots under LN treatment, whereas these in Group III were positively induced in leaves under LN treatment (Figure 6). Notably, in contrast to the situation in Group I and III, the genes in Group II showed an obvious inverse trend between the spatial-temporal (Figure 5) and LN stress (Figure 6) expression profiles which were up-regulated in roots under LN treatments instead of leaves. Moreover, the LN stress expression profile of this gene family is generally consistent with their known functions in plants. For instance, members of Group I were widely proved to function in roots under nitrate or N starvation, e.g., MeNRT2.2 [44], CmNRT2.1 [49], and AtNRT2.1 [50]. OsNRT2.3a in Group II acted as a long-distance nitrate transport from roots to shoots under low nitrate treatment [51], while members of Group III mainly functioned in seeds, such as wheat TaNRT2.5 [52] and AtNRT2.7 [24]. These results suggested a spatial-temporal collaborative role of this gene family in the root and shoot tissues in N utilization in plants.

4. Materials and Methods

4.1. Identification of NRT2 Genes in Plants

The AtNRT2s were acquired from the TAIR database (http://www.arabidopsis.org, accessed on 11 July 2019). To identify the NRT2s in the B. napus genome, BLASTP and Tblastn searches were performed in GENOSCOPE (http://www.genoscope.cns.fr/brassicanapus/, accessed on 19 August 2014) and BnPIR (http://cbi.hzau.edu.cn/bnapus/, accessed on 10 September 2020) databases respectively, using the AtNRT2s as the queries with a low-stringency criterion (cutoff p < 0.1). After deleting the redundant sequences, the remainders were confirmed by HMMER (https://www.ebi.ac.uk/Tools/hmmer/, accessed on 19 November 2021) and SMART (http://smart.embl-heidelberg.de/, accessed on 26 October 2020) tools to ensure they had the characteristic domains of the NRT2 family. DNA, cDNA, and encoding protein sequences of the candidate genes were acquired from the GENOSCOPE and BnPIR database. We also identified the NRT2s in C. reinhardtii, V. carterigenomes, P. patens, S. fallax, A. trichopoda, C. kanehirae, B. rapa, B. oleracea, A. coerulea, A. lyrata, C. papaya, G. max, M. esculenta, M. guttatus, M. truncatula, P. persica, P. trichocarpa, R. communis, B. distachyon, O. sativa, S. bicolor, S. italica and Z. mays from Phytozome v13 database (https://phytozome-next.jgi.doe.gov/, accessed on 22 November 2011) [53] by the same method. The physicochemical properties and subcellular localization analyses of candidates were predicted by ExPASy online tool (http://www.expasy.org/tools/, accessed on 23 February 2022) [54] and by Cell-PLoc-2 (http://www.csbio.sjtu.edu.cn/bioinf/Cell-PLoc-2/, accessed on 28 June 2010) and WoLF PSORT (https://www.genscript.com/wolf-psort.html, accessed on 21 May 2007), respectively.

4.2. Phylogenetic and Sequence Structure Analysis of B. napus NRT2 Gene Family

To discover the evolutionary relationship of the NRT2 family in B. napus and Arabidopsis, the protein sequences of candidates in B. napus (BnaDarNRT2s and BnaZSNRT2s) and Arabidopsis (AtNRT2s) were applied to perform a multiple sequence alignment analyses by MAFFT version 7 tool with default parameters (https://mafft.cbrc.jp/alignment/server/, accessed on 06 September 2017). Based on multiple sequence alignment analyses, a phylogenetic tree was generated by MEGA version 7 [55] using the NJ method with the following major parameters: Poisson correction, bootstrap with 1000 replicates, and pairwise deletion. The sequence structures of BnaDarNRT2s, BnaZSNRT2s, and AtNRT2s were analyzed by a Gene Structure Display Server (GSDS) 2.0 (http://gsds.cbi.pku.edu.cn/, accessed on 10 December 2014) [56], using the cDNA and protein sequences of candidates. The domains and TM regions of BnaDarNRT2s, BnaZSNRT2s, and AtNRT2s were predicted by the HMMER tool (https://www.ebi.ac.uk/Tools/hmmer/, accessed on 19 November 2021), and then were visualized by Weblogo online software (http://weblogo.threeplusone.com/, accessed on 06 June 2004). The intron insertion sites and phases of the candidates were obtained by comparing the DNA and cDNA sequences of each gene manually using MEGA version 7.

4.3. Chromosomal Location and Collinearity Relationship of BnaZSNRT2s

The chromosome location information of candidate BnaZSNRT2s was acquired from the BnPIR database. The chromosome map of candidates was drawn by MapChart v2.32 software. The collinearity relationship of BnaZSNRT2s, BrNRT2s, BoNRT2s, and AtNRT2s was calculated by the CoGe online tool (https://genomevolution.org/coge/, accessed on 04 February 2008). The duplication events of BnaZSNRT2s were identified in the previous study [57].

4.4. The Potential Regulatory Mechanism in the Promoter Regions of BnaZSNRT2s

The −1500 bp upstream promoter sequence of BnaZSNRT2s was used to predict the potential TFs regulation information by the PlantTFDB database (http://planttfdb.gao-lab.org/, accessed on 24 October 2016) with a threshold p-value < 10−6. The potential cis-elements in the promoter regions of BnaZSNRT2s (−1500 bp upstream sequence) were predicted by PlantCARE online software (http://bioinformatics.psb.ugent.be/webtools/plantcare/html/, accessed on 11 September 2000). The regulation network of BnaZSNRT2s was generated by Cytoscape 3.8.2 software [58]. The potential miRNAs regulating sites of BnaZSNRT2s were analyzed by the psRNATarget website (expectation ≤ 6) (http://plantgrn.noble.org/psRNATarget/, accessed on 30 April 2018).

4.5. Spatial-Temporal and LN Stress Expression Profile Analysis of BnaZSNRT2s by RNA-Seq Data

To explore the temporal-spatial expression patterns of BnaZSNRT2s at different developmental stages in B. napus, the RNA-Seq dataset in BnTIR (http://yanglab.hzau.edu.cn/, accessed on 10 September 2020) was obtained. The heatmap was generated by Cluster 3.0 [59] and Java Treeview software [60] according to log2-transformed data. The genes with FPKM < 1 were speculated to be pseudogenes or specifically expressed genes under other conditions, and thus were not included in the heatmap in this study. Similarly, to explore the LN-inductive expression patterns of BnaZSNRT2s, an LN stress RNA-Seq dataset of ‘ZS11’ ecotype seedling roots and leave was acquired from NCBI (BioProject: PRJNA612634). The heatmap was generated by Cluster 3.0 [59] and Java Treeview software [60] based on the log2-transformed data of candidates.

4.6. RT-qPCR Analysis of BnaZSNRT2s under LN Conditions

Seeds of ZS11 were acquired from the College of Agriculture and Biotechnology, Southwest University. The treatments of the seeds and seedlings referred to a previous study [61]. The normal nutrient solution comprised of 0.5 mM K2SO4, 0.25 mM KH2PO4, 325 µM MgSO4, 50 µM NaCl, 8 µM H3BO3, 0.4 µM MnSO4, 0.4 µM ZnSO4, 0.4 µM CuSO4, 0.1 µM Na2MoO4, 40 µM Fe-EDDHA, 10 µM C2H4N4, 1.8 mM Ca(NO3)2 and 0.2 µM (NH4)2SO4 (control, CK). For the LN treatment, 1.8 mM Ca(NO3)2 and 0.2 mM (NH4)2SO4 were replaced by 0.09 mM Ca(NO3)2 and 0.001 mM (NH4)2SO4 [62]. The pH of the solution was 5.8. The root tissues were reaped at 1, 3, 5, 7, and 12 days after the treatments, which were promptly frozen in liquid nitrogen, and then stored at −80 °C for the purpose of RNA isolation. The RT-qPCR analysis method referred to our previous study [61], using the GoScriptTM Reverse Transcription Mix, Oligo(dT) kit (Promega, Beijing, China), and Taq Pro Universal SYBR qPCR Master Mix (Vazyme, Nanjing, China). The primers were designed by Primer Premier 5 software, and the primer sequences were presented in Table S10. Ultimately, we acquired the data (mean ± standard deviation) of all three independent repeated trials and calculated the relative expression of BnaZSNRT2s by the 2(−∆∆Ct) method. Standard errors were presented by Error bars from three independent repeated trials. Expression level Differences of BnaZSNRT2s were assessed by a One-way ANOVA test (* p < 0.05; ** p < 0.01) using Excel 2016.

Supplementary Materials

The following supporting information can be downloaded at: https://www.mdpi.com/article/10.3390/ijms23094965/s1.

Author Contributions

Conceptualization, H.D.; methodology, R.-J.D.; software, Z.-X.W.; validation, Z.-X.Y., and P.-F.L.; formal analysis, J.-Y.M.; investigation, J.Z.; writing—original draft preparation, H.D. and R.-J.D.; writing—review and editing, H.D.; supervision, H.D.; project administration, J.-N.L.; funding acquisition, H.D. All authors have read and agreed to the published version of the manuscript.

Funding

This work was supported by the National Key Research and Development Program of China (2018YFD1000900).

Institutional Review Board Statement

The study did not require ethical approval.

Informed Consent Statement

The study did not involve humans.

Data Availability Statement

The study did not report any data.

Conflicts of Interest

The authors declare no conflict of interest.

References

  1. Evans, J.R.; Clarke, V.C. The nitrogen cost of photosynthesis. J. Exp. Bot. 2019, 70, 7–15. [Google Scholar] [CrossRef] [PubMed]
  2. Frink, C.R.; Waggoner, P.E.; Ausubel, J.H. Nitrogen fertilizer: Retrospect and prospect. Proc. Natl. Acad. Sci. USA 1999, 96, 1175–1180. [Google Scholar] [CrossRef] [PubMed] [Green Version]
  3. Zhao, X.Q.; Shen, R.F. Aluminum-Nitrogen Interactions in the Soil-Plant System. Front. Plant. Sci. 2018, 9, 807. [Google Scholar] [CrossRef] [PubMed] [Green Version]
  4. Vitousek, P.M.; Howarth, R.W. Nitrogen limitation on land and in the sea: How can it occur? Biogeochemistry 1991, 13, 87–115. [Google Scholar] [CrossRef]
  5. Alvarez, J.M.; Vidal, E.A.; Gutierrez, R.A. Integration of local and systemic signaling pathways for plant N responses. Curr. Opin. Plant Biol. 2012, 15, 185–191. [Google Scholar] [CrossRef]
  6. Wang, Y.Y.; Cheng, Y.H.; Chen, K.E.; Tsay, Y.F. Nitrate Transport, Signaling, and Use Efficiency. Annu. Rev. Plant. Biol. 2018, 69, 85–122. [Google Scholar] [CrossRef]
  7. Robertson, G.P.; Vitousek, P.M. Nitrogen in Agriculture: Balancing the Cost of an Essential Resource. Annu. Rev. Environ. Resour. 2009, 34, 97–125. [Google Scholar] [CrossRef] [Green Version]
  8. Gutiérrez, R.A. Systems biology for enhanced plant nitrogen nutrition. Science 2012, 336, 1673–1675. [Google Scholar] [CrossRef]
  9. Fixen, P.E.; West, F.B. Nitrogen fertilizers: Meeting contemporary challenges. Ambio 2002, 31, 169–176. [Google Scholar] [CrossRef]
  10. Ju, X.T.; Xing, G.X.; Chen, X.P.; Zhang, S.L.; Zhang, L.J.; Liu, X.J.; Cui, Z.L.; Yin, B.; Christie, P.; Zhu, Z.L.; et al. Reducing environmental risk by improving N management in intensive Chinese agricultural systems. Proc. Natl. Acad. Sci. USA 2009, 106, 3041–3046. [Google Scholar] [CrossRef] [Green Version]
  11. Khan, F.A.; Ansari, A.A. Eutrophication: An Ecological Vision. Bot. Rev. 2005, 71, 449–482. [Google Scholar] [CrossRef]
  12. Yang, X.E.; Wu, X.; Hao, H.L.; He, Z.L. Mechanisms and assessment of water eutrophication. J. Zhejiang Univ. Sci. B 2008, 9, 197–209. [Google Scholar] [CrossRef] [PubMed]
  13. Sieling, K.; Kage, H. Apparent fertilizer N recovery and the relationship between grain yield and grain protein concentration of different winter wheat varieties in a long-term field trial. Eur. J. Agron. 2021, 124, 126246. [Google Scholar] [CrossRef]
  14. Dimkpa, C.O.; Fugice, J.; Singh, U.; Lewis, T.D. Development of fertilizers for enhanced nitrogen use efficiency—Trends and perspectives. Sci. Total Environ. 2020, 731, 139113. [Google Scholar] [CrossRef] [PubMed]
  15. Liu, J.; Diamond, J. China’s environment in a globalizing world. Nature 2005, 435, 1179–1186. [Google Scholar] [CrossRef] [PubMed]
  16. Yan, N. Structural Biology of the Major Facilitator Superfamily Transporters. Annu. Rev. Biophys. 2015, 44, 257–283. [Google Scholar] [CrossRef] [PubMed]
  17. Galvan, A.; Fernández, E. Eukaryotic nitrate and nitrite transporters. Cell. Mol. Life Sci. 2001, 58, 225–233. [Google Scholar] [CrossRef]
  18. Tong, J.; Walk, T.C.; Han, P.; Chen, L.; Shen, X.; Li, Y.; Gu, C.; Xie, L.; Hu, X.; Liao, X.; et al. Genome-wide identification and analysis of high-affinity nitrate transporter 2 (NRT2) family genes in rapeseed (Brassica napus L.) and their responses to various stresses. BMC Plant Biol. 2020, 20, 464. [Google Scholar] [CrossRef]
  19. Castro-Rodríguez, V.; Cañas, R.A.; de la Torre, F.N.; Pascual, M.B.; Avila, C.; Cánovas, F.M. Molecular fundamentals of nitrogen uptake and transport in trees. J. Exp. Bot. 2017, 68, 2489–2500. [Google Scholar] [CrossRef]
  20. Guan, M.; Chen, M.; Cao, Z. NRT2.1, a major contributor to cadmium uptake controlled by high-affinity nitrate transporters. Ecotoxicol. Environ. Saf. 2021, 218, 112269. [Google Scholar] [CrossRef]
  21. Kiba, T.; Feria-Bourrellier, A.B.; Lafouge, F.; Lezhneva, L.; Boutet-Mercey, S.; Orsel, M.; Brehaut, V.; Miller, A.; Daniel-Vedele, F.; Sakakibara, H.; et al. The Arabidopsis nitrate transporter NRT2.4 plays a double role in roots and shoots of nitrogen-starved plants. Plant Cell 2012, 24, 245–258. [Google Scholar] [CrossRef] [PubMed] [Green Version]
  22. Dechorgnat, J.; Patrit, O.; Krapp, A.; Fagard, M.; Daniel-Vedele, F. Characterization of the Nrt2.6 gene in Arabidopsis thaliana: A link with plant response to biotic and abiotic stress. PLoS ONE 2012, 7, e42491. [Google Scholar] [CrossRef] [PubMed] [Green Version]
  23. Lezhneva, L.; Kiba, T.; Feria-Bourrellier, A.B.; Lafouge, F.; Boutet-Mercey, S.; Zoufan, P.; Sakakibara, H.; Daniel-Vedele, F.; Krapp, A. The Arabidopsis nitrate transporter NRT2.5 plays a role in nitrate acquisition and remobilization in nitrogen-starved plants. Plant J. 2014, 80, 230–241. [Google Scholar] [CrossRef] [PubMed]
  24. Chopin, F.; Orsel, M.; Dorbe, M.F.; Chardon, F.; Truong, H.N.; Miller, A.J.; Krapp, A.; Daniel-Vedele, F. The Arabidopsis ATNRT2.7 nitrate transporter controls nitrate content in seeds. Plant Cell 2007, 19, 1590–1602. [Google Scholar] [CrossRef] [PubMed] [Green Version]
  25. Kotur, Z.; Mackenzie, N.; Ramesh, S.; Tyerman, S.D.; Kaiser, B.N.; Glass, A.D.M. Nitrate transport capacity of the Arabidopsis thaliana NRT2 family members and their interactions with AtNAR2.1. New Phytol. 2012, 194, 724–731. [Google Scholar] [CrossRef]
  26. Chen, J.; Liu, X.; Liu, S.; Fan, X.; Zhao, L.; Song, M.; Fan, X.; Xu, G. Co-Overexpression of OsNAR2.1 and OsNRT2.3a Increased Agronomic Nitrogen Use Efficiency in Transgenic Rice Plants. Front. Plant Sci. 2020, 11, 1245. [Google Scholar] [CrossRef]
  27. Liu, R.; Jia, T.; Cui, B.; Song, J. The expression patterns and putative function of nitrate transporter 2.5 in plants. Plant Signal. Behav. 2020, 15, 1815980. [Google Scholar] [CrossRef]
  28. Lupini, A.; Mercati, F.; Araniti, F.; Miller, A.J.; Sunseri, F.; Abenavoli, M.R. NAR2.1/NRT2.1 functional interaction with NO3(-) and H(+) fluxes in high-affinity nitrate transport in maize root regions. Plant Physiol. Biochem. 2016, 102, 107–114. [Google Scholar] [CrossRef]
  29. Song, J.M.; Guan, Z.; Hu, J.; Guo, C.; Yang, Z.; Wang, S.; Liu, D.; Wang, B.; Lu, S.; Zhou, R.; et al. Eight high-quality genomes reveal pan-genome architecture and ecotype differentiation of Brassica napus. Nat. Plants 2020, 6, 34–45. [Google Scholar] [CrossRef]
  30. Chalhoub, B.; Denoeud, F.; Liu, S.; Parkin, I.A.; Tang, H.; Wang, X.; Chiquet, J.; Belcram, H.; Tong, C.; Samans, B.; et al. Plant genetics. Early allopolyploid evolution in the post-Neolithic Brassica napus oilseed genome. Science 2014, 345, 950–953. [Google Scholar] [CrossRef] [Green Version]
  31. Stahl, A.; Vollrath, P.; Samans, B.; Frisch, M.; Wittkop, B.; Snowdon, R.J. Effect of breeding on nitrogen use efficiency-associated traits in oilseed rape. J. Exp. Bot. 2019, 70, 1969–1986. [Google Scholar] [CrossRef] [PubMed] [Green Version]
  32. Bouchet, A.S.; Laperche, A.; Bissuel-Belaygue, C.; Baron, C.; Morice, J.; Rousseau-Gueutin, M.; Dheu, J.E.; George, P.; Pinochet, X.; Foubert, T.; et al. Genetic basis of nitrogen use efficiency and yield stability across environments in winter rapeseed. BMC Genet. 2016, 17, 131. [Google Scholar] [CrossRef] [PubMed] [Green Version]
  33. Sorin, C.; Leport, L.; Cambert, M.; Bouchereau, A.; Mariette, F.; Musse, M. Nitrogen deficiency impacts on leaf cell and tissue structure with consequences for senescence associated processes in Brassica napus. Bot. Stud. 2016, 57, 11. [Google Scholar] [CrossRef] [PubMed] [Green Version]
  34. Avice, J.C.; Etienne, P. Leaf senescence and nitrogen remobilization efficiency in oilseed rape (Brassica napus L.). J. Exp. Bot. 2014, 65, 3813–3824. [Google Scholar] [CrossRef]
  35. Orsel, M.; Krapp, A.; Daniel-Vedele, F. Analysis of the NRT2 nitrate transporter family in Arabidopsis. Structure and gene expression. Plant Physiol. 2002, 129, 886–896. [Google Scholar] [CrossRef] [Green Version]
  36. Bai, H.; Euring, D.; Volmer, K.; Janz, D.; Polle, A. The nitrate transporter (NRT) gene family in poplar. PLoS ONE 2013, 8, e72126. [Google Scholar] [CrossRef]
  37. Guo, B.; Li, Y.; Wang, S.; Li, D.; Lv, C.; Xu, R. Characterization of the Nitrate Transporter gene family and functional identification of HvNRT2.1 in barley (Hordeum vulgare L.). PLoS ONE 2020, 15, e0232056. [Google Scholar] [CrossRef]
  38. Cheng, F.; Wu, J.; Wang, X. Genome triplication drove the diversification of Brassica plants. Hortic. Res. 2014, 1, 14024. [Google Scholar] [CrossRef] [Green Version]
  39. Wen, J.; Guo, P.; Ke, Y.; Liu, M.; Li, P.; Wu, Y.; Ran, F.; Wang, M.; Li, J.; Du, H. The auxin response factor gene family in allopolyploid Brassica napus. PLoS ONE 2019, 14, e0214885. [Google Scholar] [CrossRef]
  40. Du, H.; Liang, Z.; Zhao, S.; Nan, M.G.; Tran, L.S.; Lu, K.; Huang, Y.B.; Li, J.N. The Evolutionary History of R2R3-MYB Proteins Across 50 Eukaryotes: New Insights Into Subfamily Classification and Expansion. Sci. Rep. 2015, 5, 11037. [Google Scholar] [CrossRef] [Green Version]
  41. Guo, P.; Wen, J.; Yang, J.; Ke, Y.; Wang, M.; Liu, M.; Ran, F.; Wu, Y.; Li, P.; Li, J.; et al. Genome-wide survey and expression analyses of the GRAS gene family in Brassica napus reveals their roles in root development and stress response. Planta 2019, 250, 1051–1072. [Google Scholar] [CrossRef] [PubMed] [Green Version]
  42. Wang, J.; Hüner, N.; Tian, L. Identification and molecular characterization of the Brachypodium distachyon NRT2 family, with a major role of BdNRT2.1. Physiol. Plant. 2019, 165, 498–510. [Google Scholar] [CrossRef] [PubMed] [Green Version]
  43. Cai, C.; Wang, J.Y.; Zhu, Y.G.; Shen, Q.R.; Li, B.; Tong, Y.P.; Li, Z.S. Gene structure and expression of the high-affinity nitrate transport system in rice roots. J. Integr. Plant Biol. 2008, 50, 443–451. [Google Scholar] [CrossRef] [PubMed]
  44. You, L.; Wang, Y.; Zhang, T.; Zhu, Y.; Ren, N.; Jiang, X.; Zhou, Y. Genome-wide identification of nitrate transporter 2 (NRT2) gene family and functional analysis of MeNRT2.2 in cassava (Manihot esculenta Crantz). Gene 2022, 809, 146038. [Google Scholar] [CrossRef]
  45. Slot, J.C.; Hallstrom, K.N.; Matheny, P.B.; Hibbett, D.S. Diversification of NRT2 and the origin of its fungal homolog. Mol. Biol. Evol. 2007, 24, 1731–1743. [Google Scholar] [CrossRef]
  46. von Wittgenstein, N.J.; Le, C.H.; Hawkins, B.J.; Ehlting, J. Evolutionary classification of ammonium, nitrate, and peptide transporters in land plants. BMC Evol. Biol. 2014, 14, 11. [Google Scholar] [CrossRef] [Green Version]
  47. Pellizzaro, A.; Clochard, T.; Planchet, E.; Limami, A.M.; Morère-Le Paven, M.C. Identification and molecular characterization of Medicago truncatula NRT2 and NAR2 families. Physiol. Plant. 2015, 154, 256–269. [Google Scholar] [CrossRef]
  48. Feng, H.; Yan, M.; Fan, X.; Li, B.; Shen, Q.; Miller, A.J.; Xu, G. Spatial expression and regulation of rice high-affinity nitrate transporters by nitrogen and carbon status. J. Exp. Bot. 2011, 62, 2319–2332. [Google Scholar] [CrossRef] [Green Version]
  49. Gu, C.; Song, A.; Zhang, X.; Wang, H.; Li, T.; Chen, Y.; Jiang, J.; Chen, F.; Chen, S. Cloning of chrysanthemum high-affinity nitrate transporter family (CmNRT2) and characterization of CmNRT2.1. Sci. Rep. 2016, 6, 23462. [Google Scholar] [CrossRef] [Green Version]
  50. Remans, T.; Nacry, P.; Pervent, M.; Girin, T.; Tillard, P.; Lepetit, M.; Gojon, A. A central role for the nitrate transporter NRT2.1 in the integrated morphological and physiological responses of the root system to nitrogen limitation in Arabidopsis. Plant Physiol. 2006, 140, 909–921. [Google Scholar] [CrossRef] [Green Version]
  51. Tang, Z.; Fan, X.; Li, Q.; Feng, H.; Miller, A.J.; Shen, Q.; Xu, G. Knockdown of a rice stelar nitrate transporter alters long-distance translocation but not root influx. Plant Physiol. 2012, 160, 2052–2063. [Google Scholar] [CrossRef] [Green Version]
  52. Li, W.; He, X.; Chen, Y.; Jing, Y.; Shen, C.; Yang, J.; Teng, W.; Zhao, X.; Hu, W.; Hu, M.; et al. A wheat transcription factor positively sets seed vigour by regulating the grain nitrate signal. New Phytol. 2020, 225, 1667–1680. [Google Scholar] [CrossRef] [PubMed]
  53. Goodstein, D.M.; Shu, S.; Howson, R.; Neupane, R.; Hayes, R.D.; Fazo, J.; Mitros, T.; Dirks, W.; Hellsten, U.; Putnam, N.; et al. Phytozome: A comparative platform for green plant genomics. Nucleic Acids Res. 2012, 40, D1178–D1186. [Google Scholar] [CrossRef] [PubMed]
  54. Artimo, P.; Jonnalagedda, M.; Arnold, K.; Baratin, D.; Csardi, G.; de Castro, E.; Duvaud, S.; Flegel, V.; Fortier, A.; Gasteiger, E.; et al. ExPASy: SIB bioinformatics resource portal. Nucleic Acids Res. 2012, 40, W597–W603. [Google Scholar] [CrossRef] [PubMed]
  55. Kumar, S.; Stecher, G.; Tamura, K. MEGA7: Molecular Evolutionary Genetics Analysis Version 7.0 for Bigger Datasets. Mol. Biol. Evol. 2016, 33, 1870–1874. [Google Scholar] [CrossRef] [Green Version]
  56. Hu, B.; Jin, J.; Guo, A.Y.; Zhang, H.; Luo, J.; Gao, G. GSDS 2.0: An upgraded gene feature visualization server. Bioinformatics 2015, 31, 1296–1297. [Google Scholar] [CrossRef] [Green Version]
  57. Li, P.; Wen, J.; Chen, P.; Guo, P.; Ke, Y.; Wang, M.; Liu, M.; Tran, L.P.; Li, J.; Du, H. MYB Superfamily in Brassica napus: Evidence for Hormone-Mediated Expression Profiles, Large Expansion, and Functions in Root Hair Development. Biomolecules 2020, 10, 875. [Google Scholar] [CrossRef]
  58. Shannon, P.; Markiel, A.; Ozier, O.; Baliga, N.S.; Wang, J.T.; Ramage, D.; Amin, N.; Schwikowski, B.; Ideker, T. Cytoscape: A software environment for integrated models of biomolecular interaction networks. Genome Res. 2003, 13, 2498–2504. [Google Scholar] [CrossRef]
  59. de Hoon, M.J.; Imoto, S.; Nolan, J.; Miyano, S. Open source clustering software. Bioinformatics 2004, 20, 1453–1454. [Google Scholar] [CrossRef] [Green Version]
  60. Saldanha, A.J. Java Treeview--extensible visualization of microarray data. Bioinformatics 2004, 20, 3246–3248. [Google Scholar] [CrossRef] [Green Version]
  61. Zhou, J.; Zhou, H.J.; Chen, P.; Zhang, L.L.; Zhu, J.T.; Li, P.F.; Yang, J.; Ke, Y.Z.; Zhou, Y.H.; Li, J.N.; et al. Genome-Wide Survey and Expression Analysis of the KT/HAK/KUP Family in Brassica napus and Its Potential Roles in the Response to K(+) Deficiency. Int. J. Mol. Sci. 2020, 21, 9487. [Google Scholar] [CrossRef] [PubMed]
  62. Liu, K.H.; Huang, C.Y.; Tsay, Y.F. CHL1 is a dual-affinity nitrate transporter of Arabidopsis involved in multiple phases of nitrate uptake. Plant Cell 1999, 11, 865–874. [Google Scholar] [CrossRef] [PubMed]
Figure 1. Phylogenetic tree and sequence structures of the candidate NRT2s in B. napus and Arabidopsis. (A) Neighbor-joining (NJ) phylogenetic tree of NRT2s in B. napus and Arabidopsis. Different background colors represent different groups. (B) Gene structures of NRT2s in B. napus and Arabidopsis. Exons are shown by yellow boxes, transmembrane (TM) domains are shown by blue boxes, and the lines between the colored boxes correspond to the introns. Numbers 0, 1, and 2 represent introns phase 0, 1, and 2, respectively. (C) Intron insertion patterns of NRT2s in B. napus and Arabidopsis. The top numbers (1–8) indicate the orders of the 8 conserved intron sites. The triangles represent different intron insertion sites. Each column (triangle with the same color and number) represents the same intron insertion site and phase. The dashed lines represent the severely missing sequences of candidates.
Ijms 23 04965 g001
Figure 2. Chromosome distribution and duplication of BnaZSNRT2s. (A) 31 BnaZSNRT2s were mapped on 12 chromosomes in B. napus. The genes in orange and blue originated from B. rapa and B. oleracea, respectively; genes in purple were involved in segmental exchange (SE) events; the genes with green frames were tandem duplication (TD) pairs. The black and dashed lines with an arrow represent the duplication direction of genes involved in segmental duplication (SD) and homologous exchange (HE) events, respectively. (B) The big pie chart represents the percentage of BnaZSNRT2s derived from SD, SE, HE, TD, and orthologous region (OR) events, respectively; the left small pie chart represents the percentage of BnaZSNRT2s from OR and then experienced small duplication events in B. napus, and the right small pie chart represents the percentage of BnaZSNRT2s involved in OR events from B. rapa and B. oleracea.
Ijms 23 04965 g002
Figure 3. Transcription factor (TF) binding network and cis-element analysis in the promoter regions of BnaZSNRT2s. (A) The potential TF binding network of the 31 BnaZSNRT2s predicted by the PlantTFDB tool. (B) The TF gene families with potential binding sites in the promoter regions of the BnaZSNRT2s. (C) The cis-elements in the promoter regions of the BnaZSNRT2s. The ordinate represents the number of BnaZSNRT2s.
Ijms 23 04965 g003
Figure 4. The potential miRNA targeting network of the BnaZSNRT2s. A total of 21 miRNAs with black were predicted. BnaZSNRT2s were represented in blue.
Ijms 23 04965 g004
Figure 5. Expression pattern of BnaZSNRT2s in B. napus at different developmental stages. (A) The expression profile of BnaZSNRT2s in 52 tissues. (B) The sum of expression levels in Group I−III. The ordinate represents the sum of expression levels (TPM). “Ro” = root, “LSP” = lower stem peel, “MSP” = middle stem peel, “USP” = upper stem peel, “Le” = leaf, “Co” = cotyledon, “VR” = vegetative rosette, “Bd” = bud, “Si” = silique, “SW” = silique wall, “Sd” = seed; “h,” and “d,” indicate hour and day, respectively.
Ijms 23 04965 g005
Figure 6. Expression pattern of BnaZSNRT2s under low nitrogen (LN) stress treatments. (A) The expression profiles of BnaZSNRT2s in ‘ZS11’ seedling leaf and root tissues under LN stress treatment based on RNA-Seq dataset. “CK” = normal N condition, “LN” = Low N; “D”, “L”, and “R” indicate day, leaf, and root, respectively. (B) The sum of expression levels in each group. The ordinate represents the sum of expression levels (FPKM) corresponding to each tissue investigated. (C) Expression levels of BnaZSNRT2.5A-1 and BnaZSNRT2.5C-1 under LN treatments by RT-qPCR method. The reference genes were BnaActin7 (GenBank accession no. AF024716) and BnaUBI (GenBank accession no. NC027770). Error bars represent the standard deviation of three independent experiments. *: Significant difference (0.05 > p > 0.01); **: Extremely significant difference.
Ijms 23 04965 g006
Figure 7. Phylogenetic analysis of NRT2 gene families in 22 plants. Different groups were colored by a special background. Monocot and eudicot within Groups I–III were divided by dashed lines. The number beside the branch indicates the bootstrap value of each group from 1000 replicates.
Ijms 23 04965 g007
Table 1. Features of the 31 NRT2 genes (BnaZSNRT2s) identified in Brassica napus Zhongshuang 11 (ZS11) ecotype.
Gene NameGenome IDChromosomeProtein Length (aa)CDS Length (bp)DNA Length (bp)pIMolecular Weight (kDa)Subcellular Localization
Predicted by Cell-PLoc2.0Predicted by WoLF PSORT
BnaZSNRT2.6A-1BnaA01G0234100ZSchrA01546164126247.2359.39Cell membraneplasmalemma
BnaZSNRT2.6A-2BnaA01G0234200ZSchrA01541162617218.8058.48Cell membraneplasmalemma
BnaZSNRT2.7A-1BnaA02G0054200ZSchrA02484145515258.1452.06Cell membraneplasmalemma
BnaZSNRT2.3A-1BnaA02G0096600ZSchrA02502150965449.0653.76Cell membraneplasmalemma
BnaZSNRT2.1A-1BnaA06G0047500ZSchrA06530159321639.0757.70Cell membraneplasmalemma
BnaZSNRT2.1A-2BnaA06G0047600ZSchrA06530159318049.0357.73Cell membraneplasmalemma
BnaZSNRT2.6A-3BnaA06G0186600ZSchrA06543163229406.8959.12Cell membraneplasmalemma
BnaZSNRT2.6A-4BnaA06G0186700ZSchrA06538161717209.0458.37Cell membraneplasmalemma
BnaZSNRT2.5A-1BnaA08G0276500ZSchrA08499150017739.0154.17Cell membraneplasmalemma
BnaZSNRT2.1A-3BnaA08G0300800ZSchrA08530159321298.7957.61Cell membraneplasmalemma
BnaZSNRT2.2A-1BnaA09G0667700ZSchrA09506152119839.0254.83Cell membraneplasmalemma
BnaZSNRT2.1A-4BnaA09G0667800ZSchrA09529159018608.9057.34Cell membraneplasmalemma
BnaZSNRT2.4A-1BnaA10G0160100ZSchrA10527158423688.9057.61Cell membraneplasmalemma
BnaZSNRT2.3A-2BnaA10G0160300ZSchrA10536161119649.1458.21Cell membraneplasmalemma
BnaZSNRT2.6C-1BnaC01G0301400ZSchrC01546164126187.6659.40Cell membraneplasmalemma
BnaZSNRT2.6C-2BnaC01G0301600ZSchrC01541162617218.8558.56Cell membraneplasmalemma
BnaZSNRT2.7C-1BnaC02G0063100ZSchrC02502150915797.6153.45Cell membraneplasmalemma
BnaZSNRT2.3C-1BnaC02G0116100ZSchrC02536161121059.0458.06Cell membraneplasmalemma
BnaZSNRT2.6C-3BnaC03G0602800ZSchrC03538161717209.1358.13Cell membraneplasmalemma
BnaZSNRT2.6C-4BnaC03G0603000ZSchrC0315446511099.8617.09Cell membranecytoplasm
BnaZSNRT2.6C-5BnaC03G0603300ZSchrC03162489175826.9117.55Chlo CytoE.R.
BnaZSNRT2.6C-6BnaC03G0603600ZSchrC031845556529.9319.86Cell membranechloroplast
BnaZSNRT2.1C-1BnaC05G0059500ZSchrC05475142818069.0351.83Cell membraneplasmalemma
BnaZSNRT2.1C-2BnaC05G0059600ZSchrC05530159320599.0357.76Cell membraneplasmalemma
BnaZSNRT2.8C-1BnaC08G0033200ZSchrC081133423426.0212.19Cell membranecytoplasm
BnaZSNRT2.1C-3BnaC08G0033300ZSchrC08395118815799.0043.15Cell membranechloroplast
BnaZSNRT2.5C-1BnaC08G0220400ZSchrC08498149717999.1154.13Cell membraneplasmalemma
BnaZSNRT2.2C-1BnaC08G0532700ZSchrC08502150919678.9154.40Cell membraneplasmalemma
BnaZSNRT2.1C-4BnaC08G0532800ZSchrC08529159019158.9557.38Cell membraneplasmalemma
BnaZSNRT2.4C-1BnaC09G0443000ZSchrC09527158443368.9057.52Cell membraneplasmalemma
BnaZSNRT2.3C-2BnaC09G0443100ZSchrC09567170419879.0861.87Cell membraneplasmalemma
Abbreviations: aa, amino acids; CDS, coding sequence; pI, isoelectric point; E.R., endoplasmic reticulum; Chlo, chloroplast; Cyto, Cytoplasm.
Publisher’s Note: MDPI stays neutral with regard to jurisdictional claims in published maps and institutional affiliations.

