Article

Determination of Blood NOTCH3 Extracellular Domain and Jagged-1 Levels in Healthy Subjects

1
Department of Pathology, School of Medicine, Jeju National University, Jeju 63241, Korea
2
Department of Pathology, Jeju National University Hospital, Jeju 62341, Korea
3
Institute for Medical Science, Jeju National University, Jeju 63241, Korea
4
Department of Neulogy, Jeju National University Hospital, Jeju 62341, Korea
5
Department of Neurology, School of Medicine, Jeju National University, Jeju 63241, Korea
*
Author to whom correspondence should be addressed.
Int. J. Mol. Sci. 2022, 23(18), 10547; https://doi.org/10.3390/ijms231810547
Submission received: 29 July 2022 / Revised: 8 September 2022 / Accepted: 8 September 2022 / Published: 11 September 2022
(This article belongs to the Special Issue Notch Signaling in Health and Disease)

Abstract

:
Cerebral autosomal dominant arteriopathy with subcortical infarcts and leukoencephalopathy (CADASIL) is the most common genetic disorder among those responsible for hereditary strokes, and it is caused by a mutation in the NOTCH3 gene on chromosome 19. Blood biomarkers related to the Notch signaling pathway have not been investigated extensively in CADASIL. In this study, we measured the serum and plasma levels of NOTCH3 extracellular domain (N3ECD) and its ligand, Jagged-1, in 279 healthy subjects. The levels of N3ECD and Jagged-1 showed significant correlations in both serum (p < 0.0001, r = 0.2681) and plasma (p < 0.0001, r = 0.4065). The N3ECD levels were significantly higher in the serum than in plasma and tend to increase with age. In contrast, there was no significant difference between the serum and plasma levels of Jagged-1 levels. To summarize, we were able to measure N3ECD and Jagged-1 protein levels in healthy human serum and plasma. Taken together, our findings provide the basis for further studies investigating the clinical use of blood N3ECD and Jagged-1 levels for CADASIL and other Notch signaling-related diseases.

1. Introduction

Notch signaling pathways are evolutionarily conserved intercellular signaling mechanisms involved in vascular development and physiology in vertebrates [1]. There are four Notch receptors and five ligands (Jagged-1, Jagged-2, Delta-like 1, Delta-like 3, Delta-like 4) in humans, and the expression of the receptors and ligands varies among different cell types. In vascular smooth muscle cells (VSMC), the Notch signaling plays a crucial role in the cell differentiation and the response to vascular injury [2,3]. Mutations in the NOTCH3 gene located on the chromosome 19 cause a hereditary stroke disorder known as cerebral autosomal dominant arteriopathy with subcortical infarcts and leukoencephalopathy (CADASIL) [4]. CADASIL is the most common hereditary stroke disorder and mainly affects VSMC in the small blood vessels throughout the body [5,6,7]. In humans, the NOTCH3 gene consists of 33 exons and encodes a single-pass transmembrane receptor of 2321 amino acids. The NOTCH3 receptor consists of a large extracellular domain (ECD) with 34 tandem epidermal growth factor (EGF)-like repeats, three Notch/Lin12 repeats, a transmembrane domain, and an intracellular domain [4]. Under normal conditions, ligand binding leads to a proteolytic cleavage that translocates the intracellular domain to the nucleus while the ECD is endocytosed with the ligand by the ligand-bearing cell [2,8]. Microscopically, CADASIL is characterized by the degeneration of VSMC and accumulation of granular osmiophilic material close to the VSMC [6]. The ligand Jagged-1 is primarily expressed on endothelial cells and VSMC and the loss endothelial Jagged-1 caused an impaired VSMC differentiation [9,10,11].
Brain magnetic resonance imaging is widely used for the differential diagnosis, assessment of the severity of illness, and predicting patients’ outcome in CADASIL [12,13,14]. However, it is costly for repetitive examination and is time-consuming for quantitative measurement, and uncooperative patients with advanced disease or patients with pacemakers or claustrophobia could not receive the examination. Therefore, blood biomarkers can have many valuable applications in CADASIL such as screening high-risk subjects for developing CADASIL, diagnosis of clinically probable disease without genetic evidence, prediction of clinical outcomes and prognosis, and surrogate endpoints in clinical trials [15,16]. Several promising blood biomarkers such as circulating progenitor cell and neurofilament light chain have been identified in CADASIL [17,18,19,20]. Unfortunately, they were not specific for CADASIL. Blood biomarkers related to the Notch signaling pathway have not been investigated extensively in CADASIL. It is noteworthy that the plasma level of NOTCH3 ECD (N3ECD) was lower significantly in transgenic mouse models of CADASIL than in the control mice [18]. Therefore, blood levels of N3ECD and Notch ligands could be useful for potential blood biomarkers for CADASIL. However, the normal physiological range of blood levels of N3ECD and Jagged-1 has not been determined yet. Therefore, for the purpose of their potential use as blood biomarkers, blood levels of N3ECD and the ligand Jagged-1 were measured in healthy individuals and the correlations with physiological and laboratory findings were investigated.

2. Results

2.1. Participant Characteristics

Of 279 participants, the mean age with standard deviation was 48.7 ± 10.6 and 47% were men. Current smoking and alcohol use was present in 24.7% and 73.8% of the participants, respectively. Table 1 summarizes the baseline characteristics of participants, including demographics, medical history, and laboratory values by gender.

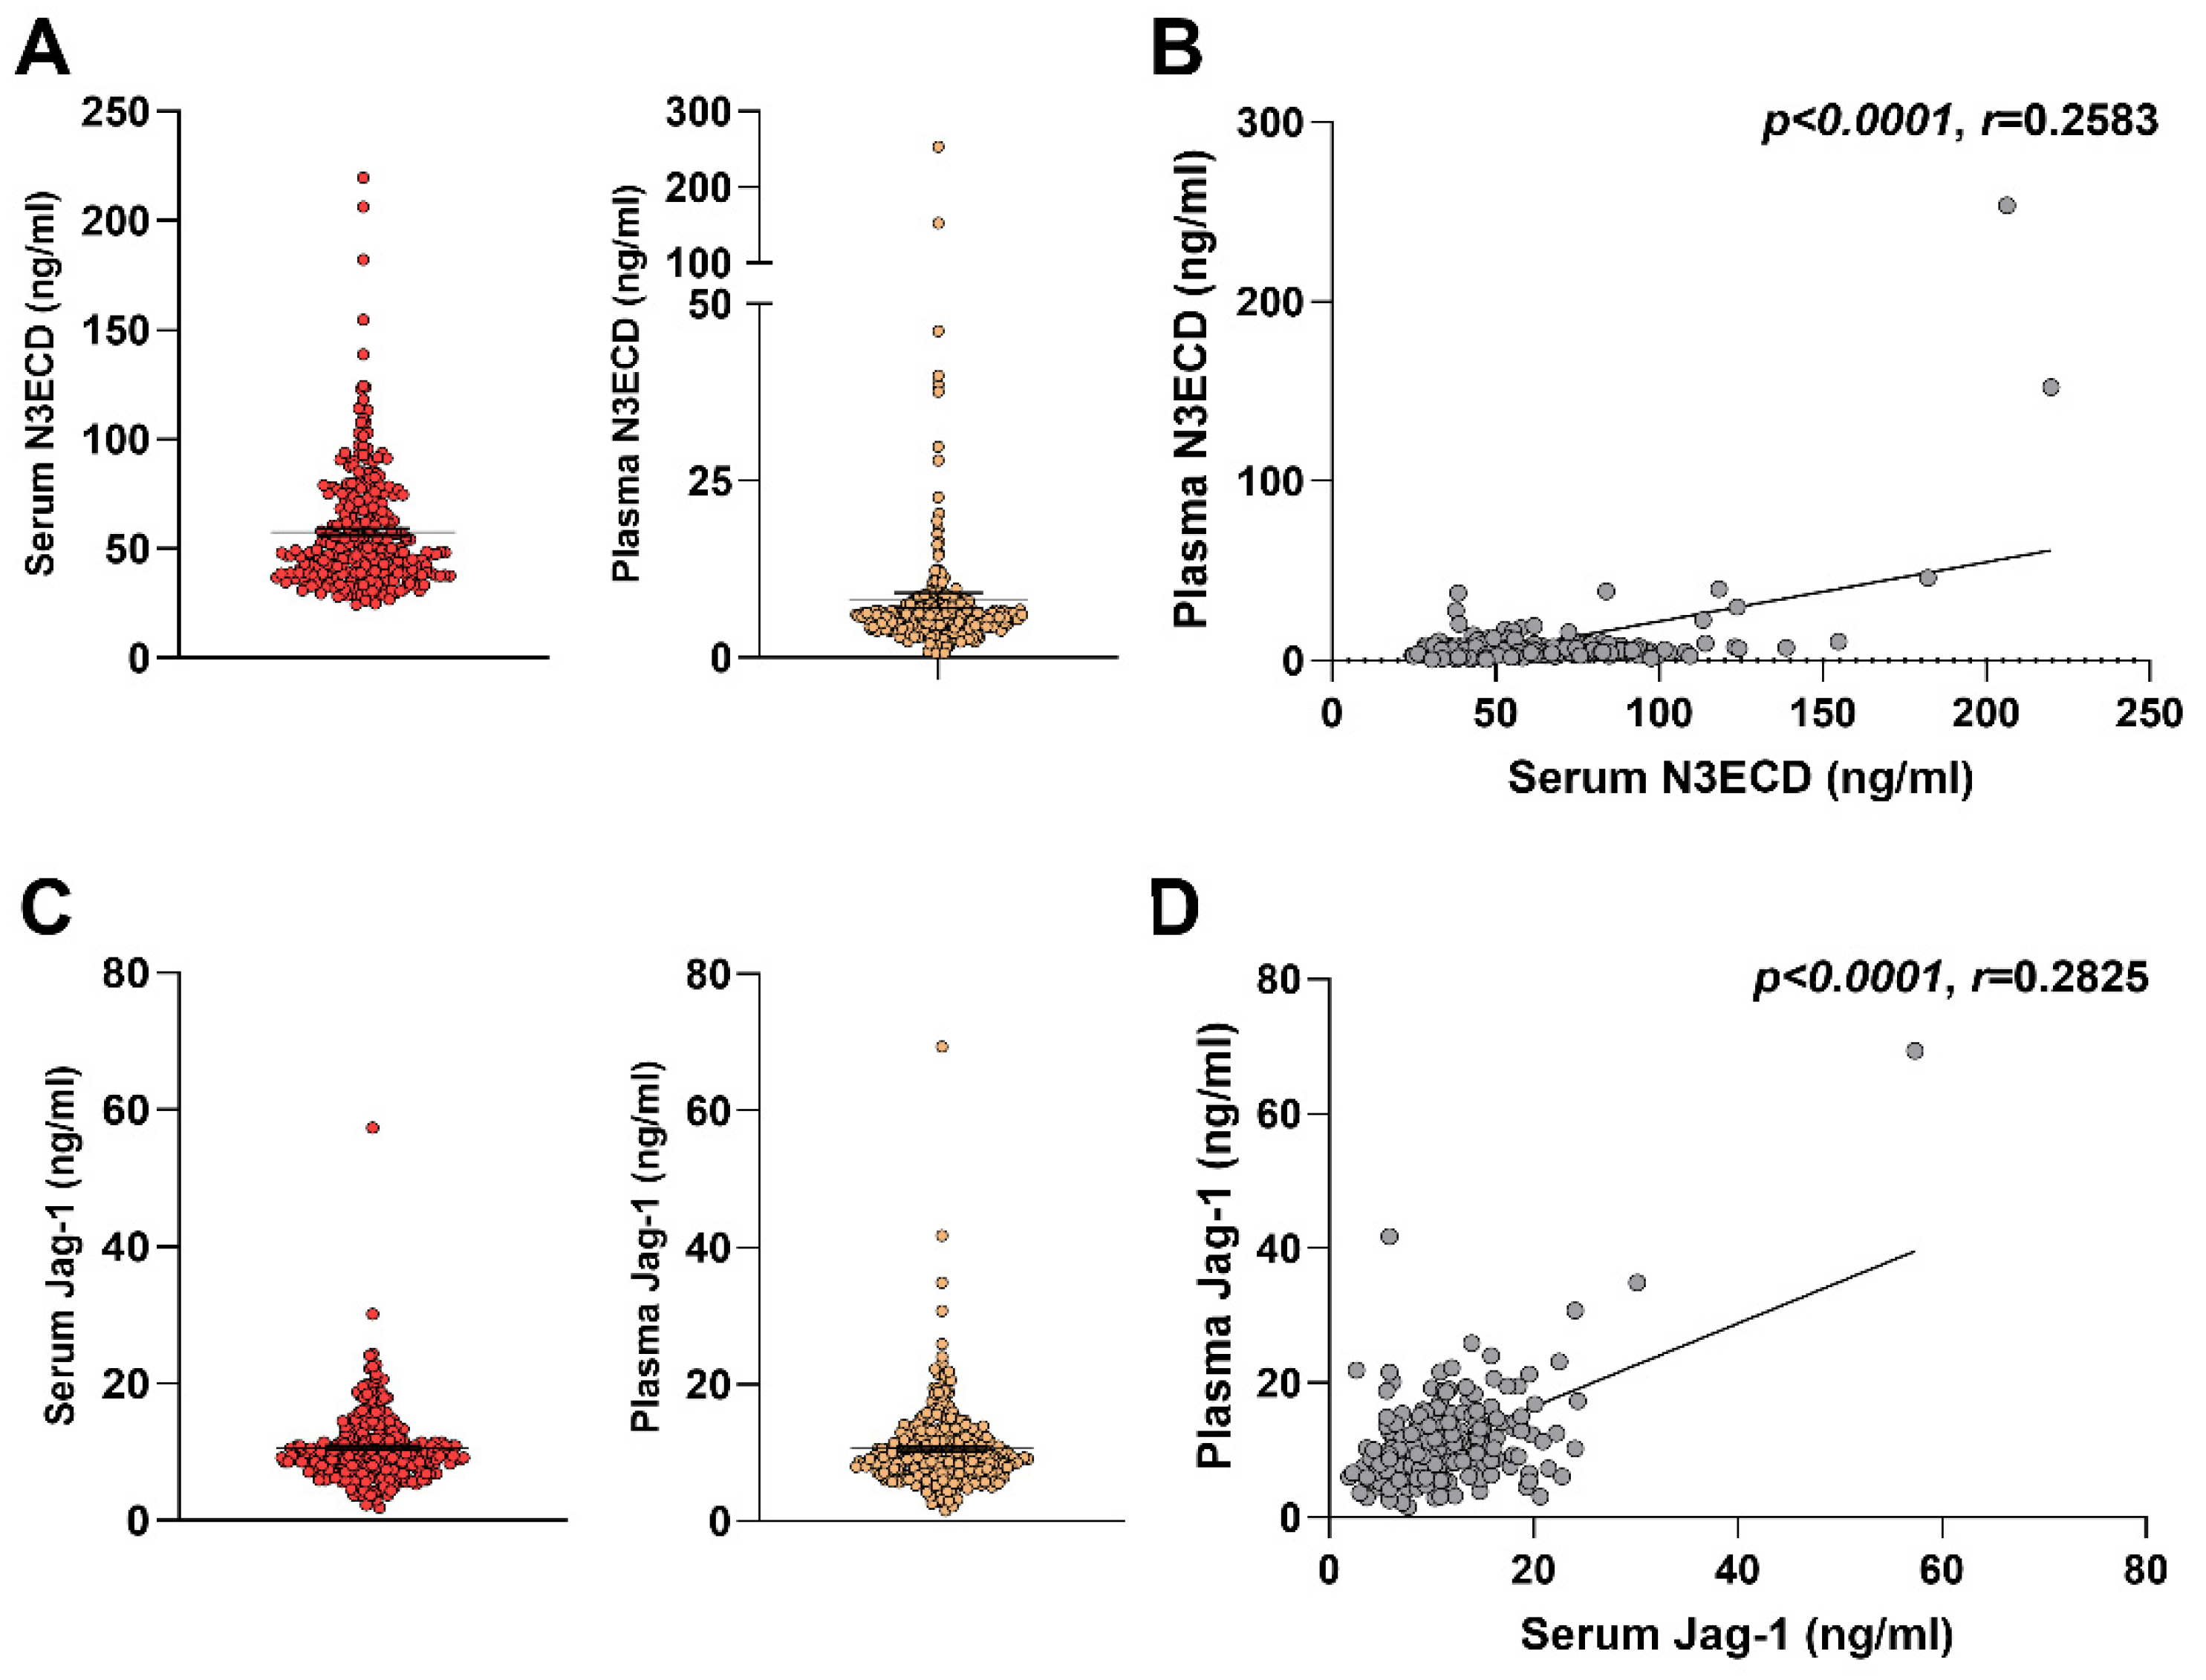
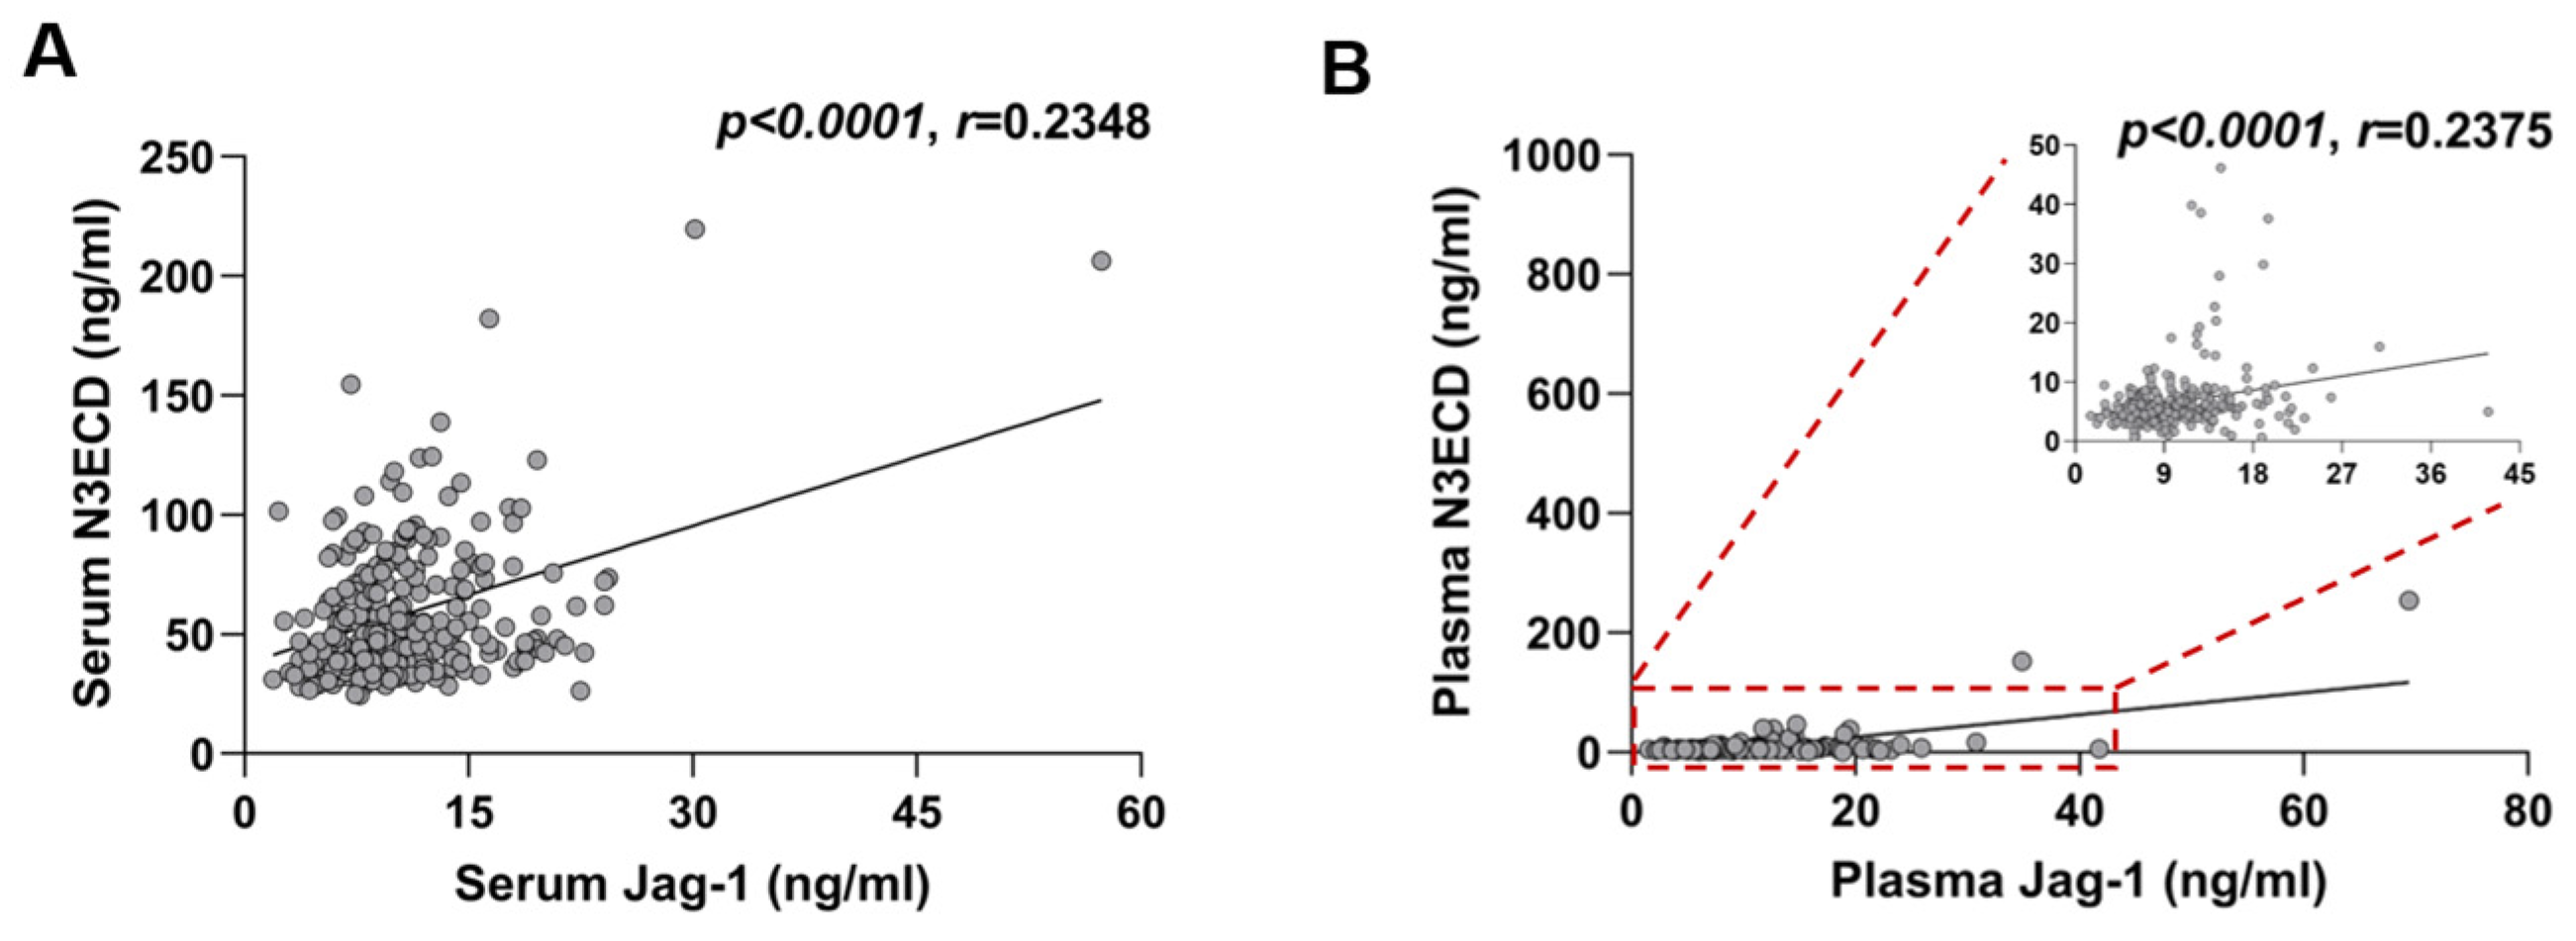
2.2. Determination of Serum and Plasma Levels of N3ECD and Jagged-1

Using ELISA technique, we measured the serum and plasma levels of N3ECD and Jagged-1 in healthy Korean people and the results are presented in Supplementary Table S1. The average coefficient of variation values of three independent experiments ranged from 3.03–5.60% for N3ECD and 1.25–4.87% for Jagged-1 (Supplemental Figure S1). The median serum N3ECD were significantly higher than plasma N3ECD level (median [interquartile range]; 49.42 [38.78–73.01] ng/mL vs. 5.73 [4.17–7.44] ng/mL, p < 0.001) (Figure 1A), and serum N3ECD level showed a positive correlation with plasma level (p < 0.0001, r = 0.2583) (Figure 1B). In contrast to N3ECD, the median serum and plasma levels of Jagged-1 did not differ significantly (9.74 [7.42–12.27] ng/mL vs. 9.39 [7.07–12.69], p = 0.998) (Figure 1C); however, they showed a weak positive correlation (p < 0.0001, r = 0.2825) (Figure 1D). The levels of N3ECD and Jagged-1 also showed weak correlations in both serum (p < 0.0001, r = 0.2348) and plasma (p < 0.0001, r = 0.2375) (Figure 2).

2.3. Associations between N3ECD or Jagged-1 Levels and Clinical Characteristics

We evaluated the association between serum and plasma levels of N3ECD or Jagged-1 and clinical characteristics, and the results are summarized in Table 2 and Table 3. There was no difference in serum and plasma N3ECD levels between men and women (Figure 3A). Serum N3ECD levels showed a very weak positive correlation with age (p < 0.0376, r = 0.1246), while plasma N3ECD levels did not show a correlation with age (p < 0.2545, r = −0.0684) (Figure 3B). Serum and plasma Jagged-1 levels also showed no difference between male and female (Figure 3C). In contrast to N3ECD, Jagged-1 levels showed very weak negative correlations with age in serum (p = 0.0041, r = −0.1713) and plasma (p = 0.0437, r = 0.1209) (Figure 3D). Among laboratory values, serum N3ECD levels only exhibited a weak negative correlation with hemoglobin (p = 0.035, r = −0.1262) and a negligible positive correlation with creatinine level (p = 0.0083, r =0.1579), while plasma N3ECD did not show correlations with any values (Figure 4A,B and Table 2). Serum Jagged-1 levels showed negative correlations with systolic blood pressure (p = 0.0342, r = −0.1268), HbA1c (p = 0.0471, r = −0.134) and triglyceride (p = 0.0346, r = −0.1266) (Figure 4C–E and Table 3), but again the size of correlation was very weak. After the adjustment for multiple testing, all the adjusted p-values were greater than 0.05 (Table 2 and Table 3).

3. Discussion

Several blood biomarkers have been suggested to monitor and predict the disease course in CADASIL patients. For example, the NfL blood level has been shown to correlate with the clinical burdens of patients with CADASIL [19] and can predict disease severity and long-term survival [18]. However, as a major component of the neuronal cytoskeleton in the axons, NfL is released into the blood upon any tissue damage in the central nervous system and therefore the level was also elevated in sporadic stroke and other various neurological disorders [21,22,23]. On the other hand, N3ECD has been known to accumulate in the VSMCs as a component of granular osmiophilic material in CADASIL patients even before the appearance of symptoms and signs of stroke [24,25], suggesting N3ECD as a promising biomarker that would be more sensitive in early stages. Therefore, as a preliminary study to investigate the potential of N3ECD and Jagged-1 as biomarkers for CADASIL patients, we measured N3ECD and Jagged-1 levels in healthy adult Koreans and tried to set up the reference range of them. We also evaluated changes in serum and plasma levels of these proteins according to various clinical characteristics, including age, gender, and blood chemistry and lipid profiles. As a result, we successfully established an ELISA assay and determined N3ECD and Jagged-1 levels in serum and plasma samples of healthy Korean adults.
Primo et al. have proposed three circulating proteins as biomarkers in a C445R mouse model of CADASIL: endostatin, high-temperature requirement A serine peptidase (HTRA1), and N3ECD [26]. They observed increased plasma levels of endostatin and HTRA1 in mice with the C455R mutation, whereas they saw decreased N3ECD level compared to controls. Interestingly, in three human samples they found that N3ECD levels were 3.6 times higher in the serum than in the plasma, which is consistent with our finding; the mean serum N3ECD level was seven times higher than the mean plasma level (Supplemental Table S1). Higher serum N3ECD levels may be attributed to cell lysis of white blood cells during the serum preparation, since Notch3 expression has been reported in human peripheral blood lymphocytes [27]. However, it is also possible that anticoagulant, ethylene–diamine–tetraacetic acid (EDTA), used for the routine preparation of plasma interferes with the detection of N3ECD, leading to lower levels in ELISA assay. Therefore, further study is required to determine which sample type is more appropriate for the measurement of N3ECD in the human blood.
We observed a tendency that serum N3ECD levels increase with age, although the degree of correlation was very weak. Considering that high Notch3 expression in adult human tissues seems to be restricted to vascular smooth muscle cells, it is likely that the aging process in small vessels affects expression of Notch3 and subsequently its serum levels. Although there are no studies examining Notch3 expression in vascular smooth muscle cells in aging vessels, decline in Notch signaling activity has been linked to impaired regenerative capacity of aged muscles, suggesting that altered Notch signaling occurs with aging [28,29]. Besides age, serum N3ECD correlated weakly with hemoglobin and creatinine levels in this study. Serum creatinine showed a positive correlation with age in this study. The concentration of serum creatinine rises progressively with age, especially after 60 years [30] and the decline in creatinine clearance accelerates with advancing age [31]. The decrease in creatinine clearance with age represents true renal aging. Therefore, the positive correlation between serum N3ECD and creatinine levels might be an aging effect. In contrast to N3ECD, Jagged-1 levels showed a weak negative correlation with age. These findings indicate that age needs to be corrected when analyzing N3ECD or Jagged-1 levels in human blood samples. Additionally, serum Jagged-1 showed correlations with systolic blood pressure, HbA1c, and triglyceride. However, as their size of correlation was mostly marginal, further studies with a larger number of samples including the patients who have abnormal laboratory values are needed to validate the results.
In summary, we successfully measured the levels of N3ECD and Jagged-1 using ELISA technique in a series of healthy human serum and plasma samples in this study. We documented that N3ECD levels are significantly higher in the serum than in plasma and tend to increase with age. In contrast, Jagged-1 levels had no difference between the serum and plasma levels and decreased with age. We believe our findings provide the basis for future research investigating the clinical use of N3ECD and Jagged-1 for CADASIL and other Notch signaling-related diseases.

4. Materials and Methods

4.1. Study Participants

Serum and plasma samples and their health information were provided by the Biobank of the Jeju National University Hospital, a member of the Korea Biobank Network. The informed consent was obtained from all participants at the time of sample donation to Biobank. Serum was prepared from the whole blood in a serum-separating tube (BD Vacutainer, Becton, Dickinson and Company, Franklin Lakes, NJ, USA) after the clot formation. The supernatant was collected after the centrifuging at 3400 rpm for 10 min at room temperature. Plasma was prepared from the whole blood in EDTA tube containing 5.4 mg of K2 EDTA (BD Vacutainer, Becton, Dickinson and Company, NJ, USA). The supernatant was collected after the cells have been removed by centrifugation at 4 °C. This study was approved by the Institutional Review Board of the Jeju National University Hospital (IRB File No. JEJUNUH 2020-08-010) and all procedures were in accordance with the Helsinki Declaration of 1964 and later versions.
The study participants consisted of 279 healthy Korean adults (131 men and 148 women; aged 23 to 79 years), who donated blood samples to the Biobank when they visited the hospital for routine health check-up. At the time of the check-up, the following information was collected from the participants: (1) height and weight; (2) past medical history (hypertension, diabetes mellitus, history of stroke, and history of ischemic heart disease); (3) systolic and diastolic blood pressure; and (4) laboratory values (white blood cell count, hemoglobin, platelet count, BUN, creatinine, fasting blood glucose, HbA1c, C-reactive protein, homocysteine, total cholesterol, LDL cholesterol, HDL cholesterol, and triglyceride). In this study, individuals with hypertension, diabetes mellitus, a history of stroke or ischemic heart disease were excluded.

4.2. Biochemical Analysis

N3ECD and Jagged-1 protein levels were determined in serum and plasma samples by sandwich enzyme-linked immunosorbent assay (ELISA). N3ECD ELISA is designed based on Primo, V. et al. [26]. Briefly, 96-well immuno-plates (SPL life science, South Korea) were coated with a monoclonal capture antibody (R&D Systems, Minneapolis, MN, USA; MAB 1559; 625 ng/mL in PBS) and were incubated overnight at 4 °C. Plates were blocked with 5% PBST (Tween 20; Sigma-Aldrich, St. Louis, MO, USA; P9416) at room temperature (RT) for 2 h. Recombinant Human Notch-3 Fc Chimera (R&D systems; 1559-NT) were used as a positive control standard protein. Recombinant protein was serially diluted from 100 ng/mL to 1.563 ng/mL and serum samples were diluted 1:10 in PBS. Standards and samples were loaded onto plates and incubated at RT for 2 h. Captured N3ECD was detected using biotinylated polyclonal antibody raised against the N3ECD (R&D Systems; BAF1559; 1000ng/mL). Detection antibody was diluted in Reagent Diluent Concentrate 2 (R&D Systems; DY995). After incubating plates at RT for 2 h, 100 µL of the working dilution of streptavidin-HRP (R&D Systems; DY992) was added to each well and incubated for 20 min at dark RT. The enzymatic reaction was developed with a 1-Step Ultra TMB: 3,3’,5,5’-tetramethylbenzidine-ELISA (Thermo Fisher Scientific, Waltham, Massachusetts USA; 34028) and then was stopped by adding 50 µL of stop solution (R&D systems; DY994) per well. The optical density was measured at 450 nm using a microplate reader (Tecan sunrise, Männedorf, Switzerland). We provided the range of N3ECD detection and the coefficient of variation for three independent ELISAs in Supplemental Figure S1. Ten-fold diluted serum and plasma N3ECD were founded to be in the range of 0~100 ng/mL. To measure Jagged-1 levels in serum, R&D systems Duoset (Cat# DY 1277) was used according to the manufacturer’s protocol. The detection range of Jagged1 was given as 0 to 40 ng/mL. In all analyses and figures, we used one of three independent ELISA experiments.

4.3. Statistical Analyses

Baseline demographic characteristics were compared between men and women using unpaired t-tests or χ2 tests according to the type of variables. For comparisons between serum and plasma levels of N3ECD and Jagged-1, a Wilcoxon signed-rank test was used. The correlation between N3ECD and Jagged-1 levels and different variables were tested using the Spearman’s rank correlation test. A p-value < 0.05 was considered statistically significant. For adjustment for multiple testing, we used the Holm-Šidák method. Statistical analyses were performed using GraphPad Prism software (version 9.0 GraphPad Software, Inc., San Diego, CA, USA; https://www.graphpad.com/scientific-software/prism, accessed on 7 January 2022).

Supplementary Materials

The following supporting information can be downloaded at: https://www.mdpi.com/article/10.3390/ijms231810547/s1.

Author Contributions

H.K. designed and performed experiments, analyzed data and wrote manuscript. Y.-J.K. performed experiments, analyzed data. B.J. provided helpful discussions and edited the manuscript. J.C.C. designed experiments, supervised the project, and wrote manuscript. All authors have read and agreed to the published version of the manuscript.

Funding

This research was supported by Basic Science Research Program through the National Research Foundation of Korea (NRF) funded by the Ministry of Education (2018R1D1A1B07045053).

Institutional Review Board Statement

This study was approved by the Institutional Review Board of the Jeju National University Hospital (IRB File No. JEJUNUH 2020-08-010) and all procedures were in accordance with the Helsinki Declaration of 1964 and later versions.

Informed Consent Statement

Serum and plasma samples and their health information were provided by the Biobank of the Jeju National University Hospital, a member of the Korea Biobank Network. The informed consent was obtained from all participants at the time of sample donation to the Biobank.

Data Availability Statement

Not applicable.

Acknowledgments

We wish to thank Junseong Kim for development of the ELISA analysis program.

Conflicts of Interest

The authors declare no conflict of interest.

References

  1. Gridley, T. Notch signaling in vascular development and physiology. Development 2007, 134, 2709–2718. [Google Scholar] [CrossRef]
  2. Boucher, J.; Gridley, T.; Liaw, L. Molecular pathways of notch signaling in vascular smooth muscle cells. Front. Physiol. 2012, 3, 81. [Google Scholar] [CrossRef] [PubMed]
  3. Baeten, J.T.; Lilly, B. Notch Signaling in Vascular Smooth Muscle Cells. Adv. Pharm. 2017, 78, 351–382. [Google Scholar]
  4. Joutel, A.; Corpechot, C.; Ducros, A.; Vahedi, K.; Chabriat, H.; Mouton, P.; Alamowitch, S.; Domenga, V.; Cecillion, M.; Marechal, E.; et al. Notch3 mutations in CADASIL, a hereditary adult-onset condition causing stroke and dementia. Nature 1996, 383, 707–710. [Google Scholar] [CrossRef] [PubMed]
  5. Choi, J.C. Cerebral autosomal dominant arteriopathy with subcortical infarcts and leukoencephalopathy: A genetic cause of cerebral small vessel disease. J. Clin. Neurol. 2010, 6, 1–9. [Google Scholar] [CrossRef]
  6. Chabriat, H.; Joutel, A.; Dichgans, M.; Tournier-Lasserve, E.; Bousser, M.G. Cadasil. Lancet Neurol. 2009, 8, 643–653. [Google Scholar] [CrossRef]
  7. Choi, J.C. Genetics of cerebral small vessel disease. J. Stroke 2015, 17, 7–16. [Google Scholar] [CrossRef]
  8. Artavanis-Tsakonas, S.; Rand, M.D.; Lake, R.J. Notch signaling: Cell fate control and signal integration in development. Science 1999, 284, 770–776. [Google Scholar] [CrossRef]
  9. High, F.A.; Zhang, M.; Proweller, A.; Tu, L.; Parmacek, M.S.; Pear, W.S.; Epstein, J.A. An essential role for Notch in neural crest during cardiovascular development and smooth muscle differentiation. J. Clin. Investig. 2007, 117, 353–363. [Google Scholar] [CrossRef]
  10. Manderfield, L.J.; High, F.A.; Engleka, K.A.; Liu, F.; Li, L.; Rentschler, S.; Epstein, J.A. Notch activation of Jagged1 contributes to the assembly of the arterial wall. Circulation 2012, 125, 314–323. [Google Scholar] [CrossRef]
  11. Breikaa, R.M.; Denman, K.; Ueyama, Y.; McCallinhart, P.E.; Khan, A.Q.; Agarwal, G.; Trask, A.J.; Garg, V.; Lilly, B. Loss of Jagged1 in mature endothelial cells causes vascular dysfunction with alterations in smooth muscle phenotypes. Vasc. Pharmacol. 2022, 145, 107087. [Google Scholar] [CrossRef] [PubMed]
  12. Liem, M.K.; van der Grond, J.; Haan, J.; van den Boom, R.; Ferrari, M.D.; Knaap, Y.M.; Breuning, M.H.; van Buchem, M.A.; Middelkoop, H.A.; Lesnik Oberstein, S.A. Lacunar infarcts are the main correlate with cognitive dysfunction in CADASIL. Stroke 2007, 38, 923–928. [Google Scholar] [CrossRef] [PubMed]
  13. O’Sullivan, M.; Jarosz, J.M.; Martin, R.J.; Deasy, N.; Powell, J.F.; Markus, H.S. MRI hyperintensities of the temporal lobe and external capsule in patients with CADASIL. Neurology 2001, 56, 628–634. [Google Scholar] [CrossRef] [PubMed]
  14. Chabriat, H.; Herve, D.; Duering, M.; Godin, O.; Jouvent, E.; Opherk, C.; Alili, N.; Reyes, S.; Jabouley, A.; Zieren, N.; et al. Predictors of Clinical Worsening in Cerebral Autosomal Dominant Arteriopathy With Subcortical Infarcts and Leukoencephalopathy: Prospective Cohort Study. Stroke 2016, 47, 4–11. [Google Scholar] [CrossRef]
  15. Jickling, G.C.; Sharp, F.R. Biomarker panels in ischemic stroke. Stroke 2015, 46, 915–920. [Google Scholar] [CrossRef]
  16. Vilar-Bergua, A.; Riba-Llena, I.; Nafria, C.; Bustamante, A.; Llombart, V.; Delgado, P.; Montaner, J. Blood and CSF biomarkers in brain subcortical ischemic vascular disease: Involved pathways and clinical applicability. J. Cereb. Blood Flow Metab. 2016, 36, 55–71. [Google Scholar] [CrossRef]
  17. Pescini, F.; Donnini, I.; Cesari, F.; Nannucci, S.; Valenti, R.; Rinnoci, V.; Poggesi, A.; Gori, A.M.; Giusti, B.; Rogolino, A.; et al. Circulating Biomarkers in Cerebral Autosomal Dominant Arteriopathy with Subcortical Infarcts and Leukoencephalopathy Patients. J. Stroke Cerebrovasc. Dis. 2017, 26, 823–833. [Google Scholar] [CrossRef]
  18. Gravesteijn, G.; Rutten, J.W.; Verberk, I.M.W.; Bohringer, S.; Liem, M.K.; van der Grond, J.; Aartsma-Rus, A.; Teunissen, C.E.; Lesnik Oberstein, S.A.J. Serum Neurofilament light correlates with CADASIL disease severity and survival. Ann. Clin. Transl. Neurol. 2019, 6, 46–56. [Google Scholar] [CrossRef]
  19. Duering, M.; Konieczny, M.J.; Tiedt, S.; Baykara, E.; Tuladhar, A.M.; Leijsen, E.V.; Lyrer, P.; Engelter, S.T.; Gesierich, B.; Achmuller, M.; et al. Serum Neurofilament Light Chain Levels Are Related to Small Vessel Disease Burden. J. Stroke 2018, 20, 228–238. [Google Scholar] [CrossRef]
  20. Gao, D.; Shang, J.; Sun, R.; Shi, Y.; Jiang, H.; Ma, M.; Zhang, J. Changes in the Morphology, Number, and Protein Levels of Plasma Exosomes in CADASIL Patients. J. Alzheimers Dis. 2021, 81, 221–229. [Google Scholar] [CrossRef]
  21. Lu, C.H.; Macdonald-Wallis, C.; Gray, E.; Pearce, N.; Petzold, A.; Norgren, N.; Giovannoni, G.; Fratta, P.; Sidle, K.; Fish, M.; et al. Neurofilament light chain: A prognostic biomarker in amyotrophic lateral sclerosis. Neurology 2015, 84, 2247–2257. [Google Scholar] [CrossRef] [PubMed] [Green Version]
  22. Bergman, J.; Dring, A.; Zetterberg, H.; Blennow, K.; Norgren, N.; Gilthorpe, J.; Bergenheim, T.; Svenningsson, A. Neurofilament light in CSF and serum is a sensitive marker for axonal white matter injury in MS. Neurol. Neuroimmunol. Neuroinflamm. 2016, 3, e271. [Google Scholar] [CrossRef] [PubMed]
  23. Chen, C.H.; Cheng, Y.W.; Chen, Y.F.; Tang, S.C.; Jeng, J.S. Plasma neurofilament light chain and glial fibrillary acidic protein predict stroke in CADASIL. J. Neuroinflamm. 2020, 17, 124. [Google Scholar] [CrossRef]
  24. Ebke, M.; Dichgans, M.; Bergmann, M.; Voelter, H.U.; Rieger, P.; Gasser, T.; Schwendemann, G. CADASIL: Skin biopsy allows diagnosis in early stages. Acta. Neurol. Scand. 1997, 95, 351–357. [Google Scholar] [CrossRef] [PubMed]
  25. Mayer, M.; Straube, A.; Bruening, R.; Uttner, I.; Pongratz, D.; Gasser, T.; Dichgans, M.; Muller-Hocker, J. Muscle and skin biopsies are a sensitive diagnostic tool in the diagnosis of CADASIL. J. Neurol. 1999, 246, 526–532. [Google Scholar] [CrossRef] [PubMed]
  26. Primo, V.; Graham, M.; Bigger-Allen, A.A.; Chick, J.M.; Ospina, C.; Quiroz, Y.T.; Manent, J.; Gygi, S.P.; Lopera, F.; D’Amore, P.A.; et al. Blood biomarkers in a mouse model of CADASIL. Brain Res. 2016, 1644, 118–126. [Google Scholar] [CrossRef] [PubMed]
  27. Di Maio, G.; Formichi, P.; Radi, E.; Bianchi, S.; Onnis, A.; Tarquini, E.; Leoncini, L.; Federico, A. Human peripheral blood lymphocytes and fibroblasts as Notch3 expression models. J. Cell. Physiol. 2012, 227, 1771–1775. [Google Scholar] [CrossRef]
  28. Conboy, I.M.; Conboy, M.J.; Smythe, G.M.; Rando, T.A. Notch-mediated restoration of regenerative potential to aged muscle. Science 2003, 302, 1575–1577. [Google Scholar] [CrossRef]
  29. Balistreri, C.R.; Madonna, R.; Melino, G.; Caruso, C. The emerging role of Notch pathway in ageing: Focus on the related mechanisms in age-related diseases. Ageing Res. Rev. 2016, 29, 50–65. [Google Scholar] [CrossRef]
  30. Tiao, J.Y.; Semmens, J.B.; Masarei, J.R.; Lawrence-Brown, M.M. The effect of age on serum creatinine levels in an aging population: Relevance to vascular surgery. Cardiovasc. Surg. 2002, 10, 445–451. [Google Scholar] [CrossRef]
  31. Rowe, J.W.; Andres, R.; Tobin, J.D.; Norris, A.H.; Shock, N.W. The effect of age on creatinine clearance in men: A cross-sectional and longitudinal study. J. Gerontol. 1976, 31, 155–163. [Google Scholar] [CrossRef] [PubMed]
Figure 1. NOTCH3 extracellular domain (N3ECD) levels in healthy adults. N3ECD levels were measured in serum and plasma from healthy adults by ELISA (n = 279) (A) and a correlation between serum and plasma N3ECD levels was analyzed (B). Jagged-1 levels were measured in serum and plasma (C) and their correlation was assessed (D). Each symbol represents a value from a single subject; midline represents the mean; and error bars represent the standard error. The resulting Spearman’s correlation coefficient (r) and corresponding p value are reported.
Ijms 23 10547 g001
Figure 2. Correlations between N3ECD and Jag-1 levels. Positive correlations of serum (A) and plasma levels (B) between N3ECD and Jag1 (n = 279). Results are representative of three independent ELISA experiments. The resulting Spearman’s correlation coefficient (r) and corresponding p-values are reported.
Ijms 23 10547 g002
Figure 3. Comparison of mean N3ECD and Jagged-1 levels by gender and age. Serum and plasma N3ECD levels between male and female (A) and correlations between N3ECD levels and age (B). Jagged-1 serum and plasma levels in male and female (C) and correlations with age (D). Each symbol represents values from a single subject; midline represents the mean; and error bars represent the standard error. The resulting Spearman’s correlation coefficient (r) and corresponding p-value are reported. ns—not significant.
Ijms 23 10547 g003
Figure 4. Correlations between serum N3ECD levels and laboratory values. Correlations of N3ECD with creatinine (A), and hemoglobin (B). Correlations of serum Jag-1 with systolic blood pressure (C), HbA1c (D), and triglyceride (E). Each symbol represents values from a single subject. The resulting Spearman’s correlation coefficient (r) and corresponding p value are reported.
Ijms 23 10547 g004
Table 1. Characteristics of 279 healthy subjects.
Healthy Subjects
(n = 279)
Male
(n = 131)
Female
(n = 148)
p-Value *
Demographic characteristics
   Age—yr(mean ± SD)49.7 ± 11.047.8 ± 10.10.1319 *
   Height—cm(mean ± SD)171.2 ± 5.9160.1 ± 5.4<0.0001 *
   Weight—kg(mean ± SD)73.3 ± 8.757.1 ± 7.5<0.0001 *
Medical history—no.(%)
   Smoking60 (45.8)9 (6.1)<0.0001
   Drinking111 (84.7)95 (64.2)<0.0001
Laboratory values—mean ± SD
   Systolic blood pressure—mmHg122.3 ± 9.6112.7 ± 11.9<0.0001 *
   Diastolic blood pressure—mmHg78.0 ± 6.971.6 ± 7.6<0.0001 *
   WBC5.6 ± 1.25.1 ± 1.30.0027 *
   Hemoglobin15.3 ± 1.012.8 ± 1.2<0.0001 *
   Platelet235.8 ± 47.1258.3 ± 59.60.0007 *
   BUN13.1 ± 3.810.8 ± 3.5<0.0001 *
   Creatinine1.1 ± 0.20.8 ± 0.1<0.0001 *
   FBS92.7 ± 8.9
(n = 128)
88.2 ± 8.0
(n = 146)
<0.0001 *
   HbA1c-%5.5 ± 0.5
(n = 102)
5.3 ± 0.3
(n = 118)
0.0078 *
   CRP0.1 ± 0.3
(n = 123)
0.1 ± 0.1
(n = 44)
0.2013 *
   Homocysteine-umol/L9.9 ± 2.8
(n = 50)
7.1 ± 1.6
(n = 73)
<0.0001 *
   Total cholesterol—mg/dL193.6 ± 23.1185.4 ± 25.90.0062 *
   LDL cholesterol—mg/dL124.7 ± 20.4
(n = 119)
105.4 ± 22.7
(n = 144)
<0.0001 *
   HDL cholesterol—mg/dL52.8 ± 9.966.3 ± 15.2<0.0001 *
Data are mean ± SD. * unpaired t-test, † χ2 test. p value: male vs. female, Student t-test was used for continuous variables and χ2 test was used for categorical variables. Abbreviations: WBC = White Blood Cell; BUN= Blood Urea Nitrogen; FBS = Fasting Blood Sugar; HbA1c = Hemoglobin A1C, glycated hemoglobin; CRP = C-reactive protein; LDL = Low-Density Lipoprotein; HDL = High-Density Lipoprotein.
Table 2. Correlations between blood N3ECD levels and clinical characteristics.
N3ECDSerum Plasma
r *p Valuep Value r *p Valuep Value
Demographic characteristics
   Age0.12460.03760.4983−0.06840.25450.9836
   Sex 0.29270.9869 0.85290.9992
   Height−0.05880.32790.9874−0.03410.57040.9992
   Weight−0.07900.18840.9644−0.02560.66960.9992
Medical history
   Smoking 0.33660.9874 0.12530.9102
   Drinking 0.97330.9989 0.52770.9992
Laboratory values
   Systolic blood pressure−0.08090.17810.9644−0.00800.88980.9992
   Diastolic blood pressure−0.07950.18530.9644−0.03800.51750.9992
   WBC−0.01050.86190.99890.10560.07820.8038
   Hemoglobin−0.12620.03520.4938−0.10760.20380.9672
   Platelet0.02280.70470.99890.03210.59250.9992
   BUN0.03370.57490.99890.06280.29580.9895
   Creatinine0.15790.00830.15350.03930.51300.9992
   FBS−0.04090.49980.9980−0.08790.14670.9326
   HbA1c (ngsp)−0.00700.91800.9989−0.04190.53610.9992
   CRP0.03300.59090.9989−0.05210.39520.9976
   Homocysteine−0.09740.28370.9869−0.07100.43190.9980
   Total cholesterol−0.02720.65060.9989−0.08190.17520.9541
   LDL cholesterol−0.07880.20250.9644−0.09810.11000.8908
   HDL cholesterol0.02180.71700.99890.01410.80610.9992
r *: Spearman correlation coefficient, p value : adjusted p value for multiple testing. Abbreviations: WBC = White Blood Cell; BUN= Blood Urea Nitrogen; FBS = Fasting Blood Sugar; HbA1c = Hemoglobin A1C, glycated hemoglobin; CRP = Creactive protein; LDL = Low-Density Lipoprotein; HDL = High-Density Lipoprotein.
Table 3. Correlations between blood Jag-1 levels and clinical characteristics.
Jag-1SerumPlasma
r *p Valuep Value r *p Valuep Value
Demographic characteristics
   Age−0.17130.00410.0789−0.01290.04370.5722
   Sex 0.91650.9914 0.31620.9895
   Height−0.10270.08670.73400.02230.58080.9996
   Weight−0.10350.08450.73400.04780.23620.9770
Medical history
   Smoking 0.07260.7223 0.82140.9999
   Drinking 0.53850.9903 0.77000.9999
Laboratory values
   Systolic blood pressure−0.12680.03420.48380.01380.73550.9999
   Diastolic blood pressure−0.10750.07300.72230.02480.54490.9996
   WBC−0.08680.14830.86550.02730.50330.9995
   Hemoglobin−0.08790.14300.86550.04790.23810.9770
   Platelet0.08780.14370.86550.01590.69390.9999
   BUN−0.04240.48080.98980.00110.97850.9999
   Creatinine0.01820.76190.99140.10200.01320.2334
   FBS−0.01410.81640.9914−0.01080.79420.9999
   HbA1c (ngsp)−0.13400.04710.5804−0.09160.05320.6262
   CRP−0.07120.24560.94030.01300.76010.9999
   Homocysteine−0.03570.69540.9914−0.00710.90950.9999
   Total cholesterol−0.03580.55160.99030.05470.17650.9457
   LDL cholesterol−0.05510.37340.97620.06840.10120.8370
   HDL cholesterol0.06240.29920.9592−0.06220.12660.8853
r *: Spearman correlation coefficient, p value : adjusted p value for multiple testing. Abbreviations: WBC = White Blood Cell; BUN= Blood Urea Nitrogen; FBS = Fasting Blood Sugar; HbA1c = Hemoglobin A1C, glycated hemoglobin; CRP = C-reactive protein; LDL = Low-Density Lipoprotein; HDL = High-Density Lipoprotein.
Publisher’s Note: MDPI stays neutral with regard to jurisdictional claims in published maps and institutional affiliations.

