Article

Genome-Wide Analysis of the Soybean Calmodulin-Binding Protein 60 Family and Identification of GmCBP60A-1 Responses to Drought and Salt Stresses

1
College of Agronomy, Qingdao Agricultural University, Qingdao 266109, China
2
Institute of Crop Sciences, Chinese Academy of Agricultural Sciences (CAAS)/National Key Facility for Crop Gene Resources and Genetic Improvement, Key Laboratory of Biology and Genetic Improvement of Triticeae Crops, Ministry of Agriculture, Beijing 100081, China
*
Authors to whom correspondence should be addressed.
These authors contributed equally to this work.
Int. J. Mol. Sci. 2021, 22(24), 13501; https://doi.org/10.3390/ijms222413501
Submission received: 17 November 2021 / Revised: 5 December 2021 / Accepted: 9 December 2021 / Published: 16 December 2021
(This article belongs to the Collection Recent Advances in Plant Molecular Science in China 2021)

Abstract

:
Calmodulin-binding protein 60 (CBP60) members constitute a plant-specific protein family that plays an important role in plant growth and development. In the soybean genome, nineteen CBP60 members were identified and analyzed for their corresponding sequences and structures to explore their functions. Among GmCBP60A-1, which primarily locates in the cytomembrane, was significantly induced by drought and salt stresses. The overexpression of GmCBP60A-1 enhanced drought and salt tolerance in Arabidopsis, which showed better state in the germination of seeds and the root growth of seedlings. In the soybean hairy roots experiment, the overexpression of GmCBP60A-1 increased proline content, lowered water loss rate and malondialdehyde (MDA) content, all of which likely enhanced the drought and salt tolerance of soybean seedlings. Under stress conditions, drought and salt response-related genes showed significant differences in expression in hairy root soybean plants of GmCBP60A-1-overexpressing and hairy root soybean plants of RNAi. The present study identified GmCBP60A-1 as an important gene in response to salt and drought stresses based on the functional analysis of this gene and its potential underlying mechanisms in soybean stress-tolerance.

1. Introduction

During growth and development, plants face various biotic stresses, such as pathogen infection and herbivore attack, and abiotic stresses, including drought, heat, cold and salt [1]. In response to abiotic stresses, various signaling pathways were activated to promote the plants sensing of the stimuli and then to trigger the adequate cellular responses, which include calcium signaling pathways [2], MAPK (mitogen-activated protein kinases) cascade and other signaling pathways [3,4]. Among them, the calcium signaling pathway appears to be particularly important because almost all physiological activities are regulated by Ca2+ in eukaryotes [5,6,7].
The Ca2+ was first known as a necessary nutrient for plant growth [8], many modern studies have shown that it is a ubiquitous secondary messenger that mediates stimuli-response in the regulation of diverse cellular functions [9]. Large amounts of Ca2+ in the intracellular and extracellular environments flow in and out of cells through channels in the cytomembrane, such as cation/proton exchangers (CAXs), glutamate receptor-like channels (GLRs), two-pore channels (TPCs), cyclic nucleotide-gated channels (CNGCs), ER (endoplasmic reticulum)-type Ca2+-ATPases (ECAs) and auto-inhibited Ca2+-ATPases (ACAs) [10,11,12,13]. Cytoplasmic Ca2+ transduces a variety of regulatory information based on oscillations in its concentration [14,15]. This signal transmission method is called calcium oscillation. Previous studies suggest that a change of cytoplasmic Ca2+ concentration is usually induced by plant responses to a variety of biotic and abiotic stimuli [2]. The variations of cytoplasmic Ca2+ concentration is detected by various sensor proteins, such as calmodulins (CaMs), CaM-like proteins (CMLs), calcium-dependent protein kinases (CDPKs) and calcineurin B-like proteins (CBLs) in the plant cell [16]. Calcium ions (Ca2+) are crucial in the activation of stress-related signaling cascades [17].
As one of the most extensively studied Ca2+-sensing proteins, CaM has been shown to be involved in the transduction of the Ca2+-mediated signal pathway [18,19]. This calcium-binding protein consists of two globular domains, each with two Ca2+-binding EF-hand motifs [20]. CaM responds to the change of Ca2+ concentration and transmits the signal to the target proteins [21]. Upon binding to Ca2+, the hydrophobic surfaces in each globular domain are exposed. The exposed globular domains are called the CaM-binding domain (CBD) which then interacts with the characteristic amphiphilic structure of CaM-binding proteins (CBPs) [21]. CaM can regulate the development of plants and stimuli-response by interacting with various CBPs [22]. Thus, as a downstream target protein of Ca2+-CaM, CBPs participate in many of life’s biological processes that involve Ca2+-CaM [22]. The CBP family mainly includes calmodulin-binding transcription activators (CAMTAs), WRKYs, MYBs, NACs and the CaM-binding protein family (CBP60s) [5,23].
CBP60 family had reported contains eight different members in Arabidopsis encoded by the genes AtCBP60a’ to ‘g’ and AtSARD1 (Systemic Acquired Resistance Deficient 1) [24]. On the one hand, all these proteins have been shown to bind DNA through a highly conserved central region and regulate the expression of specific genes in Arabidopsis [25]; on the other hand, previous studies suggest that the CBP60 family likely have binding CaM and Ca2+ by conserved domain to participate in Ca2+-mediated signal pathway in Arabidopsis [6,7,26]. As plant-specific protein family, CBP60 family plays an important role when plant facing various stresses. Most of the functions of CBP60 family members are related to disease resistance, immunity, and SA accumulation [27,28]. Among, AtCBP60a, AtCBP60g and AtSARD1 have been implicated in plant defense responses and the accumulation of salicylic acid (SA). CBP60g was also reported it repressed anthocyanin accumulation induced by sucrose and kinetin [29]. However, their functions in response to abiotic stress remain largely elusive. Despite the lack of such studies, they are not entirely absent. Previous study have shown that AtCBP60g enhanced the sensitivity of ABA as a positive regulator for drought tolerance in Arabidopsis [30] and AtCBP60f and AtCBP60g are upregulated in response to brassinosteroid (BR) and salt treatments [31].
Soybean (Glycine max) is one of the most economically and nutritionally crucial crops in the world [32]. However, soybean production is threatened by drought and salt stresses, as well as other stresses. Therefore, to facilitate the continued expansion of land areas for soybean cultivation, we need to improve soybean’s drought and salt tolerances to improve soybean productivity and security in less-than-ideal lands [33]. In our study, we endeavored to characterize the GmCBP60 family members by investigating the phylogenetic relationships, domain structures, chromosomal localizations, and expression patterns of GmCBP60s in response to abiotic stresses. Our findings will be useful resources for future studies to unravel the functions of the GmCBP60 genes and will contribute to our understanding of the evolutionary history of the CBP60 genes in different species. Furthermore, we focused on exploring the functional mechanisms of a specific soybean gene, GmCBP60A-1, in response to salt and drought treatments. Collectively, the current research provided insights for the future functional study of GmCBP60 genes and may be valuable for soybean breeding.

2. Results

2.1. Relationships of CBP60 Members in Various Species

In the EnsemblPlants database, 19 CBP60 proteins were identified in the soybean genome. To examine the phylogenetic relationships among the calmodulin binding domain proteins in soybean and other species, an unrooted tree was constructed using the maximum likelihood method (ML). The phylogenetic tree had three evolutionary branches, designated A, B and C, composed of 19 rice, 8 Arabidopsis, 18 maize and 19 soybean (Figure 1). The three branches showed the evolutionary relationship of homologous genes. The number of CBP60s in each species was variable within the branches. The genes distributed on branch A and B were most from maize and rice. Compared to rice in dicot, CBP60 genes in soybean showed a closer relationship with that in maize because they always clustered closely to each other in the phylogenetic tree. Furthermore, branch A did not have any soybean genes. Thus, the ancestral gene of branch A appeared to be lost in the soybean lineage.

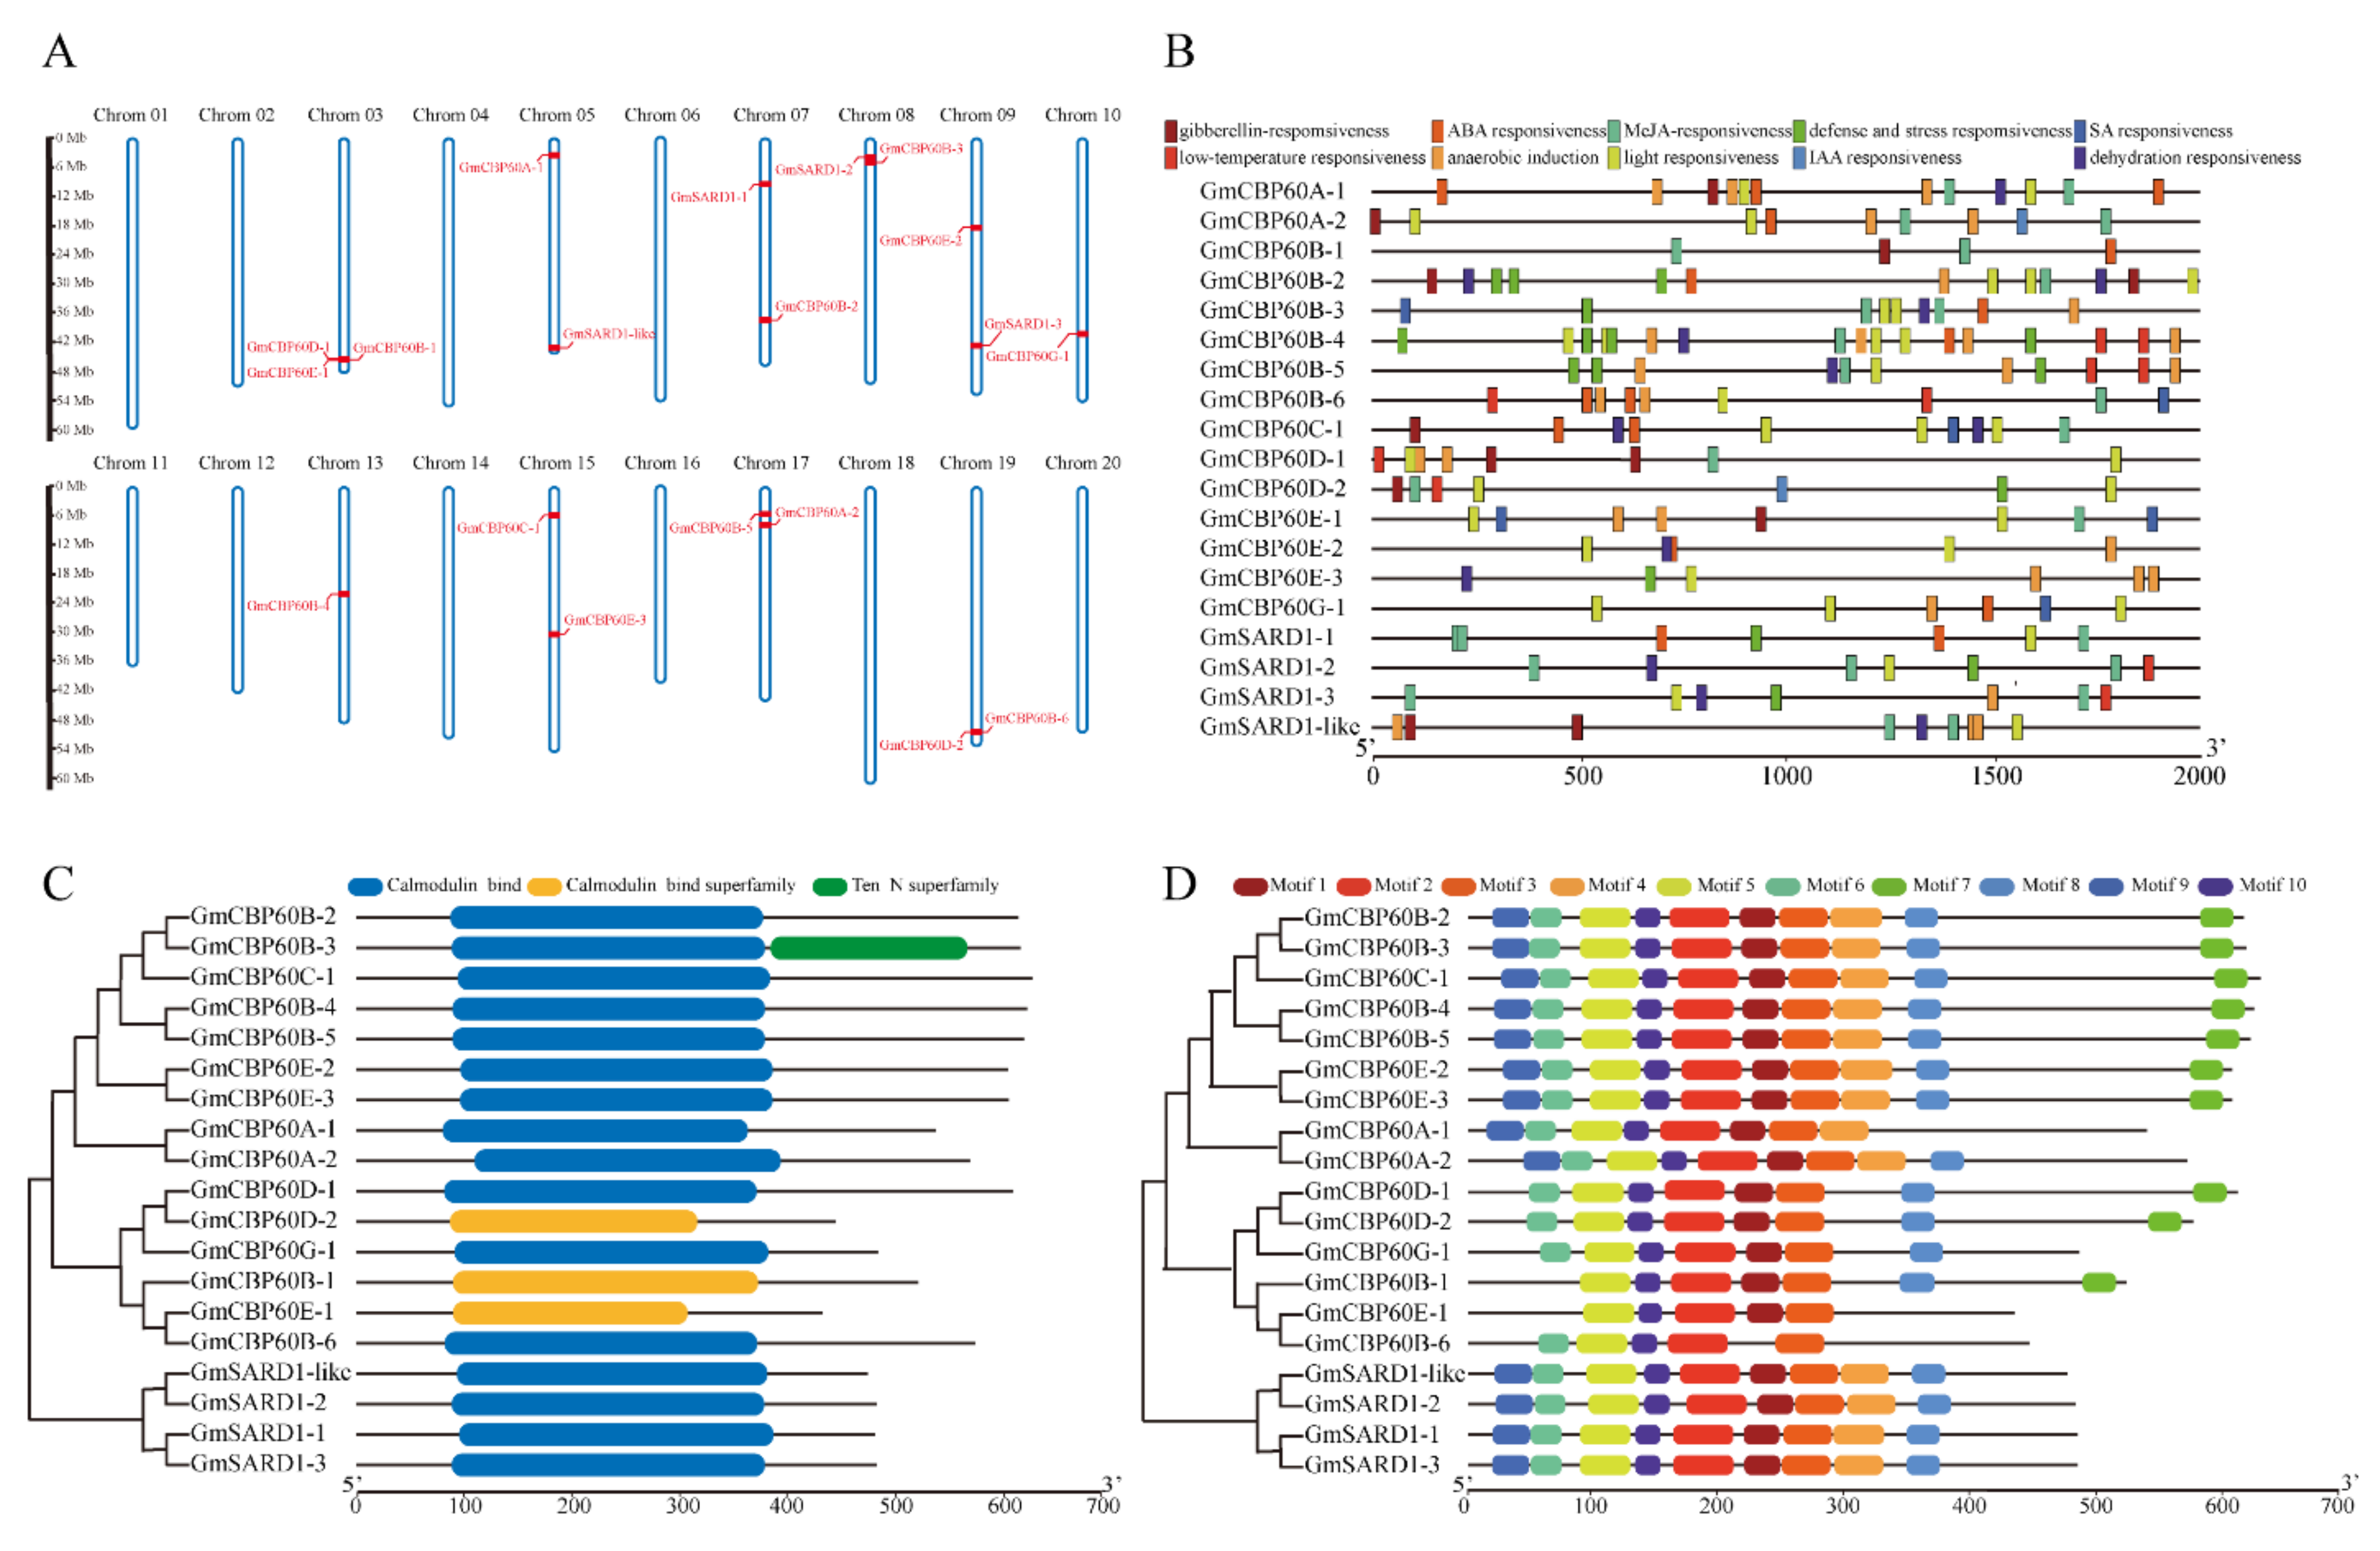
2.2. Sequences Analysis of GmCBP60 Family Members

We obtained the sequences of GmCBP60 members from the EnsemblPlants website. The GmCBP60 genes chromosomal positions were depicted based on the gene physical location information of the soybean genome. Nineteen GmCBP60 family members were distributed on 10 of 20 soybean chromosomes, none of them was found on chromosomes 1, 2, 4, 6, 11, 12, 16, 18 and 20. Chromosome 3 contained the largest number of GmCBP60 genes (Figure 2A). Cis-regulatory events were complex processes that involved chromatin accessibility, transcription factor binding, DNA methylation, histone modifications, and the interactions between them. In addition, the promoters of GmCBP60s (Figure 2B) contained a wealth of stress-related cis-acting elements, which suggested that GmCBP60s might function in a variety of physiological and biochemical processes in plants. Among this, only 6 members have both ABAR (ABA-responsive element) and DER (Dehydration-responsive element) cis-acting elements (Table 1), which were related to abiotic stress. According to the sequences of their encoding proteins, all members of the GmCBP60s in soybean had a CaM-binding domain (Figure 2C). Ten conserved motifs were detected in (Figure 2D). Among them, the motif 1, 2, 3, 5 and 10, were widely distributed in all family members (Figure S1).

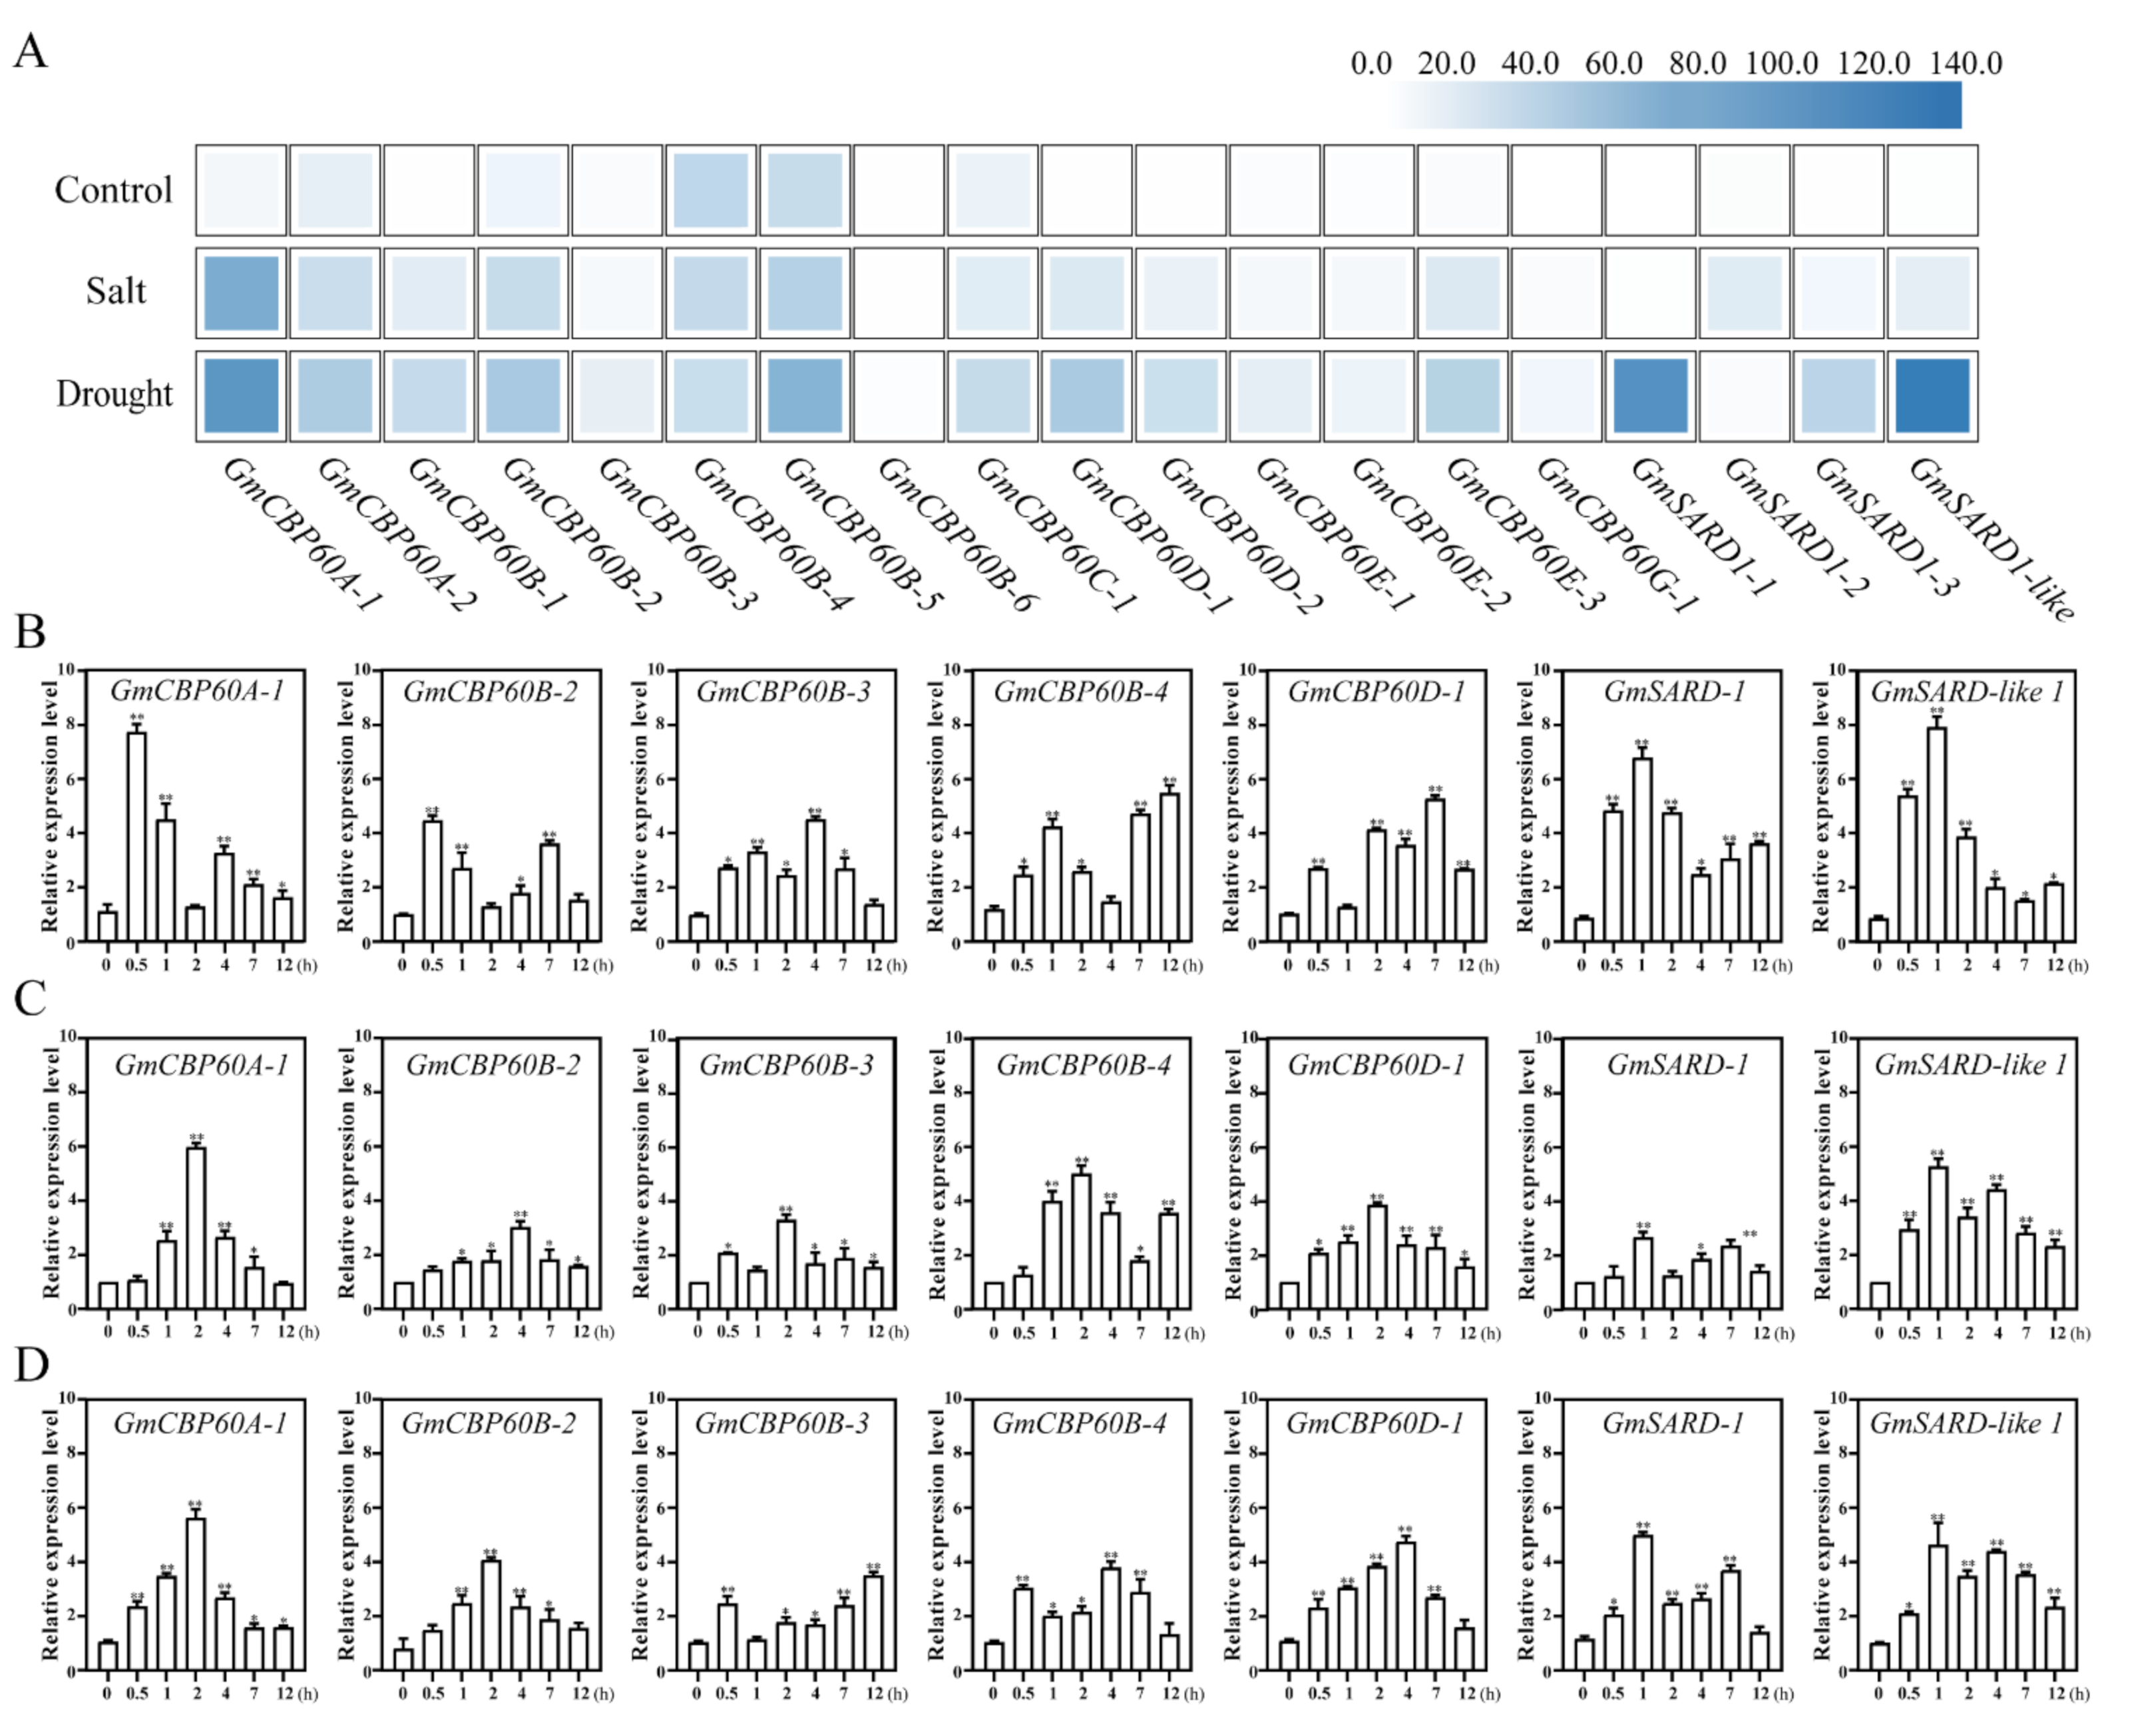
2.3. Expression of GmCBP60s in Different Treatments

In the de novo transcriptome sequencing data of soybean following drought and salt treatments [34], it was found that a number of GmCBP60 genes were triggered by drought and salt stimuli (Figure 3A and Table S1). According to gene expression induced by stresses, we screened out seven genes from GmCBP60s family, including GmCBP60A-1, GmCBP60B-2, GmCBP60B-3, GmCBP60B-4, GmCBP60D-1, GmSARD1-1, GmSARD1-like. Subsequently, we detected the response patterns of the seven genes to salt (Figure 3B), drought (Figure 3C) and PEG (Figure 3D) treatments by RT-qPCR. The results showed that GmCBP60A-1, GmSARD1-1 and GmSARD1-like transcripts were strongly responsive to salt stress compared with others. Meanwhile, GmCBP60A-1 displayed the greatest induction with drought and PEG treatments. In addition, GmCBP60A-1 was expressed in various tissues of soybean (Figure S2), indicating that GmCBP60A-1 might be important for the regulation of plant growth and development compared with GmSARD1-1 and GmSARD1-like. Thus, we focused on GmCBP60A-1 in our subsequent analyses.

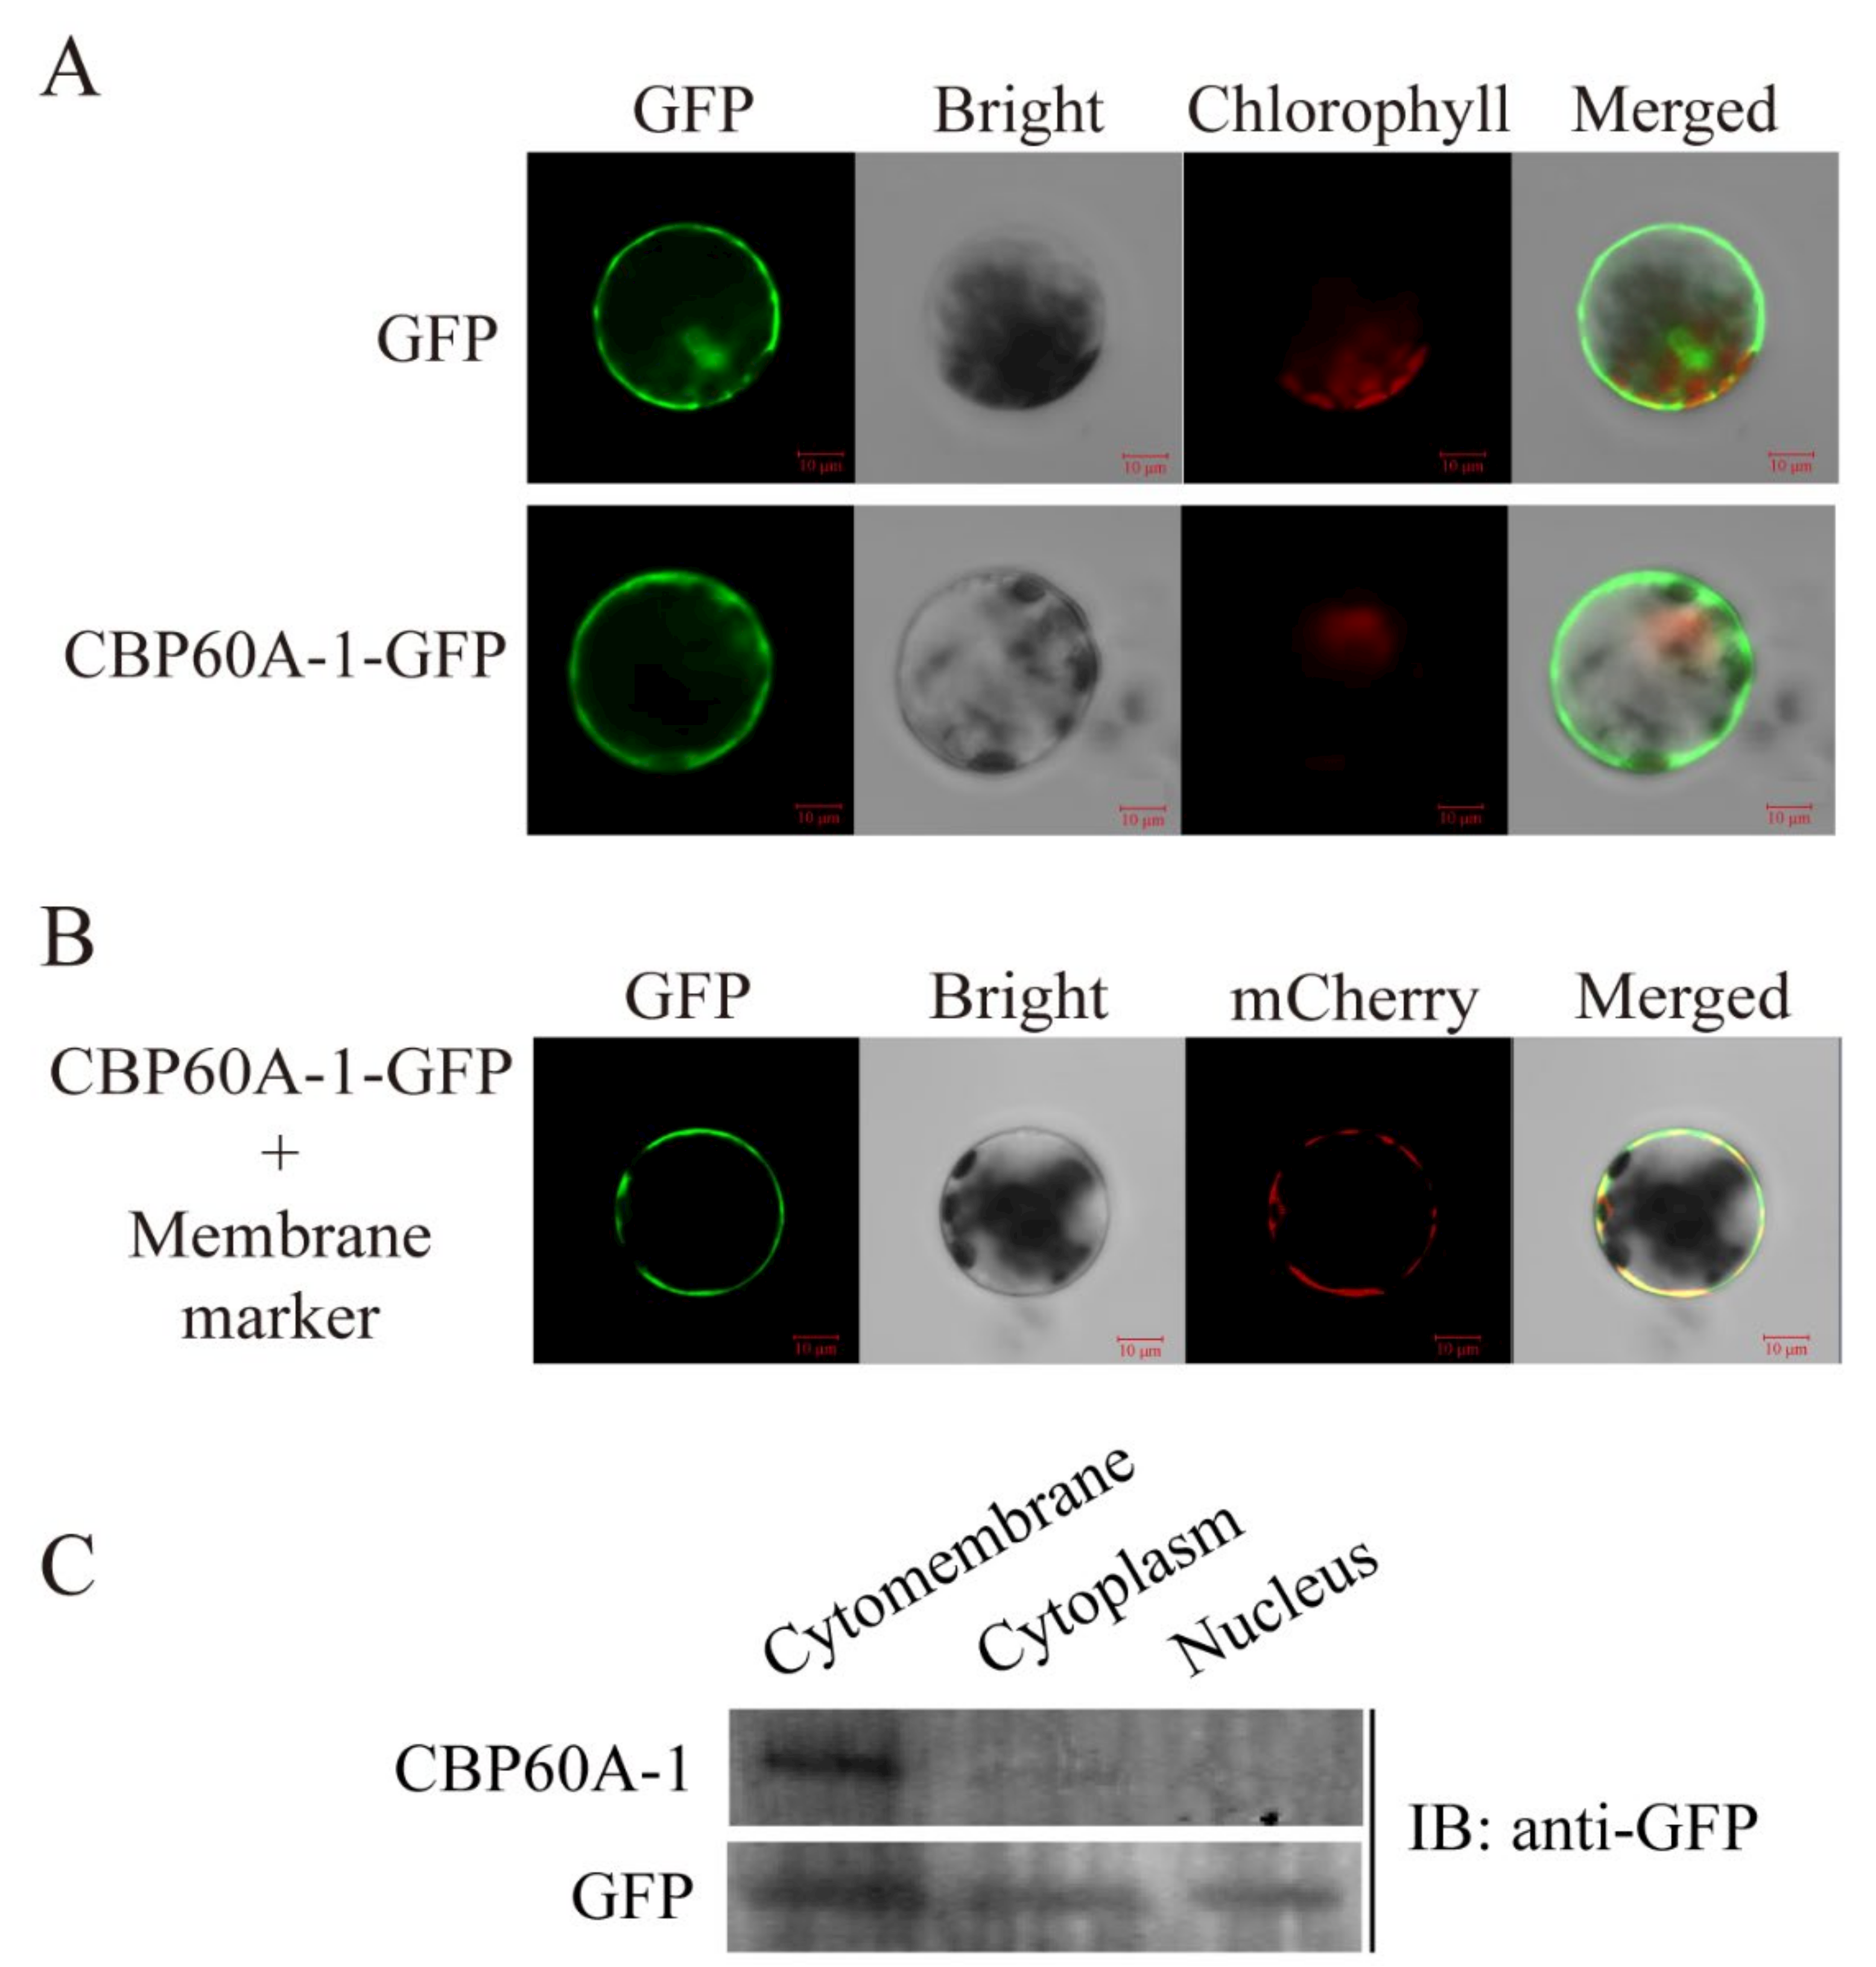
2.4. Localtion of GmCBP60A-1

The protein localization is usually related to its function, we used the method of transient transformation of protoplasts to study preliminarily the localization of GmCBP60A-1. The GmCBP60A-1-GFP fluorescence signal was observed in the cytomembrane (Figure 4A,B). To further confirm the localization of GmCBP60A-1, the proteins of the plant nucleus, cytoplasm and cytomembrane were isolated by using MinuteTM Plasma Membrane Protein Isolation Kit (Figure 4C). The result proved that GmCBP60A-1 existed in the cytomembrane and cytoplasm, but it was primarily localized in the cytomembrane.

2.5. Effect of Salt and Drought Conditions on Transgenic Arabidopsis

To study the role of the GmCBP60A-1 gene in the heterologous model system under drought and salt stresses, the transgenic Arabidopsis lines were constructed. We tested the effect of PEG6000 and NaCl on the germination of transgenic Arabidopsis seeds. There was no difference in seed germination between the wild-type and transgenic plants under normal conditions (Figure 5A). In the presence of PEG6000 and NaCl treatments of different concentrations, seed germination was significantly suppressed in both overexpression (OE) and wild-type (WT) lines, but the inhibition of OE seeds germination was much less than WT plants. When treated with 75 mM NaCl for 36 h, the germination rate of wild-type seeds was 44%, while that of transgenic lines was 66–77%. When treated with 6% PEG6000 for 36 h, the germination rate of wild-type seeds was 70%, while that of transgenic lines was 87–91% (Figure 5B).
Differential inhibition of root growth between WT and transgenic seedlings was also observed with drought and salt treatments. Five-day-old seedlings under normal conditions were transferred to 1/2 MS medium with PEG6000 or NaCl of different concentrations. After one week, roots lengths of WT plants and transgenic plants were inhibited significantly, but OE plants were inhibited to a lesser extent (Figure 6A). The root length of WT plants reached 4.56 cm compared with 5.87 to 6.44 cm for that of transgenic lines treated with 75 mM NaCl, and the root length of WT plants reached 2.51 cm compared with 4.45 to 5.59 cm for transgenic lines treated with 6% PEG6000 (Figure 6B,C).

2.6. Effect of Salt Conditions on Transgenic Soybean Hairy Roots

Three transgenic soybean plants OE (the hairy root plants were infected GmCBP60A-1-OE), EV (the hairy root plants were infected pCAMBIA3301 vector) and RNAi (the hairy root plants were infected GmCBP60A-1-RNAi) were generated by A. rhizogenes-mediated hairy roots transformation (Figure 7A) to investigate the function of GmCBP60A-1 in soybean. The growth of different transgenic hairy roots soybean at V3 stage was similar under normal conditions (Figure 7A). Differential inhibition of plants growth between three transgenic hairy roots soybean seedlings was also observed following treatment with salt. In the presence of salt for three days, hairy roots plants displayed significantly wilting in both RNAi and EV. The hairy roots plants of EV showed degree of leaf yellowing at a lesser extent than RNAi hairy roots plants; at the same condition, growth of OE hairy roots seedlings was not wilt (Figure 7A). After nine days of salt treatment, the growth of hairy roots plants showed significantly wilting in both EV and OE plants, but wilt extent of EV plants growth was much more obvious than OE plants; and growth of RNAi plants was nearly dead (Figure 7A).
RNAi plants displayed wilting after irrigated NaCl solution for 3 days, but less extreme wilting in EV plants and a near-healthy appearance in OE plants (Figure 7A). Under salt stress, there were much lower levels of chlorophyll (Figure 7E) and proline (Figure 7H) and much higher levels of NOX activity (Figure 7G), MDA (Figure 7K), H2O2 (Figure 7I) and O2− (Figure 7J) in RNAi plants relative to EV plants, and opposite effects for OE plants. The assays of leaf staining could help explain that RNAi plants contained more harmful products compared to EV plants, and in turn OE plants had less noxious substances than EV plants (Figure 7B–D). In a word, GmCBP60A-1 has a positive effect on hairy root soybeans under salt treatment.

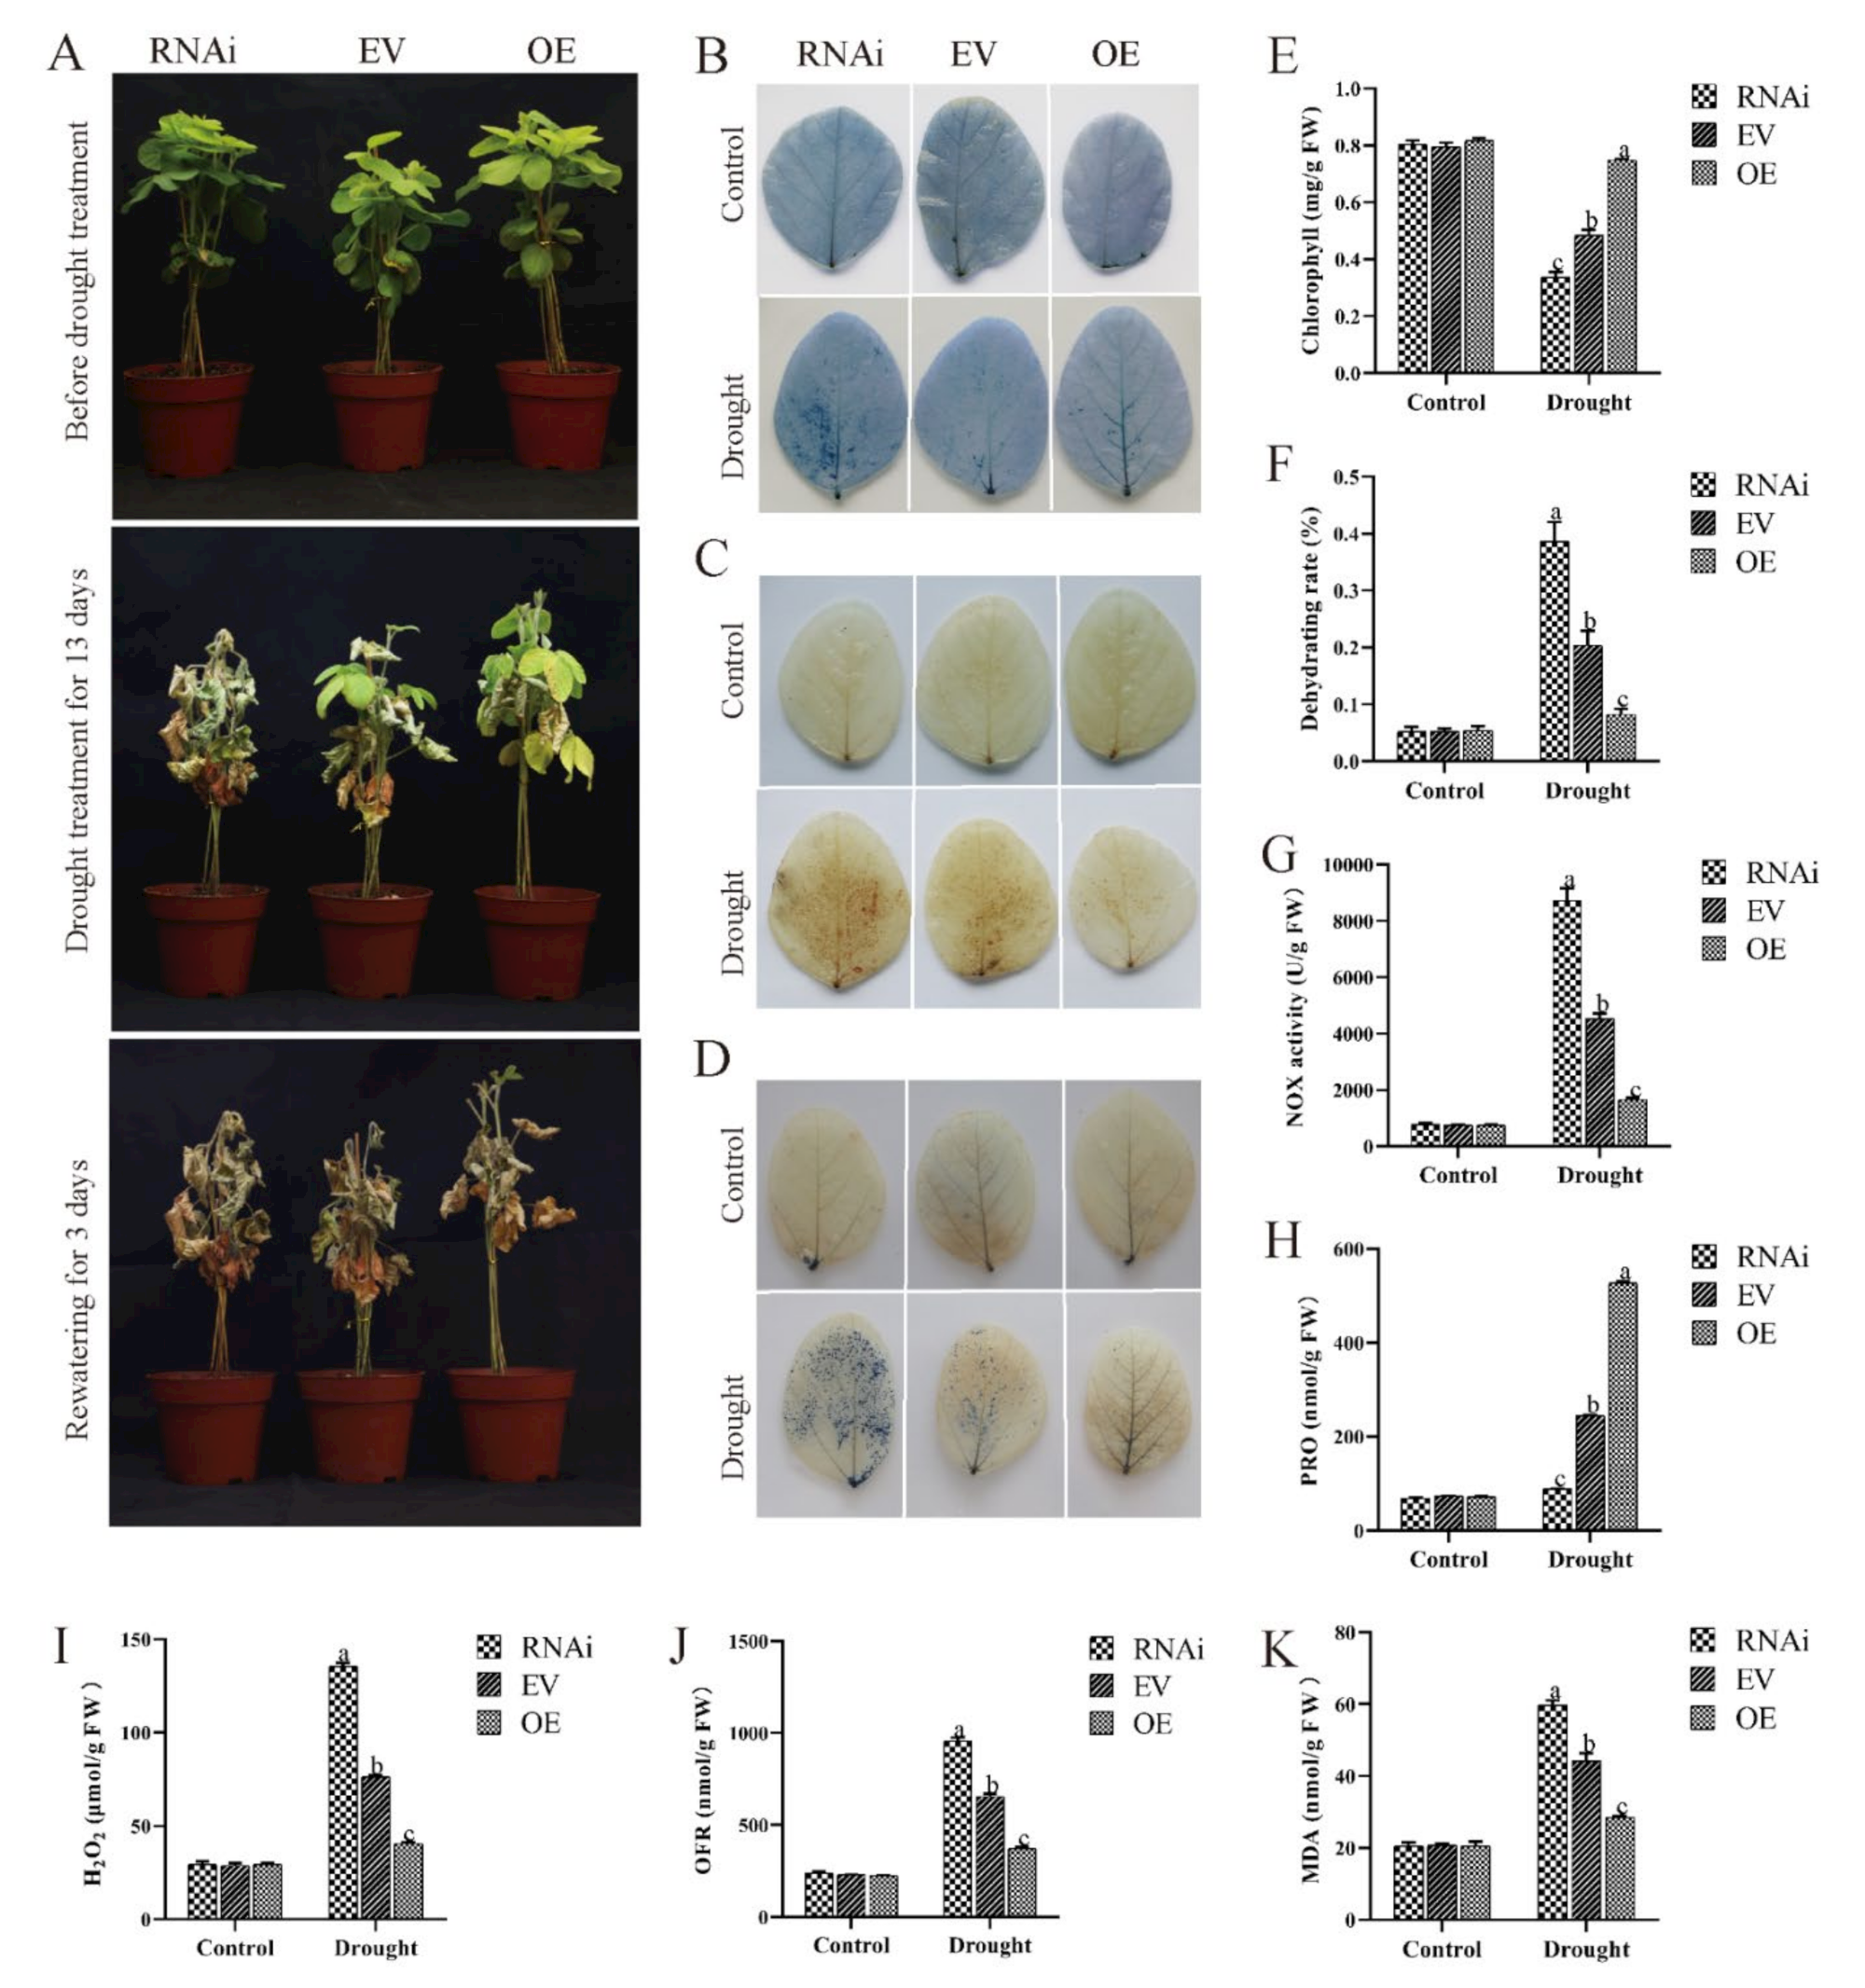
2.7. Effect of Drought Conditions on Transgenic Soybean Hairy Roots

To determine whether drought tolerance of soybeans was affected by GmCBP60A-1, different transgenic hairy roots soybean plants at V3 stage were without holding water to give plants drought stress. The growth of different plants was similar under normal conditions (Figure 8A). Differential inhibition of plants growth between three plants seedlings was also observed following treatment with drought. In the presence of drought for 13 days, plants growth displayed significantly wilting in both RNAi and EV plants, but the wilt extent of RNAi plants was much more obvious than EV plants; at the same condition, growth of OE seedlings were not wilt (Figure 8A). After rewatering for three days, OE plants grew new leaves and the recovery situation was better than that of EV plants, whereas all RNAi plants were unable to recover (Figure 8A).
Under drought stress, there were much lower levels of chlorophyll (Figure 8E) and proline (Figure 8H) and much higher levels of NOX activity (Figure 8G), MDA (Figure 8K), H2O2 (Figure 8I) and O2− (Figure 8J) in RNAi plants relative to EV plants, and opposite effects for OE plants. The assays of leaf staining could help explain that RNAi plants contained more harmful products than EV plants, contrary to OE plants (Figure 8B–D). In short, GmCBP60A-1 has a positive effect on hairy root soybeans under drought treatment.

2.8. Change of Drought-, Salt- and Ca2+-Responsive Genes in Transgenic Soybean Hairy Roots

To further explore the possible molecular mechanisms involving GmCBP60A-1 in stress responses, we chose some marker genes based on other reported studies [1,35,36,37,38]. The expression of selected marker genes, including GmSOS1 [35], GmAnnexin1 [39,40], GmCIPK24, GmCBL4, GmNHX1 [41], GmCAX3 [42], GmDREB2, GmRD20A, GmNAC11, GmERD1 [37], GmMYB118 and GmMYB174 [43], were upregulating in transgenic hairy roots soybeans under s drought and salt treatments. The upregulation of downstream regulatory genes in the OE hairy roots soybeans was much higher than that of the EV hairy roots soybeans, and upregulation in the RNAi hairy roots soybeans was lower than that in the EV (Figure 9). The data indicated that GmCBP60A-1 might activate other regulatory genes to enhance soybean tolerance to drought and salt stresses.

3. Discussion

The cytoplasmic Ca2+ concentration, known as “Ca2+ signatures”, is usually induced by a variety of biotic and abiotic stimuli [2]. CaMs/CMLs are important Ca2+-sensing proteins that decode the information carried by the Ca2+ signatures and transduce the specific Ca2+ signal to appropriate effectors [18,19]. Several transcription factor families including CAMTAs, WRKYs, MYBs, NACs and CBP60s have been identified to interact with CaMs/CMLs and play critical roles in plant response to environmental stresses [5,23]. Most CBP60 family members have been found involved in disease resistance, immunity, and SA accumulation [28,44]. However, their functions in response to abiotic stresses remain largely elusive. In this study, 19 members of the soybean CBP60 genes were identified in soybean genome. And we performed an overall analysis of the CBP60 genes in soybean, including analysis of their phylogenetic, chromosomal location, gene structure, conserved motifs and expression patterns. Compared to other species, CBP60 genes in soybean showed a closer relationship with that in Arabidopsis because they always clustered closely to each other in the phylogenetic tree (Figure 1).
Cis-acting elements are important in the regulation of many processed, including the plant growth and the stress responses [45], and analysis showed that many cis-acting elements were related to abiotic stress existed in the promoters of GmCBP60s. This result indicated that GmCBP60s were related with abiotic stress. To verify our deduction, the promoters of the soybean GmCBP60s were analyzed, and found that two important types of cis-acting elements existed in their promoters, which were DRE and ABRE. These cis-acting elements were reported to involve in plant response to abiotic stress. ABRE cis-acting element was related with ABA signal pathway. When the plants were exposed to stress conditions, ABA was accumulated, and which contributed to induction of some stress responsive genes, and ABRE cis-acting element played important roles in this induction process [46,47]. Meanwhile, DRE cis-acting element was independent of ABA signal pathway and could be bound with DREB transcription factor that was important in regulation of plant tolerance [46,48]. These results further indicated that GmCBP60s participated in plant stress response to abiotic stress. In addition, our RT-qPCR result illustrated that some GmCBP60 genes could be significantly induced under drought and salt stresses, particularly GmCBP60A-1 which had the highest expression levels under different stress conditions compared with other GmCBP60 genes (Figure 3). This result elucidated that GmCBP60A-1 may be very important in the process of plant response to abiotic stress. Further analysis showed that GmCBP60A-1 and CBP60g were divided into C3 subfamily (Figure 1). This result indicated that GmCBP60A-1 had the high homology with CBP60g, which implied that GmCBP60A-1 may have the same function with CBP60g. Meanwhile, in Arabidopsis, CBP60g have been reported to participate in plant defense responses, and which can contribute to the accumulation of SA [25,26,49,50]. In addition, some studies also revealed that overexpression of CBP60g genes in Arabidopsis can enhance drought and salt tolerance of transgenic lines [30,31]. These results explained that GmCBP60A-1 maybe have the similar functions with CBP60g gene. To verify our deduction, we generated the GmCBP60A-1 transgenic plants, and our results showed that overexpression of GmCBP60A-1 in Arabidopsis and soybean could improve plant tolerance to drought and salt stresses (Figure 5 and Figure 6), which further indicated that GmCBP60A-1 gene participate in plant stress tolerance. In addition, when the plants were treated by severe drought and salt stress, the high level of reactive oxygen species (ROS) was produced in plant, which giving rise to oxidative stress with deterioration of the tissues [51,52,53,54]. The biological function of NADPH oxidase (NOX) in plants is to generate of ROS under normal and stress conditions [51]. Higher level of NOX activity and ROS levels indicates the degree of stress on GmCBP60A-1-RNAi plants is more than EV-control, and opposite effects for GmCBP60A-1-OE plants under salt and drought stresses (Figure 7G and Figure 8G). Furthermore, MDA is an endogenous genotoxic product of enzymatic and oxygen radical-induced lipid peroxidation and the level of MDA is generally considered as a marker of oxidative stress [53]. It was confirmed that the degree of harm on GmCBP60A-1-RNAi plants was more serious than EV-control, and in turn was more serious than GmCBP60A-1-OE plants under salt and drought stresses (Figure 7K and Figure 8K). Higher level of proline proved that OE plants had strong tolerance to salt and drought conditions (Figure 7H and Figure 8H). These results also supported that GmCBP60A-1 was important in the process of plant response to abiotic stress.
Our study showed that GmCBP60A-1 can trigger the response at the transcriptional levels, such as GmSOS1, GmAnnexin1, GmCIPK24, GmCBL4, GmNHX1, GmCAX3, GmDREB2, GmRD20A, GmNAC11, GmERD1, GmMYB118 and GmMYB174. Those genes were found to be upregulated in GmCBP60A-1-OE plants under drought and salt conditions (Figure 9). These genes have been employed as salt and drought markers in previously studies [38,55]. For example, GmMYB118 transcription factor might enhance drought and salt tolerance of plants by promoting the expression of stress-associated genes and by regulating flavonoid biosynthesis to reduce ROS content [43,44]. Previous study reported that GmERD1 involved in a cascade of reactions acting directly in response to abiotic stress that plays an important role at an earlier stage in the drought response pathway [37]. In addition, RD20A is considered part of the ABA-dependent pathway [56]. NAC transcription factors are also known to activate the gene expression via stimulating other transcriptional activators such as GmDREB2 or GmERD1 [57]. The GmDREB2 activates transcription by binding to DREs [56,58]. Response to salt-stress, the Ca2+-related salt-overly-sensitive (SOS) pathway is triggered [14], including SOS1, SOS2 (CIPK24), SOS3 (CBL4), which is well-known to regulate plant in response to saline conditions [59,60,61,62]. Comprehensive description of the above results suggested GmCBP60A-1 may participate in SOS pathway to enhance the resistance of salinity and in ABA-independent pathway to improve the resistance of drought. The above results suggest that GmCBP60A-1 may play a role in decreasing ROS accumulation and affecting the accumulation of osmoregulation substances via regulation of stress-related gene expression. However, the more detailed mechanisms need to be further studied.

4. Materials and Methods

4.1. Genomic and Phylogenetic Relationships

CBP60 family members in Arabidopsis have been confirmed in previous studies [6,25,26]. The BLASTP program was used to search GmCBP60 protein sequences against soybean genome (G. max Wm82.a2. v1) from the EnsemblPlants. We searched the Pfam ID (PF07887) in Pfam website (http://pfam.xfam.org/, accessed on 20 July 2021), and downloaded the related document [63]. Then HMMER v3 and the Hidden Markov Model (HMM) was used to searched for homologous sequences in soybean genome [64,65], then validate them by SMART website (http://smart.embl-heidelberg.de/, accessed on 20 July 2021) [66]. In order to explore the relationship of CBP60 proteins in monocotyledonous and dicotyledonous plants, we obtained the sequences of rice and maize as above described. Finally, the full-length amino acid sequences were aligned using ClustalX [67] under default settings. The resulting alignments in the meg format were submitted to MEGA-X [68] to generate a maximum-likelihood bootstrapped tree (Bootstraps = 1000). The Jones–Taylor–Thoronton (JTT) model was used for the maximum likelihood tree.

4.2. Analysis of Gene Structure and cis-Acting Elements

The gene structures of GmCBP60s were illustrated using the online program GSDS (http://gsds.cbi.pku.edu.cn/, accessed on 20 July 2021) [69] by comparing predicted coding sequences with their corresponding genomic DNA sequences.
For sequence analysis of GmCBP60 motifs, the online program MEME (http://meme-suite.org/tools/meme, accessed on 20 July 2021) [70] was used for identifying conserved motifs. The resulting map was used to display the distribution of GmCBP60 motifs at the opposite positions in the GmCBP60 proteins using the TBtools v1.075 software [71].
For the analysis of cis-elements, DNA sequences of the region 2 kb upstream from the 5’ end of the gene were extracted from the EnsemblPlants database by using TBtools v1.075 software [71]. Next, the potential cis-elements of promoters for each gene were analyzed via the PlantCARE database [72], and imaging results were also obtained by the TBtools v1.075 software [71].
For the analysis of conserved domain of GmCBP60 proteins, we obtained the protein sequences from EnsemblPlants and blasted them with the TBtools v1.075 software [71].

4.3. Genomic Location of Soybean GmCBP60s

Positional information of GmCBP60s on chromosomes of soybean was obtained from the EnsemblPlants database. We used MapGene2Chrom website (http://mg2c.iask.in/mg2c_v2.0/, accessed on 20 July 2021) [73] to obtain the distribution maps of GmCBP60s on the chromosomes.

4.4. Tissue-Specific Expression Patterns

Transcription databases were obtained from the SoyBase database (https://www.soybase.org/, accessed on 20 July 2021) to analyze the tissue expression patterns of the soybean CBP60 family. TBtools software [71] was used to conduct a visual hierarchical clustering of GmCBP60s.

4.5. Subcellular Localization of GmCBP60A-1

The CDS of GmCBP60A-1 (LOC100804548) was amplified without stop codon using gene-specific primer pairs and fused into pJIT16318 vector [74] that contains a CaMV35S promoter and a C-terminal GFP (green fluorescent protein). Approximately 4 × 10⁴ mesophyll protoplasts were isolated from two-week-old Arabidopsis leaves and then transfected with the recombinant plasmid (pJIT16318-GmCBP60A-1) and the PIP2-mCherry (cytomembrane marker) [75] by PEG-mediated transformation as previously described [74]. Fluorescence in the transformed protoplasts was imaged using a confocal laser scanning microscope (LSM 700, Zeiss, Oberkochen, Germany). The primers of CBP60A1-16318-F and CBP60A1-16318-R were listed in Table S2.

4.6. Western Blot Analysis

The protein of the plant nucleus, cytoplasm and cytomembrane were isolated by using MinuteTM Plasma Membrane Protein Isolation Kit (SM-005, Invent Biotechnologies, Minnesota, America) and then the plant cytomembrane protein was detected by western blot analysis with anti-GFP (HT801-01, TransGen Biotech, Beijing, China) [76]. For the western blot analysis with anti-GFP, TGX Stain-Free FastCast Acrylamide Kit, 12% (Cat #1610185, Bio-Rad, California, America) was used and the protein gel was made following protocol. After electrophoresis, proteins were transferred to PVDF membrane, using a Bio-Rad transfer apparatus. Transfer buffer consisted of 39 mM glycine, 48 mM Tris-HCl, 20% (v/v) methanol, and 0.037% (w/v) SDS. Blots were blocked for at least 0.5 h in 5% (w/v) non-fat dry milk (CAH4859, FUJIFILM, Japan) with PBS buffer. Primary antisera (anti-GFP) were normally diluted in blocking buffer at 1:1000. Antibody incubation was performed for 1 h at room temperature. After that the membrane was washed three times with PBS buffer (five minutes once). The secondary antibody used for immunodetection was a goat anti-mouse conjugated with horseradish peroxidase (HS201-01, TransGen Biotech, Beijing, China), and was diluted at 1:5000 in blocking buffer. Antibody incubation was performed for 1 h at room temperature. After that the membrane was washed three times with PBS buffer (five minutes once). Finally, the proteins on PVDF membrane were detected by enhanced chemiluminescence (Tanon 5200, Shanghai, China) and exposure to x-ray film.

4.7. Plant Materials and Growth Conditions

Soybeans “Williams 82” as wild-type soybean in all experiments was grown on moistened soil (vermiculite: humus = 1:1) in a greenhouse with a 14 h light/10 h dark photoperiod, 28/20 °C day/night temperatures, and 60% relative humidity. Growth stages of soybeans are divided into vegetative growth stages (V) and reproductive growth stages (R). Subdivisions of the V stages are designate numerically as V1, V2, V3, through V(n) where (n) represents the number for the last node; except the first two stages, which are designated as VE (emergence) and VC (cotyledon stage) [77].
Arabidopsis (Arabidopsis thaliana) Columbia-0 (Col-0) ecotype was used in all experiments as wild-type (WT). Arabidopsis seeds were surface sterilized, and synchronized at 4 °C for three days [78,79] and germinated in petri dishes containing 1/2 Murashige and Skoog (MS) medium (supplemented with some C-source), followed by transfer to a growth chamber (22 °C, 16 h light/8 h dark photoperiod) to allow germination to start.

4.8. RNA Extraction and Reverse-Transcription Quantitative Real-Time PCR (RT-qPCR)

Plant tissues (leaf and root) were sampled after 0, 0.5, 1, 2, 4, 7, and 12 h after treatments initiated. Severe drought stress plants were sampled 0, 4, 12, 24, 36, 48, and 60 h after reaching 40% of soil moisture content.
Total RNA was isolated from 0.1 g (approximate fresh weight) of sampled soybean seedlings using a Fast Plant Total RNA Kit (ZP405-1, Zoman, Beijing, China) and then reversed transcribed into cDNA by a PrimeScriptTM RT Reagent Kit (RR037B, TaKaRa, Kyoto, Japan) following the protocol as previously described [74]. The RT-qPCR expression was using TransStart® Top Green qPCR SuperMix (+Dye I) kit (AQ132-11, TransGen Biotech, Beijing, China) and an ABI Prism 7500 sequence detection system (Applied Biosystems, Foster City, CA, USA). The list of the primers used in this study is described in Table S2. β-actin was used as a housekeeping gene [80,81,82] and it is stably expressed in our material (Figure S3). The expression levels were quantified using the 2−ΔΔCt method [83,84]. Results are represented as the mean ± standard deviation (SD) of three technical and three biological replicates.

4.9. Stresses Treatments for Genes Expression

Wild-type soybean plants on the V2 stage, were irrigated 15% PEG solution to simulate drought treatment or 150 mM NaCl solution for salt treatment [85,86,87]. Treatments used to evaluate gene expressions at different time points.
Wild-type soybean plants on the V3 stage, were withheld irrigation to induced drought stress. When the soil moisture content was controlled at 40%, samples were taken at different time points to analyze the gene expression patterns. The water content of the soil was monitored throughout the experiment by the gravimetric method [87], which corresponded to the percentage of water in the soil in relation to the dry weight of the soil.

4.10. Agrobacterium Tumefaciens Transformation of Arabidopsis

The CDS of GmCBP60A-1 was amplified with stop codon using gene-specific primer pairs and fused into pCAMBIA-1302 vector that contains a CaMV35S promoter. The recombinant plasmid was introduced in the A. tumefaciens strain GV3101 and transformed into WT by floral dip method [88,89] for constructing GmCBP60A-1 transgenic Arabidopsis. The T1 generation seeds were harvested after infection and initially screened by 1/2 MS mediums containing hygromycin (35 mg/L) until the homozygous T3 generation of transgenic Arabidopsis lines. As for the seedlings of T1, we extracted the RNA for RT-qPCR to confirm the expression level (Figure S4A). The primers of CBP60A1-1302-F and CBP60A1-1302-R were listed in Table S2.

4.11. In Vitro Germination and Root Growth Assays

Treatments used to evaluate Arabidopsis phenotypes in vitro simulated drought and salinity stresses, respectively. The in vitro germination and root growth assays were conducted on 1/2 MS medium containing different concentrations of PEG (3%, 6% and 9%) or NaCl (75 mM and 100 mM) [90,91]. The germination rates were recorded every 12 h until the seeds germinated completely. Three independent biological repeats were performed for seed germination assays. The root lengths of seedlings were evaluated after 7 days of stress treatments [91]. Three biological repeats were performed, and at least twenty seedlings of each genotype were measured by WinRHIZO Pro V2013e software.

4.12. A. Rhizogenes Transformation of Soybean Hairy Roots

The CDS of GmCBP60A-1 was amplified with stop codon using gene-specific primer pairs and fused into pCAMBIA3301 vector under the CaMV35S promoter to generate GmCBP60A-1-overexpressing (GmCBP60A-1-OE) vector. For the GmCBP60A-1 RNA interference (GmCBP60A-1-RNAi) construct, a specific fragment, including a 200 bp GmCBP60A-1 sense sequence and its antisense sequence, and a 146 bp intron fragment of maize alcohol dehydrogenase gene as a spacer between the sense and antisense fragments, was synthesized (AUGCT, Beijing, China) and inserted into pCAMBIA3301. Relative sequences were listed in Table S2. The recombinant vectors and empty pCAMBIA3301 vector (EV) were independently introduced in the A. rhizogenes strain K599 and transformed into soybean (G. max cv. Williams 82) by the method of A. rhizogenes-mediated transformation of soybean [92]. The RT-qPCR analysis of GmCBP60A-1 expression in GmCBP60A-1-OE, EV-control and GmCBP60A-1-RNAi transgenic hairy root plants before processing (Figure S4B). Each of the hairy root-related experiments was replicated at least three times independently. The primers of CBP60A1-3301-F and CBP60A1-3301-R were listed in Table S2.

4.13. Salt and Drought Stress Assay

Treatments used to evaluate hairy root soybean plants in vitro were severe drought and salinity. The hairy root soybean plants grew on moistened soil that was weighed to ensure the same amount of water in all the pots. Severe salt stress was induced by irrigating 250 mM NaCl solution at V3 developmental stage [44]. The plants did not receive any additional watering after the single application of the salt treatment. We had been starting to irrigate the plants with 1 L NaCl solution (250 mM) for three times per pot since the soil contained 40% of the water at least, until all plants are gradually death. Severe drought stress was induced by withholding irrigation at V3 developmental stage. The water content of the soil was monitored by the gravimetric method [87] until reach 40% of soil moisture content in relation to soil dry weight. Hairy-rooted soybean plants grew under these conditions and deprived of water until after all plants appeared nearly senesce. All the pots were randomly distributed in a flat (one flat per treatment) and were rotated frequently during the stress periods to minimize effects of the growth environment. In this experiment, five independent transformation hairy root soybean plants were placed in one pot. Six pots formed a group. Each treatment contained three groups GmCBP60A-1-OE, EV-control and GmCBP60A-1-RNAi transgenic hairy root plants. The same treatment was replicated for three times.

4.14. Detection of Physiological Indicators after Salt and Drought Treatments

Contents of proline (PRO-1-Y, Comin, Suzhou, http://www.cominbio.com/, accessed on 20 July 2021, China), MDA (MDA-1-Y, Comin, Suzhou, China), NOX (NOX-1-Y, Comin, Suzhou,China), H2O2 (BC3590, Solarbio, http://www.solarbio.com/, accessed on 20 July 2021, Beijing, China) and O2− (BC1290, Solarbio, Beijing, China) were measured using their corresponding assay kits following the manufacturer’s protocols. The measurement of chlorophyll content was carried out as described by previously described [93]. All measurements were collected from three biological replicates.

4.15. Staining after Salt and Drought Treatments

After drought or salt treatment, we took at least five independent leaves as samples. All samples were sampled from the same location in different hairy root soybean plants. The samples were completely immersed in a 0.5% trypan solution (Solarbio, Beijing, China) for 12 h, then immersed in 75% ethanol for decolorization until the samples turned white, and finally photographed to visualize the staining. Separate sets of five samples were stained with either, 0.5% trypan solution, DAB, or NBT solution for 12, 6, or 4 h, respectively. Samples were subsequently decolorized in 75% ethanol until they turned white. Then all samples were photographed to visualize the staining. All stains were obtained from Solarbio (Beijing, China).

4.16. Statistical Analysis

The values were shown as mean ± standard deviation (SD). The data was subjected to Student’s t test analysis using statistical soft SPSS 17.0, and the significance (p < 0.01) was labeled with **; and *, p < 0.05. ANOVA analysis was conducted by SPSS 17.0, and significance (p < 0.01) was labeled with different letters.

5. Conclusions

We characterized the GmCBP60A-1 gene as a positive regulator of drought and salt tolerance in soybean. It may enhance drought and salt tolerance by affecting the accumulation of osmoregulation substances, the balance of ROS and the reprogramming of stress tolerance related genes. This study provides new insights in the functional analysis of GmCBP60 genes in response to abiotic stresses.

Supplementary Materials

The following are available online at https://www.mdpi.com/article/10.3390/ijms222413501/s1.

Author Contributions

Z.-S.X. coordinated the project, conceived and designed experiments, and edited the manuscript. Q.Y. and Y.-X.L. performed experiments and wrote the first draft. Z.-S.X. and J.-H.L. revised the manuscript. G.-Z.S., Y.-L.L., J.C., Y.-B.Z. and M.C. contributed to data analysis and managed reagents. J.-H.L. and Y.-Z.M. contributed with valuable discussions. All authors have read and agreed to the published version of the manuscript.

Funding

This research was financially supported by the National Natural Science Foundation of China (31871624), the Agricultural Science and Technology Innovation Program (CAAS-ZDRW202109 and CAAS-ZDRW202002), and Chinese Academy of Agricultural Sciences and the central government of Shandong Province guides the development of local science and technology (YDZX20203700002548).

Data Availability Statement

The datasets presented in this study can be found in online repositories. The names of the repository/repositories and accession number(s) can be found below: NCBI SRA [accession: PRJNA694374].

Acknowledgments

We are grateful to Lijuan Qiu and Tianfu Han of the Institute of Crop Science, Chinese Academy of Agricultural Sciences (CAAS) for kindly providing soybean seeds. Additionally, we are grateful to Wensheng Hou and Hui Zhang of the Institute of Crop Science, CAAS for kindly providing vectors and the protocol for high-efficiency A. rhizogenes-mediated transformation, respectively.

Conflicts of Interest

The authors declare no conflict of interest. The funder had no role in the design of the study; in the collection, analyses, or interpretation of data; in the writing of the manuscript, or in the decision to publish the results.

Abbreviations

A. rhizogenes: Agrobacterium rhizogenes; BR: Brassinosteroid; ABA: Abscisic acid; CBP60: CaM-binding protein; RT-qPCR: Reverse-transcription quantitative real-time PCR; GFP: Green fluorescent protein; MDA: Malondialdehyde; PRO: Proline; PEG: Polyethylene glycol; ABRE: ABA-responsive element; DRE: Dehydration-responsive element.

References

  1. Zhu, J.K. Salt and drought stress signal transduction in plants. Annu. Rev. Plant Biol. 2002, 53, 247–273. [Google Scholar] [CrossRef] [PubMed] [Green Version]
  2. Medvedev, S.S. Calcium signaling system in plants. Russ. J. Plant Physiol. 2005, 52, 249–270. [Google Scholar] [CrossRef]
  3. Kumar, P.P. Regulation of biotic and abiotic stress responses by plant hormones. Plant Cell Rep. 2013, 32, 943. [Google Scholar] [CrossRef] [PubMed] [Green Version]
  4. Peck, S.; Mittler, R. Plant signaling in biotic and abiotic stress. J. Exp. Bot. 2020, 71, 1649–1651. [Google Scholar] [CrossRef] [Green Version]
  5. Kim, M.C.; Chung, W.S.; Yun, D.J.; Cho, M.J. Calcium and calmodulin-mediated regulation of gene expression in plants. Mol. Plant 2009, 2, 13–21. [Google Scholar] [CrossRef] [PubMed] [Green Version]
  6. Wang, L.; Tsuda, K.; Sato, M.; Cohen, J.D.; Katagiri, F.; Glazebrook, J. Arabidopsis CaM Binding Protein CBP60g Contributes to MAMP-Induced SA Accumulation and Is Involved in Disease Resistance against Pseudomonas syringae. PLoS Pathog. 2009, 5, e1000301. [Google Scholar] [CrossRef] [Green Version]
  7. Halling, D.B.; Liebeskind, B.J.; Hall, A.W.; Aldrich, R.W. Conserved properties of individual Ca2+-binding sites in calmodulin. Proc. Natl. Acad. Sci. USA 2016, 113, E1216–E1225. [Google Scholar] [CrossRef] [Green Version]
  8. White, P.J.; Broadley, M.R. Calcium in plants. Ann. Bot. 2003, 92, 487–511. [Google Scholar] [CrossRef]
  9. Kudla, J.; Becker, D.; Grill, E.; Hedrich, R.; Hippler, M.; Kummer, U.; Parniske, M.; Romeis, T.; Schumacher, K. Advances and current challenges in calcium signaling. New Phytol. 2018, 218, 414–431. [Google Scholar] [CrossRef]
  10. White, P.J. Calcium channels in higher plants. Biochim. Biophys. Acta (BBA) Biomembr. 2000, 1465, 171–189. [Google Scholar] [CrossRef] [Green Version]
  11. Edel, K.H.; Marchadier, E.; Brownlee, C.; Kudla, J.; Hetherington, A.M. The Evolution of Calcium-Based Signalling in Plants. Curr. Biol. 2017, 27, R667–R679. [Google Scholar] [CrossRef]
  12. Tian, W.; Wang, C.; Gao, Q.; Li, L.; Luan, S. Calcium spikes, waves and oscillations in plant development and biotic interactions. Nat. Plants 2020, 6, 759. [Google Scholar] [CrossRef]
  13. Dodd, A.N.; Kudla, J.; Sanders, D. The Language of Calcium Signaling. Annu. Rev. Plant Biol. 2010, 61, 620. [Google Scholar] [CrossRef]
  14. Tang, R.J.; Zhao, F.G.; Yang, Y.; Wang, C.; Li, K.; Kleist, T.J.; Lemaux, P.G.; Luan, S. A calcium signalling network activates vacuolar K(+) remobilization to enable plant adaptation to low-K environments. Nat. Plants 2020, 6, 384–393. [Google Scholar] [CrossRef]
  15. Shao, H.-B.; Chu, L.-Y.; Shao, M.-A.; Li, S.-Q.; Yao, J.-C. Bioengineering plant resistance to abiotic stresses by the global calcium signal system. Biotechnol. Adv. 2008, 26, 503–510. [Google Scholar] [CrossRef]
  16. Clapham, D.E. CALCIUM SIGNALING. Cell 1995, 80, 259–268. [Google Scholar] [CrossRef] [Green Version]
  17. Aldon, D.; Mbengue, M.; Mazars, C.; Galaud, J.P. Calcium Signalling in Plant Biotic Interactions. Int. J. Mol. Sci. 2018, 19, 665. [Google Scholar] [CrossRef] [Green Version]
  18. Batistic, O.; Kudla, J. Analysis of calcium signaling pathways in plants. Biochim. Biophys. Acta Gen. Subj. 2012, 1820, 1283–1293. [Google Scholar] [CrossRef]
  19. Galon, Y.; Finkler, A.; Fromm, H. Calcium-Regulated Transcription in Plants. Mol. Plant 2010, 3, 653–669. [Google Scholar] [CrossRef]
  20. Christine, P.; Nour-eddine, L.; Monique, T. Evolution of the “EF-hand” family of calcium-binding proteins. Calcium Bind. Proteins Norm. Transform. Cells 1990, 269, 17–20. [Google Scholar] [CrossRef]
  21. Luan, S.; Kudla, J.; Rodriguez-Concepcion, M.; Yalovsky, S.; Gruissem, W. Calmodulins and calcineurin B-like proteins: Calcium sensors for specific signal response coupling in plants. Plant Cell 2002, 14, S389–S400. [Google Scholar] [CrossRef] [PubMed] [Green Version]
  22. Reddy, A.S.N.; Ali, G.S.; Celesnik, H.; Day, I.S. Coping with Stresses: Roles of Calcium- and Calcium/Calmodulin-Regulated Gene Expression. Plant Cell 2011, 23, 2010–2032. [Google Scholar] [CrossRef] [PubMed] [Green Version]
  23. Evans, N.H.; McAinsh, M.R.; Hetherington, A.M. Calcium oscillations in higher plants. Curr. Opin. Plant Biol. 2001, 4, 415–420. [Google Scholar] [CrossRef]
  24. Bouche, N.; Yellin, A.; Snedden, W.A.; Fromm, H. Plant-specific calmodulin-binding proteins. Annu. Rev. Plant Biol. 2005, 56, 435–466. [Google Scholar] [CrossRef] [PubMed]
  25. Truman, W.; Sreekanta, S.; Lu, Y.; Bethke, G.; Tsuda, K.; Katagiri, F.; Glazebrook, J. The CALMODULIN-BINDING PROTEIN60 Family Includes Both Negative and Positive Regulators of Plant Immunity. Plant Physiol. 2013, 163, 1741–1751. [Google Scholar] [CrossRef] [Green Version]
  26. Wang, L.; Tsuda, K.; Truman, W.; Sato, M.; Nguyen, L.V.; Katagiri, F.; Glazebrook, J. CBP60g and SARD1 play partially redundant critical roles in salicylic acid signaling. Plant J. 2011, 67, 1029–1041. [Google Scholar] [CrossRef]
  27. Du, L.; Ali, G.S.; Simons, K.A.; Hou, J.; Yang, T.; Reddy, A.S.N.; Poovaiah, B.W. Ca2+/calmodulin regulates salicylic-acid-mediated plant immunity. Nature 2009, 457, 1154–1158. [Google Scholar] [CrossRef]
  28. Zhang, Y.; Xu, S.; Ding, P.; Wang, D.; Cheng, Y.T.; He, J.; Gao, M.; Xu, F.; Li, Y.; Zhu, Z.; et al. Control of salicylic acid synthesis and systemic acquired resistance by two members of a plant-specific family of transcription factors. Proc. Natl. Acad. Sci. USA 2010, 107, 18220–18225. [Google Scholar] [CrossRef] [Green Version]
  29. Zou, B.; Wan, D.; Li, R.; Han, X.; Li, G.; Wang, R. Calmodulin-binding protein CBP60g functions as a negative regulator in Arabidopsis anthocyanin accumulation. PLoS ONE 2017, 12, e0173129. [Google Scholar] [CrossRef]
  30. Wan, D.; Li, R.; Zou, B.; Zhang, X.; Cong, J.; Wang, R.; Xia, Y.; Li, G. Calmodulin-binding protein CBP60g is a positive regulator of both disease resistance and drought tolerance in Arabidopsis. Plant Cell Rep. 2012, 31, 1269–1281. [Google Scholar] [CrossRef]
  31. Pallegar, P. Functional Analysis of Two Brassinosteroid Responsive, Putative Calmodulin-Binding Proteins 60 (CBP60s) in Arabidopsis Thaliana. Master’s Thesis, The University of Western Ontario, London, ON, Canada, 2014. Available online: https://ir.lib.uwo.ca/etd/2041 (accessed on 20 July 2021).
  32. Dresselhaus, T.; Hueckelhoven, R. Biotic and Abiotic Stress Responses in Crop Plants. Agronomy 2018, 8, 267. [Google Scholar] [CrossRef] [Green Version]
  33. Guan, R.; Qu, Y.; Guo, Y.; Yu, L.; Liu, Y.; Jiang, J.; Chen, J.; Ren, Y.; Liu, G.; Tian, L.; et al. Salinity tolerance in soybean is modulated by natural variation in GmSALT3. Plant J. 2014, 80, 937–950. [Google Scholar] [CrossRef] [Green Version]
  34. Shi, W.-Y.; Du, Y.-T.; Ma, J.; Min, D.-H.; Jin, L.-G.; Chen, J.; Chen, M.; Zhou, Y.-B.; Ma, Y.-Z.; Xu, Z.-S.; et al. The WRKY Transcription Factor GmWRKY12 Confers Drought and Salt Tolerance in Soybean. Int. J. Mol. Sci. 2018, 19, 4087. [Google Scholar] [CrossRef] [Green Version]
  35. Xiong, L.; Schumaker, K.S.; Zhu, J.K. Cell signaling during cold, drought, and salt stress. Plant Cell 2002, 14, S165–S183. [Google Scholar] [CrossRef] [Green Version]
  36. Shinozaki, K.; Yamaguchi-Shinozaki, K.; Seki, M. Regulatory network of gene expression in the drought and cold stress responses. Curr. Opin. Plant Biol. 2003, 6, 410–417. [Google Scholar] [CrossRef]
  37. Shinozaki, K.; Yamaguchi-Shinozaki, K. Gene networks involved in drought stress response and tolerance. J. Exp. Bot. 2007, 58, 221–227. [Google Scholar] [CrossRef] [Green Version]
  38. Huang, G.-T.; Ma, S.-L.; Bai, L.-P.; Zhang, L.; Ma, H.; Jia, P.; Liu, J.; Zhong, M.; Guo, Z.-F. Signal transduction during cold, salt, and drought stresses in plants. Mol. Biol. Rep. 2012, 39, 969–987. [Google Scholar] [CrossRef]
  39. Gerke, V.; Moss, S.E. Annexins: From structure to function. Physiol. Rev. 2002, 82, 331–371. [Google Scholar] [CrossRef]
  40. Gerke, V.; Creutz, C.E.; Moss, S.E. Annexins: Linking Ca2+ signalling to membrane dynamics. Nat. Rev. Mol. Cell Biol. 2005, 6, 449–461. [Google Scholar] [CrossRef]
  41. Yang, L.; Han, Y.; Wu, D.; Yong, W.; Liu, M.; Wang, S.; Liu, W.; Lu, M.; Wei, Y.; Sun, J. Salt and cadmium stress tolerance caused by overexpression of the Glycine Max Na+/H+ Antiporter (GmNHX1) gene in duckweed (Lemna turionifera 5511). Aquat. Toxicol. 2017, 192, 127–135. [Google Scholar] [CrossRef]
  42. Wang, G.; Zeng, H.; Hu, X.; Zhu, Y.; Chen, Y.; Shen, C.; Wang, H.; Poovaiah, B.W.; Du, L. Identification and expression analyses of calmodulin-binding transcription activator genes in soybean. Plant Soil 2014, 386, 205–221. [Google Scholar] [CrossRef]
  43. Wang, F.; Chen, H.-W.; Li, Q.-T.; Wei, W.; Li, W.; Zhang, W.-K.; Ma, B.; Bi, Y.-D.; Lai, Y.-C.; Liu, X.-L.; et al. GmWRKY27 interacts with GmMYB174 to reduce expression of GmNAC29 for stress tolerance in soybean plants. Plant J. 2015, 83, 224–236. [Google Scholar] [CrossRef] [Green Version]
  44. Du, Y.-T.; Zhao, M.-J.; Wang, C.-T.; Gao, Y.; Wang, Y.-X.; Liu, Y.-W.; Chen, M.; Chen, J.; Zhou, Y.-B.; Xu, Z.-S.; et al. Identification and characterization of GmMYB118 responses to drought and salt stress. BMC Plant Biol. 2018, 18, 320. [Google Scholar] [CrossRef]
  45. Yamaguchi-Shinozaki, K.; Shinozaki, K. Organization of cis-acting regulatory elements in osmotic- and cold-stress-responsive promoters. Trends Plant Sci. 2005, 10, 88–94. [Google Scholar] [CrossRef] [PubMed]
  46. Narusaka, Y.; Nakashima, K.; Shinwari, Z.K.; Sakuma, Y.; Furihata, T.; Abe, H.; Narusaka, M.; Shinozaki, K.; Yamaguchi-Shinozaki, K. Interaction between two cis-acting elements, ABRE and DRE, in ABA-dependent expression of Arabidopsis rd29A gene in response to dehydration and high-salinity stresses. Plant J. 2003, 34, 137–148. [Google Scholar] [CrossRef] [PubMed]
  47. Shinozaki, K.; Yamaguchi-Shinozaki, K. Gene Expression and Signal Transduction in Water-Stress Response. Plant Physiol. 1997, 115, 334. [Google Scholar] [CrossRef] [PubMed] [Green Version]
  48. Zhao, T.J.; Sun, S.; Liu, Y.; Liu, J.M.; Liu, Q.; Yan, Y.B.; Zhou, H.M. Regulating the drought-responsive element (DRE)-mediated signaling pathway by synergic functions of trans-active and trans-inactive DRE binding factors in Brassica napus. J. Biol. Chem. 2006, 281, 10752–10759. [Google Scholar] [CrossRef] [PubMed] [Green Version]
  49. Qin, J.; Wang, K.; Sun, L.; Xing, H.; Wang, S.; Li, L.; Chen, S.; Guo, H.-S.; Zhang, J. The plant-specific transcription factors CBP60g and SARD1 are targeted by a Verticillium secretory protein VdSCP41 to modulate immunity. Elife 2018, 7, e34902. [Google Scholar] [CrossRef]
  50. Lu, Y.; Truman, W.; Liu, X.; Bethke, G.; Zhou, M.; Myers, C.L.; Katagiri, F.; Glazebrook, J. Different Modes of Negative Regulation of Plant Immunity by Calmodulin-Related Genes. Plant Physiol. 2018, 176, 3061. [Google Scholar] [CrossRef] [Green Version]
  51. Bedard, K.; Krause, K.H. The NOX family of ROS-generating NADPH oxidases: Physiology and pathophysiology. Physiol. Rev. 2007, 87, 245–313. [Google Scholar] [CrossRef]
  52. Farmer, E.E.; Mueller, M.J. ROS-Mediated Lipid Peroxidation and RES-Activated Signaling. Annu. Rev. Plant Biol. 2013, 64, 429–450. [Google Scholar] [CrossRef]
  53. Anjum, N.A.; Sofo, A.; Scopa, A.; Roychoudhury, A.; Gill, S.S.; Iqbal, M.; Lukatkin, A.S.; Pereira, E.; Duarte, A.C.; Ahmad, I. Lipids and proteins—Major targets of oxidative modifications in abiotic stressed plants. Environ. Sci. Pollut. Res. 2015, 22, 4099–4121. [Google Scholar] [CrossRef]
  54. Das, K.; Roychoudhury, A. Reactive oxygen species (ROS) and response of antioxidants as ROS-scavengers during environmental stress in plants. Front. Environ. Sci. 2014, 2, 53. [Google Scholar] [CrossRef] [Green Version]
  55. Stolf-Moreira, R.; Lemos, E.G.M.; Carareto-Alves, L.; Marcondes, J.; Pereira, S.S.; Rolla, A.A.P.; Pereira, R.M.; Neumaier, N.; Binneck, E.; Abdelnoor, R.V.; et al. Transcriptional Profiles of Roots of Different Soybean Genotypes Subjected to Drought Stress. Plant Mol. Biol. Report. 2011, 29, 19–34. [Google Scholar] [CrossRef]
  56. Chen, M.; Wang, Q.-Y.; Cheng, X.-G.; Xu, Z.-S.; Li, L.-C.; Ye, X.-G.; Xia, L.-Q.; Ma, Y.-Z. GmDREB2, a soybean DRE-binding transcription factor, conferred drought and high-salt tolerance in transgenic plants. Biochem. Biophys. Res. Commun. 2007, 353, 299–305. [Google Scholar] [CrossRef]
  57. Hao, Y.J.; Wei, W.; Song, Q.X.; Chen, H.W.; Zhang, Y.Q.; Wang, F.; Zou, H.F.; Lei, G.; Tian, A.G.; Zhang, W.K.; et al. Soybean NAC transcription factors promote abiotic stress tolerance and lateral root formation in transgenic plants. Plant J. 2011, 68, 302–313. [Google Scholar] [CrossRef]
  58. Kim, J.-S.; Mizoi, J.; Yoshida, T.; Fujita, Y.; Nakajima, J.; Ohori, T.; Todaka, D.; Nakashima, K.; Hirayama, T.; Shinozaki, K.; et al. An ABRE Promoter Sequence is Involved in Osmotic Stress-Responsive Expression of the DREB2A Gene, Which Encodes a Transcription Factor Regulating Drought-Inducible Genes in Arabidopsis. Plant Cell Physiol. 2011, 52, 2146. [Google Scholar] [CrossRef]
  59. Shi, H.Z.; Ishitani, M.; Kim, C.S.; Zhu, J.K. The Arabidopsis thaliana salt tolerance gene SOS1 encodes a putative Na+/H+ antiporter. Proc. Natl. Acad. Sci. USA 2000, 97, 6896–6901. [Google Scholar] [CrossRef] [Green Version]
  60. Rainaldi, M.; Yamniuk, A.P.; Murase, T.; Vogel, H.J. Calcium-dependent and -independent binding of soybean calmodulin isoforms to the calmodulin binding domain of tobacco MAPK phosphatase-1. J. Exp. Bot. 2007, 282, 6031–6042. [Google Scholar] [CrossRef] [Green Version]
  61. Zhu, M.; Shabala, L.; Cuin, T.A.; Huang, X.; Zhou, M.; Munns, R.; Shabala, S. Nax loci affect SOS1-like Na+/H+ exchanger expression and activity in wheat. J. Exp. Bot. 2016, 67, 835–844. [Google Scholar] [CrossRef] [Green Version]
  62. Quintero, F.J.; Martinez-Atienza, J.; Villalta, I.; Jiang, X.; Kim, W.-Y.; Ali, Z.; Fujii, H.; Mendoza, I.; Yun, D.-J.; Zhu, J.-K.; et al. Activation of the plasma membrane Na/H antiporter Salt-Overly-Sensitive 1 (SOS1) by phosphorylation of an auto-inhibitory C-terminal domain. Proc. Natl. Acad. Sci. USA 2011, 108, 2611–2616. [Google Scholar] [CrossRef] [PubMed] [Green Version]
  63. Finn, R.D.; Bateman, A.; Clements, J.; Coggill, P.; Eberhardt, R.Y.; Eddy, S.R.; Heger, A.; Hetherington, K.; Holm, L.; Mistry, J.; et al. Pfam: The protein families database. Nucleic Acids Res. 2014, 42, D222–D230. [Google Scholar] [CrossRef] [PubMed] [Green Version]
  64. Phelps, R.W. Hummer—War horse of desert-storm meets minings mud and muck. E&Mj Eng. Min. J. 1995, 196, 36–38. [Google Scholar]
  65. Krogh, A.; Salzberg, S.L.; Searls, D.B.; Kasif, S. Chapter 4—An introduction to hidden Markov models for biological sequences. New Compr. Biochem. 1998, 32, 45–63. [Google Scholar]
  66. Letunic, I.; Khedkar, S.; Bork, P. SMART: Recent updates, new developments and status in 2020. Nucleic Acids Res. 2021, 49, D458–D460. [Google Scholar] [CrossRef]
  67. Chenna, R.; Sugawara, H.; Koike, T.; Lopez, R.; Gibson, T.J.; Higgins, D.G.; Thompson, J.D. Multiple sequence alignment with the Clustal series of programs. Nucleic Acids Res. 2003, 31, 3497–3500. [Google Scholar] [CrossRef] [Green Version]
  68. Kumar, S.; Stecher, G.; Li, M.; Knyaz, C.; Tamura, K. MEGA X: Molecular Evolutionary Genetics Analysis across Computing Platforms. Mol. Biol. Evol. 2018, 35, 1547–1549. [Google Scholar] [CrossRef]
  69. Guo, A.; Zhu, Q.; Chen, X.; Luo, J. GSDS: A gene structure display server. Hereditas 2007, 29, 1023–1026. [Google Scholar] [CrossRef]
  70. Bailey, T.L.; Boden, M.; Buske, F.A.; Frith, M.; Grant, C.E.; Clementi, L.; Ren, J.; Li, W.W.; Noble, W.S. MEME SUITE: Tools for motif discovery and searching. Nucleic Acids Res. 2009, 37, W202–W208. [Google Scholar] [CrossRef]
  71. Chen, C.; Chen, H.; Zhang, Y.; Thomas, H.R.; Frank, M.H.; He, Y.; Xia, R. TBtools: An Integrative Toolkit Developed for Interactive Analyses of Big Biological Data. Mol. Plant 2020, 13, 1194–1202. [Google Scholar] [CrossRef]
  72. Lescot, M.; Dehais, P.; Thijs, G.; Marchal, K.; Moreau, Y.; Van de Peer, Y.; Rouze, P.; Rombauts, S. PlantCARE, a database of plant cis-acting regulatory elements and a portal to tools for in silico analysis of promoter sequences. Nucleic Acids Res. 2002, 30, 325–327. [Google Scholar] [CrossRef]
  73. Chao, J.; Kong, Y.; Wang, Q.; Sun, Y.; Gong, D.; Lv, J.; Guanshan, L. MapGene2Chrom, a tool to draw gene physical map based on Perl and SVG languages. Hereditas 2015, 37, 91–97. [Google Scholar] [CrossRef]
  74. Cui, X.-Y.; Gao, Y.; Guo, J.; Yu, T.-F.; Zheng, W.-J.; Liu, Y.-W.; Chen, J.; Xu, Z.-S.; Ma, Y.-Z. BES/BZR Transcription Factor TaBZR2 Positively Regulates Drought Responses by Activation of TaGST1. Plant Physiol. 2019, 180, 605–620. [Google Scholar] [CrossRef] [Green Version]
  75. Lee, H.K.; Cho, S.K.; Son, O.; Xu, Z.; Hwang, I.; Kim, W.T. Drought Stress-Induced Rma1H1, a RING Membrane-Anchor E3 Ubiquitin Ligase Homolog, Regulates Aquaporin Levels via Ubiquitination in Transgenic Arabidopsis Plants. Plant Cell 2009, 21, 622–641. [Google Scholar] [CrossRef] [Green Version]
  76. Chung, W.S.; Lee, S.H.; Kim, J.C.; Heo, W.D.; Kim, M.C.; Park, C.Y.; Park, H.C.; Lim, C.O.; Kim, W.B.; Harper, J.F.; et al. Identification of a calmodulin-regulated soybean Ca2+-ATPase (SCA1) that is located in the plasma membrane. Plant Cell 2000, 12, 1393–1407. [Google Scholar] [CrossRef] [Green Version]
  77. Wright, D.; Lenssen, A.W.; Staging Soybean Development. In Agriculture and Environment Extension Publications; 2013. Available online: https://dr.lib.iastate.edu/handle/20.500.12876/33118 (accessed on 20 July 2021).
  78. Gilmour, S.J.; Hajela, R.K.; Thomashow, M.F. Cold Acclimation in Arabidopsis thaliana. Plant Physiol. 1988, 87, 745–750. [Google Scholar] [CrossRef] [Green Version]
  79. Penfield, S.; Springthorpe, V. Understanding chilling responses in Arabidopsis seeds and their contribution to life. Philos. Trans. R. Soc. B 2012, 367, 291–297. [Google Scholar] [CrossRef] [Green Version]
  80. Radonic, A.; Thulke, S.; Mackay, I.M.; Landt, O.; Siegert, W.; Nitsche, A. Guideline to reference gene selection for quantitative real-time PCR. Biochem. Biophys. Res. Commun. 2004, 313, 856–862. [Google Scholar] [CrossRef]
  81. Hu, R.; Fan, C.; Li, H.; Zhang, Q.; Fu, Y.-F. Evaluation of putative reference genes for gene expression normalization in soybean by quantitative real-time RT-PCR. BMC Mol. Biol. 2009, 10, 93. [Google Scholar] [CrossRef] [Green Version]
  82. Lupberger, J.; Kreuzer, K.A.; Baskaynak, G.; Peters, U.R.; le Coutre, P.; Schmidt, C.A. Quantitative analysis of beta-actin, beta-2-microglobulin and porphobilinogen deaminase mRNA and their comparison as control transcripts for RT-PCR. Mol. Cell. Probes 2002, 16, 25–30. [Google Scholar] [CrossRef] [Green Version]
  83. Livak, K.J.; Schmittgen, T.D. Analysis of relative gene expression data using real-time quantitative PCR and the 2(-Delta Delta C(T)) Method. Methods 2001, 25, 402–408. [Google Scholar] [CrossRef] [PubMed]
  84. Schmittgen, T.D.; Livak, K.J. Analyzing real-time PCR data by the comparative CT method. Nat. Protoc. 2008, 3, 1101–1108. [Google Scholar] [CrossRef] [PubMed]
  85. Li, Y.; Chen, Q.; Nan, H.; Li, X.; Lu, S.; Zhao, X.; Liu, B.; Guo, C.; Kong, F.; Cao, D. Overexpression of GmFDL19 enhances tolerance to drought and salt stresses in soybean. PLoS ONE 2017, 12, e0179554. [Google Scholar] [CrossRef] [PubMed] [Green Version]
  86. Sunaryo, W.; Widoretno, W.; Nurhasanah, N.; Sudarsono, S. Drought tolerance selection of soybean lines generated from somatic embryogenesis using osmotic stress simulation of polyethylene glycol (PEG). Nusant. Biosci. 1970, 8, 45–54. [Google Scholar] [CrossRef]
  87. Alvim, F.C.; Carolino, S.M.B.; Cascardo, J.C.M.; Nunes, C.C.; Martinez, C.A.; Otoni, W.C.; Fontes, E.P.B. Enhanced accumulation of BiP in transgenic plants confers tolerance to water stress. Plant Physiol. 2001, 126, 1042–1054. [Google Scholar] [CrossRef] [Green Version]
  88. Zhang, X.; Henriques, R.; Lin, S.-S.; Niu, Q.-W.; Chua, N.-H. Agrobacterium-mediated transformation of Arabidopsis thaliana using the floral dip method. Nat. Protoc. 2006, 1, 641–646. [Google Scholar] [CrossRef]
  89. Clough, S.J.; Bent, A.F. Floral dip: A simplified method for Agrobacterium-mediated transformation of Arabidopsis thaliana. Plant J. 1998, 16, 735–743. [Google Scholar] [CrossRef] [Green Version]
  90. Zhang, X.Z.; Zheng, W.J.; Cao, X.Y.; Cui, X.Y.; Zhao, S.P.; Yu, T.F.; Chen, J.; Zhou, Y.B.; Chen, M.; Chai, S.C.; et al. Genomic Analysis of Stress Associated Proteins in Soybean and the Role of GmSAP16 in Abiotic Stress Responses in Arabidopsis and Soybean. Front. Plant Sci. 2019, 10, 1453. [Google Scholar] [CrossRef] [Green Version]
  91. Ni, Z.; Hu, Z.; Jiang, Q.; Zhang, H. GmNFYA3, a target gene of miR169, is a positive regulator of plant tolerance to drought stress. Plant Mol. Biol. 2013, 82, 113–129. [Google Scholar] [CrossRef]
  92. Kereszt, A.; Li, D.; Indrasumunar, A.; Nguyen, C.D.; Nontachaiyapoom, S.; Kinkema, M.; Gresshoff, P.M. Agrobacterium rhizogenes-mediated transformation of soybean to study root biology. Nat. Protoc. 2007, 2, 948–952. [Google Scholar] [CrossRef]
  93. Liang, Y.; Urano, D.; Liao, K.-L.; Hedrick, T.L.; Gao, Y.; Jones, A.M. A nondestructive method to estimate the chlorophyll content of Arabidopsis seedlings. Plant Methods 2017, 13, 26. [Google Scholar] [CrossRef]
Figure 1. Phylogenetic relationships of CBP60 genes. The unrooted tree was generated with the MEGA-X software using the full-length amino acid sequences of the 63 full-length CBP60 proteins (19, Gm; 19, Os; 17, Zm; 8, At) by the maximum-likelihood (ML) method, with 1000 bootstrap replicates. Different line colors indicate the five major branches. The red star indicates the main study gene in this work. Species acronym used: At, Arabidopsis; Gm, soybean; Os, rice; and Zm, maize.
Ijms 22 13501 g001
Figure 2. Chromosomal distribution, cis-regulatory elements, domains, and motifs of the GmCBP60 genes. (A) The chromosomal distributions of the GmCBP60 genes in the soybean genome. The red lines point the position of GmCBP60 genes. The chromosome names were set at the top of the chromosomes; (B) Cis-elements in the GmCBP60 gene promoter regions. Different cis-elements were indicated by distinct colored round rectangles; (C) Pfam domain present in soybean GmCBP60 family; (D) Schematic distributions of the conserved motifs among GmCBP60 genes. Each colored box represents a motif in the protein.
Ijms 22 13501 g002
Figure 3. The expression pattern of soybean GmCBP60 genes in response to drought and salt treatment. (A) The heatmap of GmCBP60 genes expression under different treatment in transcriptome [33]. The FPKM values of heatmap are detailed introduction in Table S1. After salt (B), drought (C) and PEG (D) treatment, expression patterns of seven genes were quantified by RT-qPCR analysis. The soybean actin (β-actin) was used as an internal control. The horizontal axis represents time (h), and the vertical axis represents expression level. Three biological replicates were per-formed, and the values are means ± SD.
Ijms 22 13501 g003
Figure 4. The location of GmCBP60A-1. (A,B) Green and red fluorescence signals were detected by confocal laser scanning. Scale bars are shown in figure, and the value of scale bar is 10 μM. (C) The Western blot result of localization of GmCBP60A-1.
Ijms 22 13501 g004
Figure 5. The seed germination of transgenic Arabidopsis lines and WT plants under NaCl and PEG treatments and the results of related statistics. (A) The seeds of transgenic lines and WT plants were grown in 1/2 MS, 1/2 MS containing 75 mM NaCl and 1/2 MS containing 6% PEG. (B) The line chart of germination under different conditions. Three biological replicates were performed, and the values are means ± SD. Values marked with similar letters indicate not statistically significant differences (Student’s t-test: p ≤ 0.05).
Ijms 22 13501 g005
Figure 6. The root growth of transgenic Arabidopsis lines and WT plants under NaCl and PEG treatments and the results of related statistics. (A) The seedlings of transgenic lines and WT plants were grown in 1/2 MS, 1/2 MS containing different concentrations of NaCl and 1/2 MS containing different concentrations of PEG6000. (B) Root growth variation of transgenic lines and WT in the presence of different concentrations of NaCl. (C) Root growth variation of transgenic lines and WT in the presence of different concentrations of PEG6000. Three biological replicates were performed, and the values are means ± SD. Values marked with similar letters indicate not statistically significant differences (Student’s t-test: p ≤ 0.05).
Ijms 22 13501 g006
Figure 7. Under salt treatment, the phenotype of hairy root soybean, the states of difference hairy root plant leaves and the results of physiological index. (A) Images of salt-resistant phenotypes of the hairy root soybean plants of OE, EV and RNAi from the 250 mM NaCl stress or non-stress treatments are shown. (B) Trypan blue staining of dead cells (lives cells do not stain) in the hairy root soybean plants leaves after a week of salt treatment. DAB (C) and NBT (D) staining of leaves of the hairy root soybean plants of OE, EV and RNAi after salt or no-salt treatment for four days. Chlorophyll content (E), water-loss rate (F), NOX content (G), O2− content (H), H2O2 content (I), proline content (J), and MDA content (K) were detected in leaves of the hairy root soybean plants of OE, EV and RNAi after a week-long salt or no-salt treatment. Three biological replicates were performed, and the values are means ± SD. Values marked with similar letters indicate not statistically significant differences (Student’s t-test: p ≤ 0.05).
Ijms 22 13501 g007
Figure 8. Under drought treatment, the phenotype of hairy root soybean, the states of difference hairy root plant leaves and the results of physiological index. (A) the seedlings with 2–5 cm hairy roots were grown for five days in pots under non-drought conditions, and then watering was withheld from plants for 13 days. Survival rates of the water-stressed plants were determined three days after rewatering. (B) Trypan blue staining of dead cells (live cells do not stain) of the hairy root soybean plant leaves without irrigation for 11 days. DAB (C) and NBT (D) staining of the hairy root soybean plant leaves of OE, EV and RNAi after drought or non-drought treatment for a week. The depth of color shows the concentrations of H2O2 and O2− in the leaves. Chlorophyll content (E), water-loss rate (F), NOX content (G) proline content (H), H2O2 content (I), O2− content (J), and MDA content (K) were detected in leaves of the hairy root soybean plants OE, EV and RNAi under a week-long drought or non-drought treatment. Three biological replicates were performed, and the values are means ± SD. Values marked with similar letters indicate not statistically significant differences (Student’s t-test: p ≤ 0.05).
Ijms 22 13501 g008
Figure 9. The expression levels of stress-responsive gene in transgenic soybean hairy roots. (A) The expression levels of salt-responsive genes under salt stress in transgenic soybean hairy root. (B) The expression levels of drought-responsive genes under drought stress in transgenic soybean hairy root. Three biological replicates were performed, and the values are means ± SD. Values marked with similar letters indicate not statistically significant differences (Student’s t-test: p ≤ 0.05).
Ijms 22 13501 g009
Table 1. Identify the number of having both ABAR and DER cis-acting in the promoter of six GmCBP60 genes.
Gene NameGmCBP60A-1GmCBP60B-2GmCBP60B-3GmCBP60B-4GmCBP60C-1GmCBP60E-2
ABAR111121
DER121121
Publisher’s Note: MDPI stays neutral with regard to jurisdictional claims in published maps and institutional affiliations.

