Disordered Expression of shaggy, the Drosophila Gene Encoding a Serine-Threonine Protein Kinase GSK3, Affects the Lifespan in a Transcript-, Stage-, and Tissue-Specific Manner

Abstract
1. Introduction
2. Results and Discussion
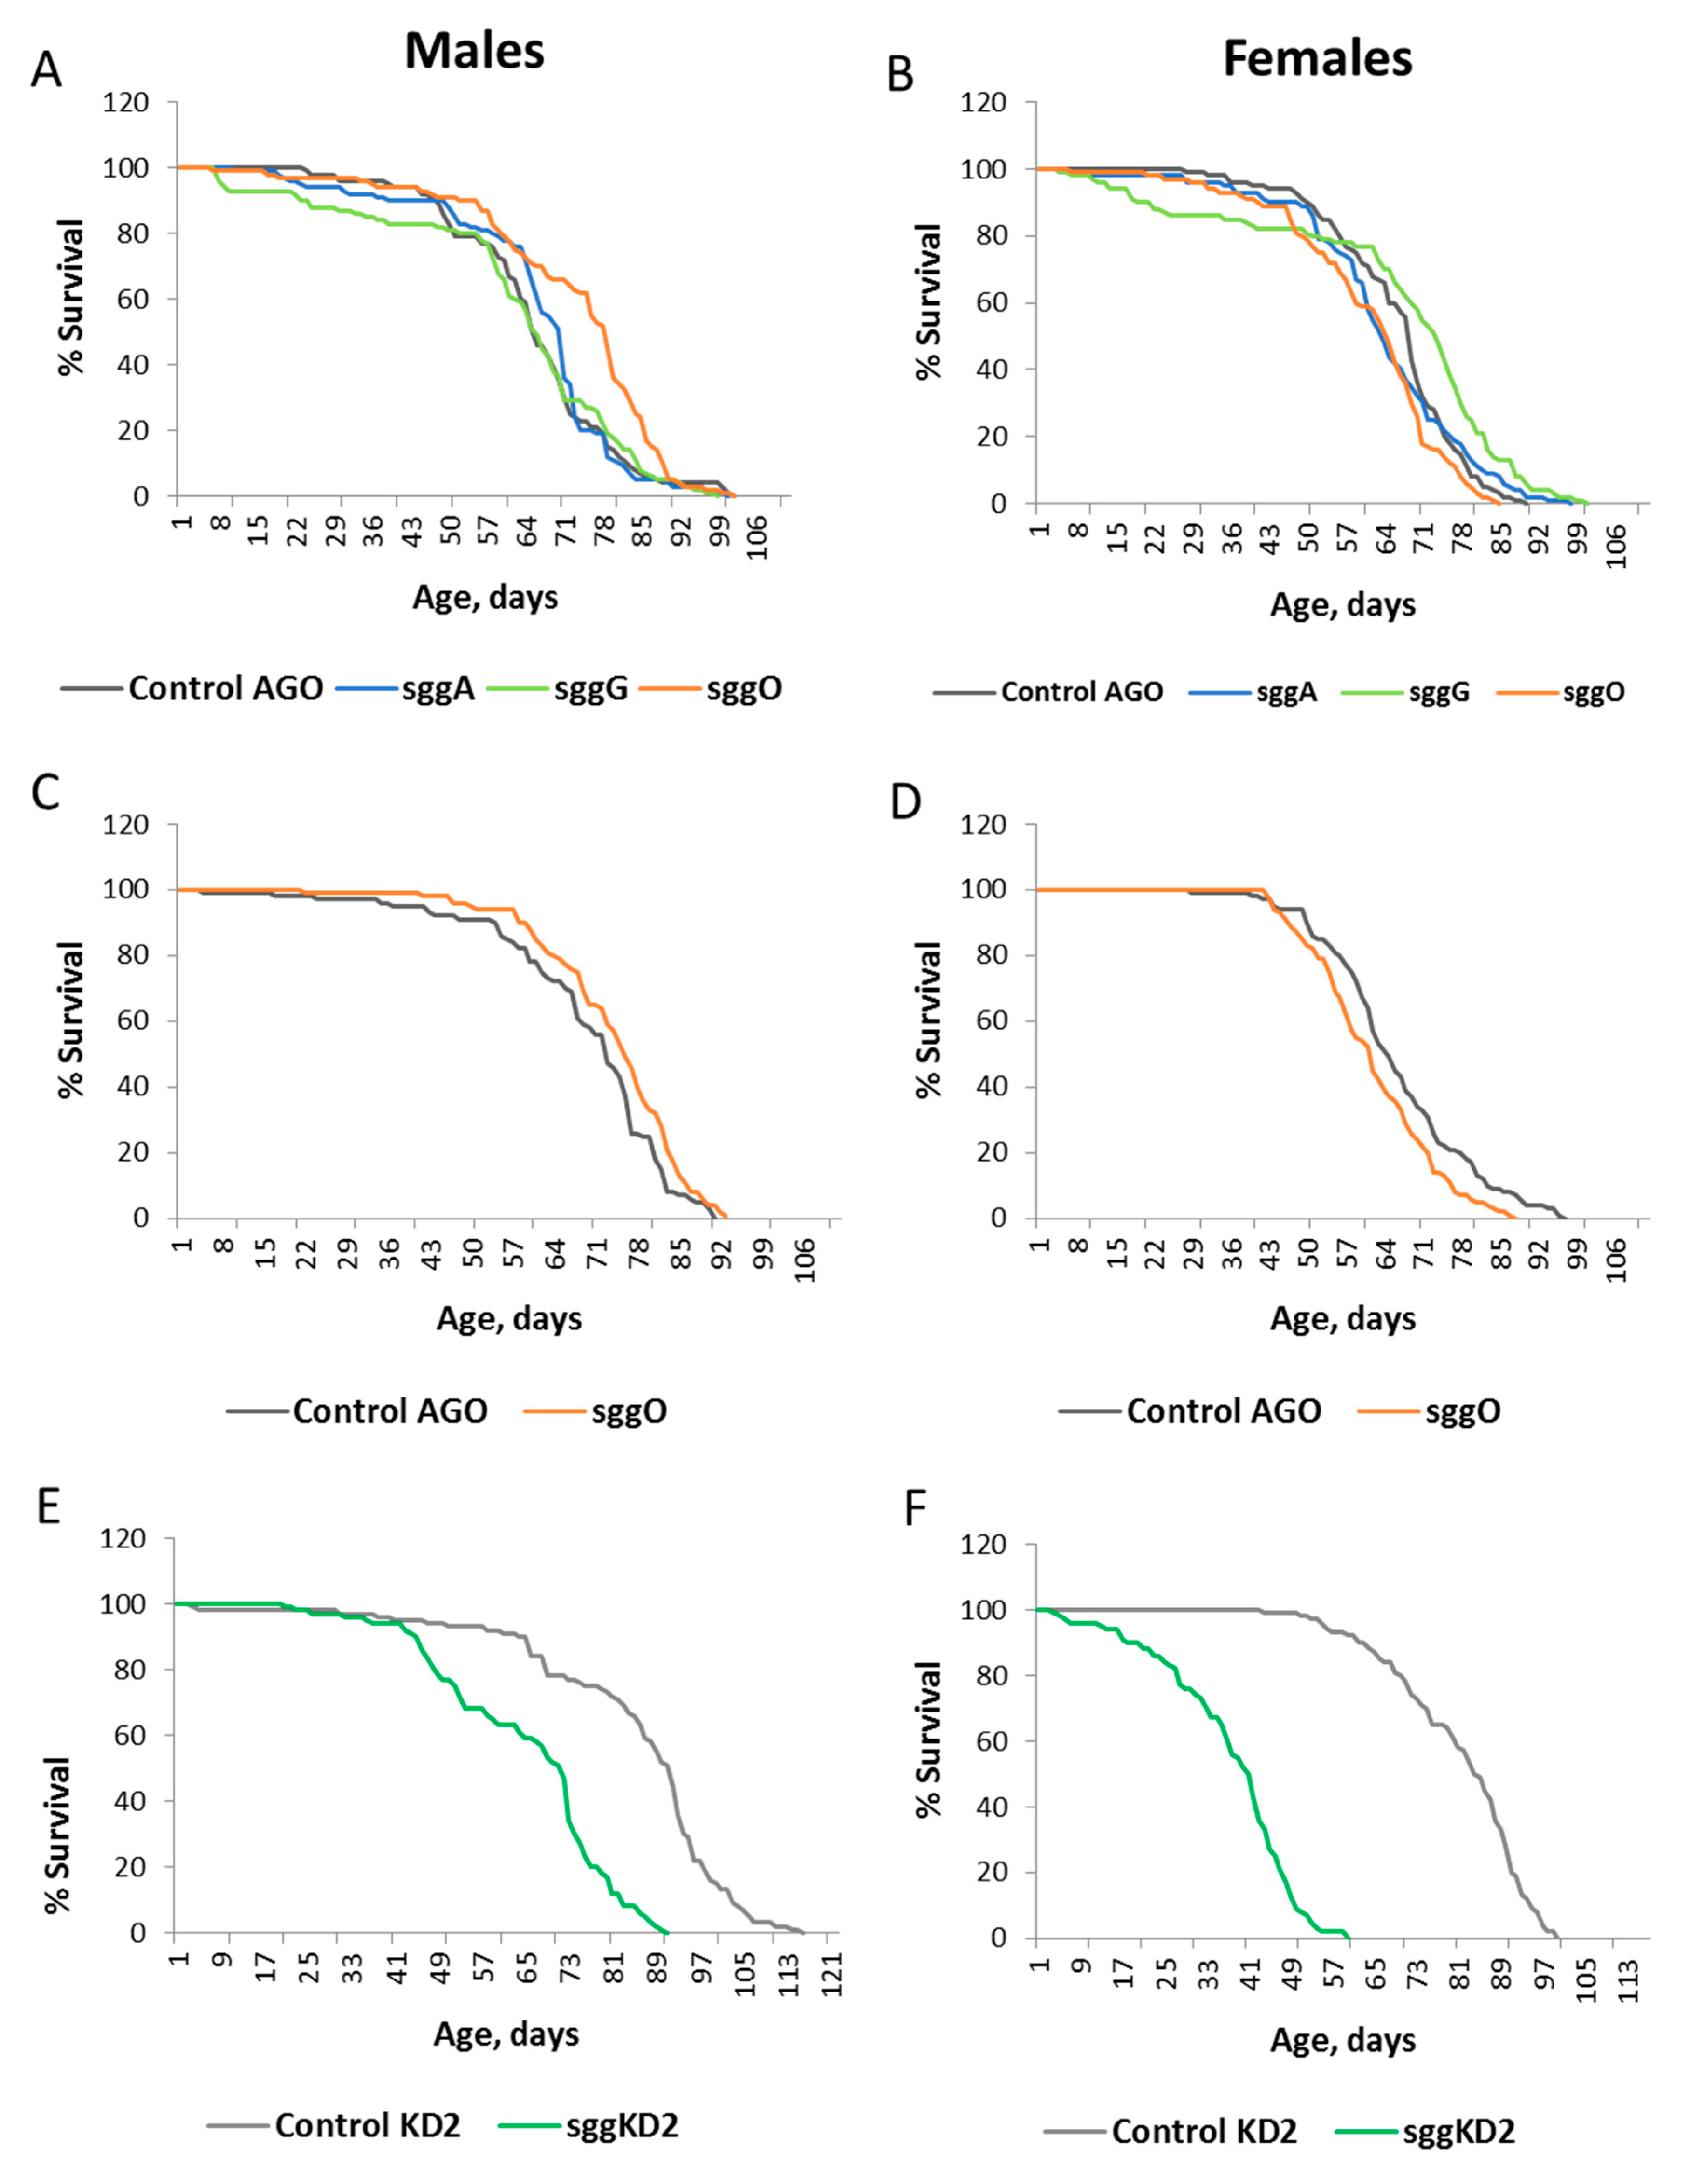
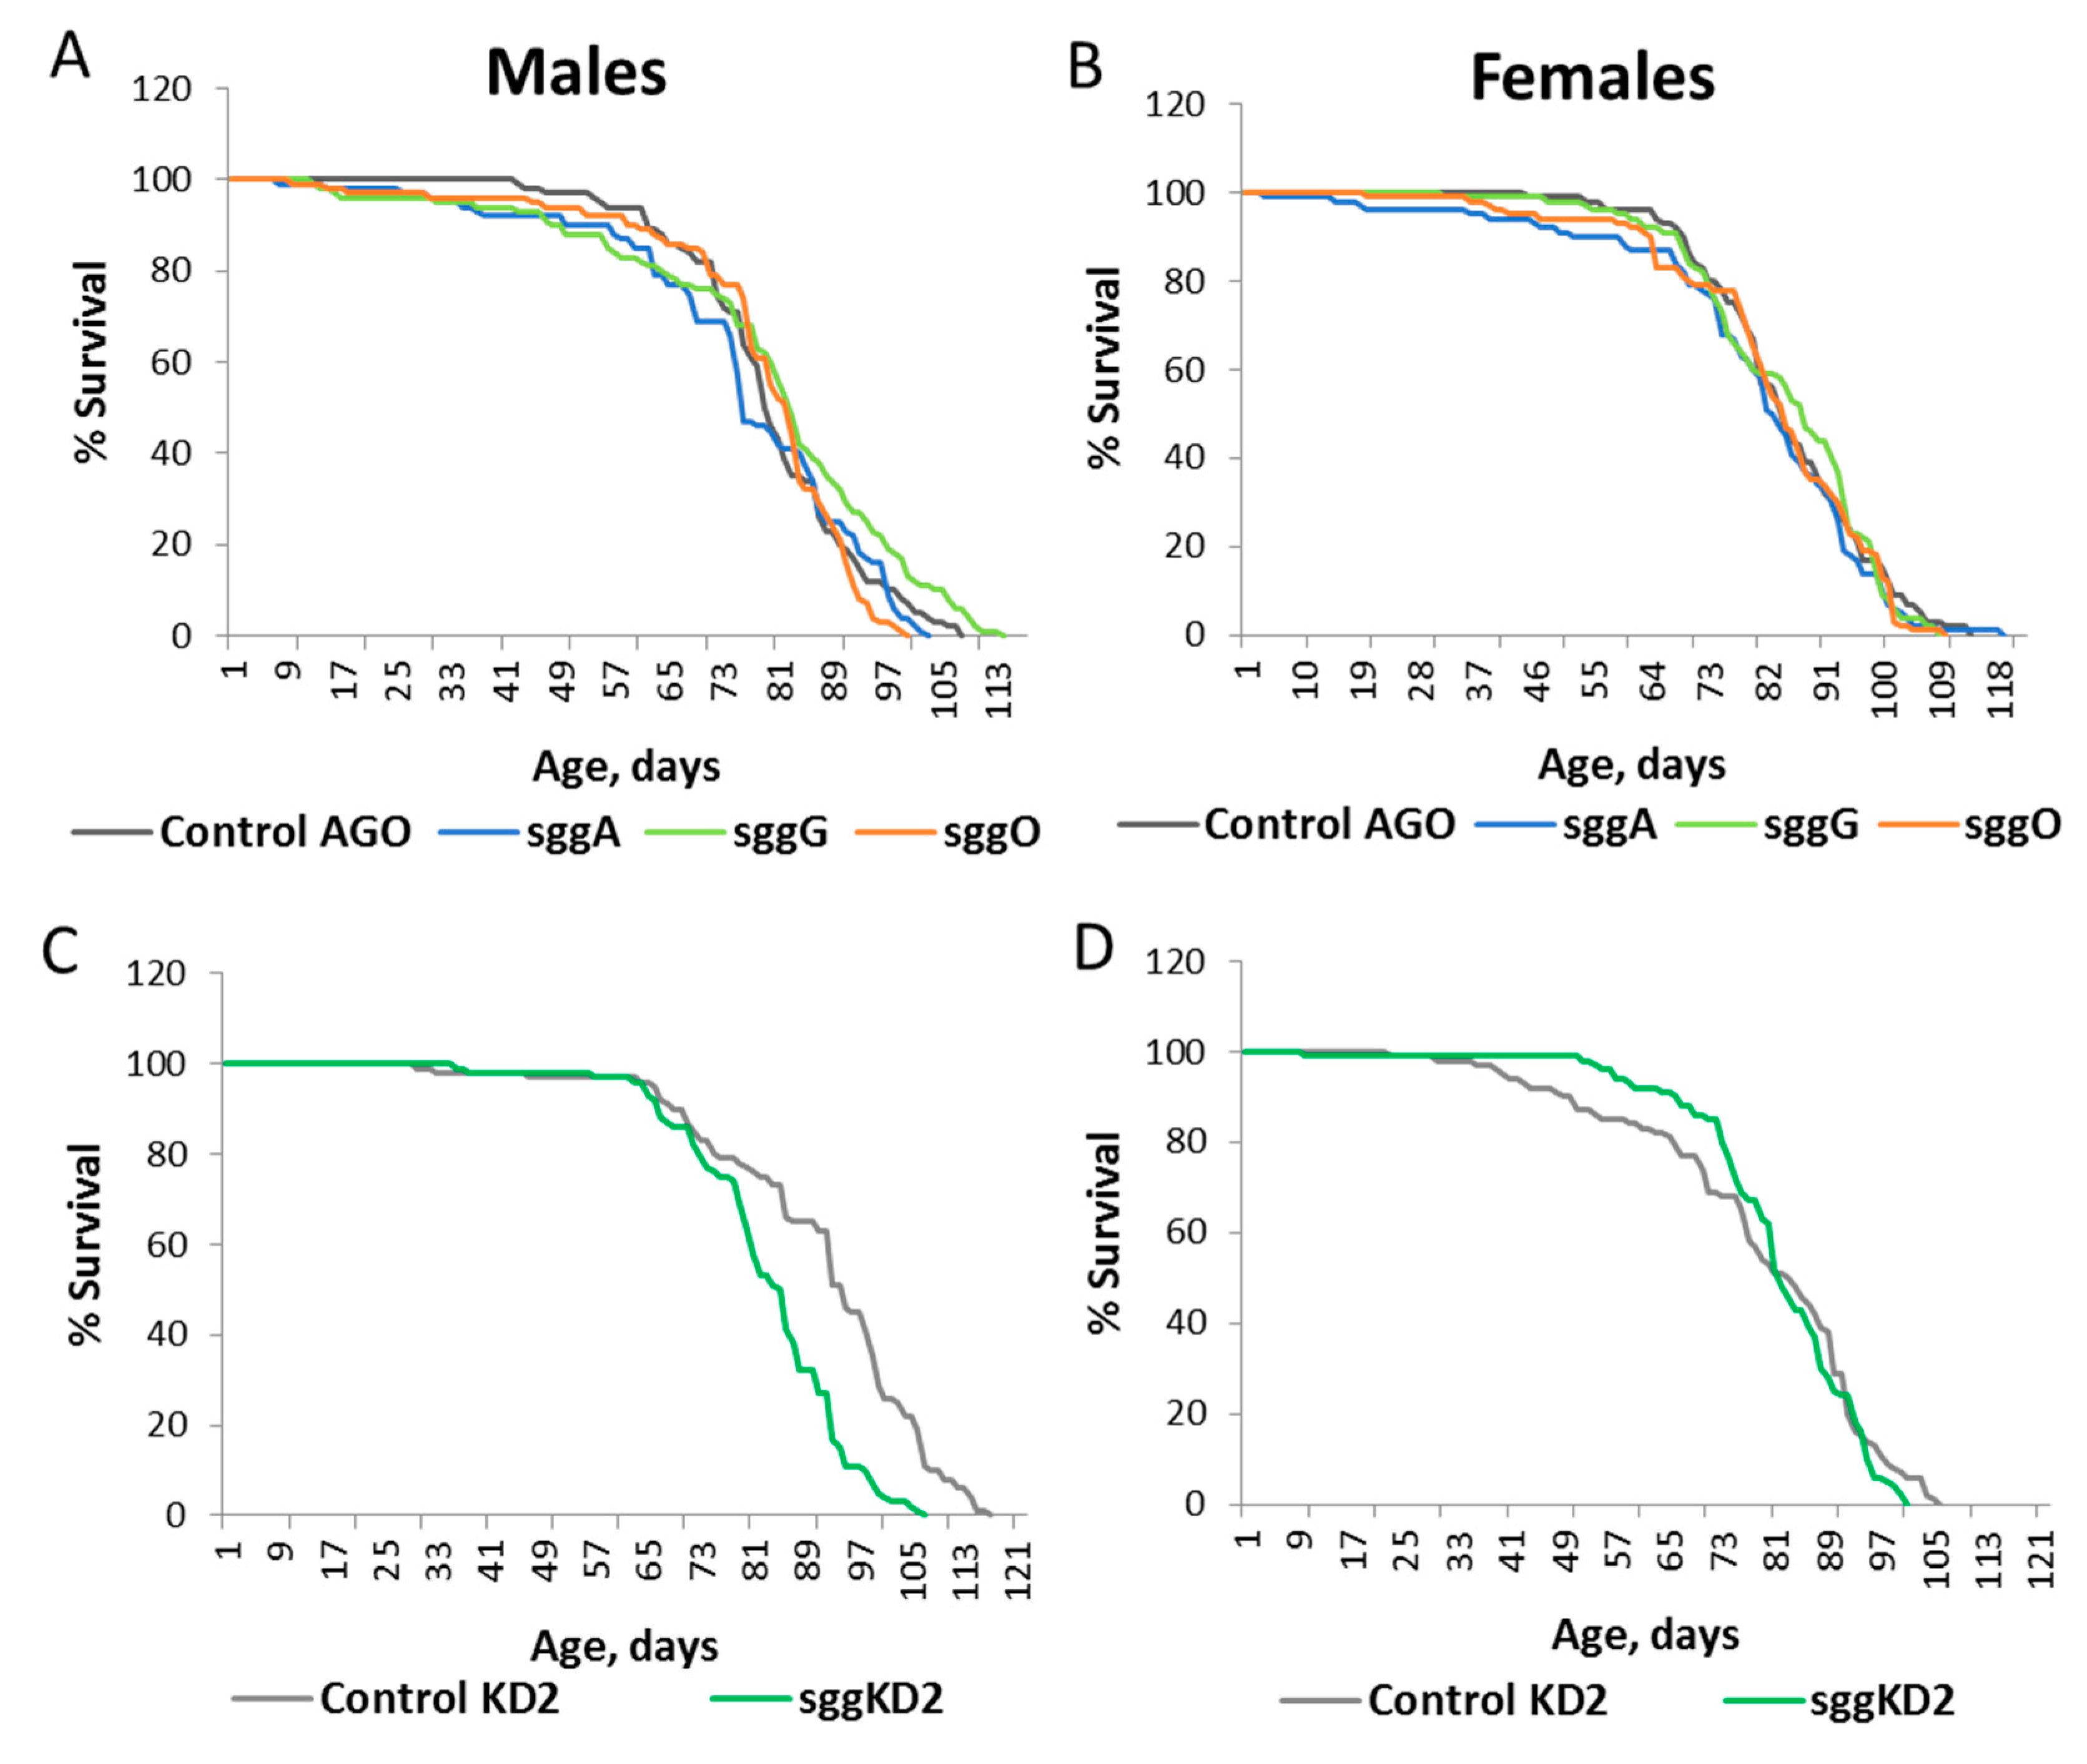
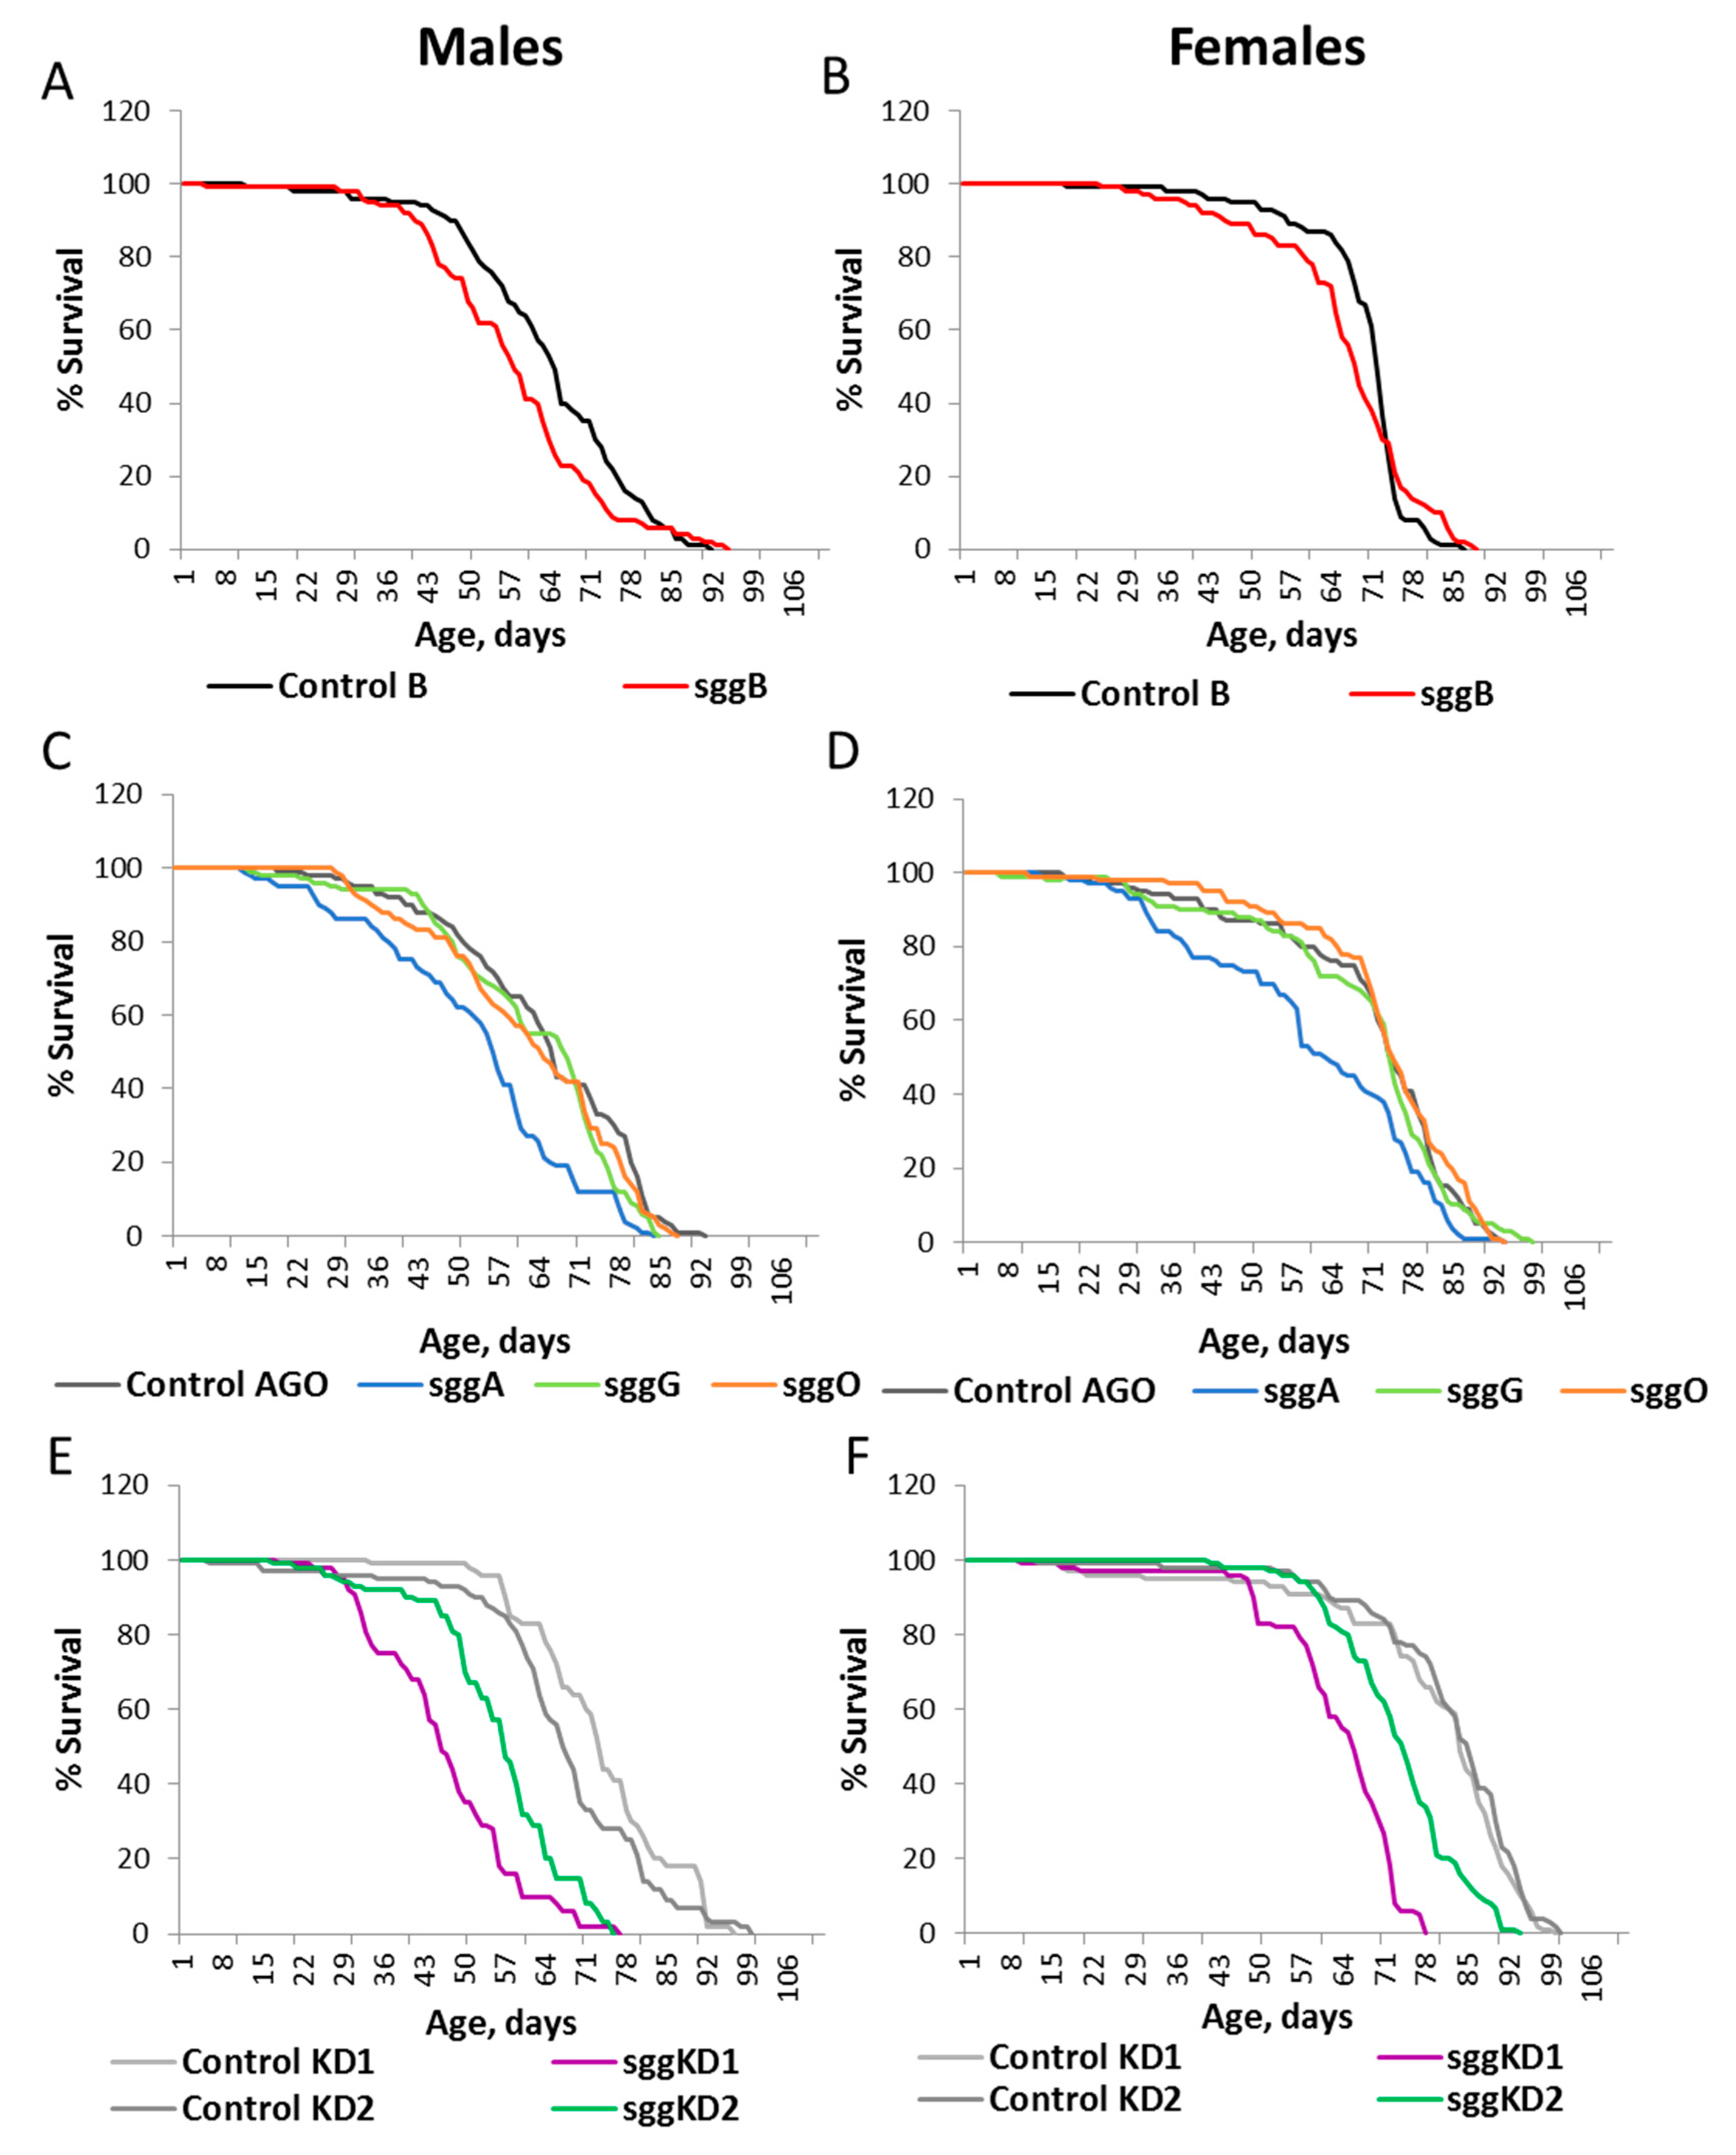
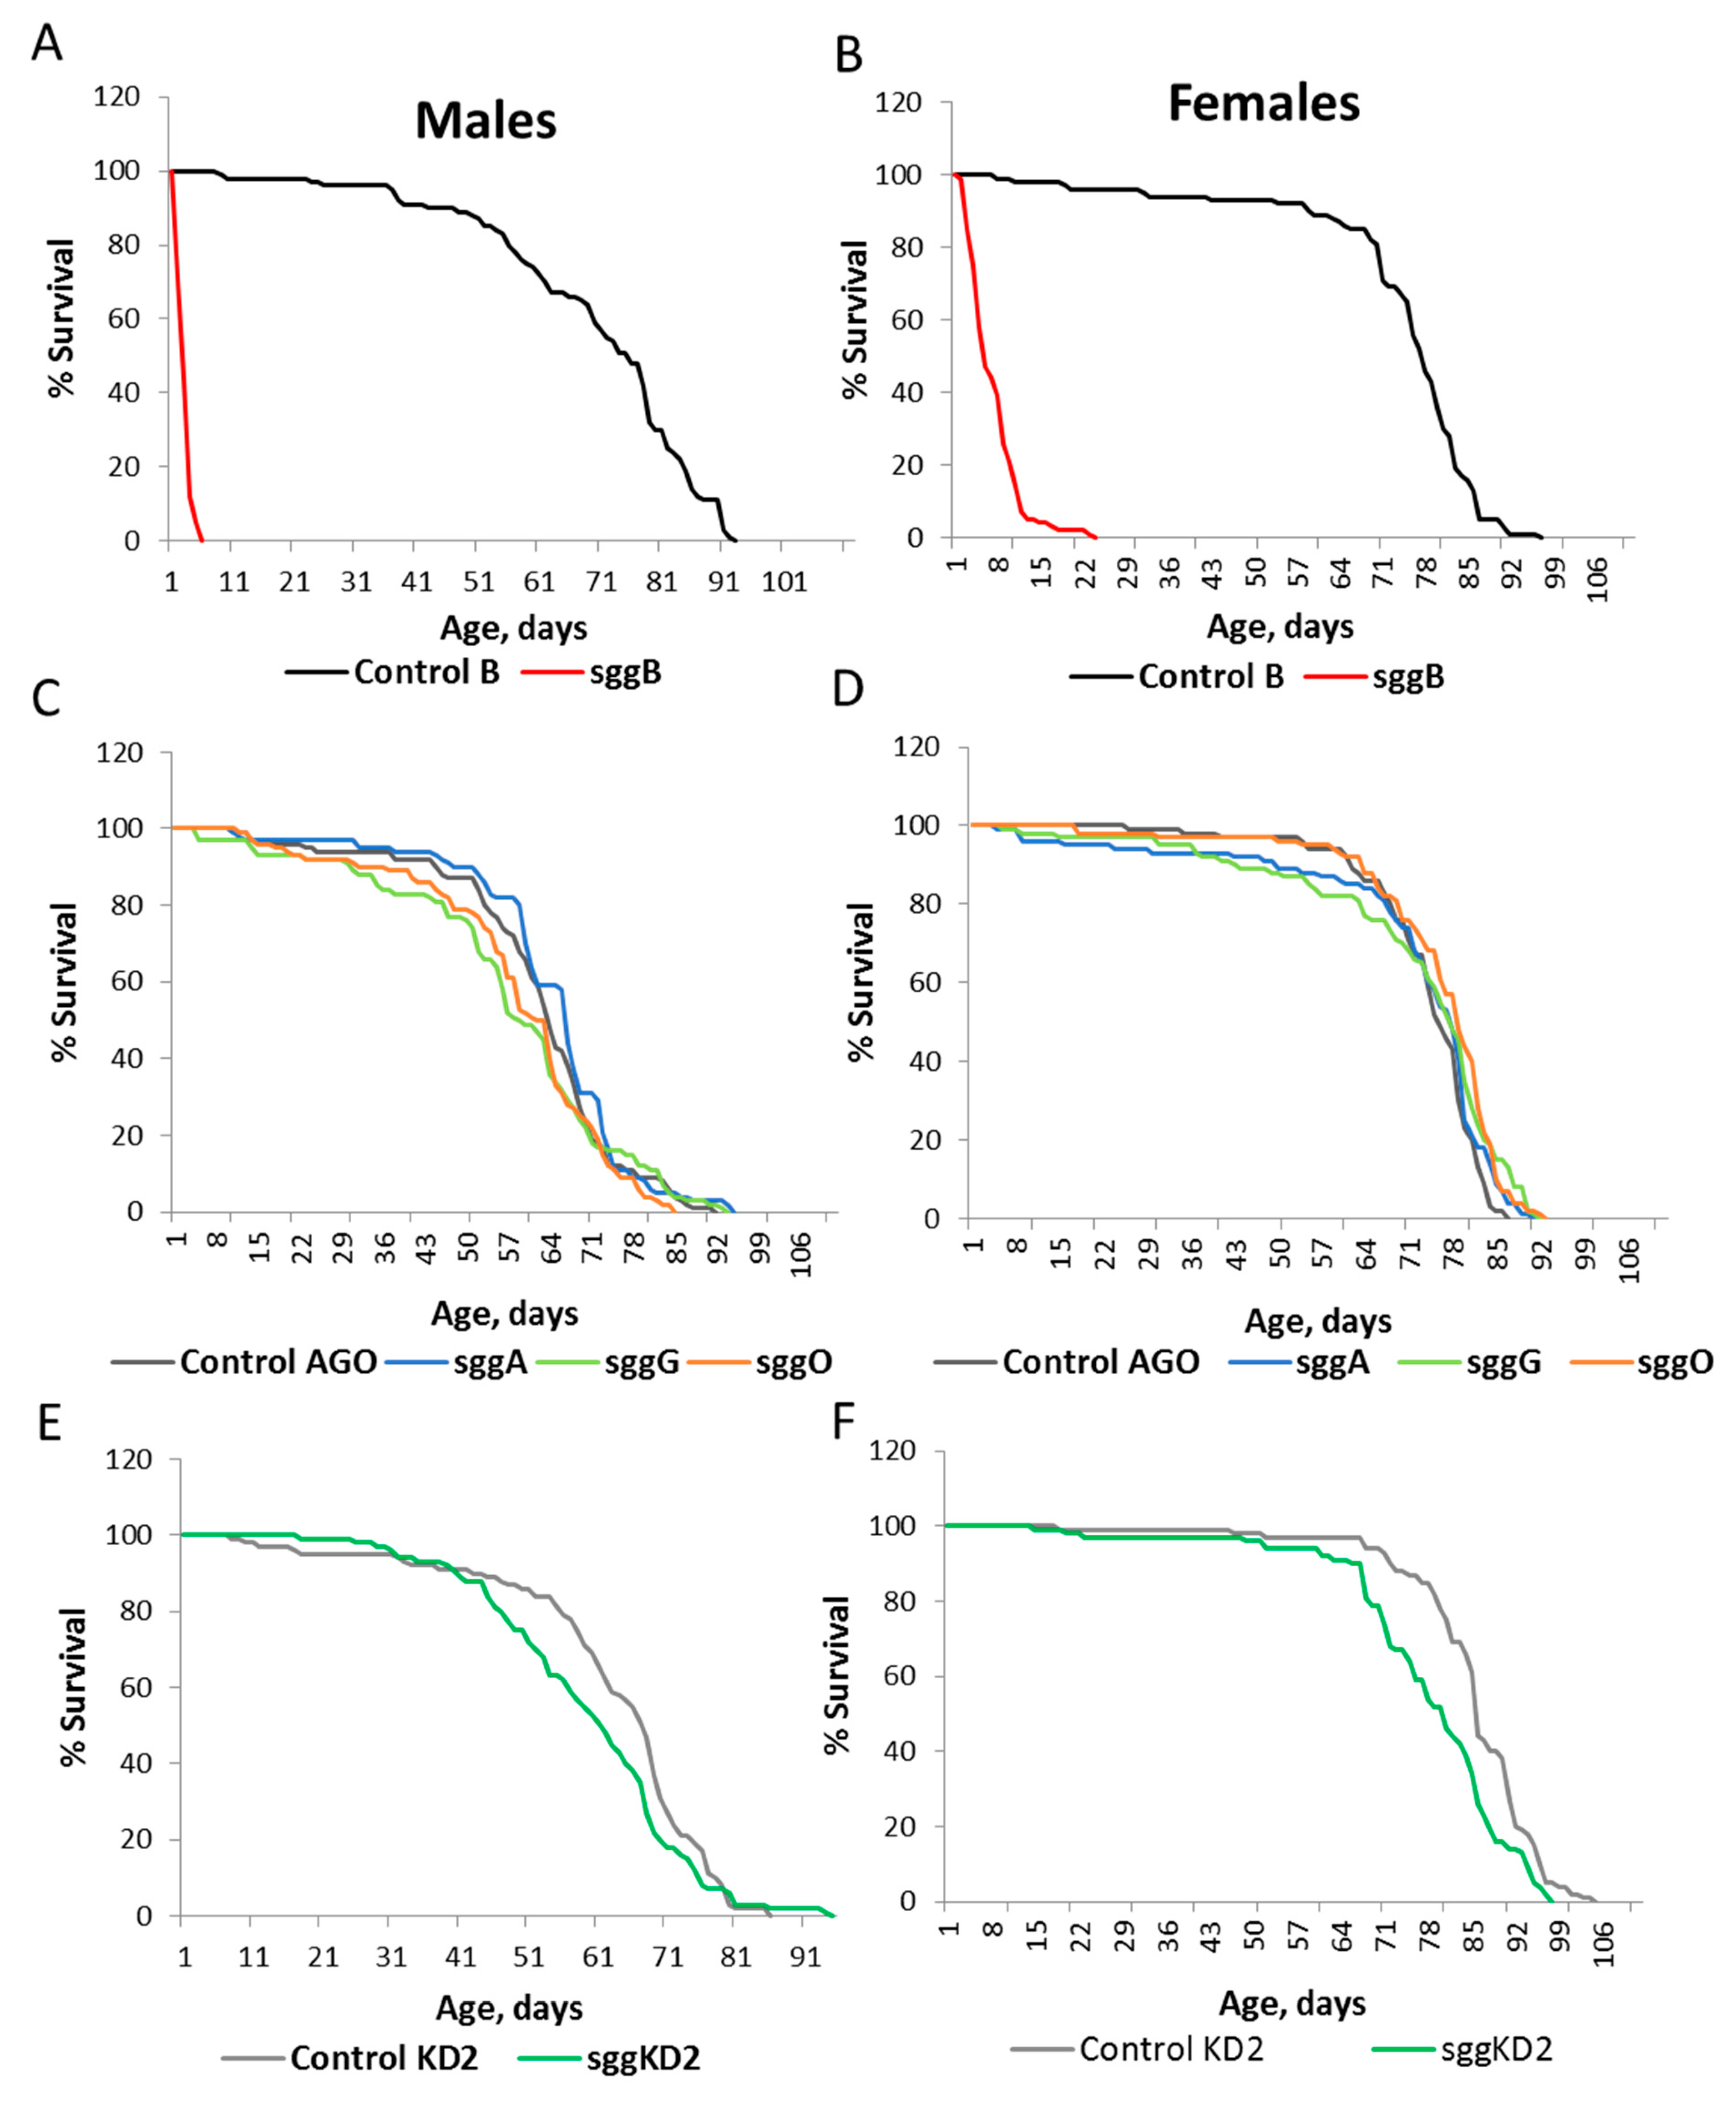
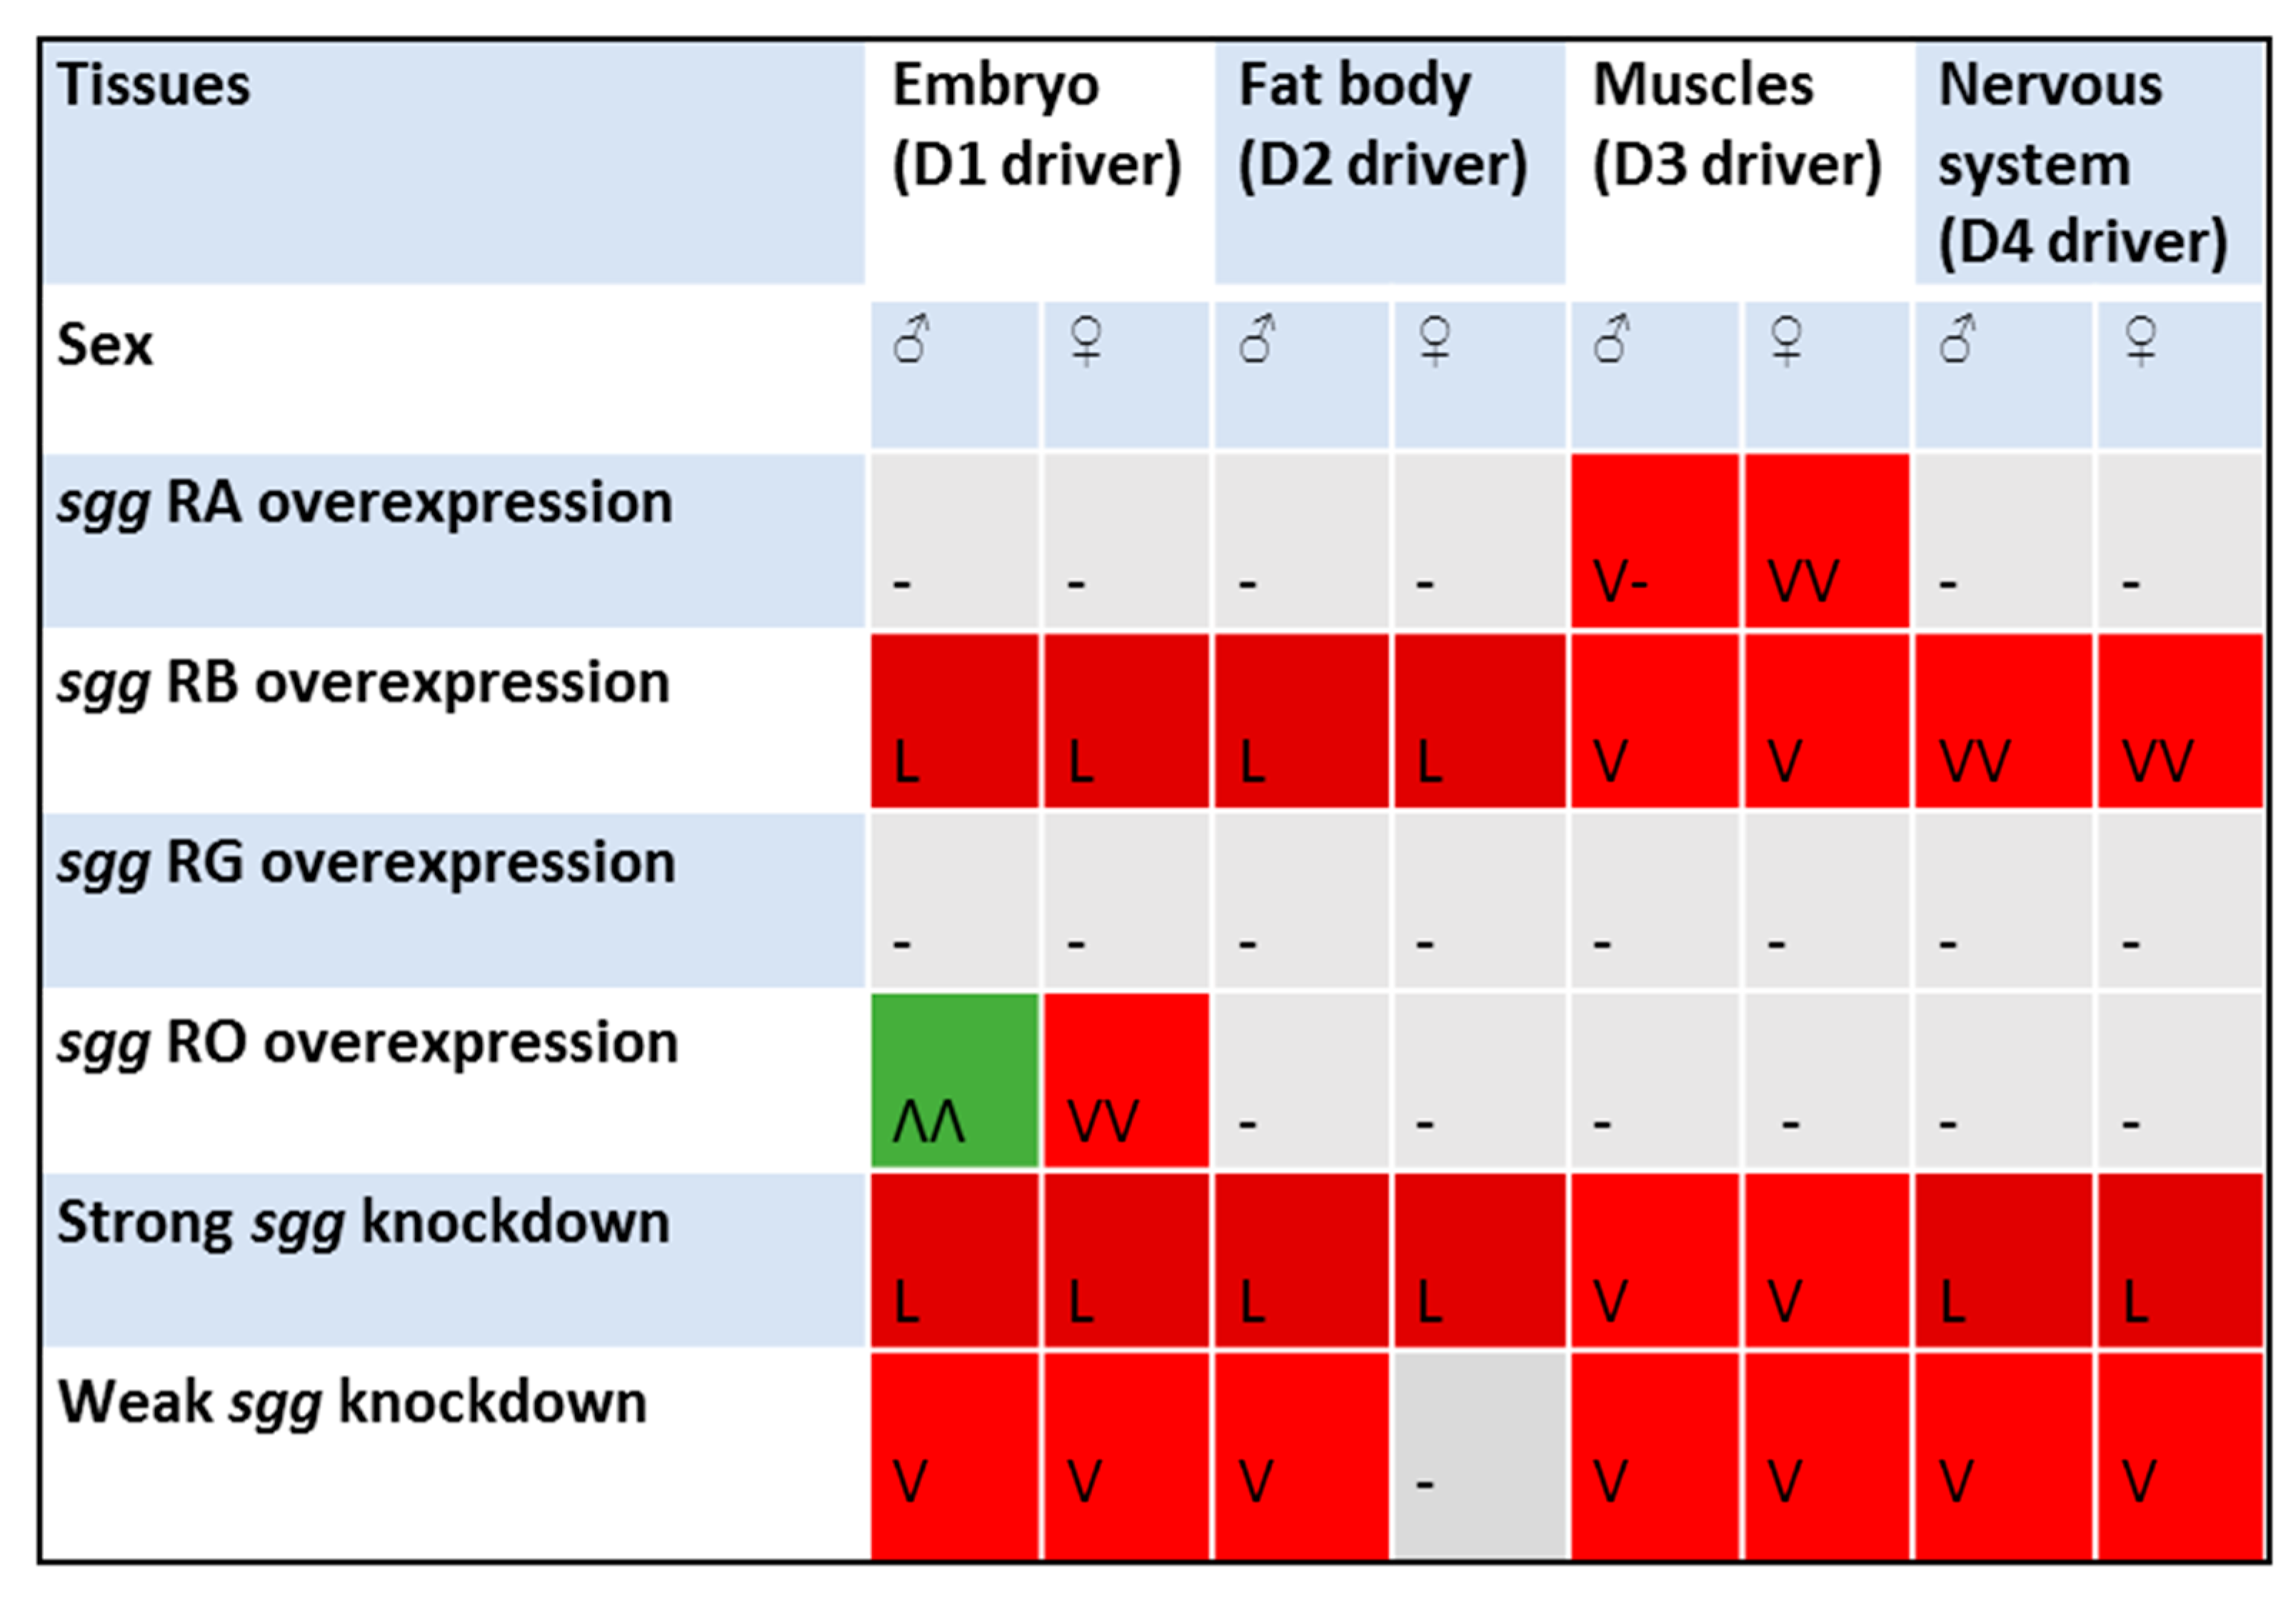
2.1. Differential Expression of Sgg Affects Lifespan
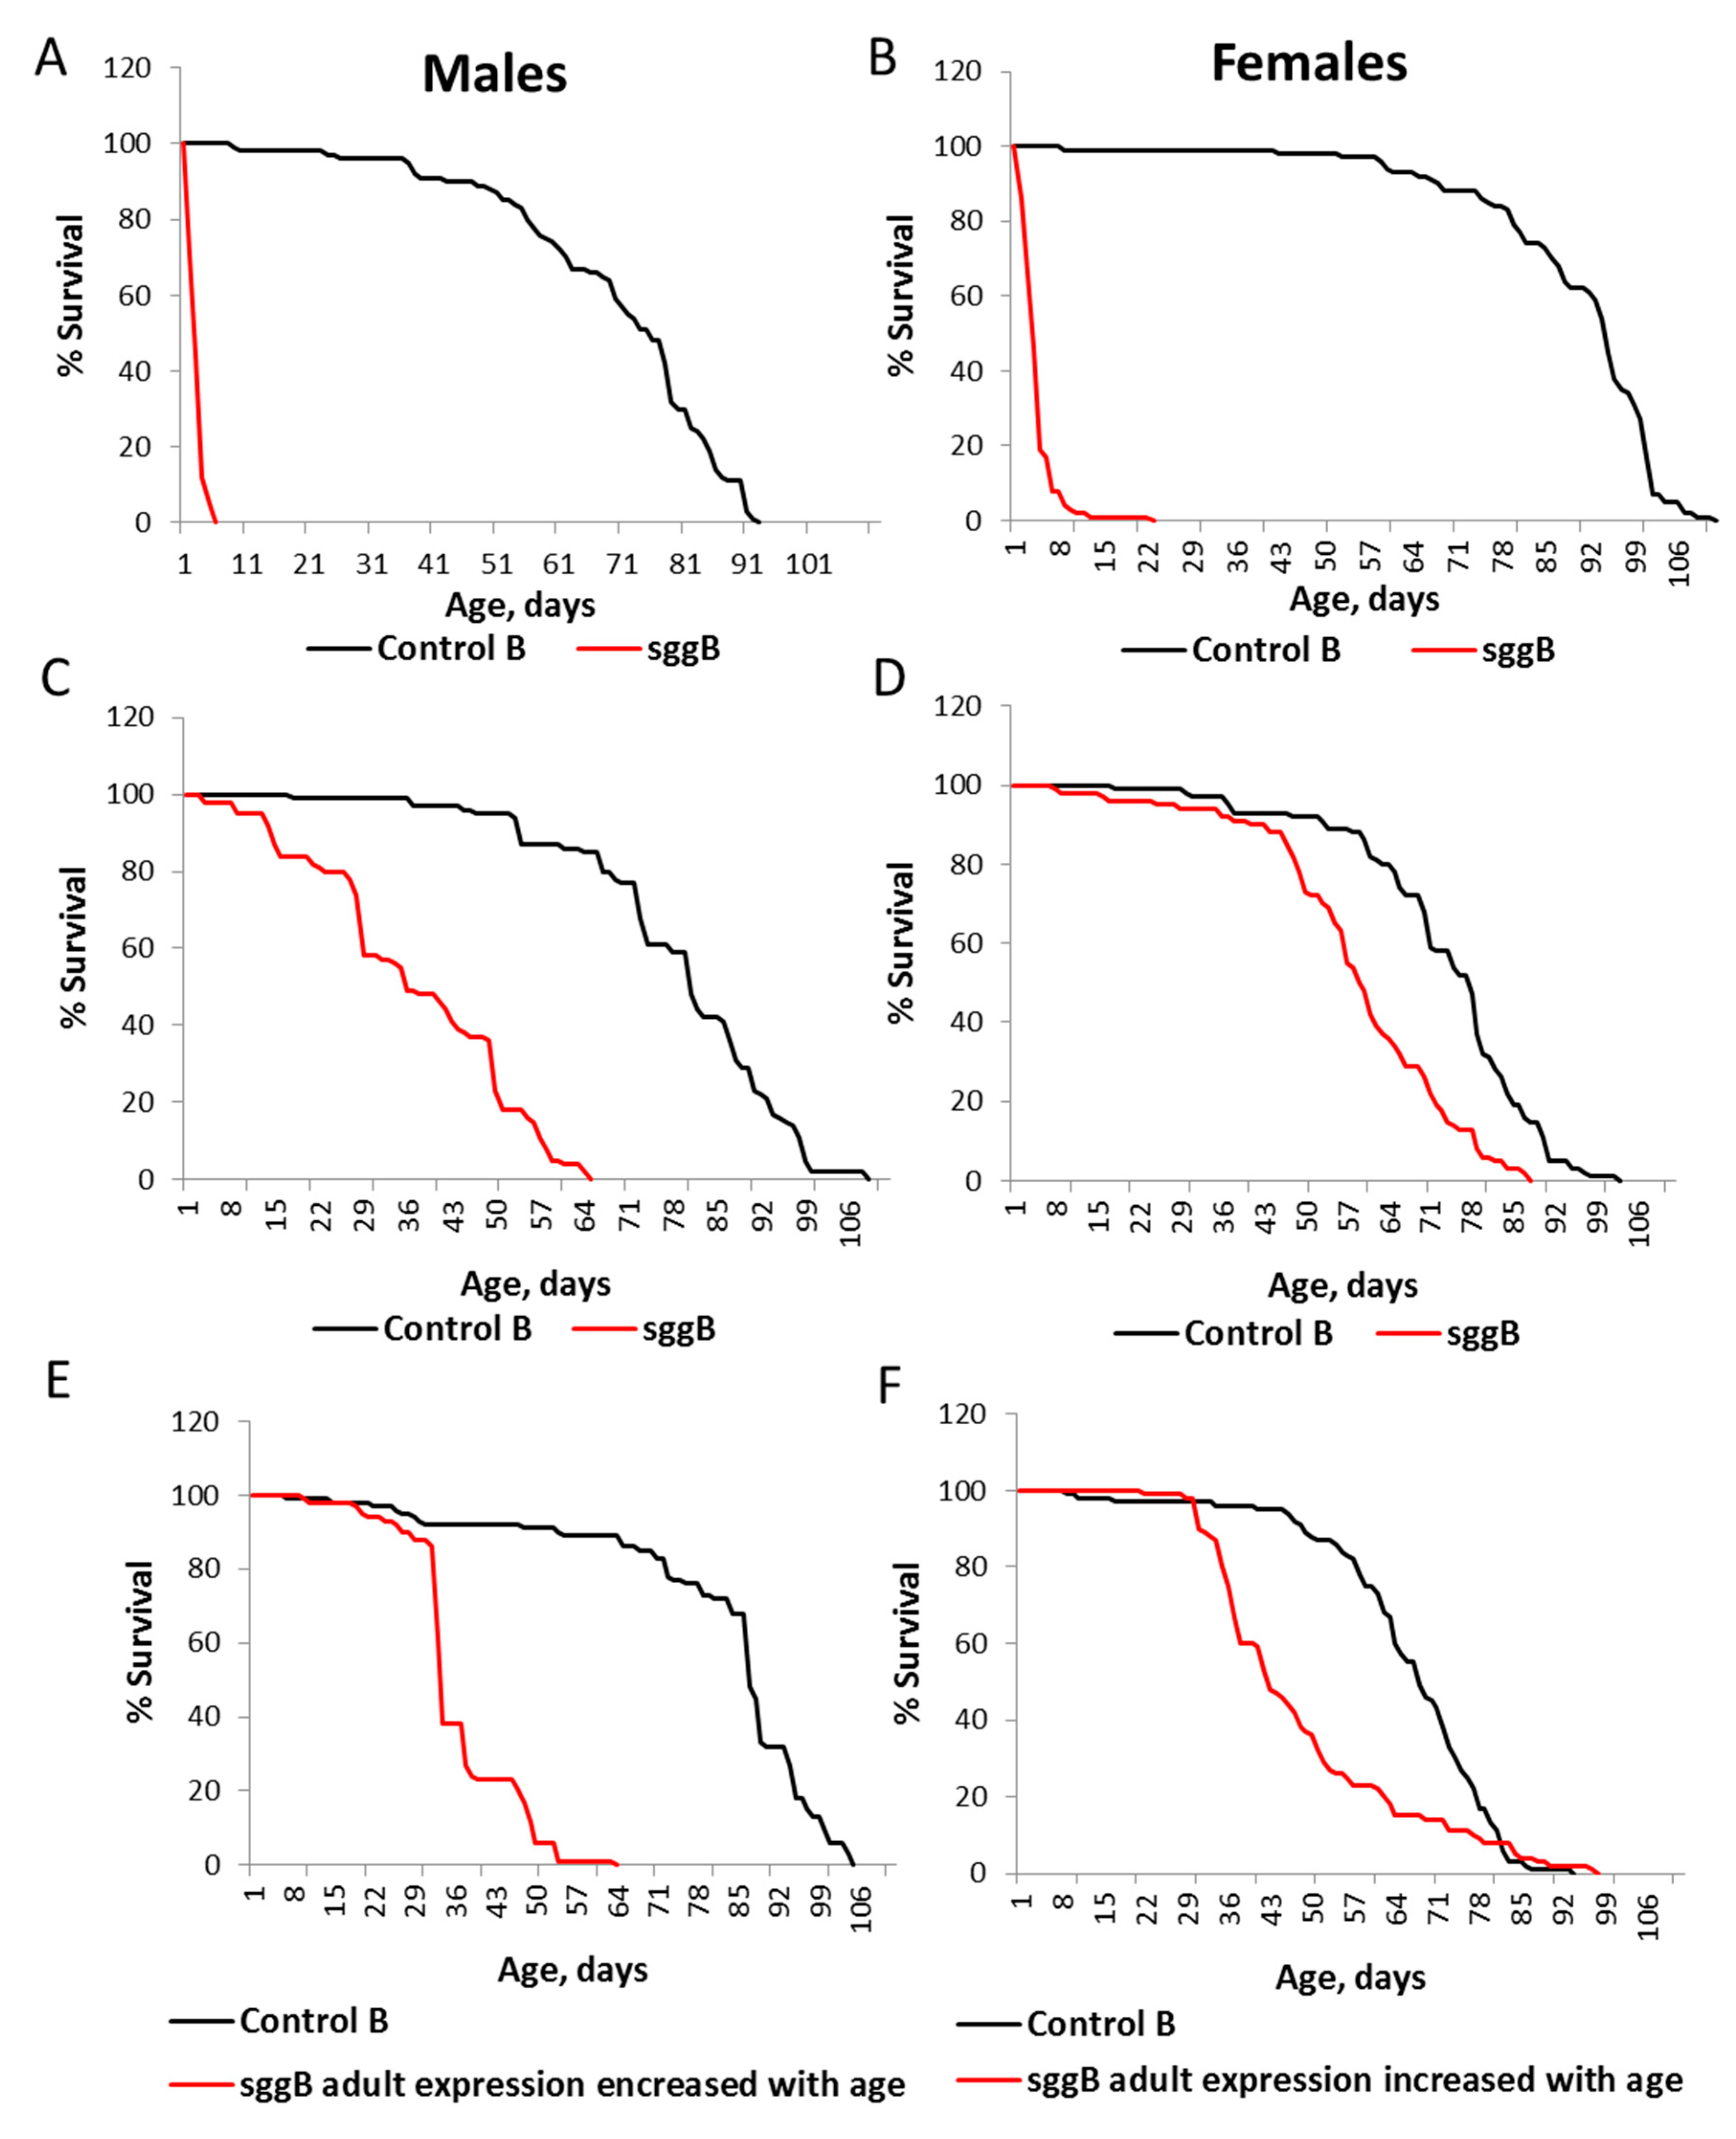
2.2. Overexpression of sgg-RB in the Nervous System Affects Lifespan in a Stage/Age- and Neuron-Specific Manner
2.3. Overexpression of Sgg-RB in the Nervous System Affects Neuronal Structure and Function
2.3.1. Locomotion
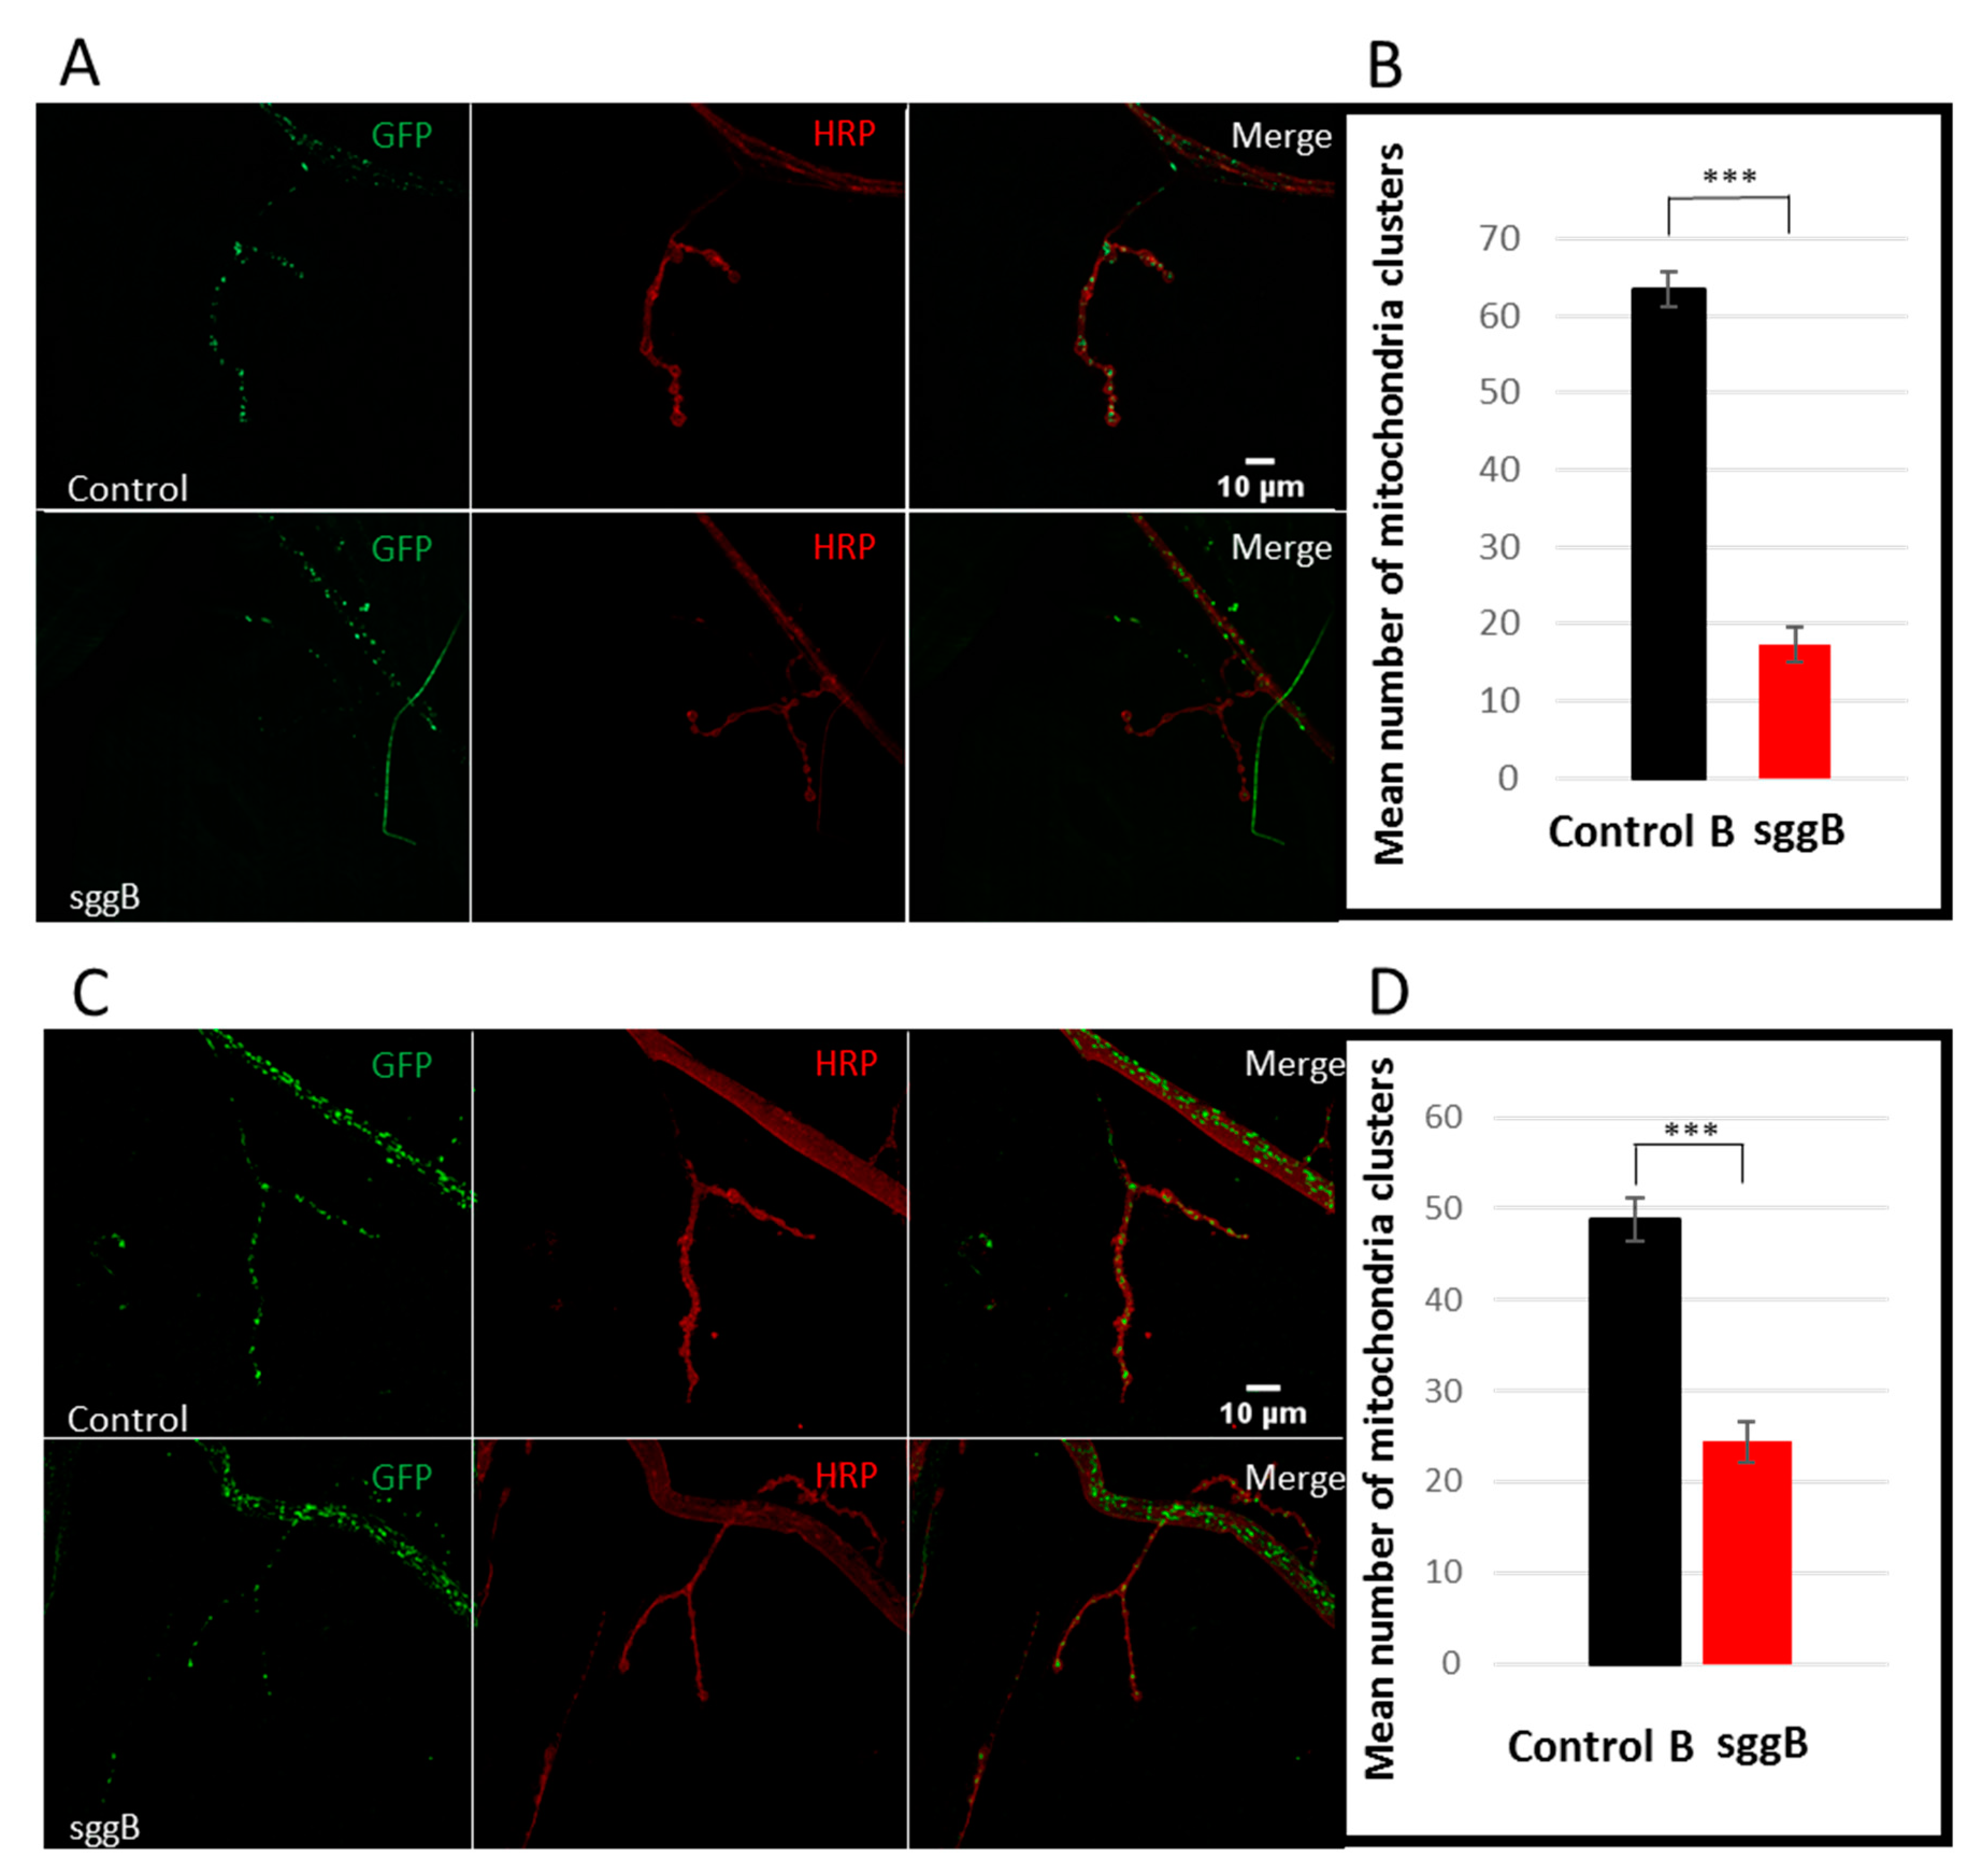
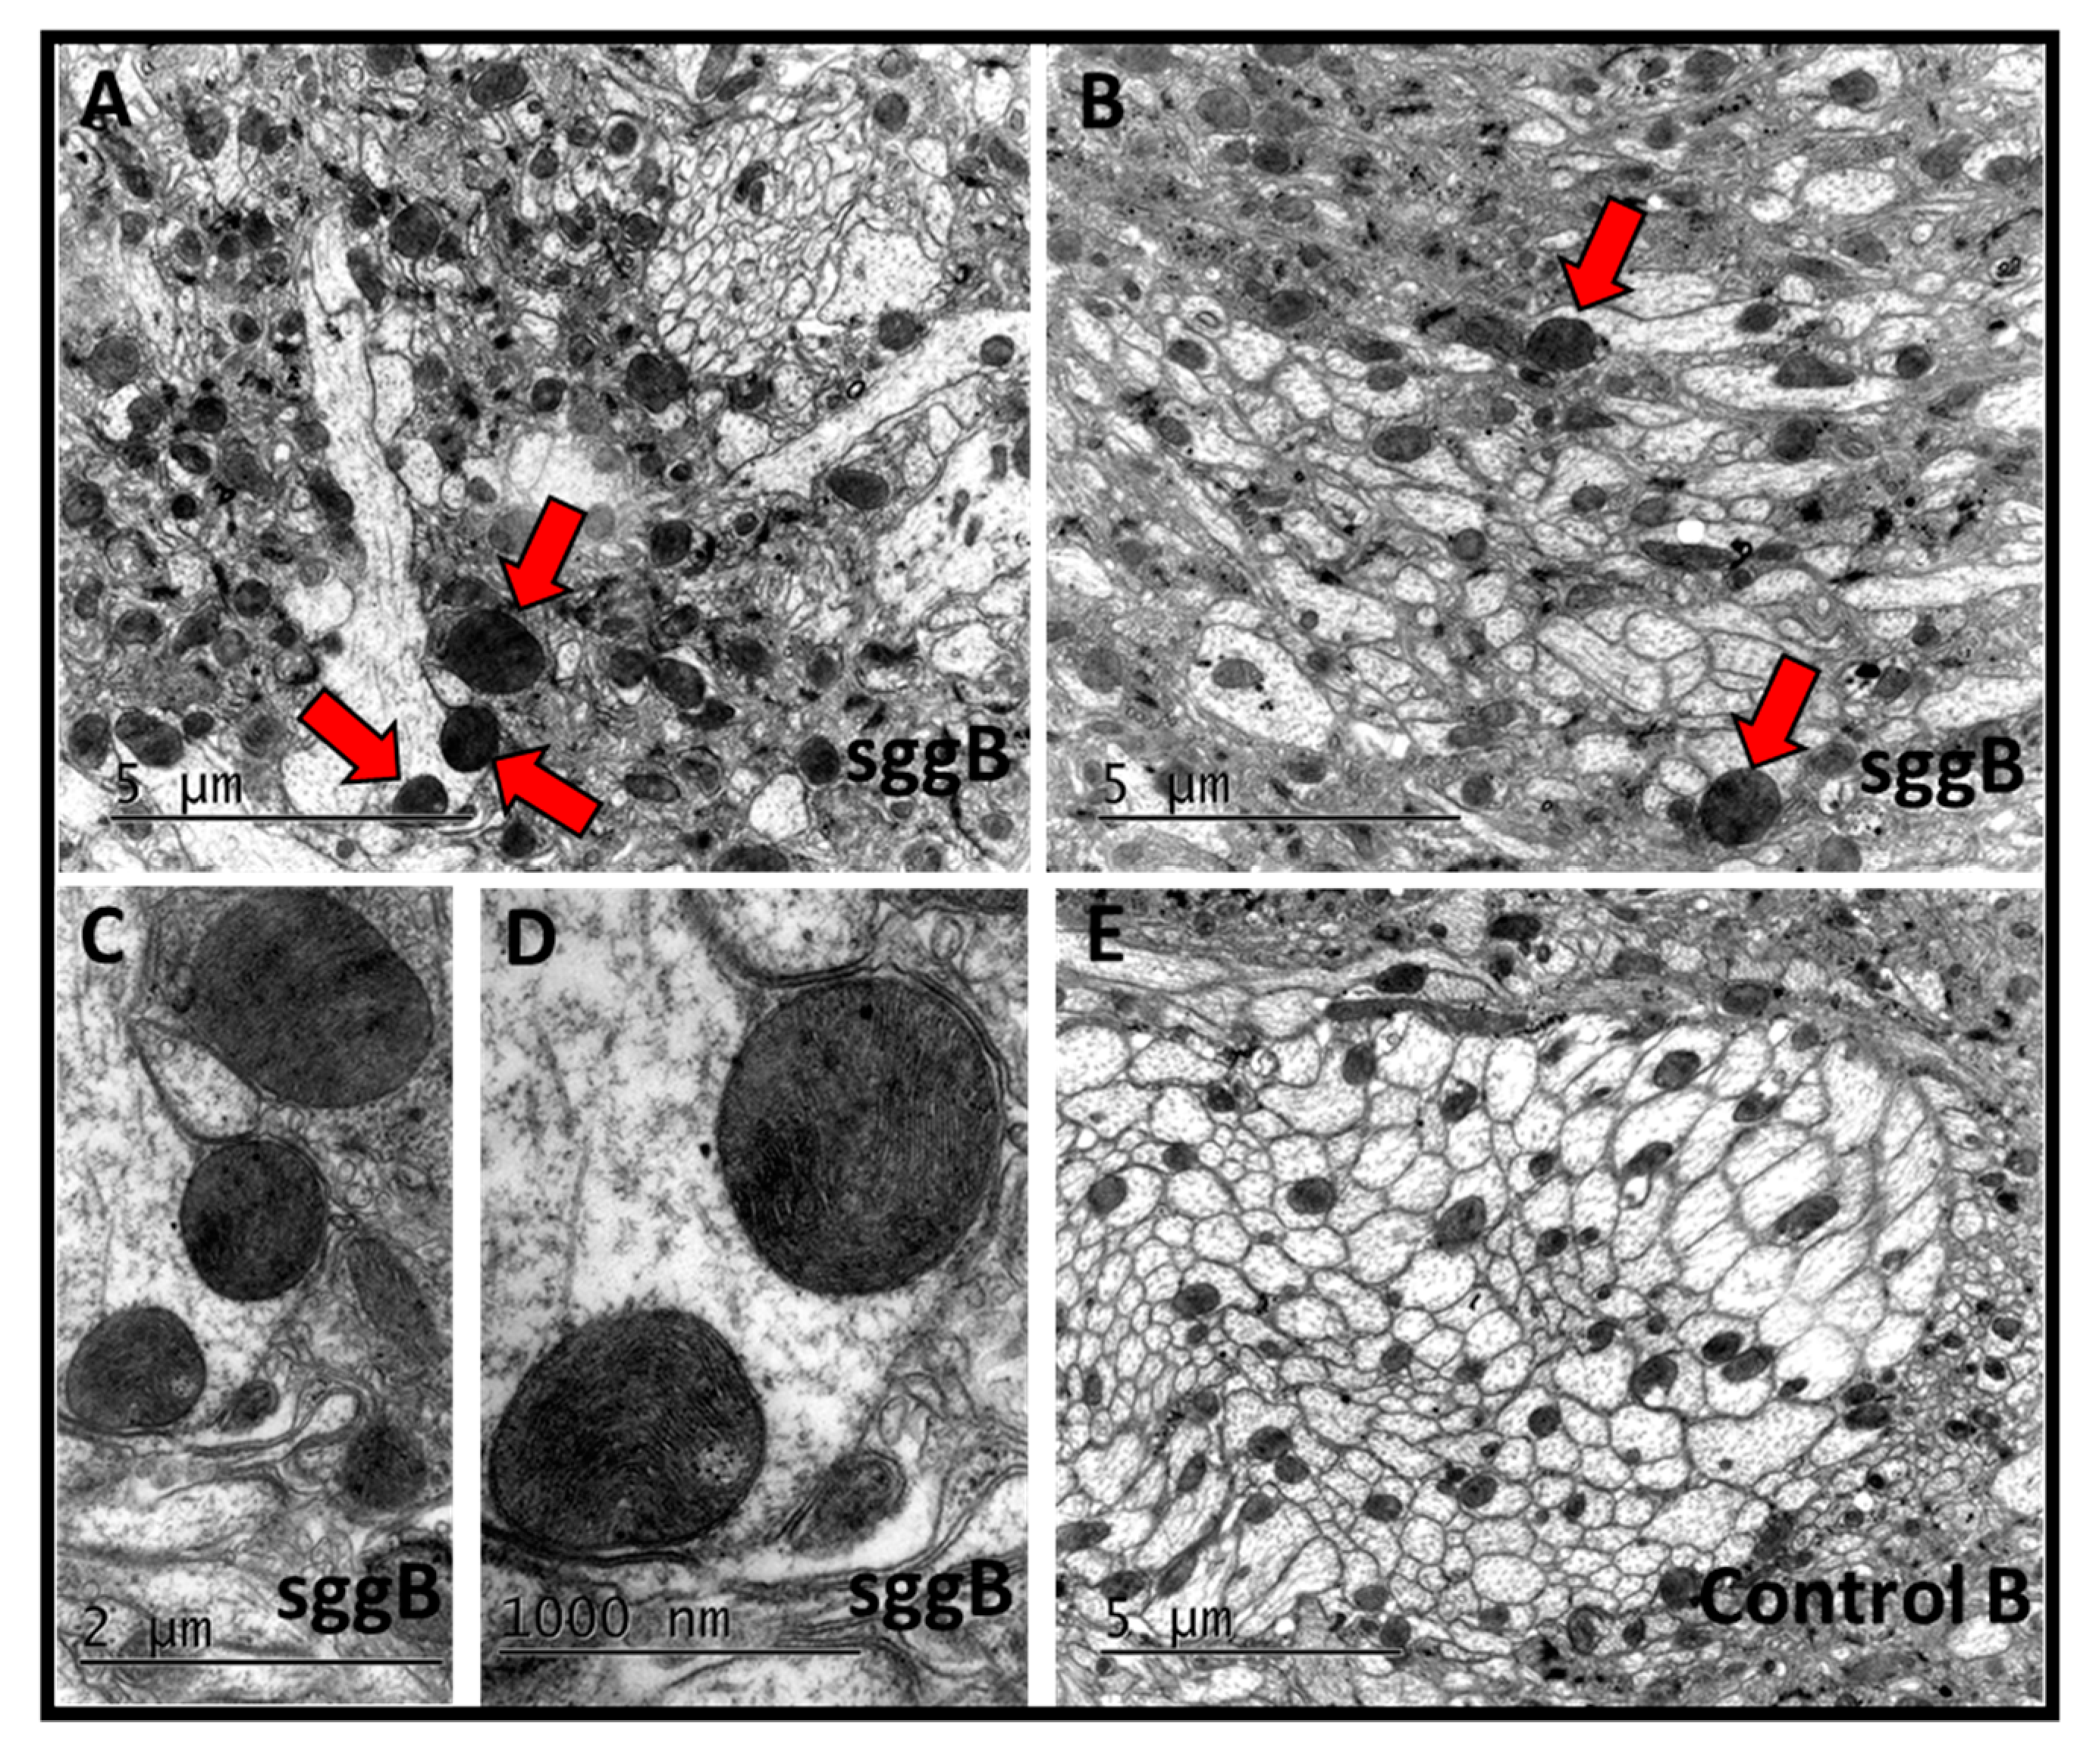
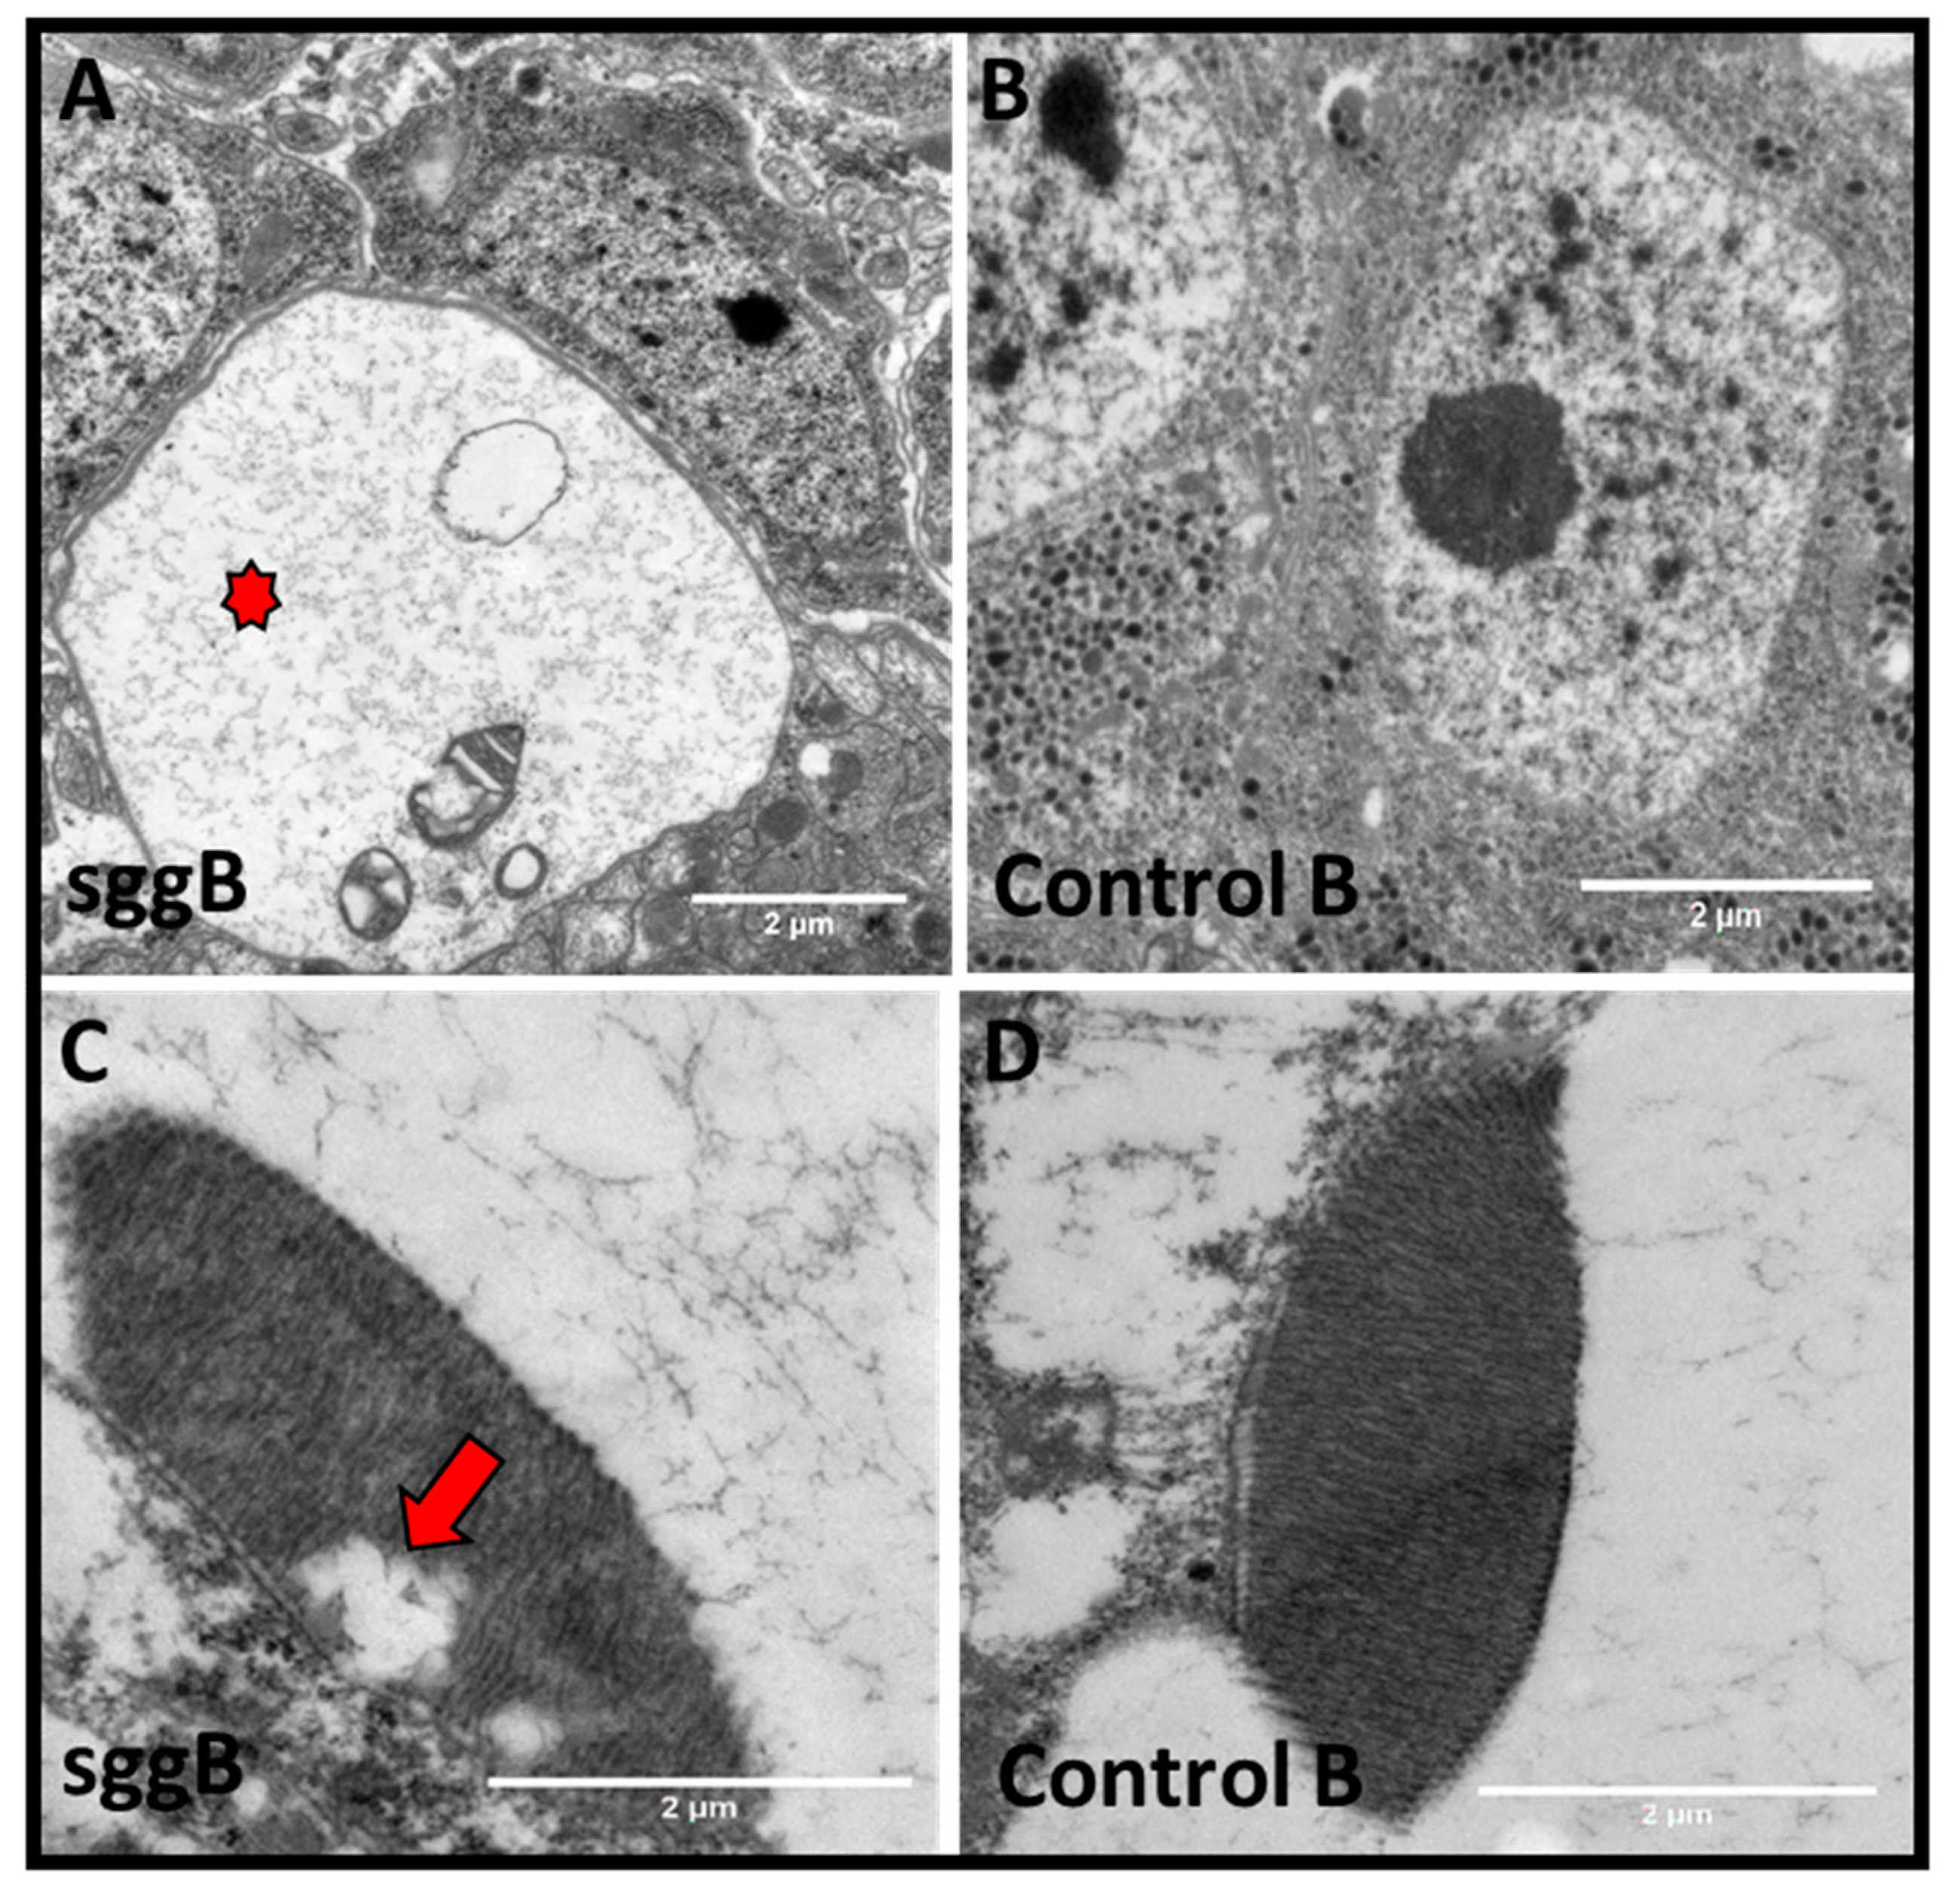
2.3.2. Mitochondria
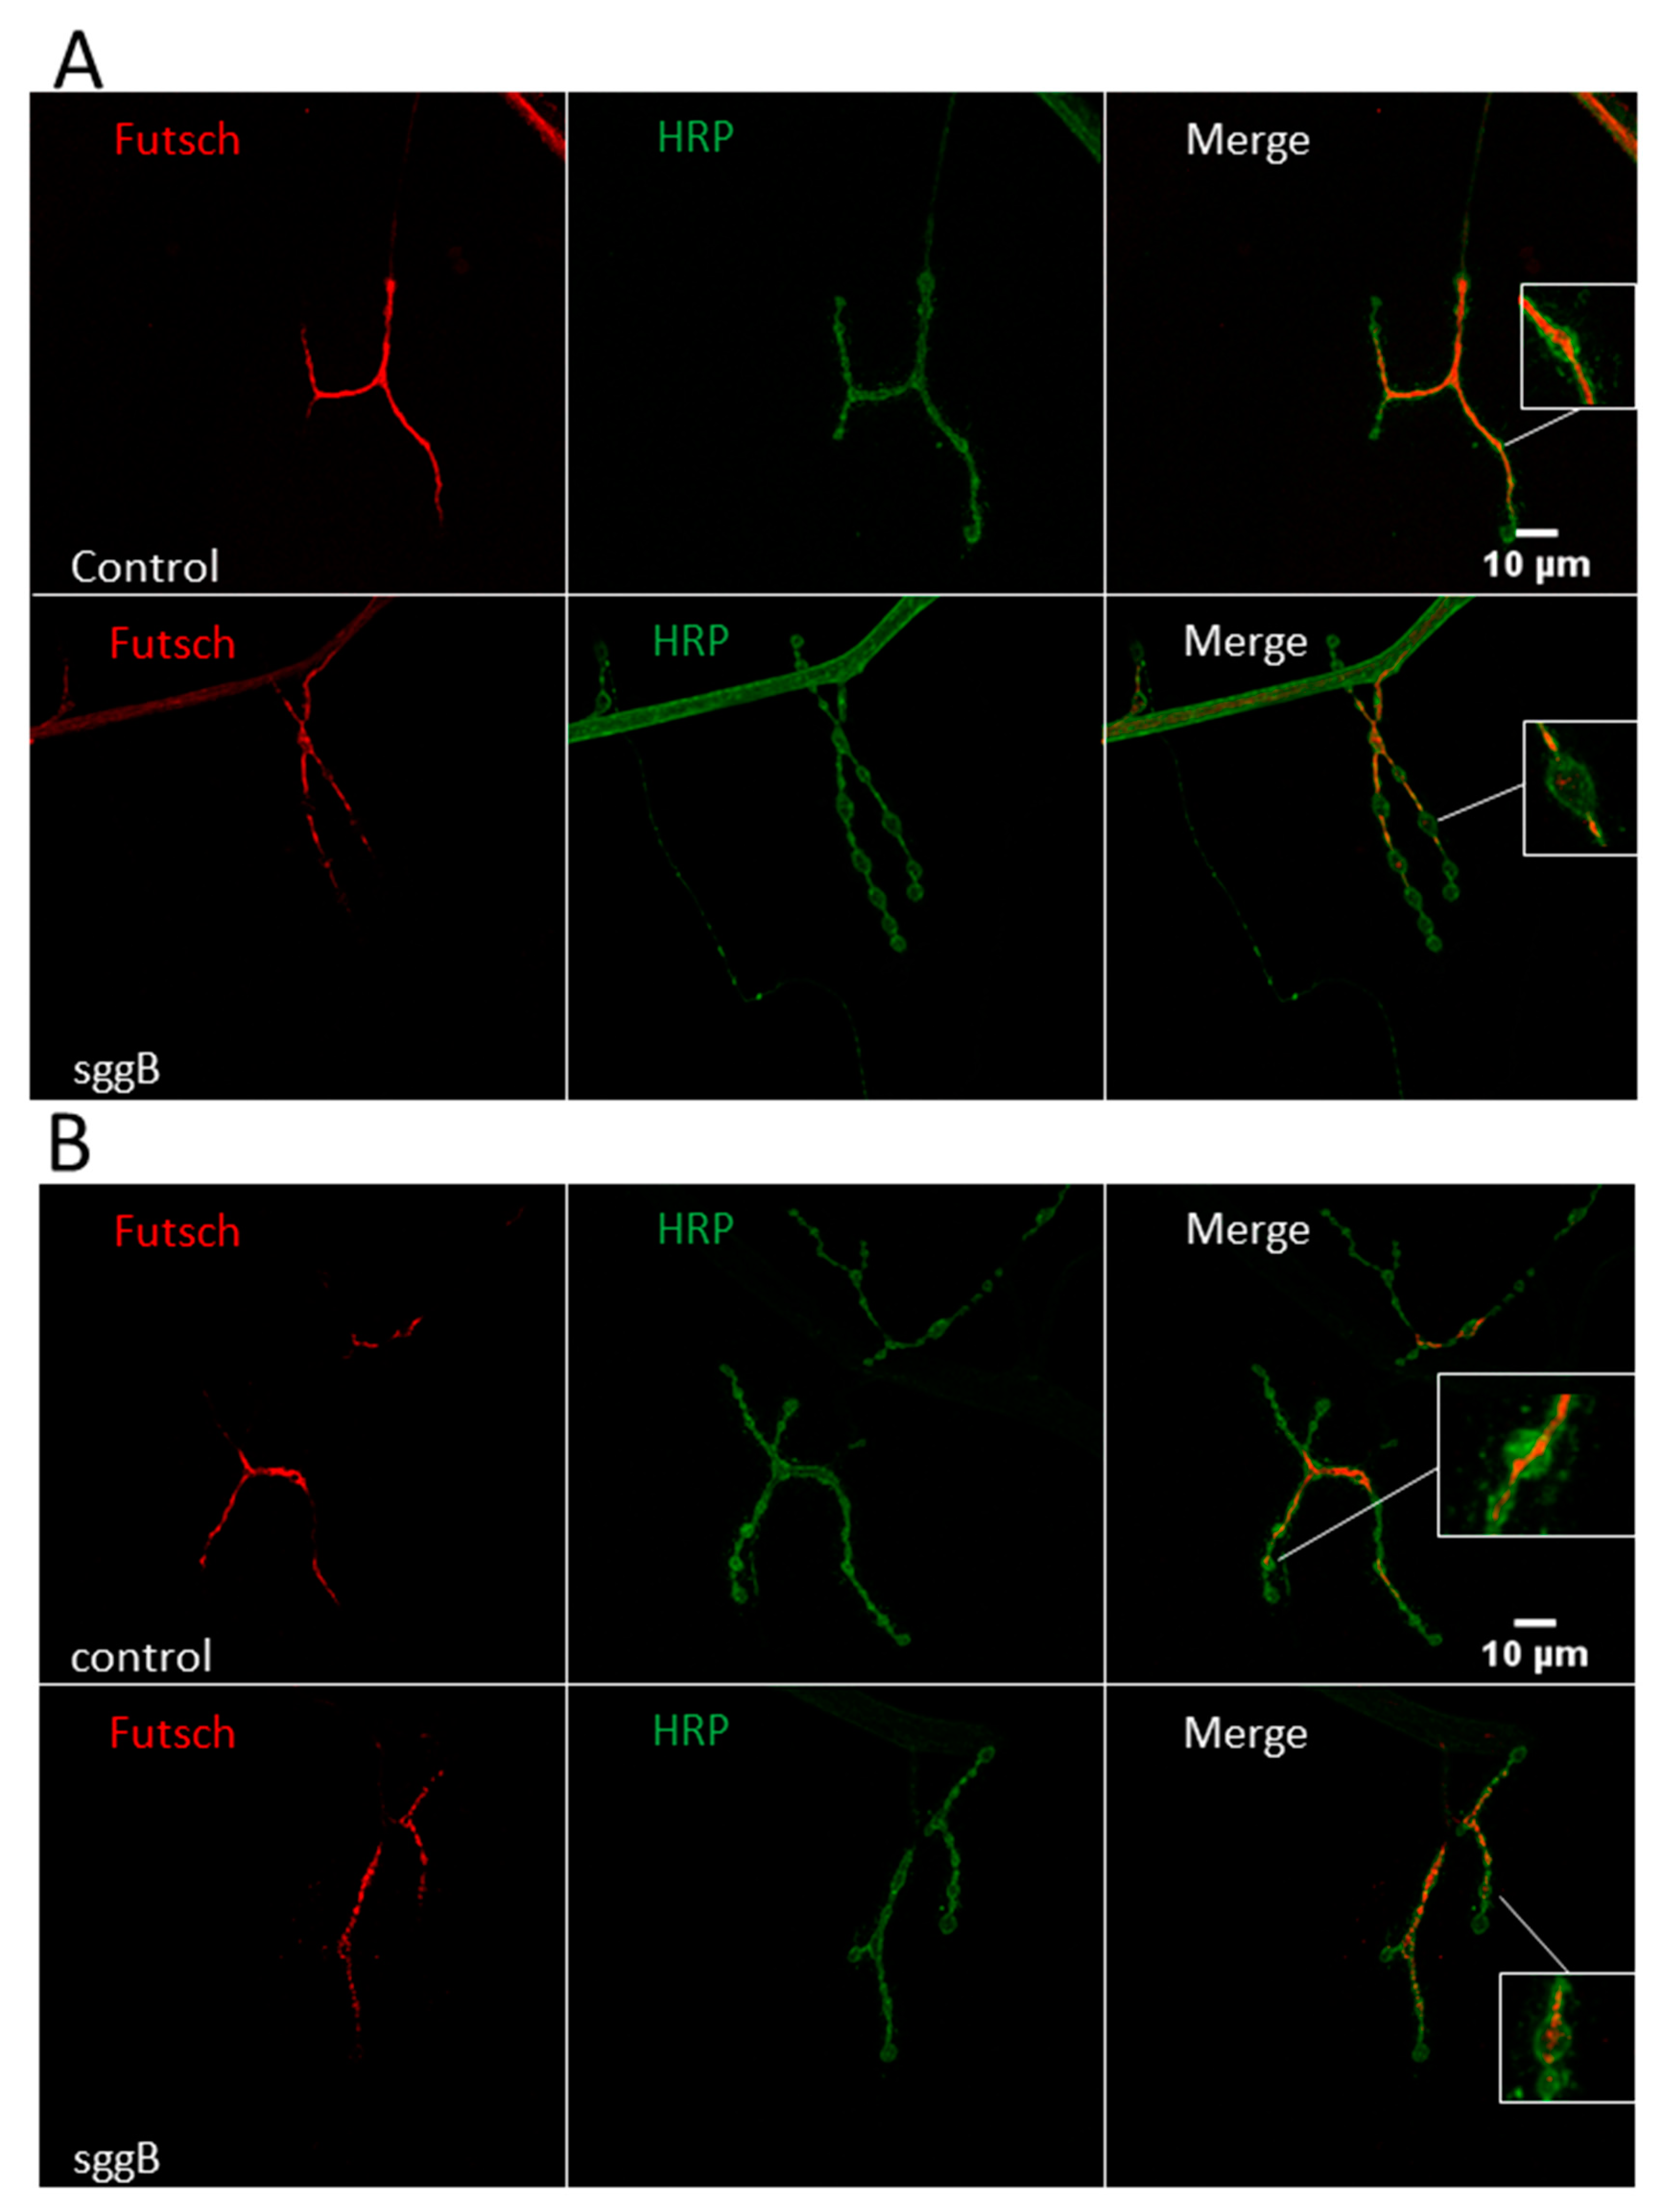
2.3.3. Cytoskeleton
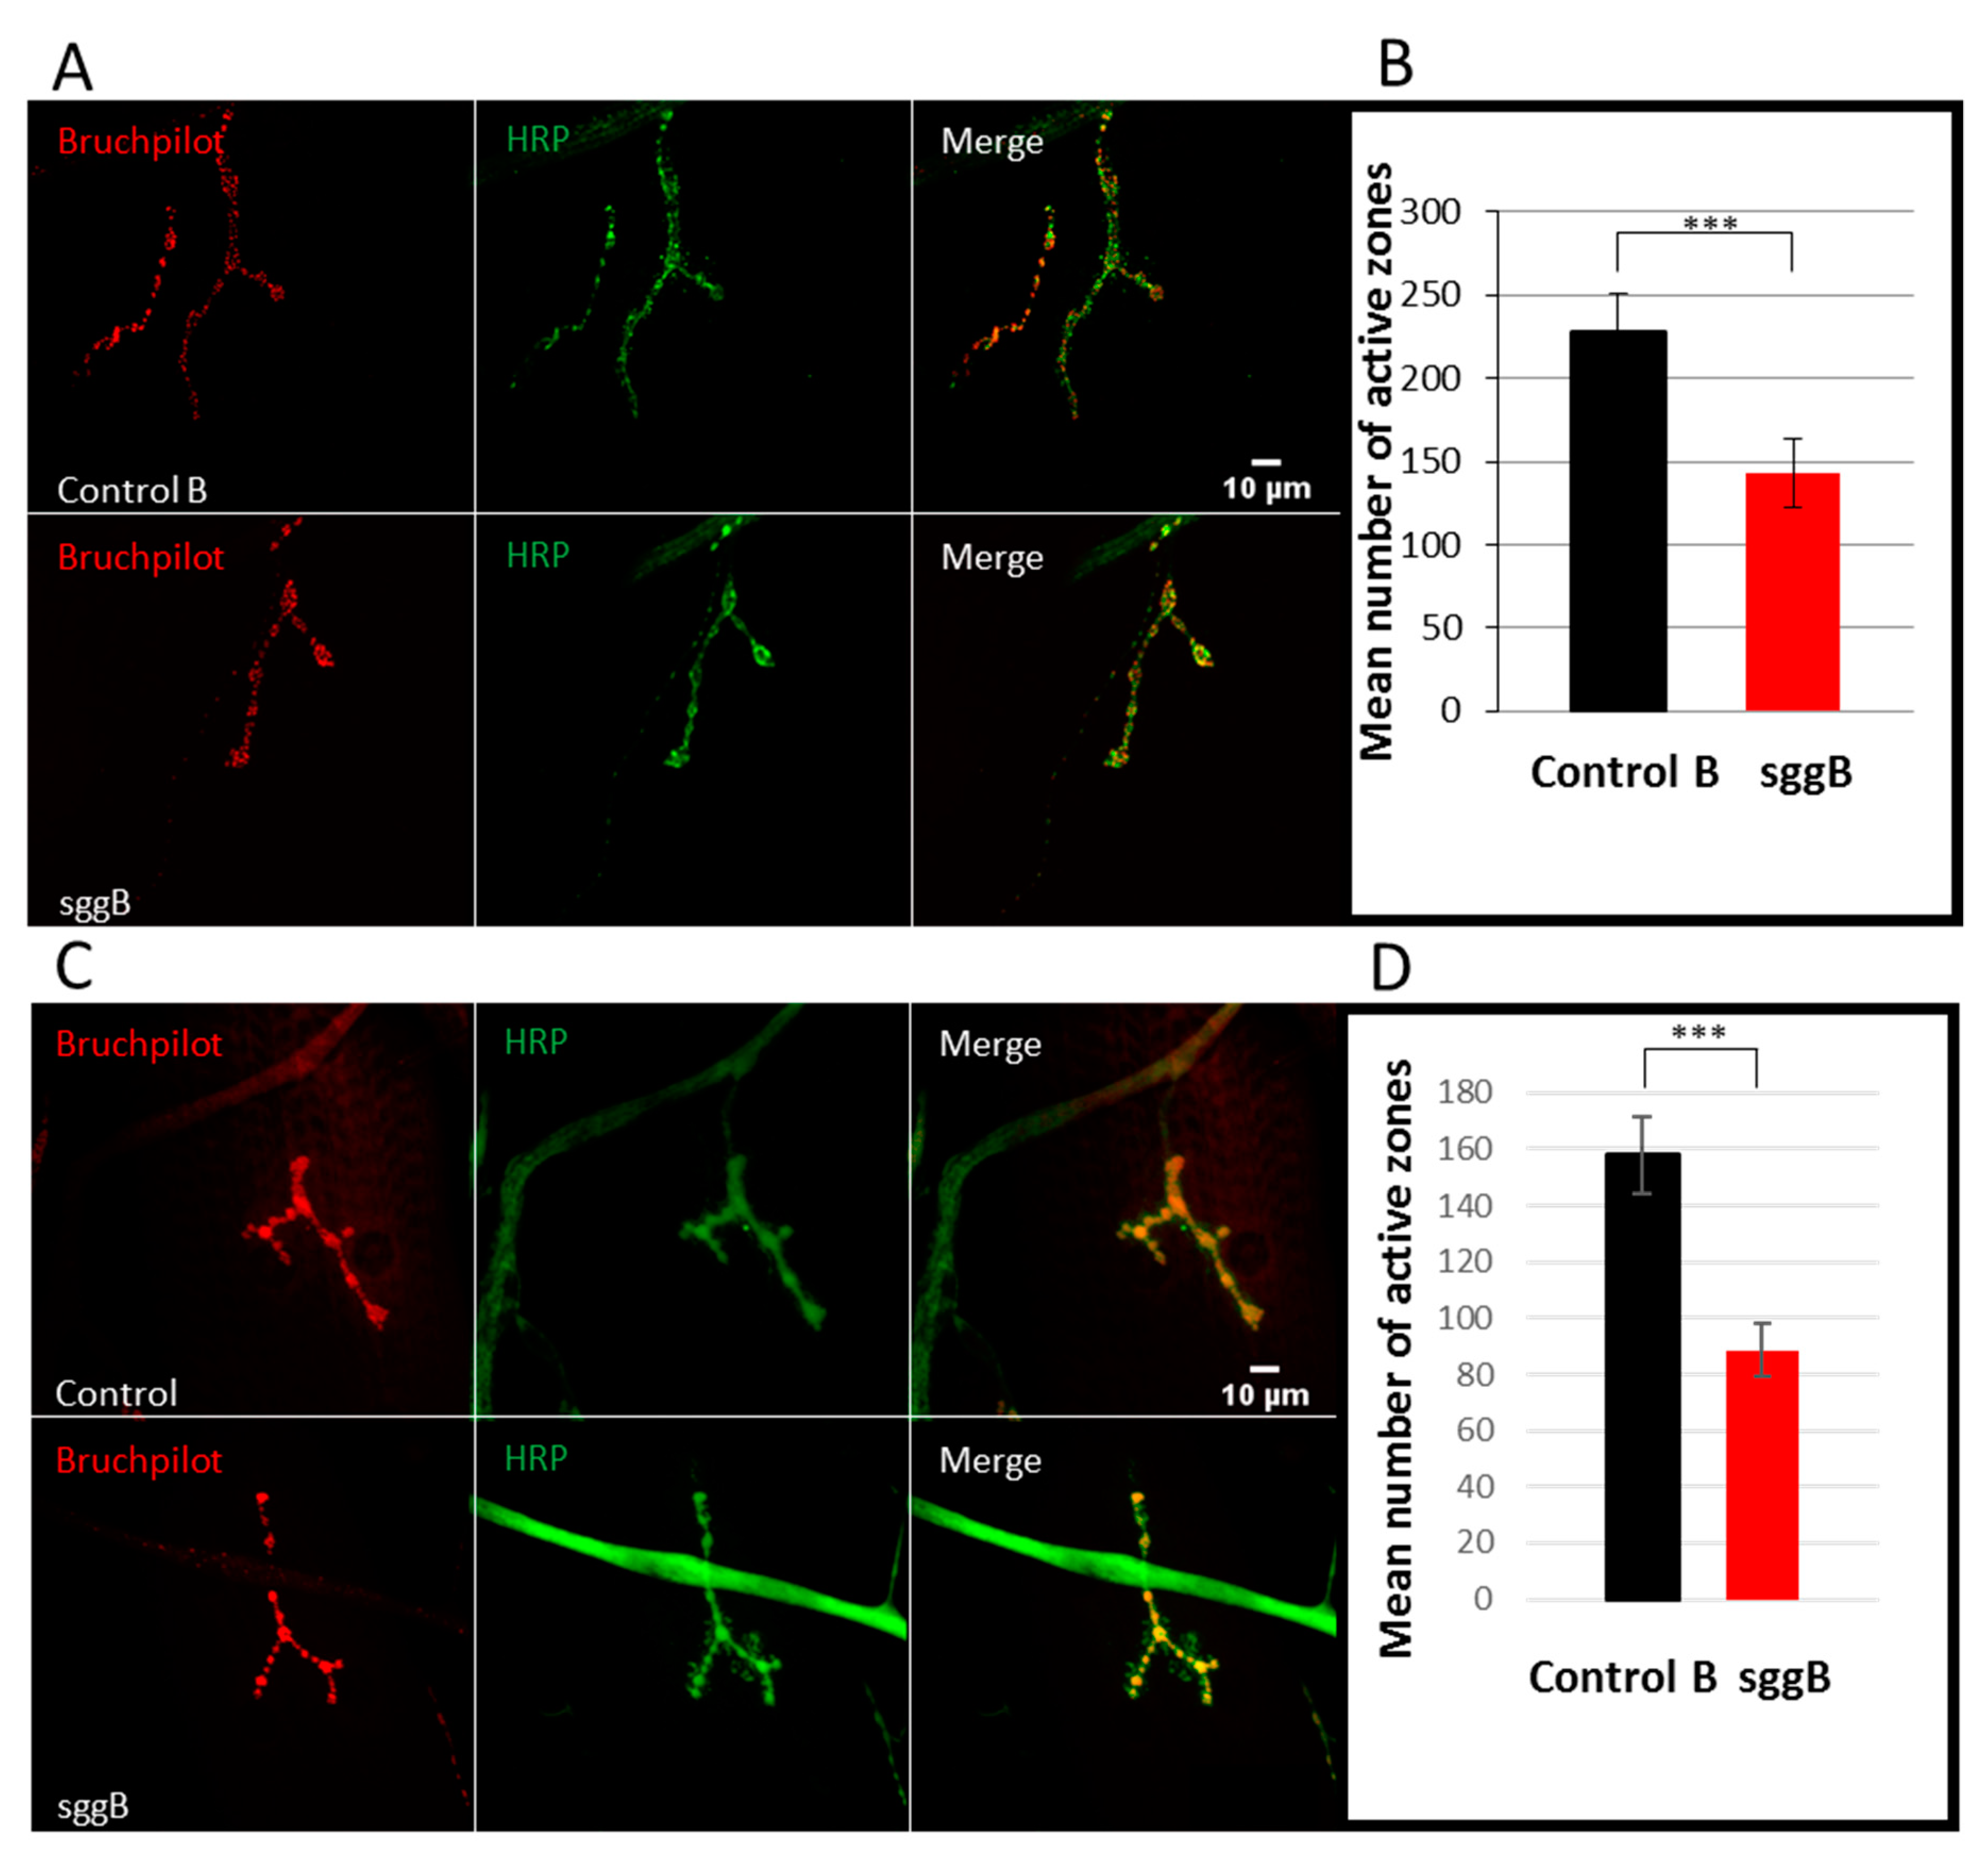
2.3.4. Active Synaptic Zones
2.3.5. Neuronal Structure
3. Materials and Methods
3.1. Fly Strains and Crosses
3.2. Tests for Wolbachia
3.3. Lifespan Assay
3.4. Locomotion Assay
3.5. Real-Time RT-qPCR
3.6. Immunostaining and Microscopy
3.7. Electron Microscopy
3.8. Western Blotting
3.9. Statistical Analyses
4. Conclusions
Supplementary Materials
Author Contributions
Funding
Acknowledgments
Conflicts of Interest
References
- McCubrey, J.A.; Rakus, D.; Gizak, A.; Steelman, L.S.; Abrams, S.L.; Lertpiriyapong, K.; Fitzgerald, T.L.; Yang, L.V.; Montalto, G.; Cervello, M.; et al. Effects of mutations in Wnt/β-catenin, hedgehog, Notch and PI3K pathways on GSK-3 activity-Diverse effects on cell growth, metabolism and cancer. Biochim. Biophys. Acta Mol. Cell Res. 2016, 1863, 2942–2976. [Google Scholar] [CrossRef]
- Patel, P.; Woodgett, J.R. Glycogen Synthase Kinase 3: A Kinase for All Pathways? Curr. Top. Dev. Biol. 2017, 123, 277–302. [Google Scholar] [CrossRef]
- Colosimo, P.F.; Liu, X.; Kaplan, N.A.; Tolwinski, N.S. GSK3beta affects apical-basal polarity and cell-cell adhesion by regulating aPKC levels. Dev. Dyn. 2010, 239, 115–125. [Google Scholar] [CrossRef] [PubMed]
- Kaplan, N.A.; Colosimo, P.F.; Liu, X.; Tolwinski, N.S. Complex interactions between GSK3 and aPKC in Drosophila embryonic epithelial morphogenesis. PLoS ONE 2011, 6, e18616. [Google Scholar] [CrossRef] [PubMed]
- Kanuka, H.; Kuranaga, E.; Takemoto, K.; Hiratou, T.; Okano, H.; Miura, M. Drosophila caspase transduces Shaggy/GSK-3beta kinase activity in neural precursor development. EMBO J. 2005, 24, 3793–3806. [Google Scholar] [CrossRef]
- Wong, J.J.L.; Li, S.; Lim, E.K.H.; Wang, Y.; Wang, C.; Zhang, H.; Kirilly, D.; Wu, C.; Liou, Y.-C.; Wang, H.; et al. A Cullin1-based SCF E3 ubiquitin ligase targets the InR/PI3K/TOR pathway to regulate neuronal pruning. PLoS Biol. 2013, 11, e1001657. [Google Scholar] [CrossRef]
- Franco, B.; Bogdanik, L.; Bobinnec, Y.; Debec, A.; Bockaert, J.; Parmentier, M.-L.; Grau, Y. Shaggy, the homolog of glycogen synthase kinase 3, controls neuromuscular junction growth in Drosoph. J. Neurosci. 2004, 24, 6573–6577. [Google Scholar] [CrossRef] [PubMed]
- Franciscovich, A.L.; Mortimer, A.D.V.; Freeman, A.A.; Gu, J.; Sanyal, S. Overexpression screen in Drosophila identifies neuronal roles of GSK-3β shaggy as a regulator of AP-1-dependent developmental plasticity. Genetics 2008, 180, 2057–2071. [Google Scholar] [CrossRef]
- Cuesto, G.; Jordán-Álvarez, S.; Enriquez-Barreto, L.; Ferrús, A.; Morales, M.; Acebes, Á. GSK3β inhibition promotes synaptogenesis in Drosophila and mammalian neurons. PLoS ONE 2015, 10, e0118475. [Google Scholar] [CrossRef] [PubMed]
- Chiang, A.; Priya, R.; Ramaswami, M.; Vijayraghavan, K.; Rodrigues, V. Neuronal activity and Wnt signaling act through Gsk3-beta to regulate axonal integrity in mature Drosophila olfactory sensory neurons. Development 2009, 136, 1273–1282. [Google Scholar] [CrossRef]
- Noble, W.; Hanger, D.P.; Miller, C.C.J.; Lovestone, S. The importance of tau phosphorylation for neurodegenerative diseases. Front Neurol. 2013, 4, 83. [Google Scholar] [CrossRef]
- Ma, T. GSK3 in Alzheimer’s disease: Mind the isoforms. J. Alzheimers Dis. 2014, 39, 707–710. [Google Scholar] [CrossRef] [PubMed]
- Mudher, A.; Shepherd, D.; Newman, T.A.; Mildren, P.; Jukes, J.P.; Squire, A.; Mears, A.; Drummond, J.A.; Berg, S.; MacKay, D.; et al. GSK-3beta inhibition reverses axonal transport defects and behavioural phenotypes in Drosoph. Mol. Psychiatry 2004, 9, 522–530. [Google Scholar] [CrossRef]
- Pasyukova, E.G.; Symonenko, A.V.; Roshina, N.V.; Trostnikov, M.V.; Veselkina, E.R.; Rybina, O.Y. Neuronal genes and developmental neuronal pathways in Drosophila life span control. In Life Extension: Lessons from Drosophila; Vaiserman, A.M., Moskalev, A.A., Pasyukova, E.G., Eds.; Springer International Publishing: Cham, Switzerland, 2015; pp. 3–37. [Google Scholar]
- Symonenko, A.V.; Roshina, N.V.; Krementsova, A.V.; Pasyukova, E.G. Reduced neuronal transcription of escargot, the Drosophila gene tncoding a Snail-type transcription factor, promotes longevity. Front. Genet. 2018, 9, 151. [Google Scholar] [CrossRef]
- Roshina, N.V.; Symonenko, A.V.; Krementsova, A.V.; Trostnikov, M.V.; Pasyukova, E.G. Embryonic expression of shuttle craft, a Drosophila gene involved in neuron development, is associated with adult lifespan. Aging (Albany NY) 2014, 6, 1076–1093. [Google Scholar] [CrossRef]
- Hernandez, F.; Lucas, J.J.; Avila, J. GSK3 and tau: Two convergence points in Alzheimer’s disease. J. Alzheimers Dis. 2013, 33, S141–S144. [Google Scholar] [CrossRef]
- Ruel, L.; Bourouis, M.; Heitzler, P.; Pantesco, V.; Simpson, P. Drosophila shaggy kinase and rat glycogen synthase kinase-3 have conserved activities and act downstream of Notch. Nature 1993, 362, 557–560. [Google Scholar] [CrossRef]
- Bourouis, M. Targeted increase in shaggy activity levels blocks wingless signaling. Genesis 2002, 34, 99–102. [Google Scholar] [CrossRef]
- Bodenmiller, B.; Mueller, L.N.; Pedrioli, P.G.A.; Pflieger, D.; Jünger, M.A.; Eng, J.K.; Aebersold, R.; Tao, W.A. An integrated chemical, mass spectrometric and computational strategy for (quantitative) phosphoproteomics: Application to Drosophila melanogaster Kc167 cells. Mol. Biosyst. 2007, 3, 275–286. [Google Scholar] [CrossRef] [PubMed]
- Brunner, E.; Ahrens, C.H.; Mohanty, S.; Baetschmann, H.; Loevenich, S.; Potthast, F.; Deutsch, E.W.; Panse, C.; de Lichtenberg, U.; Rinner, O.; et al. A high-quality catalog of the Drosophila melanogaster proteome. Nat. Biotechnol. 2007, 25, 576–583. [Google Scholar] [CrossRef]
- Tress, M.L.; Bodenmiller, B.; Aebersold, R.; Valencia, A. Proteomics studies confirm the presence of alternative protein isoforms on a large scale. Genome Biol. 2008, 9, R162. [Google Scholar] [CrossRef] [PubMed]
- Wolf, F.W.; Eddison, M.; Lee, S.; Cho, W.; Heberlein, U. GSK-3/Shaggy regulates olfactory habituation in Drosophila. Proc. Natl. Acad. Sci. USA 2007, 104, 4653–4657. [Google Scholar] [CrossRef]
- Giannakou, M.E.; Goss, M.; Jünger, M.A.; Hafen, E.; Leevers, S.J.; Partridge, L. Long-lived Drosophila with overexpressed dFOXO in adult fat body. Science 2004, 305, 361. [Google Scholar] [CrossRef] [PubMed]
- Bai, H.; Kang, P.; Tatar, M. Drosophila insulin-like peptide-6 (dilp6) expression from fat body extends lifespan and represses secretion of Drosophila insulin-like peptide-2 from the brain. Aging Cell 2012, 11, 978–985. [Google Scholar] [CrossRef] [PubMed]
- Hoffmann, J.; Romey, R.; Fink, C.; Yong, L.; Roeder, T. Overexpression of Sir2 in the adult fat body is sufficient to extend lifespan of male and female Drosophila. Aging (Albany NY) 2013, 5, 315–327. [Google Scholar] [CrossRef]
- Rybina, O.Y.; Sarantseva, S.V.; Veselkina, E.R.; Bolschakova, O.I.; Symonenko, A.V.; Krementsova, A.V.; Ryabova, E.V.; Roshina, N.V.; Pasyukova, E.G. Tissue-specific transcription of the neuronal gene Lim3 affects Drosophila melanogaster lifespan and locomotion. Biogerontology 2017, 18, 739–757. [Google Scholar] [CrossRef]
- Brand, A.H.; Perrimon, N. Targeted gene expression as a means of altering cell fates and generating dominant phenotypes. Development 1993, 118, 401–415. [Google Scholar] [PubMed]
- Tower, J. Sex-specific gene expression and life span regulation. Trends Endocrinol. Metab. 2017, 28, 735–747. [Google Scholar] [CrossRef] [PubMed]
- Vigoreaux, J.O.; Tobin, S.L. Stage-specific selection of alternative transcriptional initiation sites from the 5C actin gene of Drosophila melanogaster. Genes Dev. 1987, 1, 1161–1171. [Google Scholar] [CrossRef] [PubMed][Green Version]
- Uv, A.E.; Harrison, E.J.; Bray, S.J. Tissue-specific splicing and functions of the Drosophila transcription factor Grainyhead. Mol. Cell. Biol. 1997, 17, 6727–6735. [Google Scholar] [CrossRef]
- Jones, L.; Richardson, H.; Saint, R. Tissue-specific regulation of cyclin E transcription during Drosophila melanogaster embryogenesis. Development 2000, 127, 4619–4630. [Google Scholar]
- Golpich, M.; Amini, E.; Hemmati, F.; Ibrahim, N.M.; Rahmani, B.; Mohamed, Z.; Raymond, A.A.; Dargahi, L.; Ghasemi, R.; Ahmadiani, A. Glycogen synthase kinase-3 beta (GSK-3β) signaling: Implications for Parkinson’s disease. Pharmacol. Res. 2015, 97, 16–26. [Google Scholar] [CrossRef]
- Choi, H.; Koh, S.-H. Understanding the role of glycogen synthase kinase-3 in L-DOPA-induced dyskinesia in Parkinson’s disease. Expert. Opin. Drug Metab. Toxicol. 2018, 14, 83–90. [Google Scholar] [CrossRef]
- Blagosklonny, M.V. MTOR-driven quasi-programmed aging as a disposable soma theory: Blind watchmaker vs. intelligent designer. Cell Cycle 2013, 12, 1842–1847. [Google Scholar] [CrossRef]
- Xie, T.; Ho, M.C.W.; Liu, Q.; Horiuchi, W.; Lin, C.-C.; Task, D.; Luan, H.; White, B.H.; Potter, C.J.; Wu, M.N. A genetic toolkit for dissecting dopamine circuit function in Drosophila. Cell Rep. 2018, 23, 652–665. [Google Scholar] [CrossRef]
- Ridgel, A.L.; Ritzmann, R.E. Insights into age-related locomotor declines from studies of insects. Ageing Res. Rev. 2005, 4, 23–39. [Google Scholar] [CrossRef]
- Cui, H.; Kong, Y.; Zhang, H. Oxidative stress, mitochondrial dysfunction, and aging. J. Signal Transduct. 2012, 2012, 646354. [Google Scholar] [CrossRef] [PubMed]
- Orr, W.C.; Radyuk, S.N.; Sohal, R.S. Involvement of redox state in the aging of Drosophila melanogaster. Antioxid. Redox Signal. 2013, 19, 788–803. [Google Scholar] [CrossRef] [PubMed]
- Kann, O.; Kovács, R. Mitochondria and neuronal activity. Am. J. Physiol. Cell Physiol. 2007, 292, C641–C657. [Google Scholar] [CrossRef]
- Ruiz-Cañada, C.; Budnik, V. Introduction on the use of the Drosophila embryonic/larval neuromuscular junction as a model system to study synapse development and function, and a brief summary of pathfinding and target recognition. Int. Rev. Neurobiol. 2006, 75, 1–31. [Google Scholar] [CrossRef]
- Course, M.M.; Wang, X. Transporting mitochondria in neurons. F1000Res 2016, 18, 5. [Google Scholar] [CrossRef]
- Chen, S.; Owens, G.C.; Crossin, K.L.; Edelman, D.B. Serotonin stimulates mitochondrial transport in hippocampal neurons. Mol. Cell. Neurosci. 2007, 36, 472–483. [Google Scholar] [CrossRef] [PubMed]
- Morfini, G.; Szebenyi, G.; Elluru, R.; Ratner, N.; Brady, S.T. Glycogen synthase kinase 3 phosphorylates kinesin light chains and negatively regulates kinesin-based motility. EMBO J. 2002, 21, 281–293. [Google Scholar] [CrossRef]
- Chen, S.; Owens, G.C.; Edelman, D.B. Dopamine inhibits mitochondrial motility in hippocampal neurons. PLoS ONE 2008, 3, e2804. [Google Scholar] [CrossRef]
- Gao, F.J.; Hebbar, S.; Gao, X.A.; Alexander, M.; Pandey, J.P.; Walla, M.D.; Cotham, W.E.; King, S.J.; Smith, D.S. GSK-3β phosphorylation of cytoplasmic dynein reduces Ndel1 binding to intermediate chains and alters dynein motility. Traffic 2015, 16, 941–961. [Google Scholar] [CrossRef]
- Ogawa, F.; Murphy, L.C.; Malavasi, E.L.; O’Sullivan, S.T.; Torrance, H.S.; Porteous, D.J.; Millar, J.K. NDE1 and GSK3β associate with TRAK1 and regulate axonal mitochondrial motility: Identification of cyclic AMP as a novel modulator of axonal mitochondrial trafficking. ACS Chem. Neurosci. 2016, 7, 553–564. [Google Scholar] [CrossRef]
- Roos, J.; Hummel, T.; Ng, N.; Klämbt, C.; Davis, G.W. Drosophila Futsch regulates synaptic microtubule organization and is necessary for synaptic growth. Neuron 2000, 26, 371–382. [Google Scholar] [CrossRef]
- Wang, J.-W.; Beck, E.S.; McCabe, B.D. A modular toolset for recombination transgenesis and neurogenetic analysis of Drosophila. PLoS ONE 2012, 7, e42102. [Google Scholar] [CrossRef]
- Bischof, J.; Maeda, R.K.; Hediger, M.; Karch, F.; Basler, K. An optimized transgenesis system for Drosophila using germ-line-specific phiC31 integrases. Proc. Natl. Acad. Sci. USA 2007, 104, 3312–3317. [Google Scholar] [CrossRef]
- McGraw, E.A.; O’Neill, S.L. Wolbachia pipientis: Intracellular infection and pathogenesis in Drosophila. Curr. Opin. Microbiol. 2004, 7, 67–70. [Google Scholar] [CrossRef] [PubMed]
- Werren, J.H.; Windsor, D.M. Wolbachia infection frequencies in insects: Evidence of a global equilibrium? Proc. Biol. Sci. 2000, 267, 1277–1285. [Google Scholar] [CrossRef] [PubMed]
- Holden, P.R.; Jones, P.; Brookfield, J.F. Evidence for a Wolbachia symbiont in Drosophila melanogaster. Genet. Res. 1993, 62, 23–29. [Google Scholar]
- Wagh, D.A.; Rasse, T.M.; Asan, E.; Hofbauer, A.; Schwenkert, I.; Dürrbeck, H.; Buchner, S.; Dabauvalle, M.-C.; Schmidt, M.; Qin, G.; et al. Bruchpilot, a protein with homology to ELKS/CAST, is required for structural integrity and function of synaptic active zones in Drosophila. Neuron 2006, 49, 833–844. [Google Scholar] [CrossRef]
- Sherwood, N.T.; Sun, Q.; Xue, M.; Zhang, B.; Zinn, K. Drosophila spastin regulates synaptic microtubule networks and is required for normal motor function. PLoS Biol. 2004, 2, e429. [Google Scholar] [CrossRef]
- Wilmoth, J.R.; Horiuchi, S. Rectangularization revisited: Variability of age at death within human populations. Demography 1999, 36, 475–495. [Google Scholar] [CrossRef] [PubMed]
- Carey, J.R. Longevity: The Biology and Demography of Life Span; Princeton University Press: Princeton, NT, USA, 2003. [Google Scholar]


© 2019 by the authors. Licensee MDPI, Basel, Switzerland. This article is an open access article distributed under the terms and conditions of the Creative Commons Attribution (CC BY) license (http://creativecommons.org/licenses/by/4.0/).
Share and Cite
Trostnikov, M.V.; Roshina, N.V.; Boldyrev, S.V.; Veselkina, E.R.; Zhuikov, A.A.; Krementsova, A.V.; Pasyukova, E.G. Disordered Expression of shaggy, the Drosophila Gene Encoding a Serine-Threonine Protein Kinase GSK3, Affects the Lifespan in a Transcript-, Stage-, and Tissue-Specific Manner. Int. J. Mol. Sci. 2019, 20, 2200. https://doi.org/10.3390/ijms20092200
Trostnikov MV, Roshina NV, Boldyrev SV, Veselkina ER, Zhuikov AA, Krementsova AV, Pasyukova EG. Disordered Expression of shaggy, the Drosophila Gene Encoding a Serine-Threonine Protein Kinase GSK3, Affects the Lifespan in a Transcript-, Stage-, and Tissue-Specific Manner. International Journal of Molecular Sciences. 2019; 20(9):2200. https://doi.org/10.3390/ijms20092200
Chicago/Turabian StyleTrostnikov, Mikhail V., Natalia V. Roshina, Stepan V. Boldyrev, Ekaterina R. Veselkina, Andrey A. Zhuikov, Anna V. Krementsova, and Elena G. Pasyukova. 2019. "Disordered Expression of shaggy, the Drosophila Gene Encoding a Serine-Threonine Protein Kinase GSK3, Affects the Lifespan in a Transcript-, Stage-, and Tissue-Specific Manner" International Journal of Molecular Sciences 20, no. 9: 2200. https://doi.org/10.3390/ijms20092200
APA StyleTrostnikov, M. V., Roshina, N. V., Boldyrev, S. V., Veselkina, E. R., Zhuikov, A. A., Krementsova, A. V., & Pasyukova, E. G. (2019). Disordered Expression of shaggy, the Drosophila Gene Encoding a Serine-Threonine Protein Kinase GSK3, Affects the Lifespan in a Transcript-, Stage-, and Tissue-Specific Manner. International Journal of Molecular Sciences, 20(9), 2200. https://doi.org/10.3390/ijms20092200