Article

Comparative Genome-wide Analysis and Expression Profiling of Histone Acetyltransferase (HAT) Gene Family in Response to Hormonal Applications, Metal and Abiotic Stresses in Cotton

1
School of Life Sciences, Tsinghua University, Beijing 100084, China
2
State Key Laboratory of Plant Cell and Chromosome Engineering, Institute of Genetics and Developmental Biology, Chinese Academy of Sciences, Beijing 100101, China
3
Department of Environmental Sciences, COMSATS University Islamabad, Abbottabad campus, Abbottabad 22060, Pakistan
4
Institute of Soil & Environmental Sciences, University of Agriculture, Faisalabad 38000, Pakistan
5
Department of Biology, University of Western Ontario, 1151 Richmond St, London, ON N6A5B8 Canada
6
Department of Plant breeding and Genetics, Ghazi University, Dera Ghazi Khan 32200, Pakistan
7
Forage & Range Research, United States Department of Agriculture, Agricultural Research Service, Logan, UT 84322, USA
*
Authors to whom correspondence should be addressed.
Int. J. Mol. Sci. 2019, 20(21), 5311; https://doi.org/10.3390/ijms20215311
Submission received: 26 August 2019 / Revised: 22 October 2019 / Accepted: 24 October 2019 / Published: 25 October 2019
(This article belongs to the Special Issue Mapping Abiotic Stress-Tolerance Genes in Plants)

Abstract

:
Post-translational modifications are involved in regulating diverse developmental processes. Histone acetyltransferases (HATs) play vital roles in the regulation of chromation structure and activate the gene transcription implicated in various cellular processes. However, HATs in cotton, as well as their regulation in response to developmental and environmental cues, remain unidentified. In this study, 9 HATs were identified from Gossypium raimondi and Gossypium arboretum, while 18 HATs were identified from Gossypium hirsutum. Based on their amino acid sequences, Gossypium HATs were divided into three groups: CPB, GNAT, and TAFII250. Almost all the HATs within each subgroup share similar gene structure and conserved motifs. Gossypium HATs are unevenly distributed on the chromosomes, and duplication analysis suggests that Gossypium HATs are under strong purifying selection. Gene expression analysis showed that Gossypium HATs were differentially expressed in various vegetative tissues and at different stages of fiber development. Furthermore, all the HATs were differentially regulated in response to various stresses (salt, drought, cold, heavy metal and DNA damage) and hormones (abscisic acid (ABA) and auxin (NAA)). Finally, co-localization of HAT genes with reported quantitative trait loci (QTL) of fiber development were reported. Altogether, these results highlight the functional diversification of HATs in cotton growth and fiber development, as well as in response to different environmental cues. This study enhances our understanding of function of histone acetylation in cotton growth, fiber development, and stress adaptation, which will eventually lead to the long-term improvement of stress tolerance and fiber quality in cotton.

1. Introduction

Nucleosomes, the basic unit of chromatin, are composed of 147 bp of DNA wrapped around a histone octamer (two copies of each of H2A, H2B, H3, and H4 histone proteins). Nucleosomes are dynamic in response to developmental and environmental signals, thus altering the DNA accessibility and DNA-template processes to regulate the various processes in plants, including flowering time, root growth, and response to environmental changes [1,2]. Cells use several mechanisms, including post-translational histone modification and DNA methylation, to regulate the gene expression. The N-terminal tails of histone are subjected to various post-translational modifications, including histone acetylation, methylation, etc. [3]. Histone acetylation is carried out by histone acetyltransferases (HATs) in eukaryotes and is associated with transcriptional activation. Histone acetylation can be detected on different lysine residues of histone H3 and H4. For example, in Arabidopsis, K9, K14, K18, K23 and K27 of histone H3, and K5, K8, K12, K16, and K20 of H4 are acetylated [4,5]. HATs are well-conserved in yeast, animals, and plants, suggesting the functional conservation of histone acetylation in transcriptional activation. Plant HATs were classified into different subclasses based on their sequence homology to yeast and animal HATs and their mode of action: (1) The Gcn5-related N-acetyltransferase (GNAT)/MYST (Moz, YBF2, Sas2p, Tip) family, (2) CREB-binding Protein (CBP) family, and (3) TBP-associated factorII 250 (TAFII250) family [6].
In plants, the genome-wide analysis of HATs has been performed in several species, including Arabidopsis [7], rice [8], Vitis vinifera [9], and Citrus sinensis [10]. HATs have been widely reported to play an important role in various aspects of plant development, including floral development [11,12,13], root growth [14], and gametophyte development [15]. In addition to developmental functions, HATs are also involved in plant adaptation to various environmental fluctuations, such as salt stress [16], cold stress [17], heat stress [18], light signaling [19], abscisic acid (ABA) [20], and other hormone signaling [21]. Therefore, the understanding of HATs functions in field crops may play an important role in sustainable agriculture and food security.
Cotton, as a major source of natural and renewable textile fiber, holds a significant value in the world economy and in daily human life [22]. Gossypium hirsutum is a natural allotetraploid (AADD) that arose from the interspecific hybridization between Gossypium arboretum (AA) and Gossypium raimondii (DD), which occurred approximately 1–2 million years ago [23]. Because allopolyploid cotton produces a superior quality of fiber with high yield compared with their diploid progenitors [24], G. hirsutum is widely grown in many parts of the world and contributes to more than 90% of commercial cotton production [25]. On the one hand, world climate is changing quickly, and the abiotic stresses are severely affecting the cotton yield and fiber quality [26,27]. On the other hand, the increasing world population demands the improvement of the cotton yield to meet the requirements of the textile industry. Therefore, identifying the potential genes conferring resistance to different stresses for the molecular breeding of cotton is of the utmost importance [28]. Although the role of HATs has been investigated in the plant development [29,30], response to environmental signals [16,18,31], and hormone signaling [16] in other plants, little is known regarding the function of HATs in cotton. In this scenario, G. hirsutum, G, raimondii, and G. arboretum, having recently available genomic data [32,33,34,35], provide an excellent opportunity to identify the candidate genes involved in fiber development and biotic and abiotic stress tolerance and to expand our understanding of underlying epigenetic mechanisms.
In this study, we identified HAT genes from the whole genome of G. hirsutum, G raimondii, and G. arboretum. The identified HATs were comprehensively analyzed for phylogenetic classifications, gene structures, identification of conserved motifs and domain organization, and the presence of cis-regulatory elements in their promoters. Furthermore, gene expression profiles of G. hirsutum HATs were analyzed during the different stages of fiber development and in response to various abiotic stresses. Such a comprehensive analysis of HATs provides a fundamental understanding of their roles in cotton growth and development. Furthermore, this study will be useful for functional genomic studies on the regulations of histone acetylation and will eventually lead to the long-term improvement of stress tolerance in cotton.

2. Results

2.1. Identification of HATs in Cotton

A systematic blast search was performed to identify the HATs in the genomes of G. hirsutum, G. raimondii and G. arboretum with the query sequence of Arabidopsis, and candidate HAT were identified in the cotton genomes. Then, Pfam and InterProScan databases were used to further verify the candidate HAT, and a total of 18 G. hirsutum (GhHATs), 9 G. raimondii (GrHATs), and 9 G. arboretum (GaHATs) were identified (Table S1). The properties of the identified Gossypium HATs were analyzed by ExPASy and we found an open reading frame (ORF) length ranging from 1407–6876 bp, which encoded the polypeptides ranging from 468–2291 amino acids with a predicted molecular weight of 53–256 KD. In addition, the theoretical isoelectronic point (PI) values ranged from 0.28–8.84 (Table S1).

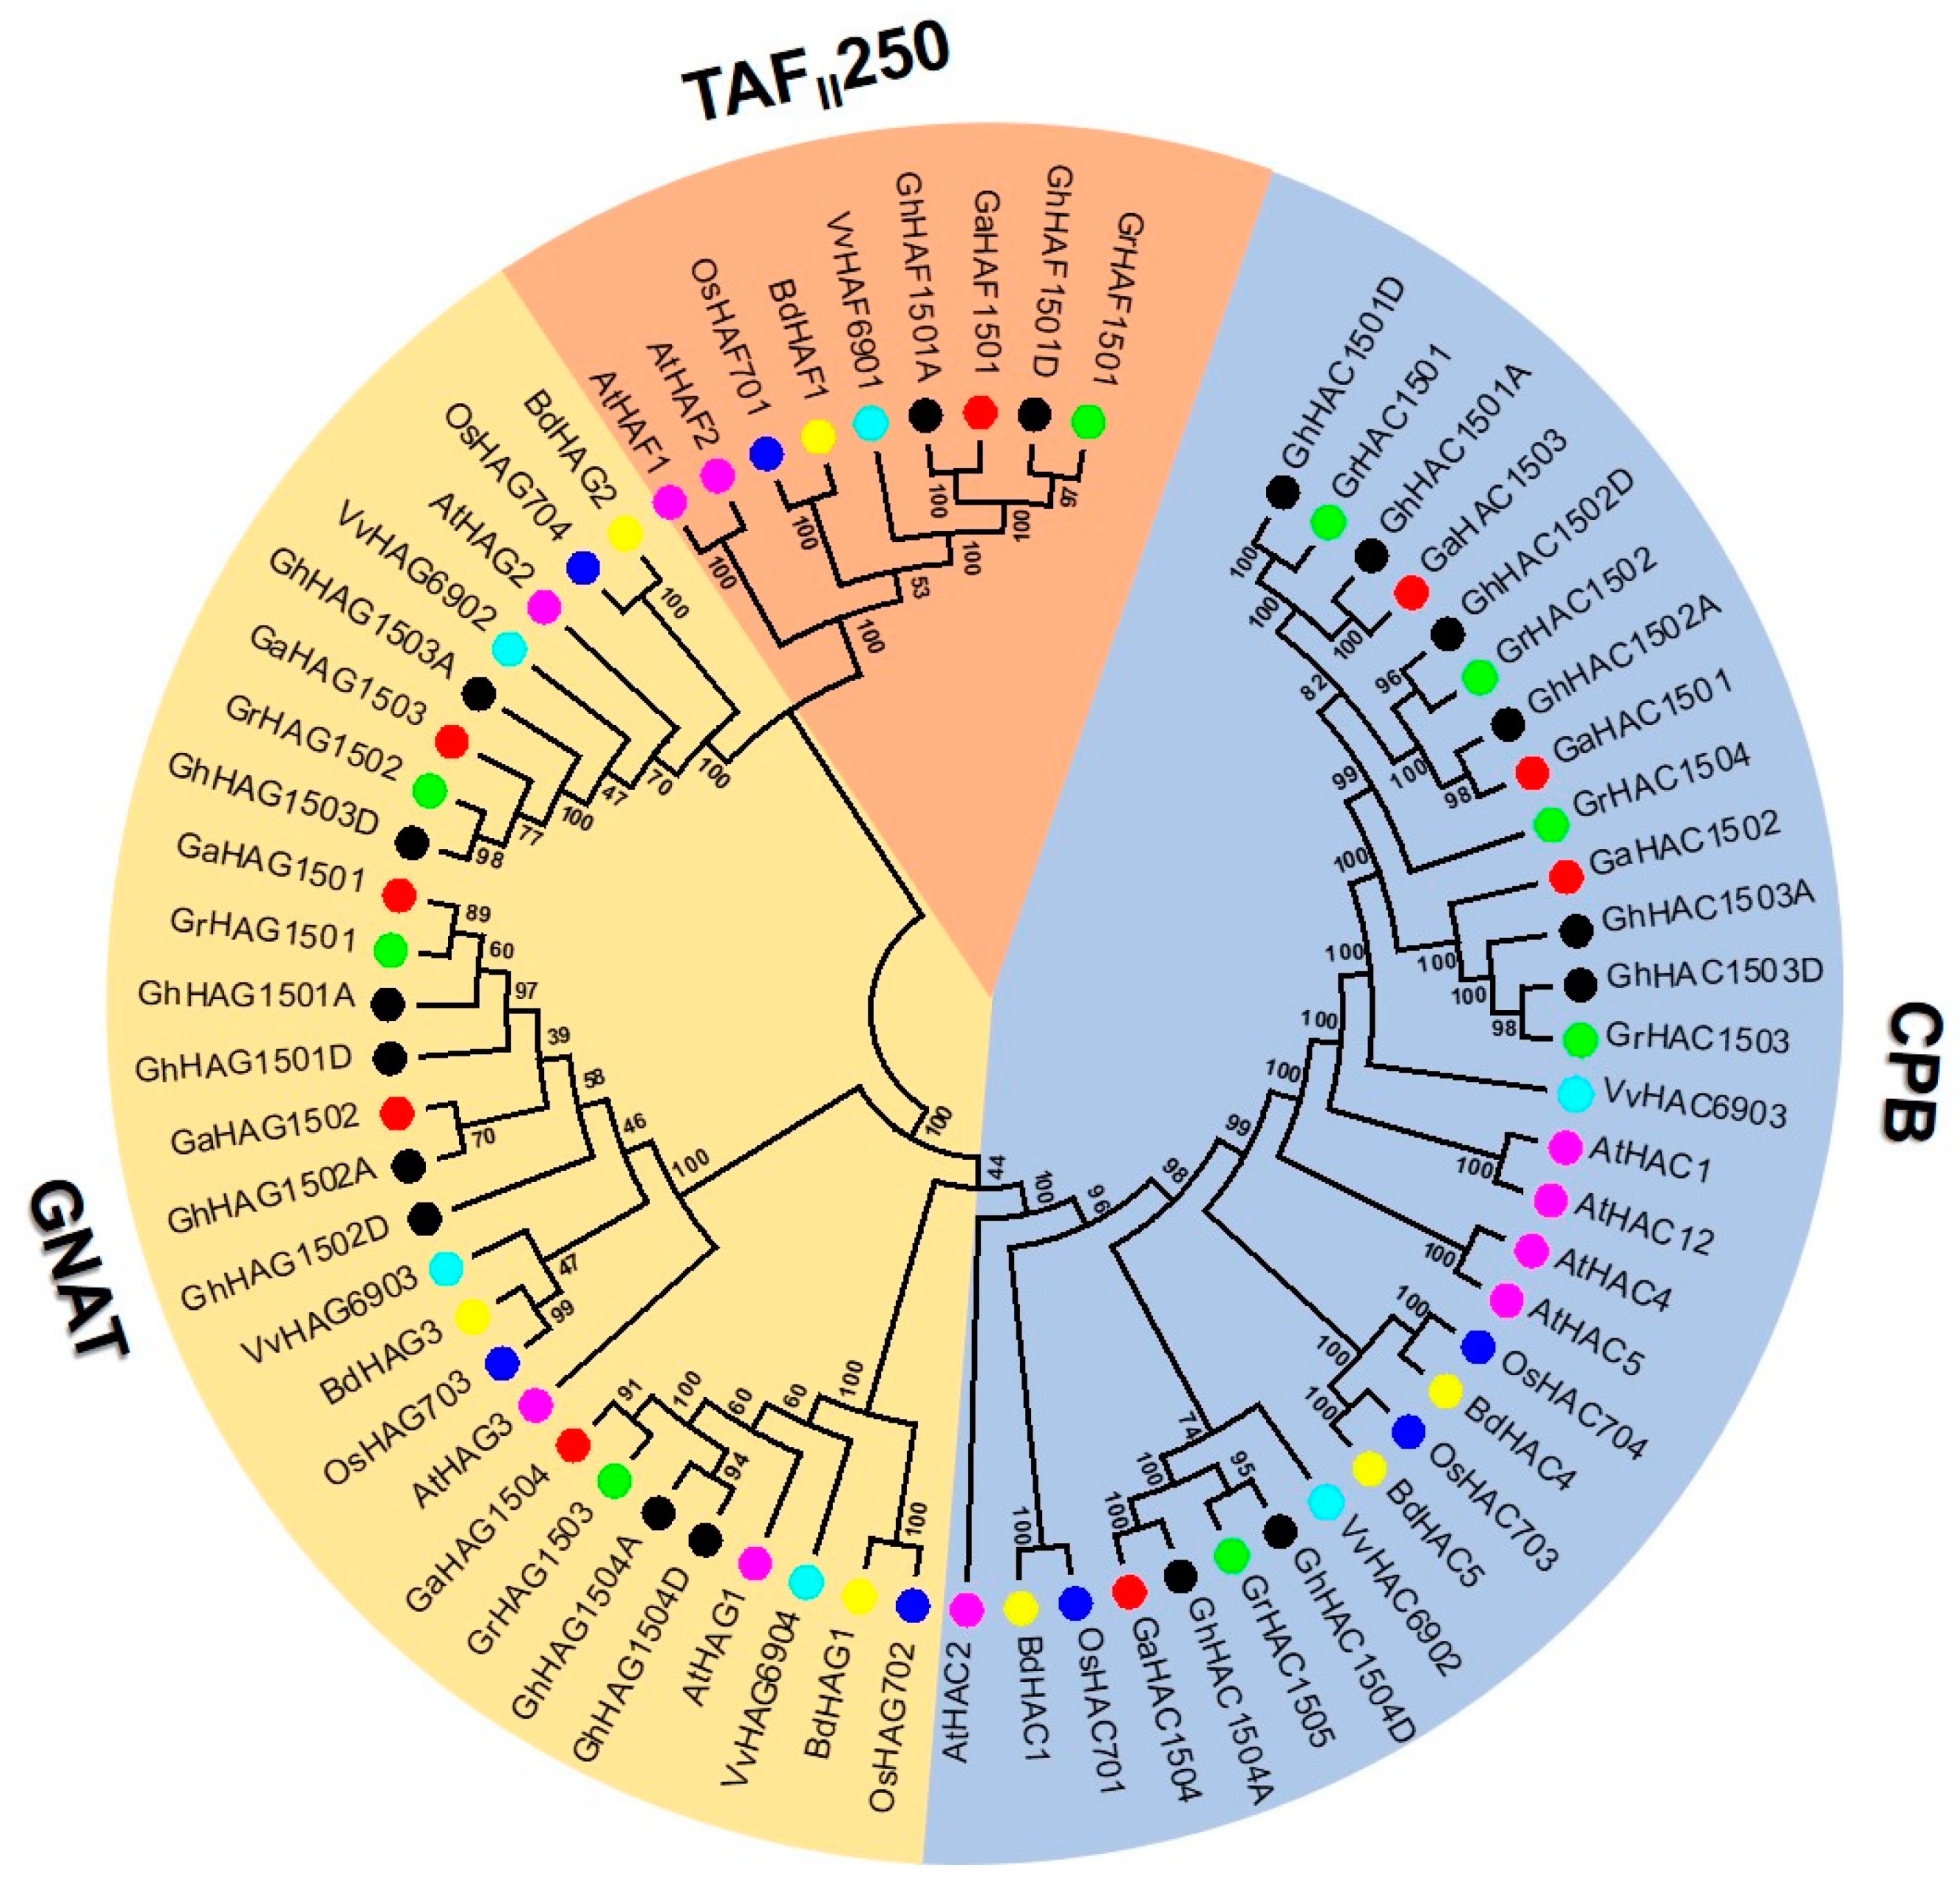
2.2. Phylogenetic Analysis of the HAT Gene Family

To investigate the evolutionary relationship of HATs among cotton (G.raimondii, G. arboretum, and G. hirsutum) and other species, we constructed a phylogenetic tree using MEGA 6.0. We used the newly identified Gossypium HATs and previously identified HATs from Arabidopsis thaliana, Vitis vinifera, Oryza sativa, and Brachypodium distachyon to confirm their evolutionary relationship with the un-rooted phylogenetic tree using the neighbor-joining (NJ) method (Figure 1). The phylogenetic tree results showed that similar to Vitis and Arabidopsis, Gossypium HATs could also be grouped into three distinct classes: CPB, GNAT and TAFII250. MYST homologs were found absent in the Gossypium genomes. To validate the phylogenetic tree constructed using the NJ method, we also used the minimum evolution method to construct a tree and found that HAT genes could be naturally classified into three groups and the members within each clade were stable with little difference between topology, which indicates that the NJ tree method could be used for further analysis.
We found that the number of genes in CPB (30) was greater than that in either GNAT (27) or TAFII250 (9). Furthermore, we found that all the three groups comprised mono and dicot species. It is noteworthy that the genes within each group clustered with a dicot- or monocot-specific pattern. The number of HAT from each species was different within each group. Compared to other species, cotton HATs showed a closer relationship with Vitis HATs because they always clustered closely to each other in the phylogenetic tree. Nevertheless, their gene numbers were not similar within the group.

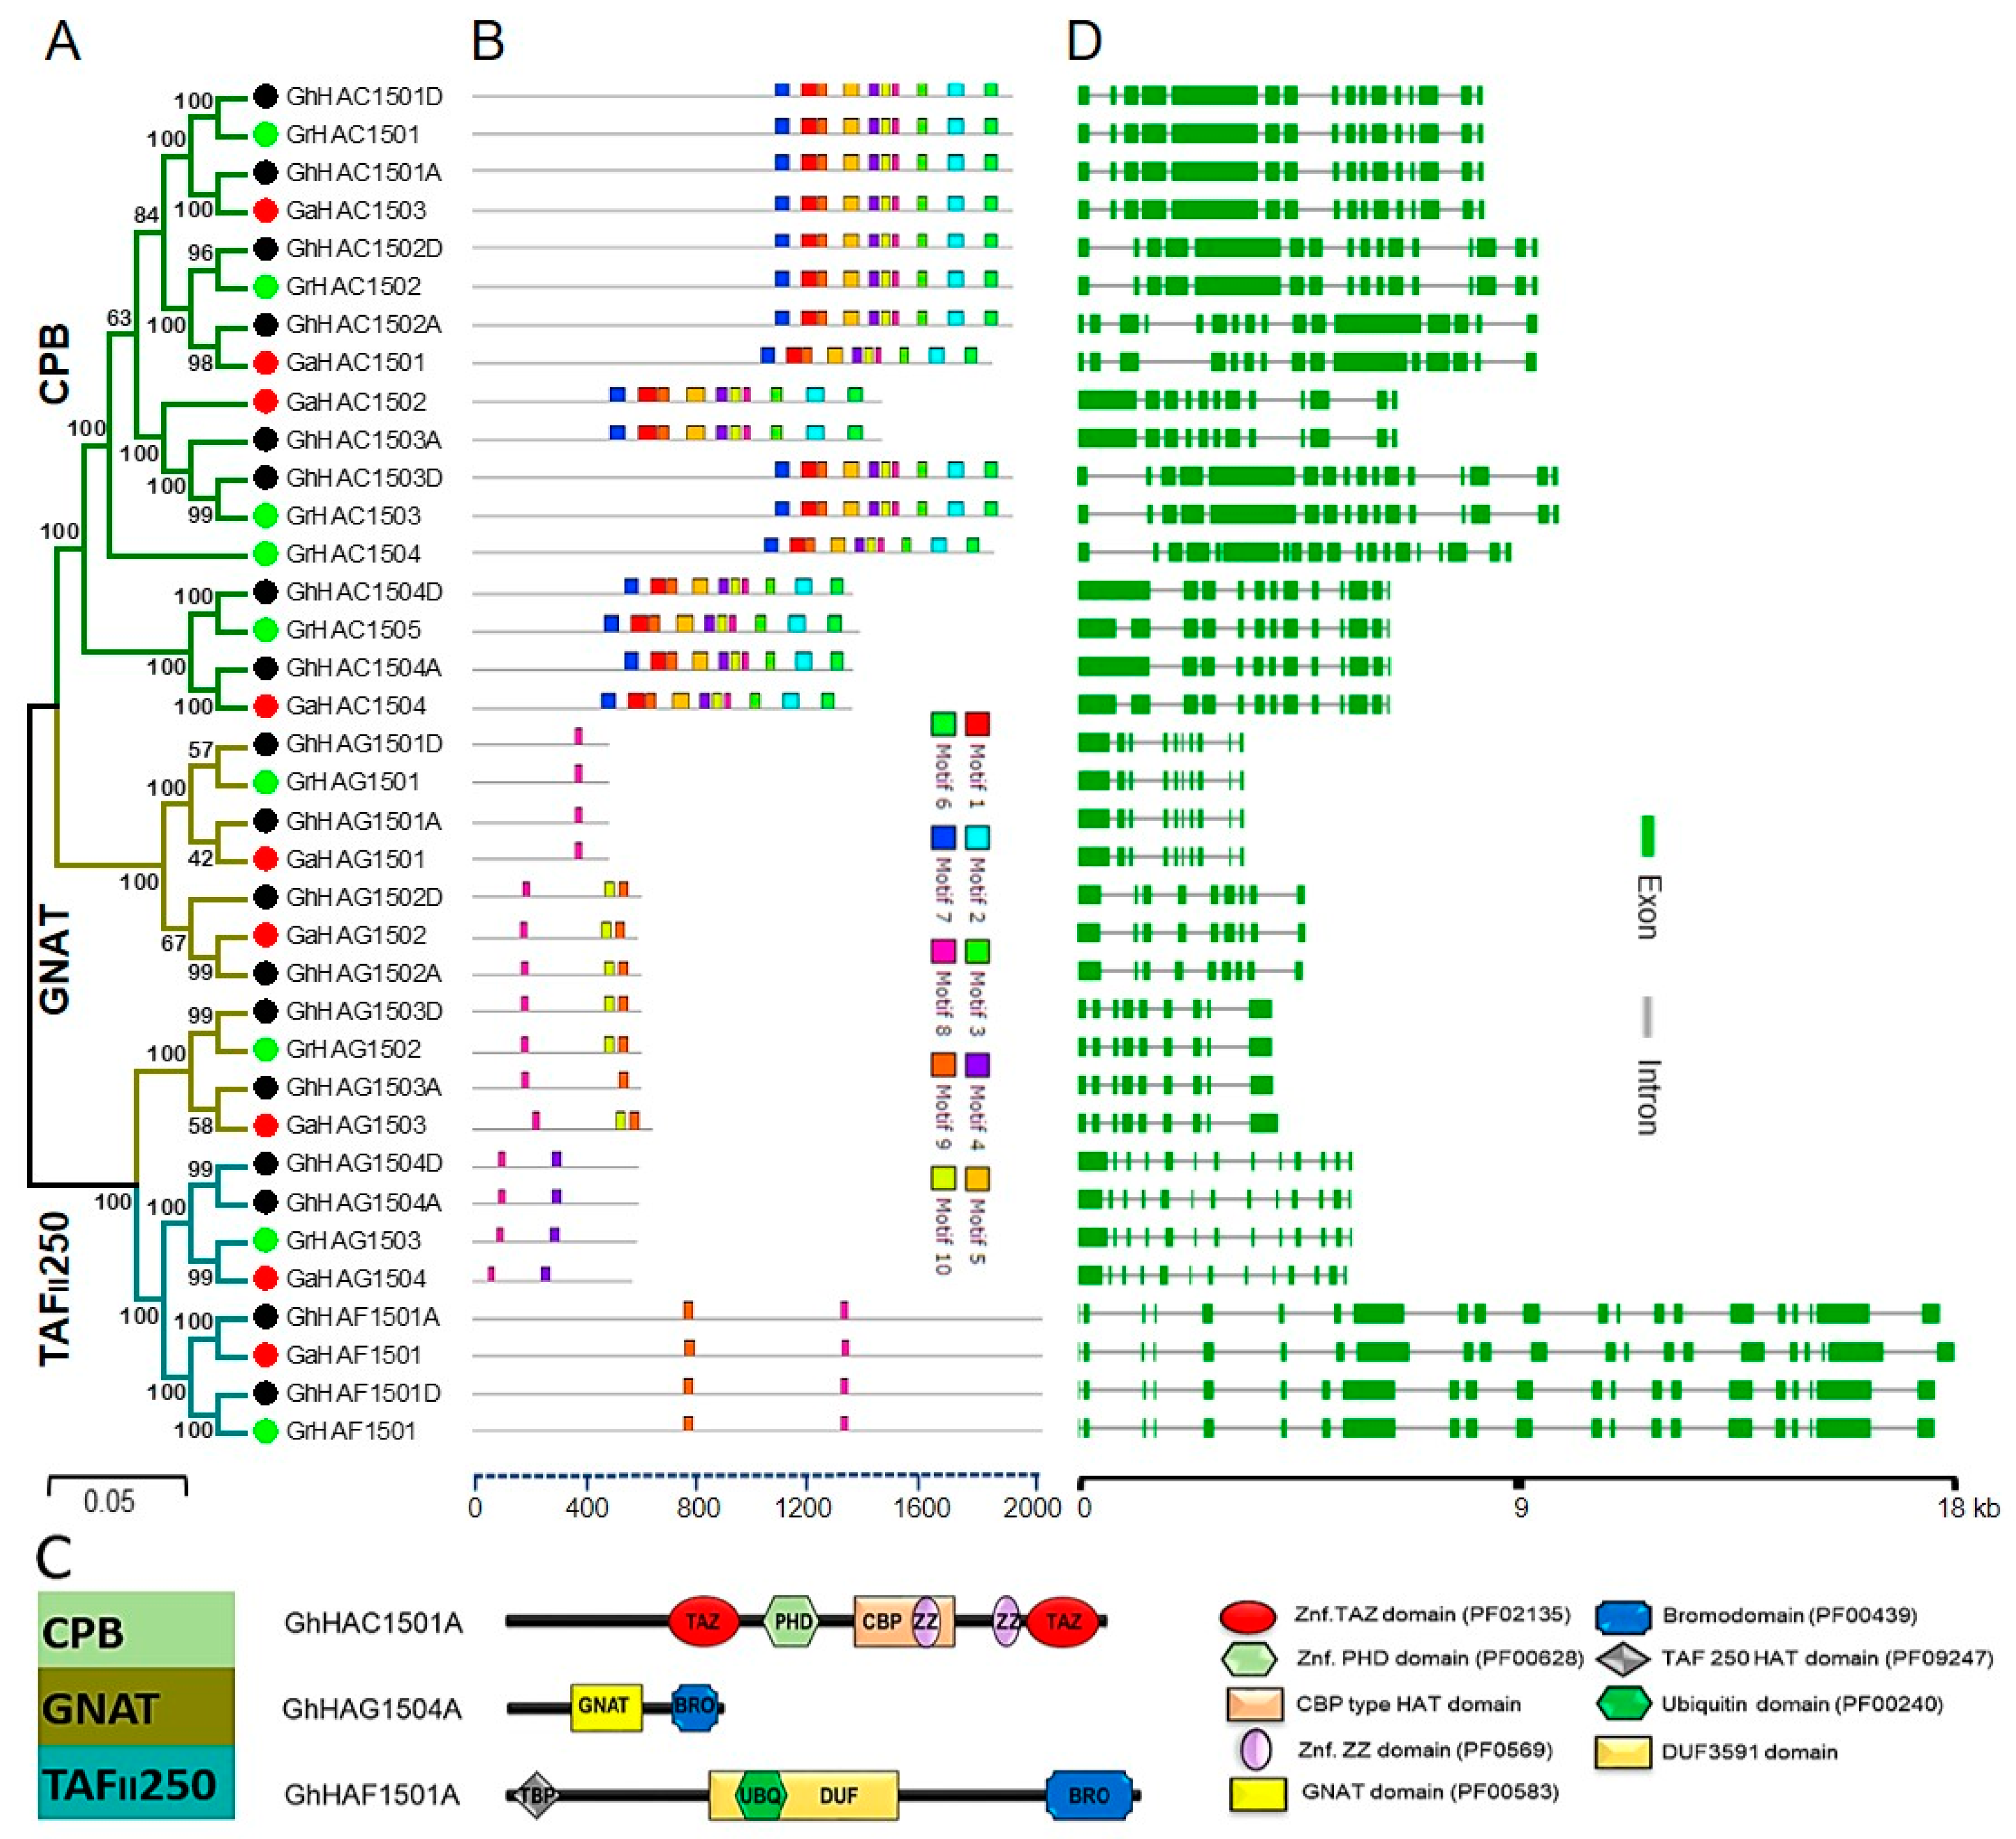
2.3. Phylogenetic Tree Construction, Conserved Motif and Gene Structure Analysis of Cotton HATs Genes

To confirm the subgroup classification and to determine the evolutionary relationship between Gossypium HATs, we generated another un-rooted phylogenetic tree using the neighbor-joining method (Figure 2A). We observed one subgroup related to CBP (HACs) and TAFII250 (HAFs) in Gossypium, whereas three subgroups related to GNAT (HAGs) were observed. The CBP and GNAT subgroups contained four members in G. raimondii and G. arboretum, while TAFII250 contained only one member. Furthermore, each diploid progenitor had its own ortholog in allotetraploid.
To gain insight into the evolutionary origin and putative functional diversification, a Multiple Expectation Maximization for Motif Elicitation (MEME) analysis was performed, which identified a total of 10 conserved motifs in Gossypium HATs (Figure 2B and Figure S1). All members of the CPB subfamily contained all the conserved motifs, whereas GNAT and TAFII250 only contained a few conserved motifs. However, the motif 8 was found conserved in all the Gossypium HATs, suggesting that the potential catalytic site of Gossypium HATs was conserved. We further dissected the motif analysis of Gossypium HATs by investigating their domain organization (Figure 2C). The CBP subfamily of Gossypium HATs contained plant homeodomain (PHD), Znf-TAZ, Znf ZZ and a CBP-type HAT domain, while the GNAT subfamily of Gossypium HATs contained a conserved GNAT and bromodomain. Moreover, the TAFII250 subfamily of Gossypium HATs contained a bromodomain, ubiquitin (UBQ), TATA box–binding protein (TBP), and domain of unknown function (DUF) domain. Furthermore, an alignment information was produced to explore the amino acid conservation of the GhHATs domain sequence (Figure S2). The multiple sequence alignment analysis revealed that all GhHATs proteins shared regions of conserved polypeptide sequences, which could be involved in their molecular functions (Figure S2A–C). In general, Gossypium HATs contained a domain organization similar to that of their counterparts in other species.
We then analyzed the gene structure of HATs from G. hirsutum, G raimondii and G. arboretum (Figure 2D). Our results showed that the number and length of intron/exons were different among CPB, GNAT and TAFII250 classes. For example, intron/exon numbers and gene length of TAFII250 were greater than the CPB and GNAT. Furthermore, the gene structure of G. raimondii and G. arboretum was extremely similar to their orthologs in the G. hirsutum. However, in general, gene structure in terms of intron/exon was greatly similar within the subgroup, which was consistent with the phylogenetic analysis.

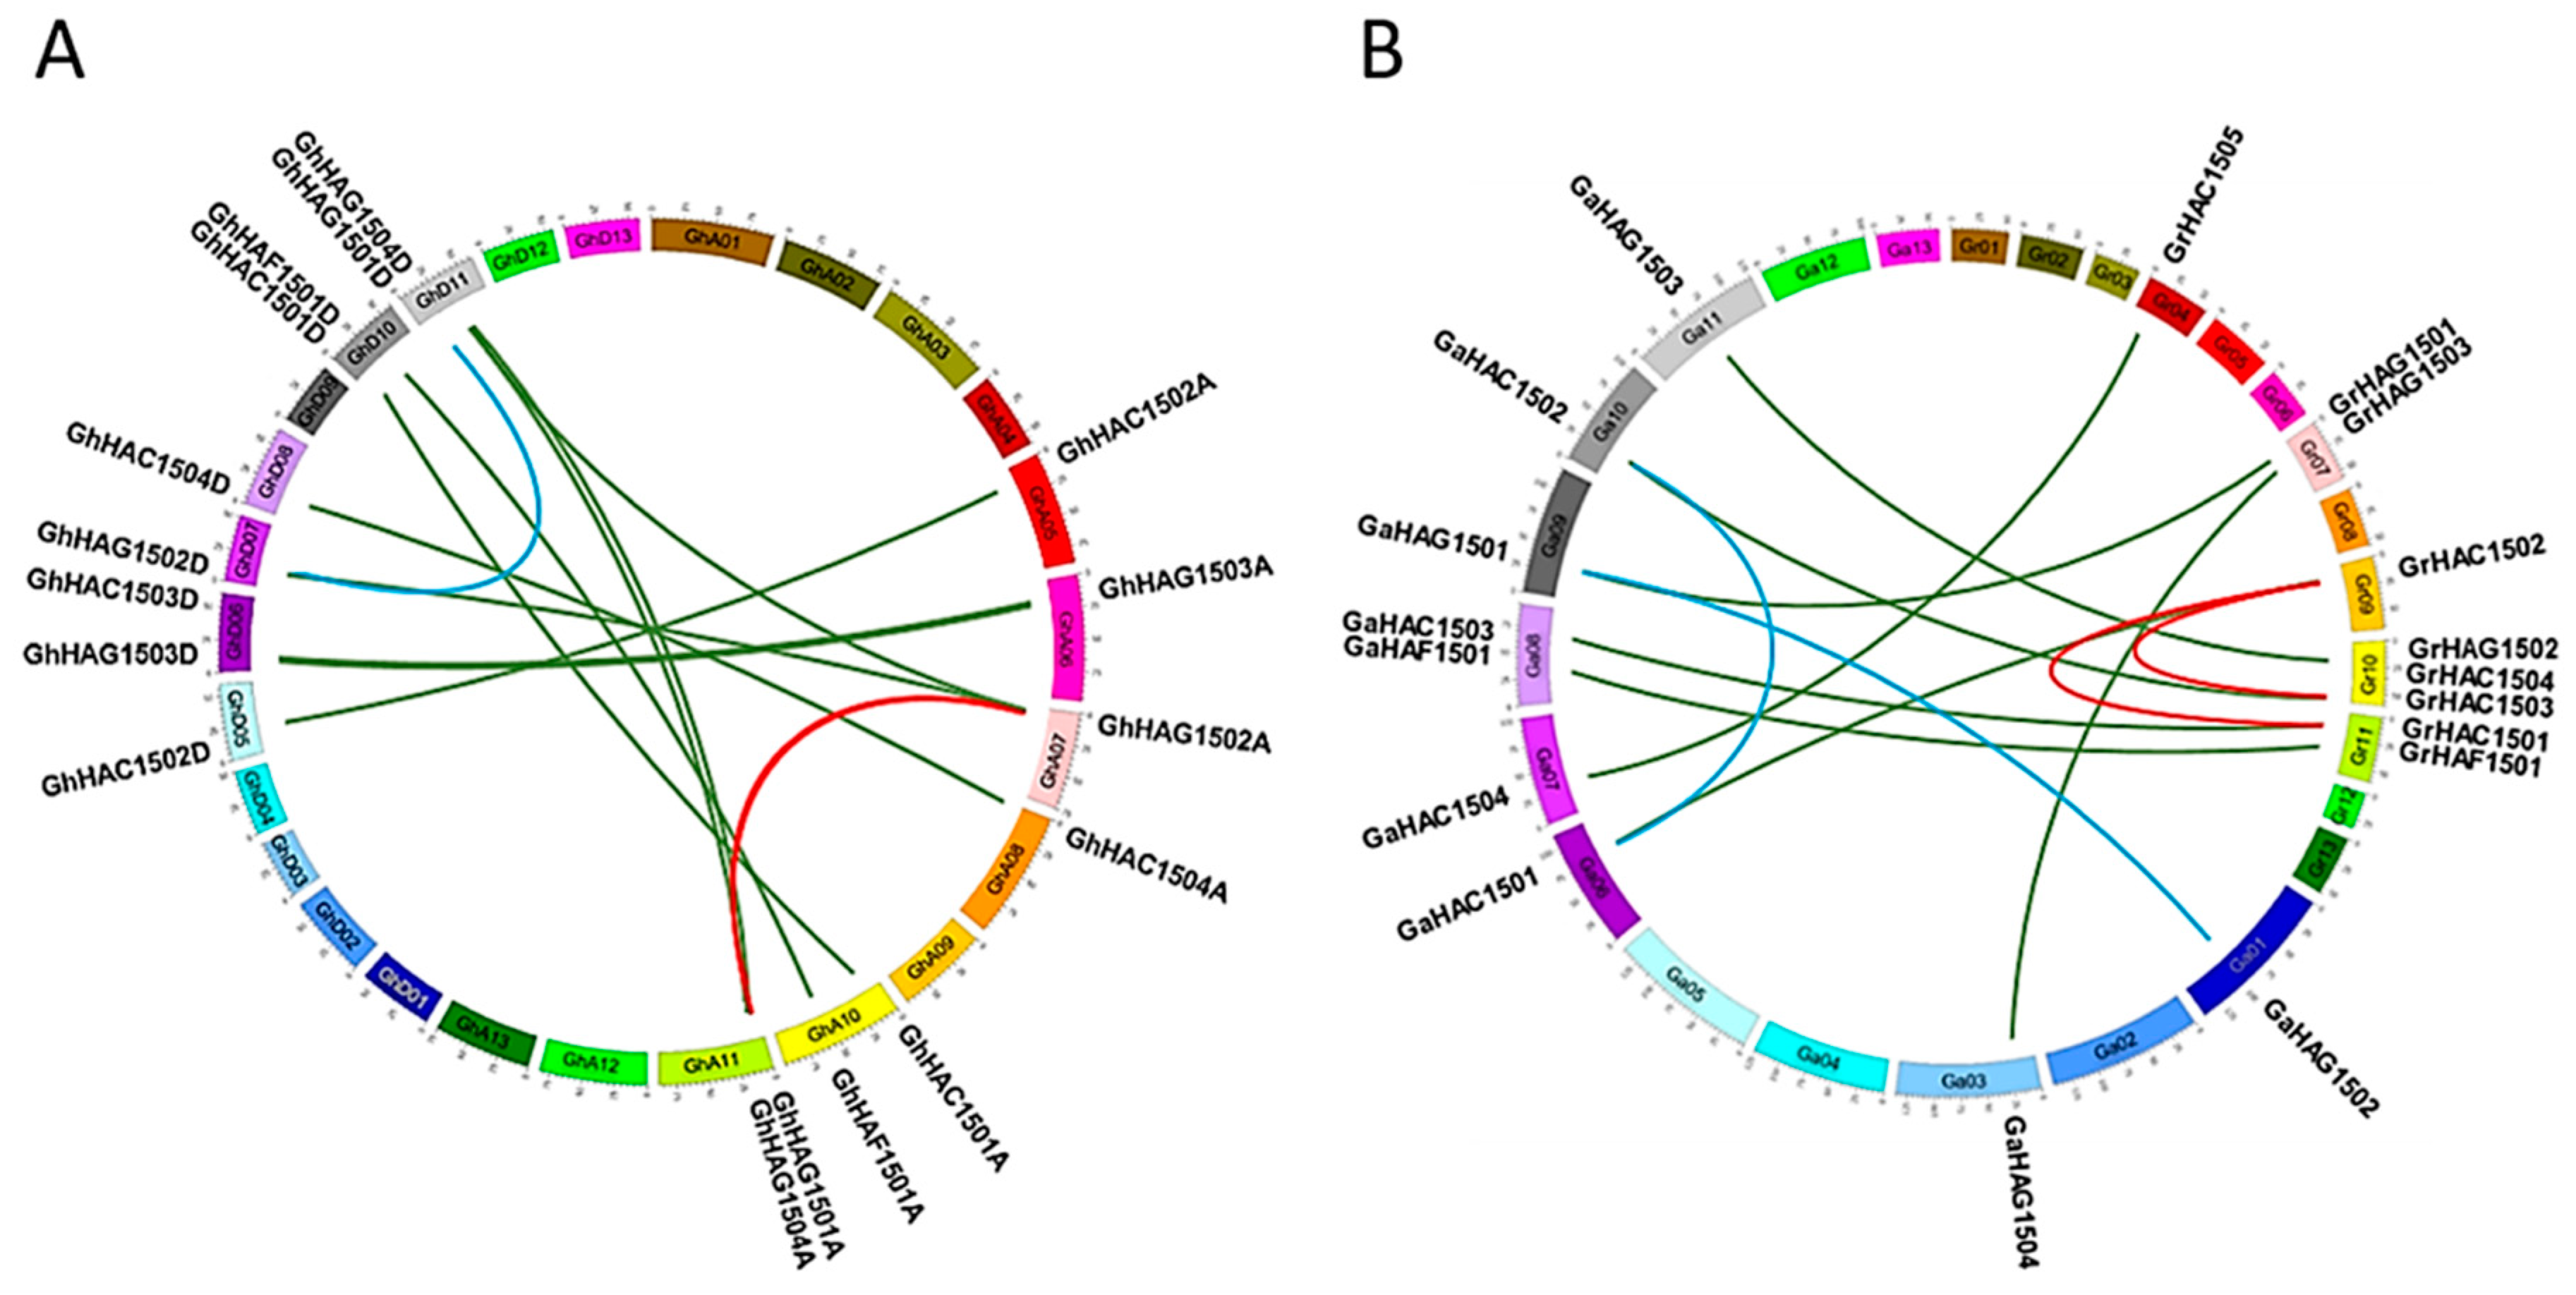
2.4. Chromosomal Distribution and Duplication Analysis of HATs

The G. hirsutum HATs were mapped to their corresponding chromosomes (Figure 3A), and all the HATs were unevenly distributed on the chromosomes of G. hirsutum. For example, all the 18 G. hirsutum HATs were assigned to 12 chromosomes out of 26 (Figure 3A). The CBP subfamily of G. hirsutum HATs was localized on the chromosomes 5, 6, 8 and 10, while the GNAT subfamily of G. hirsutum HATs was localized on the chromosomes 6, 7, 10 and 11. We also mapped the HATs from the diploids G. raimondii and G. arboretum and found that all the HATs from G. raimondii and G. arboretum were also unevenly distributed on their chromosomes, similar to G. hirsutum (Figure 3B). However, compared with G. raimondii, the HATs from G. arboretum were more evenly distributed on their chromosomes. We also observed that subfamilies of Gossypium HATs were localized to different chromosomes in both diploid progenitors (G. raimondii and G. arboretum), as well as in the allotetraploid G. hirsutum. For example, the TAFII250 subfamily member HAF1501 was localized on the chromosome 10 in G. hirsutum, and was localized on the chromosome 8 and 11 in G. arboretum and G. raimondii, respectively.
We also investigated the contribution of gene duplication to the expansion of Gossypium HATs (Figure 3A,B). Two segmental duplications were found in G. hirsutum (GhHAC1501A/GhHAC1502A, GhHAG1501A/GhHAG1502A), indicating that duplications occurred in the A genome of G. hirsutum. Similarly, two segmental duplications were also found in G. raimondii (GrHAC1501/GrHAC1502, GrHAC1502/GrHAC1503) and in G. arboretum (GaHAC1501/GaHAC1502, GaHAG1501/GaHAG1502). Furthermore, we also checked the Ka/Ks ratio to explore the selective constraints on each pair of duplicated Gossypium HAT (Table S2). The Ka/Ks ratio was found to be less than 0.30 in all the duplicated gene pairs of Gossypium HATs, suggesting that all the duplicated gene pairs of Gossypium HATs experienced strong purifying selection pressure.

2.5. Putative Cis-Elements in the Promoter Regions of GhHATs

To gain more insight into the putative functions of HATs, the putative cis-regulatory elements were scanned in the 1000 bp upstream of the transcription start sites of G. hirsutum using the Plant CARE database (Figure S3, Tables S3 and S4). In addition to TATA- and CAAT-box core cis-elements, phytohormone response elements, stress response elements and development response elements were found in the promoters of G. hirsutum HATs. Most of the cis-elements were conserved among the CBP, GNAT and TAFII250 subfamilies of G. hirsutum HATs. However, some cis-elements were absent in some subfamilies. For example, CAT-box (cis-acting regulatory element related to meristem expression), MRE (MYB binding site involved in light responsiveness), P-box (Gibberellin-responsive element), and O2-sites (cis-acting regulatory element involved in zein metabolism regulation) cis-elements were absent in the CBP subfamily, but were found present in GNAT and TAFII250 members. Similarly, circadian (cis-acting regulatory element involved in circadian control), skn-1 motifs (cis-regulatory element required for endosperm expression), Box-W1 (fungal elicitor-responsive element), and 5′ UTR Py-rich stretch (a cis-regulatory element conferring high transcription levels) cis-elements were absent in the TAFII250 subfamily. Moreover, cis-elements in the promoters of A and D genomes were largely conserved in G. hirsutum HATs. However, TGA cis-elements (a cis-acting regulatory element involved in the MeJA responsiveness) were only present in the D genome. We also observed that cis-elements in the promoters of orthologous gene pairs of G. hirsutum were largely similar. However, some exceptions were also found where they differed much for the cis-elements, e.g., GhHAC1504-A/GhHAC1504-D and GhHAG1503-A/GhHAG1503-D.

2.6. Gene Expression Analysis

2.6.1. Expression Analysis of GhHATs in Different Tissues, Developmental Stages and Multiple Abiotic Stresses by RNA-sequencing

To better understand the potential physiological functions of GhHATs in allotetraploid cotton, we investigated the expression of GhHAT genes. RNA-sequencing data were downloaded from the National Center for Biotechnology Information (NCBI) and analyzed. Their analysis revealed that GhHATs were widely expressed in the vegetative (root, stem, and leaf) and reproductive (torus, petal, stamen, pistil, calyx, and −3, −1, 0, 1, 3, 5, 10, 20, 25 and 35 days post-anthesis (DPA) ovule) tissues (Figure 4A), highlighting the diverse biological functions of HATs in different tissues. We also noted that some GhHATs did not express in vegetative tissues, but had a very weak expression in the reproductive tissue, e.g., GhHAG1502-D. We found that A and D genomes showed preferential expression for only some genes in the leaf, root, and stem. For instance, the expression of GhHAG1502-A was higher than GhHAG1502-D in all the analyzed tissues. However, the opposite correlation was also observed, e.g., the expression of GhHAG1504-D and GhHAG1503-D was higher in the root than GhHAG1504-A and GhHAG1503-A. In addition, we also found that GhHATs expression was also differently regulated during the course of development (Figure 4B). For example, GhHAC1501-D and GhHAC1502-A/D expressions were increased with the development of the root, while the expression of GhHAC1502-D decreased with seed cotyledon development. We further investigated the gene expression pattern of GhHATs in different abiotic stresses. The expression of GhHAG1501-A/GhHAG1501-D and GhHAG1504-A/GhHAG1504-D was strongly induced by multiple stresses, indicating their potential involvement in stress responses. However, no clear changes in expression levels were observed for more than half of the GhHATs under cold, hot, salt, and polyethylene glycol (PEG) 6000 conditions.

2.6.2. Expression Pattern of GhHATs Genes by qPCR

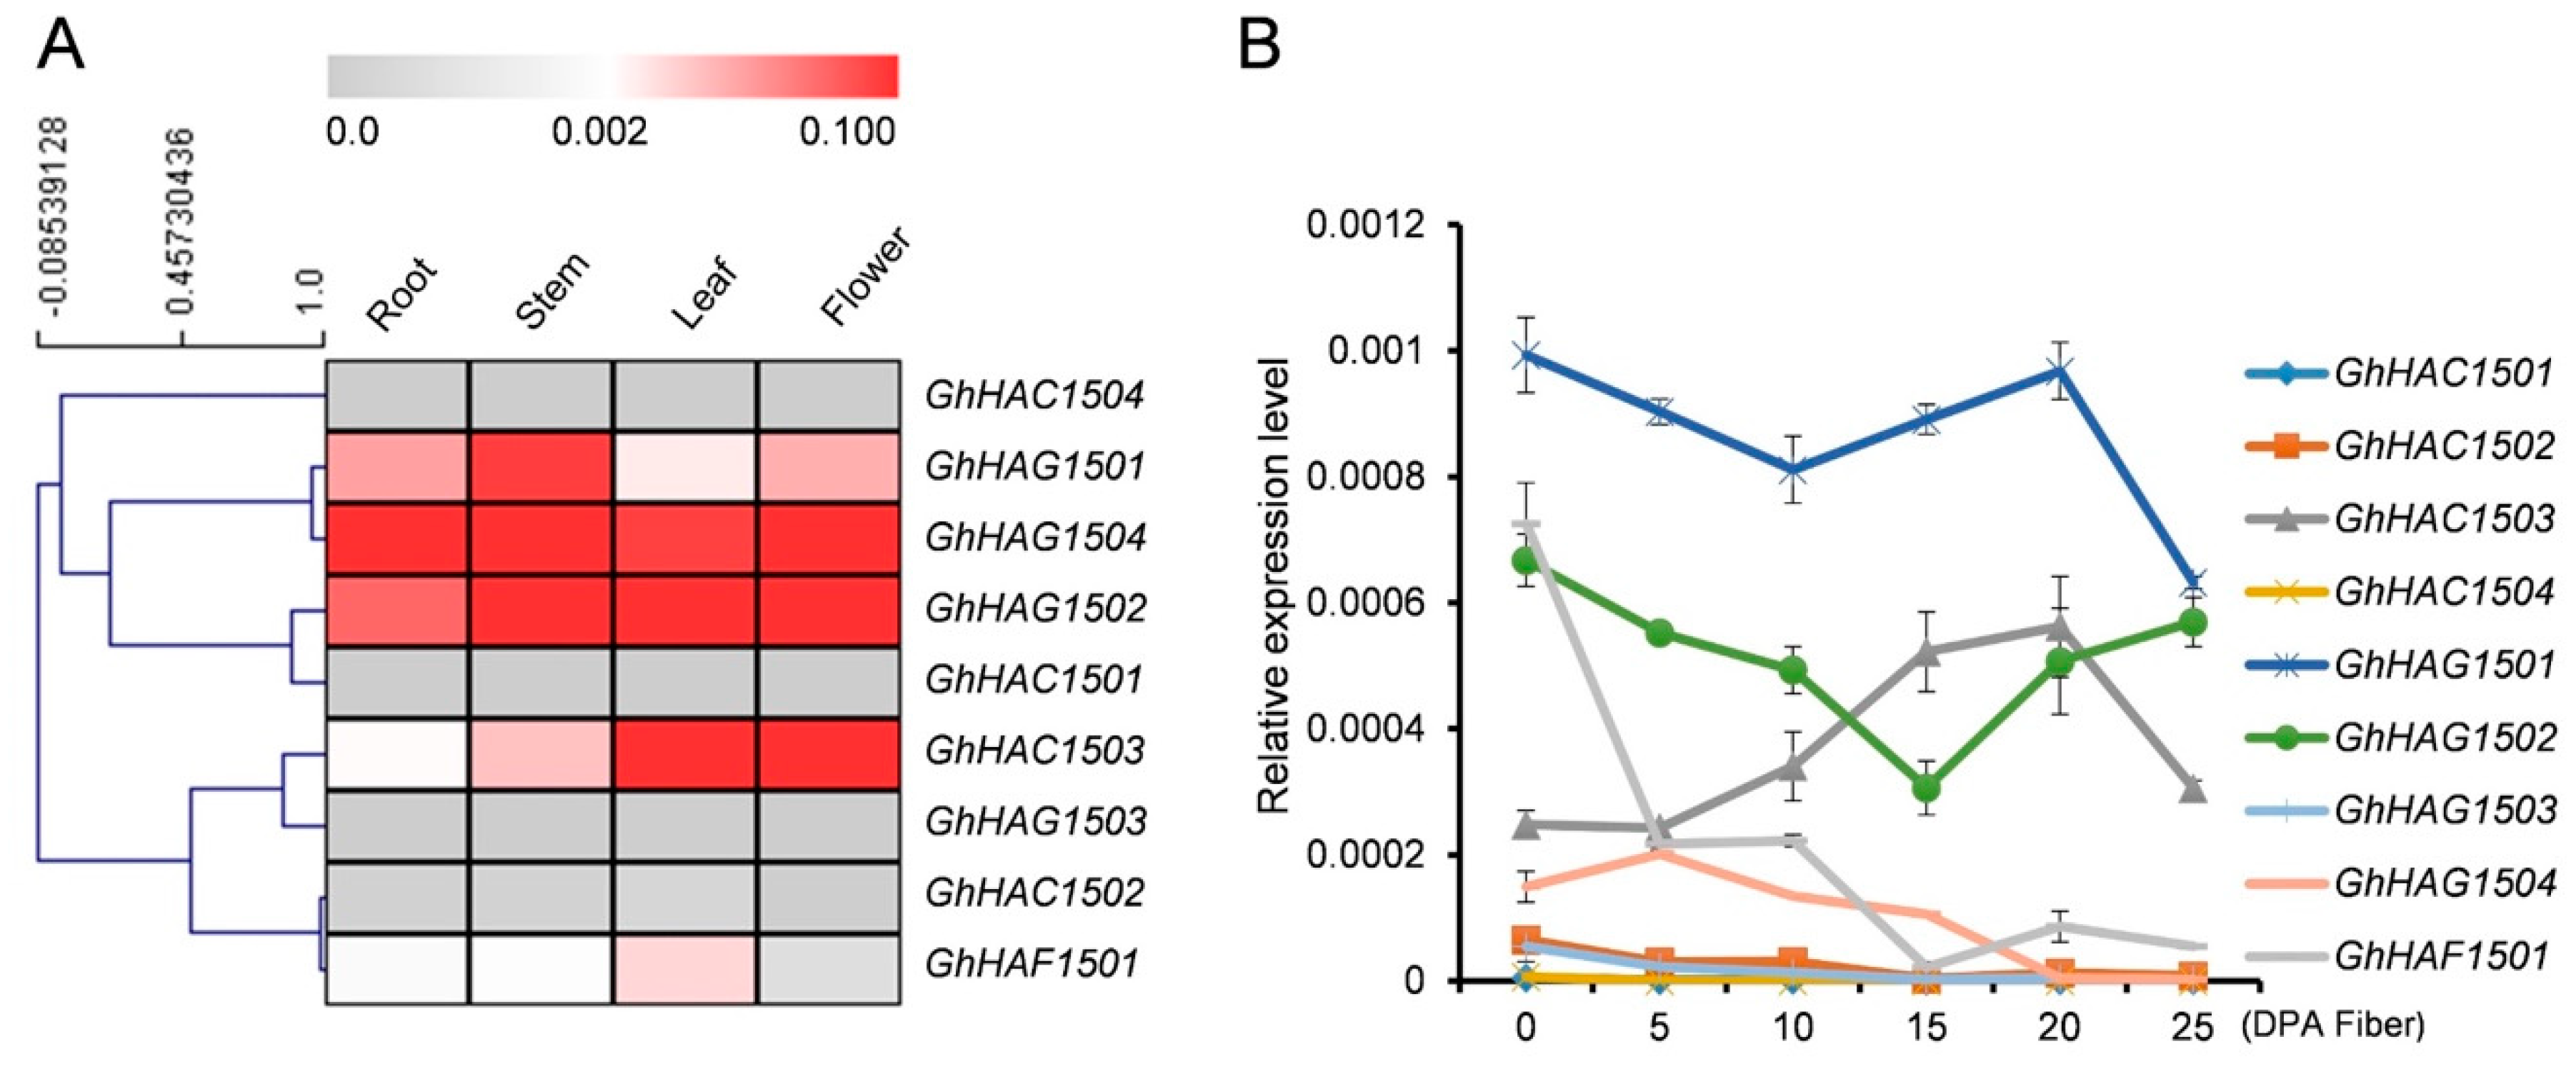
Tissue Specific Expression Patterns of HATs

We further validated the GhHATs gene expression in some vegetative and reproductive tissues by quantitative real-time polymerase chain reaction (qRT-PCR) (Figure 5A). Because the A and D genomes of allotetraploid cotton were extremely similar in mRNA levels, we considered GhHAT-A and GhHAT-D as one combination (GhHAT) and checked the expression levels by qRT-PCR. Among all the nine analyzed GhHATs belonging to three different classes, GhHAG1501, GhHAG1502, GhHAC1503 and GhHAG1504 showed the most prominent expression levels in the analyzed tissues, indicating their roles in the development of the leaf, root, stem and flowers. Although GhHAG1502 and GhHAC1503 were expressed in the root, stem and leaf, the highest expression was found in leaves. However, only GhHAG1501, GhHAG1504 and GhHAG1502 showed the highest expression in flowers, implying the specific function of these GhHAGs in flower development. It also indicated the dramatic functional divergence among different classes of GhHATs. Furthermore, GhHAG1501 and GhHAG1502 formed a paralogous pair and showed the expression conservation in all the analyzed tissues.

Expression of HATs at Different Fiber Development Stages

To explore the potential role of GhHATs in fiber development, we investigated their expression at different developmental stages of fiber development (0–25 DPA) by qRT-PCR (Figure 5B). Among all the GhHATs, only GhHAG1501, GhHAG1502, GhHAC1503 and GhHAF1501 showed the prominent expression levels during the different stages of fiber development (Figure 5B), indicating that these four genes may play dominant roles in the fiber development. However, among these four, the expression of GhHAG1501 and GhHAG1502 was the highest among the GhHAGs subgroup members at 0 DPA, and then gradually decreased during the fiber development (0–25 DPA). Similar to GhHAGs family members, the expression of GhHAF1501 was also decreased during the fiber development, except at 20 DPA, where only the expression of GhHAF1501, GhHAG1501 and GhHAG1502 slightly increased and then again decreased at 25 DPA. Contrary to GhHAF and GhHAG family members, the expression of GhHAC1503 from GhHACs family was gradually increased during the fiber development with a maximum at 20 DPA. Afterward, the expression of GhHAC1503 was decreased at 25 DPA. We further separated the contribution of A and D genomes for the fiber development of G. hirsutum from RNA-seq data analysis and found that the A genome preferentially expressed more than D genome partners in the different fiber developmental stages (Figure 4A).

Expression of HATs in Response to Heavy Metals and Abiotic Stresses

To better understand the role of GhHATs in abiotic stresses, we investigated the gene expression of GhHATs in response to metal stress (Cd and Zn), salt stress (NaCl), cold stress and drought stress by qRT-PCR. All the abiotic stresses differentially regulated the expression of GhHATs (Figure 6), indicating the functional specificity of GhHATs in response to a particular stress. In response to Cd stress, the expression of GhHAC1501, GhHAC1502 and GhHAG1501 decreased, while the expression of GhHAC1503, GhHAC1504, GhHAG1502 and GhHAG1503 increased compared with the control. However, the expression of GhHAG1501 and GhHAG1504 did not change compared with the control. In response to Zn stress, only the expression levels of GhHAC1503, GhHAC1504, GhHAG1501 and GhHAG1502 increased, while all other studied genes did not show differential expression compared with the control. However, the expression levels of GhHAC1503, GhHAC1504 and GhHAG1502 were different in response to Cd and Zn stresses despite their increased expression. Furthermore, the expression of GhHATs was investigated in response to cold, salt, and drought stresses. The results showed that in response to cold stress, the expression of GhHAC1502, GhHAC1503, GhHAC1504, GhHAG1501, GhHAG1502, GhHAG1503, GhHAG1504 and GhHAF1501 decreased compared with the control. In response to salt stress, the expression of GhHAC1501, GhHAC1502, GhHAC1503, GhHAG1501, GhHAG1504 and GhHAF1501 increased, while the expression of GhHAC1504 and GhHAG1503 decreased compared with the control. In response to PEG treatment, the expression of GhHAG1501 and GhHAF1501 increased, while the expression of GhHAC1503 and GhHAC1504 decreased compared with the control.

Expression of HATs in Response to MMS

We also investigated the Gossypium HATs gene expression in response to the DNA damage agent methyl methanesulfonate (MMS) (Figure 6). The results showed that in response to MMS treatment, the expression of GhHAC1502, GhHAC1503, GhHAG1501 and GhHAF1501 increased, while the expression of GhHAC1504 decreased compared with the control, indicating their potential role in DNA damage repair pathways in cotton.

Expression of HATs in Response to Phytohormones

Cis-regulatory elements related to phytohormones were found in the promoter of GhHATs (Figure S2, Tables S3 and S4). We therefore investigated the gene expression of GhHATs in response to auxin (NAA) and abscisic acid (ABA) by qRT-PCR. Auxin and ABA treatments differentially regulated the expression of GhHATs (Figure 6). The results showed that in response to ABA treatment, the expression of GhHAC1503, GhHAC1504 and GhHAG1504 decreased, while the expression of GhHAG1501 and GhHAG1503 increased compared with the control. In response to NAA treatment, the expression of GhHAC1502, GhHAG1501 and GhHAF1501 increased, while the expression of GhHAC1504 decreased compared with the control.

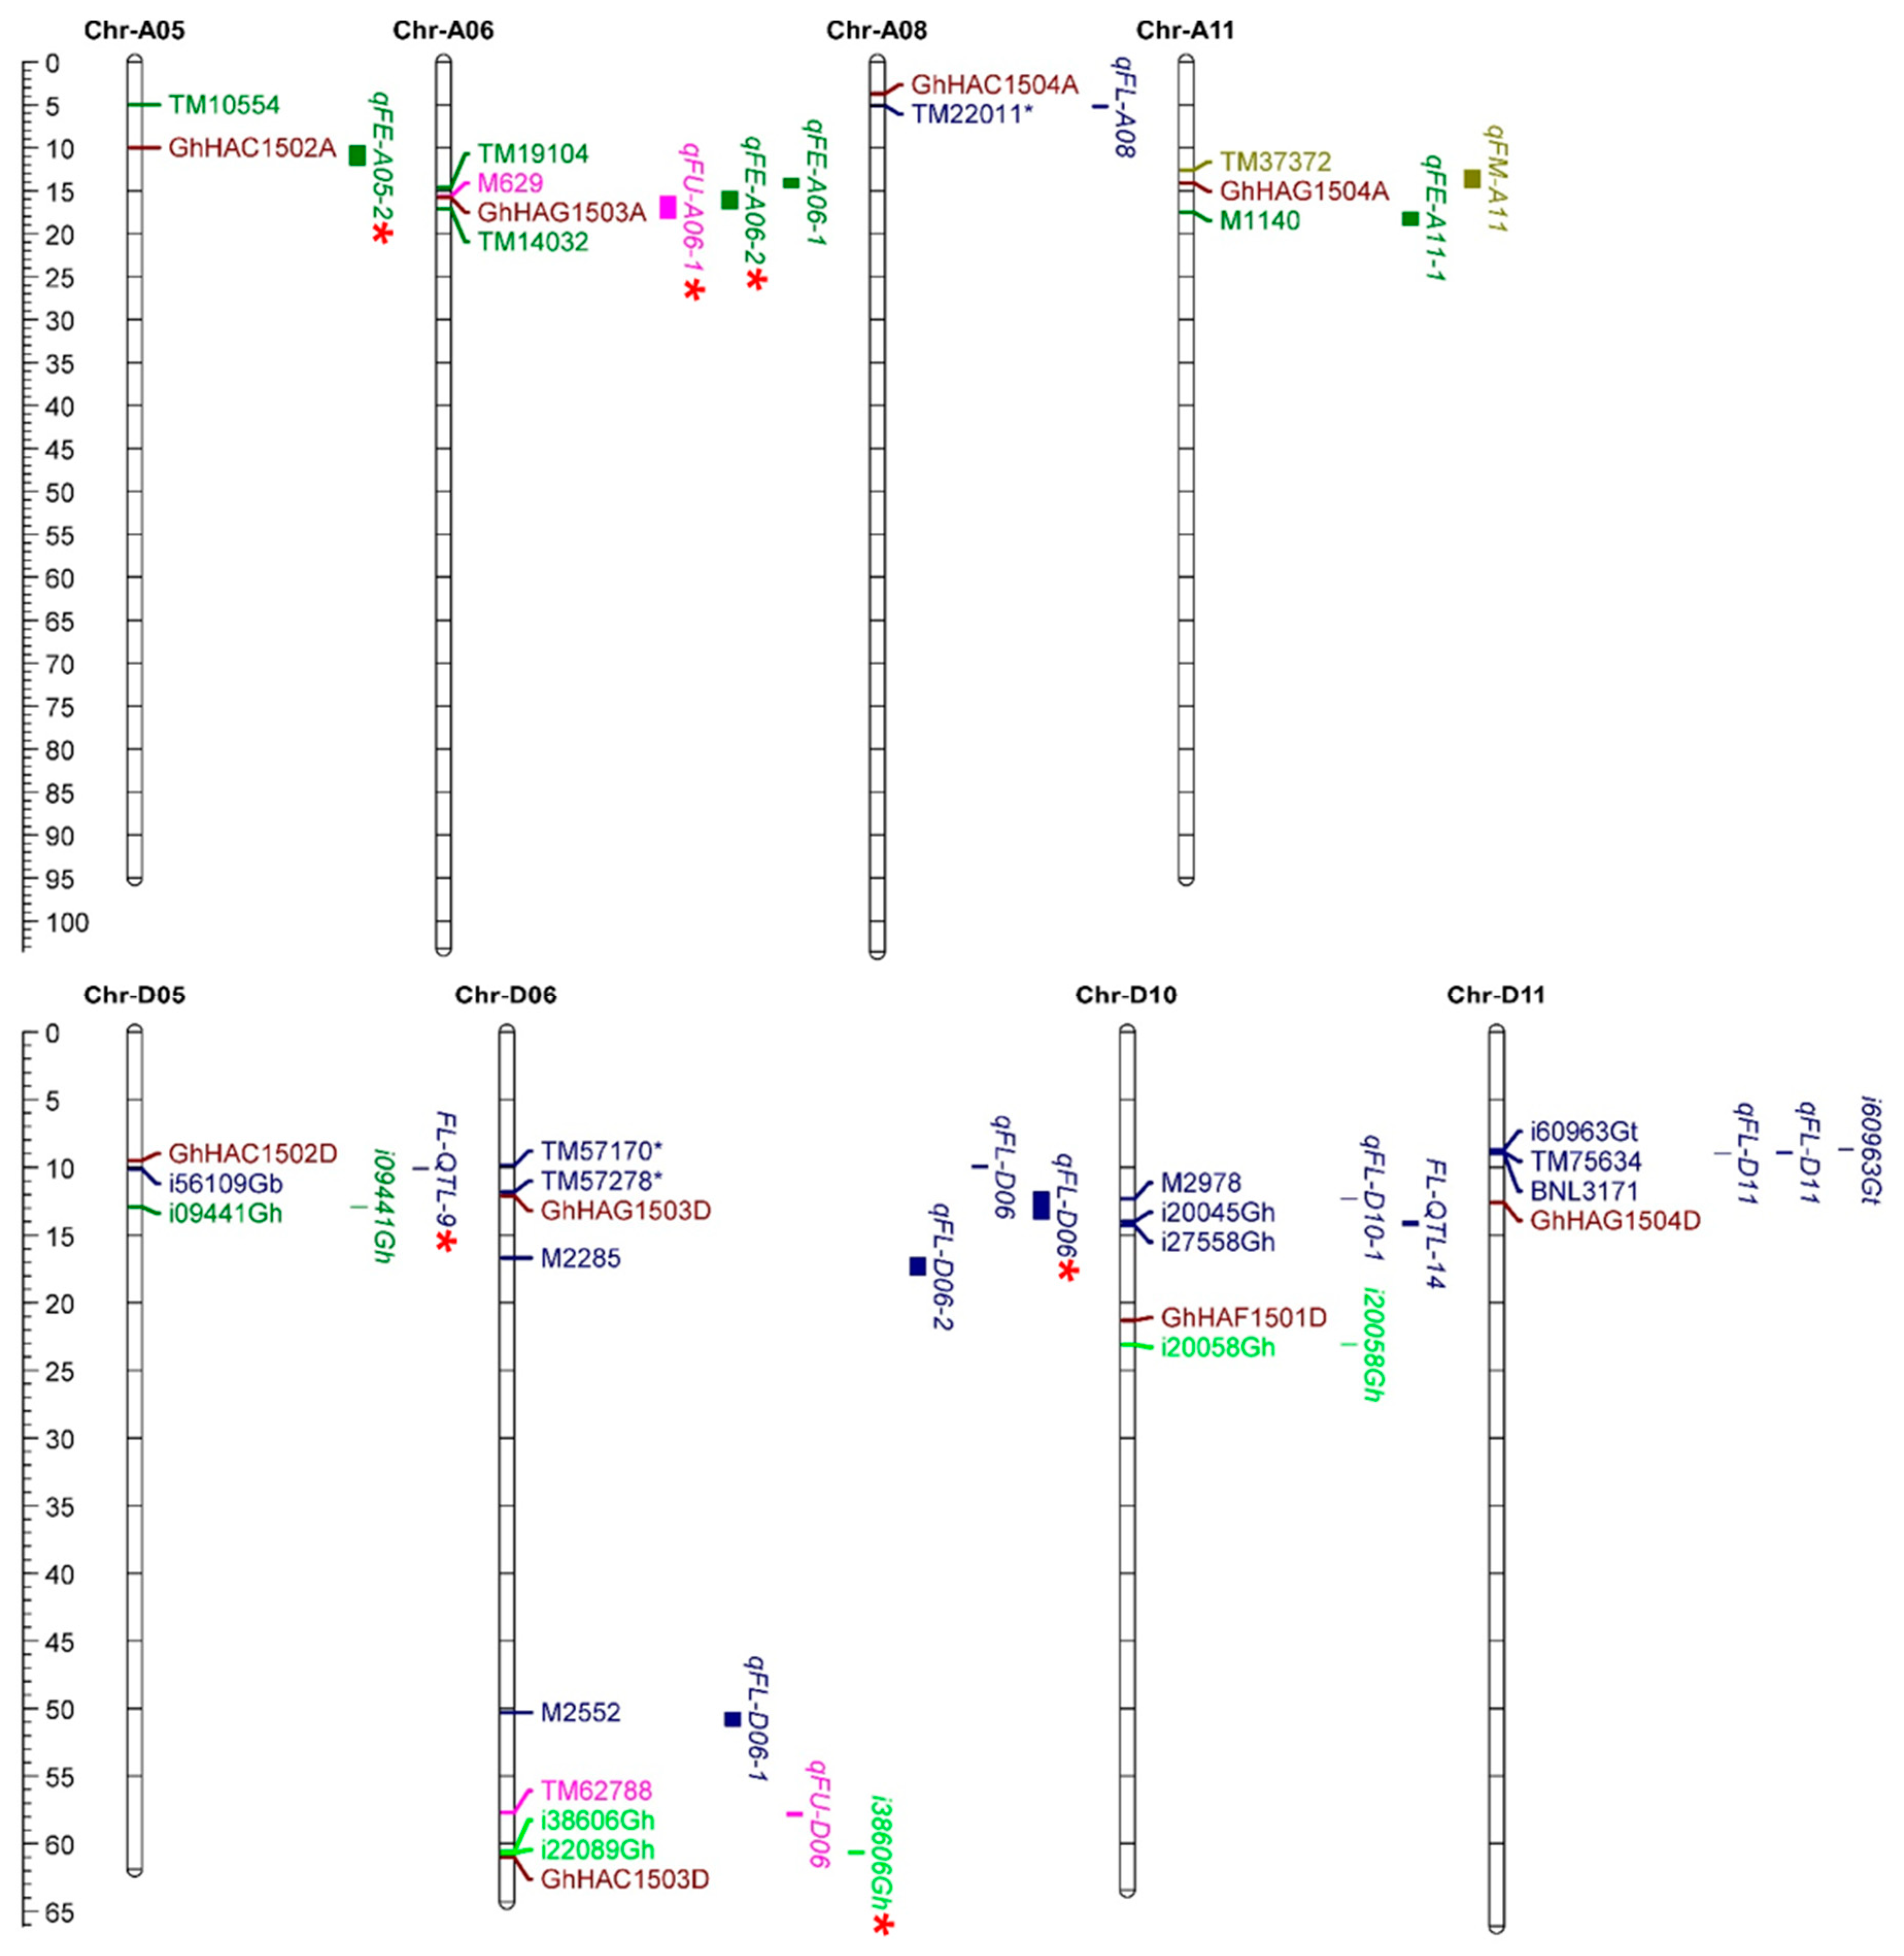
2.7. Co-Localization of HATs with QTLs of Fiber Development

To validate the potential function of GhHATs in fiber development, the co-localization of GhHATs with reported QTLs/SNPs of fiber development (i.e., fiber length (FL), fiber elongation (FE), fiber micronaire (FM), fiber strength (FS), and fiber uniformity (FU) was analyzed. Nine genes were mapped to eight chromosomes with reported QTLs of FL, FE, FS, FM, and FU (Figure 7). Among nine GhHATs, only four genes were co-localized with QTLs of FL, FE, FM, FS, and FU on four chromosomes, i.e., Chr-A05, Chr-A06, Chr-A08 and Chr-A11 of the A subgenome. GhHAC1502 was located within the qFE-A05-2, GhHAG1503 gene anchored in qFU-A06-1 and qFE-A06-2, and GhHAG1504 was mapped in the qFU-A05-2 QTL region, while GhHAC1504 was 2 Mb from the qFL-A08. Among the D subgenome HATs, GhHAC1502, GhHAC1503 and GhHAG1503 were anchored in the FL-QTL-9, SNP (i20058Gh, i38606Gh), and qFL-D06, respectively, while GhHAF1501 and GhHAG1504 were found in surroundings of reported SNP. Interestingly, some genes were co-localized with multiple QTLs related to different fiber development traits. For example, the GhHAC1502 gene on chromosome A05 and D05 was anchored in FL and FE QTL, and the GhHAG1503 gene was localized inside the FL, FE and FU QTL. This reveals that these GhHATs had pleiotropic effects on fiber development related traits.

3. Discussion

Histone acetylation is a mark of transcriptional activation and has been reported to play an important role in plant development and response to various biotic and abiotic stresses [12,14,15,16,18]. Moreover, levels of histone acetylation are tightly linked with gene expression regulation. HATs carry out histone acetylation and have been classified into different distinct groups in Arabidopsis [7], rice [8], Vitis vinifera [9], and Citrus sinensis [10]. In this study, we revealed that Gossypium HATs could also be classified into three major subgroups: CBP, GNAT, and TAFII250. This suggests that multiple subgroups of Gossypium HATs might play specialized roles in the adaptive evolution of cotton. However, similar to rice [8], the MYST domain containing homologs of HATs in all the three genomes of cotton were absent, while Arabidopsis [7] and Vitis [9] had MYST domain members. This indicates the specific functional divergence of HATs between the different field crop plants. CBP, GNAT, and MYST HATs are also considered as transcriptional co-activators in addition to their HAT activity. For example, TAZ-type, ZZ-type and PHD-type zinc finger domains of CBP have been reported to play an important role in protein recognition and protein-protein interactions [36,37]. The PHD domain has also been reported to interact with histones and other histone-related proteins [38]. Furthermore, bromodomains are known to bind to acetylated lysine residues [39,40]. Along with functional catalytic domains, all the other conserved domains of Gossypium GNAT, CBP and TAFII250 were largely similar to their counterparts in monocots and dicots (Figure 2C). These observations suggest that all the Gossypium HATs may have similar functions as described in other plant species.
Gene duplication plays a significant role in generating new gene subfamilies in the evolution of genome and genetic systems [41]. Tandem duplication, polyploidy, and segmental duplications primarily contribute to the creation of new gene families [41]. Two segmental duplications were found in G. hirsutum (GhHAC1501A/GhHAC1502A, GhHAG1501A/GhHAG1502A), G. raimondii (GrHAC1501/GrHAC1502, GrHAC1502/GrHAC1503), and G. arboretum (GaHAC1501/GaHAC1502, GaHAG1501/GaHAG1502) (Figure 3). Gene duplications occurred in these genes because the identities of the genes flanking both sides of the paralogous Gossypium HAT genes were found to be absolutely conserved and located on duplicated segments on two different chromosomes. Moreover, these duplicated genes were not likely diverged much during the evolution based on their Ka/Ks ratios (Table S2), suggesting the functional conservation of duplicated genes. This observation can partially be validated by the overlapping expression patterns of GhHAG1501 and GhHAG1502 during the fiber development and in different tissues (Figure 5A,B). However, the expression of GhHAG1501 did not change in response to Cd, while the expression of GhHAG1502 increased compared with control (Figure 6), suggesting that these duplicated genes may undergo functional divergence in response to particular stimuli.
Arabidopsis HATs play a crucial role in different aspects of plant development [12,14,15,16,18]. G. hirsutum has a huge contribution in the textile industry. Therefore, the identification of HATs genes in G. hirsutum and their role in fiber development will provide the fundamental information for future studies. Our results showed that the expression of GhHAC1503 (CBP subgroup) was increased during the different stages of fiber development, while the expression of GhHAG1501/GhHAG1502 (GNAT subgroup) and GhHAF1501 (TAFII250 subgroup) was generally decreased (Figure 5B). This suggests that histone acetylation levels are likely to be dynamic during the course of fiber development. However, further studies are required to investigate the function of histone acetylation in cotton fiber development. Phytohormones, including gibberellic acid (GA) [42], jasmonic acid (JA) [43], abscisic acid (ABA) [44], ethylene [45], and auxin (NAA) [46], are also known to regulate the fiber development. Cis-regulatory elements specific for ethylene (ERE), GA (GARE), ABA (ABRE), and JA (CGTCA) were found in the promoter of four highly expressed GhHATs (GhHAC1503, GhHAG1501, GhHAG1502 and GhHAF1501) during the fiber development (Tables S3 and S4, Figure S3). This suggests that the expression of these GhHATs might be regulated by phytohormones. Consistent with this, the expression of GhHAG1501/GhHAG1502 slightly increased in response to ABA treatment, while the expression of GhHAC1503 decreased (Figure 6). The expression of GhHAF1501 did not change in response to ABA treatment, but the expression was increased in response to NAA treatment (Figure 6). This suggests that these phytohormones directly or indirectly regulate the expression of these GhHATs, which may lead to different acetylation levels. The exogenous application of auxin has been shown to cause higher acetylation levels at the promoter of SKP2B [47], while the acetylation levels decrease at the promoter of KRP7 in Arabidopsis [48], indicating the crosstalk between phytohormones and histone acetylation in plants. However, further studies are required to investigate the crosstalk between histone acetylation and phytohormones in cotton. Together, our results suggest that histone acetylation might play an important role in fiber development, as well as cotton growth. However, further studies are required to investigate the function of each GhHATs in phytohormone related pathways.
Histone acetylation has been reported to play a key role in DNA damage repair [49,50,51]. Histone acetyltransferase 1 (HAT1) is required for the incorporation of H4K5/H4K12 acetylated H3.3 histones at the sites of double strand breaks (DSB), which then facilitate the recruitment of a key DNA repair factor Rad51 in mammals [52]. Furthermore, DSB-inducing agents have been reported to induce the H4K16ac levels in mammals [53], indicating a key role of histone acetylation in DNA damage and repair pathways. In Arabidopsis, the histone acetyltransferases HAM1, HAM2 and HAG3 have been reported to participate in UV-B induced DNA damage [54,55]. Furthermore, a treatment with the histone acetyltransferase inhibitor curcumin increased DNA damage in Arabidopsis and maize [54], indicating the conserved role of histone acetylation in DNA damage in plants. Our qRT-PCR results showed that the expression of GhHAC1502, GhHAC1503, GhHAG1501 and GhHAF1501 increased, while the expression of GhHAC1504 decreased compared with the control in response to MMS treatment (Figure 6). In brief, our results suggest the potential implication of GhHATs in DNA damage repair pathways in cotton. However, further studies are required to investigate whether and how GhHATs are involved in DNA damage repair.
Different abiotic stresses, including, cold, drought, salt, and metal stresses, severely affect the cotton growth and yield. Recent studies established the link of histone acetylation and abiotic stresses [32,56,57,58]. For example, salt treatment caused a global increase of H3K9 and H3K4 acetylations [32], while cold treatment decreased the H3K9, H4K5 and H4K4 acetylations compared with the control in maize [58]. Similarly, in response to dehydration treatment, drought responsive genes such as RD29A, RD29B, RD20 and RAP2.4 were found to be differentially acetylated at H3K9, H3K14, H3K23 and H3K27 in A. thaliana [56]. We showed that many GhHATs were differentially regulated in response to different abiotic stresses, suggesting the dynamic levels of histone acetylation in each abiotic stress adaptation in cotton. Our expression data also suggest the functional diversity and specificity among different subgroups of Gossypium HATs (GhHACs, GhHAGs and GhHAFs) in response to stress, as well as hormone treatments (Figure 6). For example, the expression of GhHAC1502 strongly increased in response to NaCl, while the expression of GhHAC1503 was strongly induced by Zn. Similarly, in the HAGs subgroup, the expression of GhHAG1501 was strongly induced by NaCl, while the expression of GhHAG1502 did not change. These observations suggest that GhHATs likely play an important role in cotton plant adaptation to various abiotic stresses. Furthermore, we also noticed that more than one gene responded to a particular stress. For example, in response to salt stress, the expression of GhHAC1501, GhHAC1502, GhHAC1503, GhHAG1501, GhHAG1504 and GhHAF1501 increased, while the expression of GhHAC1504 and GhHAG1503 decreased compared to the control. This suggests that different GhHATs may work together in response to particular stimuli and may participate in long-term resistance to different abiotic stresses. However, further molecular and biochemical studies are required to validate GhHATs function and to understand the underlying molecular mechanism.
Four HAT genes (GhHAC1502, GhHAC1503, GhHAG1503 and GhHAG1504) on six chromosomes were anchored in fiber development-related QTL regions. These four genes were identified inside multiple QTLs, suggesting the pleiotropic role of these genes in fiber related traits. These results also support the conclusion that both the A and D genomes of Gossypium hirsutum jointly participate in different aspects of cotton fiber trait. Interestingly, GhHAC1502, GhHAC1503, GhHAG1503 and GhHAG1504 also displayed differential expression at different fiber development stages and in response to abiotic stresses, metal stress, MMS and phytohormones. This suggests that these four HAT genes are potentially involved in cotton growth and development, fiber-related traits, and plant response to the environment. However, in general, there were few discrepancies between RNA-seq and qRT-PCR data. RNA-seq expression levels were either from the A or D genome of G. hirsutum and it would be difficult to properly separate and count the reads from the homologous regions. On the contrary, we regarded GhHACxA and GhHACxD as one combination, referred to as GhHACx, because of the extremely high similarity between the mRNAs of the GhHACxA-GhHACxD gene pairs (for example, GhHAC1502A/GhHAC1502D and GhHAG1501A/GhHAG1501D have 99 and 99.5% similarity, respectively) and their nearly identical transcript sizes. With such a high similarity, we could not distinguish them using the qRT-PCR, and the results of qRT-PCR are theoretically the average of A and D genome’s expression. Thus, potential difficulties of read counts on homologous regions in RNA-seq and inability to separate the A and G genome expressions by qRT-PCR may cause the discrepancy between RNA-seq and qRT-PCR results. In brief, further studies are required to comprehensively elucidate the function of HATs in different aspects of cotton plant.
In this study, we highlighted complex and diverse transcriptional regulations of GhHATs which significantly broadened our understanding of the underlying epigenetic mechanisms in allotetraploid cotton and unraveled an extra layer of complexity for better allotetraploid cotton adaptation in response to developmental, environmental, and hormonal cues. Furthermore, our results strongly recommend the comprehensive dissection of the biological and cellular function of GhHATS and argue for the potential implication of histone acetyltransferases in cotton molecular breeding in addition to other existing breeding strategies. This will eventually lead to the long-term improvement of stress tolerance in cotton and will allow high fiber yield and quality.

4. Materials and Methods

4.1. Identification of HATs Gene Family

The data of three cotton species, G. raimondii (JGI, version), G. arboretum (BJI, version 1.0), and G. hirsutum (NAU, version 1.1) were attained from the COTTONGEN (http://www.cottongen.org) [33,34,35]. The HAT protein sequences from Arabidopsis, rice, Brachypodium distachyon, and Vitis Vinfera were downloaded from Phytozome (http://phytozome.jgi.doe.gov/pz/portal.html) and then used as queries in BLASTP searches [59] against the G. raimondii, G. arboretum and G. hirsutum genomes, respectively. Genes with E-values < 1.0 were selected, and redundant sequences were eliminated by following the previously published method [60]. Furthermore, InterProScan (http://www.ebi.ac.uk/interpro/search/sequence-search) was used to confirm the presence of the HAT domain [61]. The physicochemical properties were predicted by ExPASy (http://cn.expasy.org/tools).

4.2. Analysis of Chromosomal Location and Gene Duplication

The loci of HATs were deduced from the gff3-files of cotton genome. The localization of HATs genes on the chromosomes were visualized using the program Circos [62]. The duplication events of HATs and Ka/Ks were calculated using the previously published method [63]. The T = Ks/2λ equation was used to determine the duplication time and deviation of the HAT gene pairs, assuming clock-like rates of (λ) 1.5 × 10⁻⁸ substitutions per synonymous site per year for cotton [64].

4.3. Sequence Alignment and Phylogenetic Analyses

Multiple sequence alignment was performed for the full-length HAT proteins using Clustal W with standard settings [65]. A neighbor-joining (NJ) phylogenetic tree was constructed using the full length HATs sequences from G. raimondii, G. arboretum and G. hirsutum by MEGA 6.0 [66], with P-distance and pairwise gap deletion parameters engaged. The bootstrap test was used with 1000 replicates to evaluate the statistical consistency of each node. To confirm the grades from the NJ method, the minimal-evolution method of MEGA 6.0 was utilized with 1000 replicates as well.

4.4. Gene Structure, Protein Motif, and Promoter Cis-Element Analysis

The exon/intron structures of the HAT genes were acquired from bed-file and displayed using the online tool Gene Structure Display Server (http://gsds.cbi.pku.edu.cn) [67]. The NJ tree was constructed with MEGA 6.0 as explained above. The deduced HAT protein sequences of three cotton species were submitted to the online Multiple Expectation Maximization for Motif Elicitation (MEME) version 4.11.1 (http://meme-suite.org/tools/meme) [68] as described [60]. For cis-element analysis in promoter regions, the 1 kb upstream sequences were analyzed in the PlantCARE database (http://bioinformatics.psb.ugent.be/webtools/plantcare/html/) [69].

4.5. Transcriptome Data Analysis and Gene Expression Heatmap

The raw data of RNA-seq of G. hirsutum were downloaded from the NCBI Sequence Read Archive (SRA: PRJNA248163) to calculate the expression level. TopHat (version: 2.0.13) was used for mapping reads, cufflinks (version: 2.2.1) were used to analyze gene expression levels, and fragments per kilobase million values were used to normalize gene expression levels [70]. Finally, these values of the GhHAT candidates were extracted from total expression data and the heatmap was generated by MeV 4.0 (http://www.tm4.org/).

4.6. Plant Materials, Stress Treatments, and qRT-PCR

G. hirsutum cultivar ‘CRI35’ was used for gene expression analysis. All the sampled tissues obtained from cotton plants grown under field condition with standardized cultural practices to determine the expression analysis [60]. For treatments, cotton seeds were surface sterilized and germinated on a moist paper. Young seedlings of same size were selected and exposed to NaCl (200 mM), polyethylene glycol 4000 (PEG4000) (15%), cold (4 °C), methyl methanesulfonate (MMS) (250 ppm), auxin (NAA) (10 µM), abscisic acid (ABA) (10 µM), ZnSO4 (1 mM), and CdCl2 (1 mM) for 24 h. All treatments were performed in three biological replicates. All samples were frozen quickly in liquid nitrogen and kept at −80 °C. The total RNA was extracted from cotton samples using the RNAprep Pure Plant kit (TIANGEN, Beijing, China). A total of 2 μg of RNA was used as the template, and the first-strand cDNAs were synthesized using the SuperScript III (Invitrogen, Waltham, MA, USA). Quantitative real-time PCR (qRT-PCR) analysis was performed as described previously in [71] using the specific primers for each GhHAT gene (Table S5). Cotton UBQ7 (UniProt accession number: AY189972) was used as an internal reference gene for normalization of expression and three biological replicates were performed for each sample. To calculate the relative expression levels, a comparative 2−∆∆Ct method was used [72]. The heat map for the gene expression profiles was generated with Mev 4.0 (http://www.tm4.org/) [73].

4.7. Co-localization of HATs with Fiber Related QTLs

To identify the localization of QTLs and SNPs for fiber development related traits, QTLs and linked molecular markers were retrieved from the Cotton Gen website (https://www.cottongen.org). The sequence of each marker was fetched from Cotton Gen to obtain the physical position information. For this purpose, the sequence of each marker was BLAST against the G. hirsutum (AD1) and HAU genome in the CottonGFD database. HAT genes co-localized with QTLs were displayed to show HAT gene distribution on chromosomes, along with surrounding loci and QTLs, using mapchart software. Genes identified inside the QTL or ≤500 kb far from SNP were considered as anchored gene in QTL because cotton LD decay was approximately 0.80 Mb [74].

4.8. Statistical Analysis

After performing normal distribution of the data and the homogeneity of variance tests, analysis of variance (ANOVA) was performed, followed by the least significant difference (LSD) test at p value ≤ 0.05 for each parameter. Different letters indicate significant difference by LSD test (p ≤ 0.05). Statistical analyses were performed using the Statistical Package for Social Sciences (SPSS) software (version 11.5, SPSS Inc., Chicago, IL, USA).

5. Conclusions

In this study, 36 HATs were identified in three genomes of Gossypium and clustered into three groups: CPB, GNAT, and TAFII250. Gossypium HATs are unevenly distributed on the chromosomes, and segmental duplications contributed to the evolution of the HATs family. Cis-element analysis discovered several abiotic and biotic stresses and hormonal responsive elements in the promoter region of the GhHATs, but each member had peculiar types and numbers. Furthermore, the expression profile of the upland cotton HAT gene family exhibited different expression patterns in response to abiotic and hormonal stresses, which disclosed that GhHATs play roles in different aspects of upland cotton abiotic stress tolerance and hormonal signaling. Thus, our study helps to lay the foundation for the functional characterization of the GhHATs gene family by overexpression and knockdown/out using RNAi or CRISPR-Cas9 genome editing and provides new insight into the evolution and divergence of HAT genes in plants. Furthermore, these results may enhance the understanding of the molecular mechanisms of many agronomic traits of cotton, such as fiber development and other physiological processes.

Supplementary Materials

Supplementary Materials can be found at https://www.mdpi.com/1422-0067/20/21/5311/s1.

Author Contributions

Conceptualization, S.S.; Formal analysis, M.I., S.S., M.A.F., M.K.N., E.W. and A.B.; Funding acquisition, S.S. and R.R.-C.W.; Methodology, M.I.; Writing—original draft, M.I. and S.S.; Writing—review & editing, S.S., K.B.J. and R.R.-C.W.

Funding

This research was supported by the grant PD-IPFP/HRD/HEC/2013/1129 from Higher Education Commission of Pakistan.

Acknowledgments

We would like to thank Yasar Sajjad (Department of Biotechnology, COMSATS University Islamabad, Abbottabad campus, Pakistan) for his valuable suggestions.

Conflicts of Interest

The authors declare no conflict of interest.

References

  1. Berr, A.; Shafiq, S.; Shen, W.-H. Histone modifications in transcriptional activation during plant development. Biochim. Et Biophys. Acta (BBA)-Gene Regul. Mech. 2011, 1809, 567–576. [Google Scholar] [CrossRef]
  2. Ho, L.; Crabtree, G.R. Chromatin remodelling during development. Nature 2010, 463, 474. [Google Scholar] [CrossRef] [PubMed]
  3. Patel, D.J.; Wang, Z. Readout of epigenetic modifications. Annu. Rev. Biochem. 2013, 82, 81–118. [Google Scholar] [CrossRef] [PubMed]
  4. Earley, K.W.; Shook, M.S.; Brower-Toland, B.; Hicks, L.; Pikaard, C.S. In vitro specificities of Arabidopsis co-activator histone acetyltransferases: Implications for histone hyperacetylation in gene activation. Plant J. 2007, 52, 615–626. [Google Scholar] [CrossRef] [PubMed]
  5. Zhang, K.; Sridhar, V.V.; Zhu, J.; Kapoor, A.; Zhu, J.-K. Distinctive core histone post-translational modification patterns in Arabidopsis thaliana. PLoS ONE 2007, 2, e1210. [Google Scholar] [CrossRef] [PubMed]
  6. Sterner, D.E.; Berger, S.L. Acetylation of histones and transcription-related factors. Microbiol. Mol. Biol. Rev. 2000, 64, 435–459. [Google Scholar] [CrossRef]
  7. Pandey, R.; MuÈller, A.; Napoli, C.A.; Selinger, D.A.; Pikaard, C.S.; Richards, E.J.; Bender, J.; Mount, D.W.; Jorgensen, R.A. Analysis of histone acetyltransferase and histone deacetylase families of Arabidopsis thaliana suggests functional diversification of chromatin modification among multicellular eukaryotes. Nucleic Acids Res. 2002, 30, 5036–5055. [Google Scholar] [CrossRef] [PubMed] [Green Version]
  8. Liu, X.; Luo, M.; Zhang, W.; Zhao, J.; Zhang, J.; Wu, K.; Tian, L.; Duan, J. Histone acetyltransferases in rice (Oryza sativa L.): Phylogenetic analysis, subcellular localization and expression. BMC Plant Biol. 2012, 12, 145. [Google Scholar] [CrossRef]
  9. Aquea, F.; Timmermann, T.; Arce-Johnson, P. Analysis of histone acetyltransferase and deacetylase families of Vitis vinifera. Plant Physiol. Biochem. 2010, 48, 194–199. [Google Scholar] [CrossRef]
  10. Xu, J.; Xu, H.; Liu, Y.; Wang, X.; Xu, Q.; Deng, X. Genome-wide identification of sweet orange (Citrus sinensis) histone modification gene families and their expression analysis during the fruit development and fruit-blue mold infection process. Front. Plant Sci. 2015, 6, 607. [Google Scholar] [CrossRef]
  11. Deng, W.; Liu, C.; Pei, Y.; Deng, X.; Niu, L.; Cao, X. Involvement of the Histone Acetyltransferase AtHAC1 in the Regulation of Flowering Time via Repression of FLOWERING LOCUS C in Arabidopsis. Plant Physiol. 2007, 143, 1660–1668. [Google Scholar] [CrossRef] [PubMed]
  12. Bertrand, C.; Bergounioux, C.; Domenichini, S.; Delarue, M.; Zhou, D.-X. Arabidopsis histone acetyltransferase AtGCN5 regulates the floral meristem activity through the WUSCHEL/AGAMOUS pathway. J. Biol. Chem. 2003, 278, 28246–28251. [Google Scholar] [CrossRef] [PubMed]
  13. Han, S.K.; Song, J.D.; Noh, Y.S.; Noh, B. Role of plant CBP/p300-like genes in the regulation of flowering time. Plant J. 2007, 49, 103–114. [Google Scholar] [CrossRef] [PubMed]
  14. Kornet, N.; Scheres, B. Members of the GCN5 histone acetyltransferase complex regulate PLETHORA-mediated root stem cell niche maintenance and transit amplifying cell proliferation in Arabidopsis. Plant Cell 2009, 21, 1070–1079. [Google Scholar] [CrossRef]
  15. Latrasse, D.; Benhamed, M.; Henry, Y.; Domenichini, S.; Kim, W.; Zhou, D.-X.; Delarue, M. The MYST histone acetyltransferases are essential for gametophyte development in Arabidopsis. BMC Plant Biol. 2008, 8, 121. [Google Scholar] [CrossRef]
  16. Sokol, A.; Kwiatkowska, A.; Jerzmanowski, A.; Prymakowska-Bosak, M. Up-regulation of stress-inducible genes in tobacco and Arabidopsis cells in response to abiotic stresses and ABA treatment correlates with dynamic changes in histone H3 and H4 modifications. Planta 2007, 227, 245–254. [Google Scholar] [CrossRef]
  17. Stockinger, E.J.; Mao, Y.; Regier, M.K.; Triezenberg, S.J.; Thomashow, M.F. Transcriptional adaptor and histone acetyltransferase proteins in Arabidopsis and their interactions with CBF1, a transcriptional activator involved in cold-regulated gene expression. Nucleic Acids Res. 2001, 29, 1524–1533. [Google Scholar] [CrossRef]
  18. Bharti, K.; von Koskull-Döring, P.; Bharti, S.; Kumar, P.; Tintschl-Körbitzer, A.; Treuter, E.; Nover, L. Tomato heat stress transcription factor HsfB1 represents a novel type of general transcription coactivator with a histone-like motif interacting with the plant CREB binding protein ortholog HAC1. Plant Cell 2004, 16, 1521–1535. [Google Scholar] [CrossRef]
  19. Benhamed, M.; Bertrand, C.; Servet, C.; Zhou, D.-X. Arabidopsis GCN5, HD1, and TAF1/HAF2 interact to regulate histone acetylation required for light-responsive gene expression. Plant Cell 2006, 18, 2893–2903. [Google Scholar] [CrossRef]
  20. Chen, Z.; Zhang, H.; Jablonowski, D.; Zhou, X.; Ren, X.; Hong, X.; Schaffrath, R.; Zhu, J.-K.; Gong, Z. Mutations in ABO1/ELO2, a subunit of holo-Elongator, increase abscisic acid sensitivity and drought tolerance in Arabidopsis thaliana. Mol. Cell. Biol. 2006, 26, 6902–6912. [Google Scholar] [CrossRef]
  21. Nelissen, H.; De Groeve, S.; Fleury, D.; Neyt, P.; Bruno, L.; Bitonti, M.B.; Vandenbussche, F.; Van Der Straeten, D.; Yamaguchi, T.; Tsukaya, H. Plant Elongator regulates auxin-related genes during RNA polymerase II transcription elongation. Proc. Natl. Acad. Sci. USA 2010, 107, 1678–1683. [Google Scholar] [CrossRef] [PubMed] [Green Version]
  22. Cao, X. Whole genome sequencing of cotton—A new chapter in cotton genomics. Sci. China Life Sci. 2015, 58, 515–516. [Google Scholar] [CrossRef] [PubMed]
  23. Chen, Z.J.; Scheffler, B.E.; Dennis, E.; Triplett, B.A.; Zhang, T.; Guo, W.; Chen, X.; Stelly, D.M.; Rabinowicz, P.D.; Town, C.D. Toward sequencing cotton (Gossypium) genomes. Plant Physiol. 2007, 145, 1303–1310. [Google Scholar] [CrossRef] [PubMed]
  24. Jiang, C.-X.; Wright, R.J.; El-Zik, K.M.; Paterson, A.H. Polyploid formation created unique avenues for response to selection in Gossypium (cotton). Proc. Natl. Acad. Sci. USA 1998, 95, 4419–4424. [Google Scholar] [CrossRef]
  25. Wendel, J.F. New World tetraploid cottons contain Old World cytoplasm. Proc. Natl. Acad. Sci. USA 1989, 86, 4132–4136. [Google Scholar] [CrossRef] [Green Version]
  26. Wang, R.; Ji, S.; Zhang, P.; Meng, Y.; Wang, Y.; Chen, B.; Zhou, Z. Drought Effects on Cotton Yield and Fiber Quality on Different Fruiting Branches. Crop Sci. 2016, 56, 1265–1276. [Google Scholar] [CrossRef]
  27. Imran, M.; Shakeel, A.; Farooq, J.; Saeed, A.; Farooq, A.; Riaz, M. Genetic studies of fiber quality parameter and earliness related traits in upland cotton (Gossypium hirsutum L.). Adv. Agric. Bot. 2011, 3, 151–159. [Google Scholar]
  28. Imran, M.; Shakeel, A.; Azhar, F.; Farooq, J.; Saleem, M.; Saeed, A.; Nazeer, W.; Riaz, M.; Naeem, M.; Javaid, A. Combining ability analysis for within-boll yield components in upland cotton (Gossypium hirsutum L.). Genet. Mol. Res. 2012, 11, 2790–2800. [Google Scholar] [CrossRef]
  29. Tian, L.; Fong, M.P.; Wang, J.J.; Wei, N.E.; Jiang, H.; Doerge, R.; Chen, Z.J. Reversible histone acetylation and deacetylation mediate genome-wide, promoter-dependent and locus-specific changes in gene expression during plant development. Genetics 2005, 169, 337–345. [Google Scholar] [CrossRef]
  30. Chen, Z.J.; Tian, L. Roles of dynamic and reversible histone acetylation in plant development and polyploidy. Biochim. Et Biophys. Acta (BBA)-Gene Struct. Expr. 2007, 1769, 295–307. [Google Scholar] [CrossRef] [Green Version]
  31. Pavangadkar, K.; Thomashow, M.F.; Triezenberg, S.J. Histone dynamics and roles of histone acetyltransferases during cold-induced gene regulation in Arabidopsis. Plant Mol. Biol. 2010, 74, 183–200. [Google Scholar] [CrossRef] [PubMed]
  32. Li, H.; Yan, S.; Zhao, L.; Tan, J.; Zhang, Q.; Gao, F.; Wang, P.; Hou, H.; Li, L. Histone acetylation associated up-regulation of the cell wall related genes is involved in salt stress induced maize root swelling. BMC Plant Biol. 2014, 14, 105. [Google Scholar] [CrossRef] [PubMed]
  33. Zhang, T.; Hu, Y.; Jiang, W.; Fang, L.; Guan, X.; Chen, J.; Zhang, J.; Saski, C.A.; Scheffler, B.E.; Stelly, D.M. Sequencing of allotetraploid cotton (Gossypium hirsutum L. acc. TM-1) provides a resource for fiber improvement. Nat. Biotechnol. 2015, 33, 531. [Google Scholar] [CrossRef] [PubMed]
  34. Li, F.; Fan, G.; Lu, C.; Xiao, G.; Zou, C.; Kohel, R.J.; Ma, Z.; Shang, H.; Ma, X.; Wu, J. Genome sequence of cultivated Upland cotton (Gossypium hirsutum TM-1) provides insights into genome evolution. Nat. Biotechnol. 2015, 33, 524. [Google Scholar] [CrossRef] [PubMed]
  35. Wang, K.; Wang, Z.; Li, F.; Ye, W.; Wang, J.; Song, G.; Yue, Z.; Cong, L.; Shang, H.; Zhu, S. The draft genome of a diploid cotton Gossypium raimondii. Nat. Genet. 2012, 44, 1098. [Google Scholar] [CrossRef]
  36. Gamsjaeger, R.; Liew, C.K.; Loughlin, F.E.; Crossley, M.; Mackay, J.P. Sticky fingers: Zinc-fingers as protein-recognition motifs. Trends Biochem. Sci. 2007, 32, 63–70. [Google Scholar] [CrossRef]
  37. Bienz, M. The PHD finger, a nuclear protein-interaction domain. Trends Biochem. Sci. 2006, 31, 35–40. [Google Scholar] [CrossRef]
  38. Lallous, N.; Legrand, P.; McEwen, A.G.; Ramón-Maiques, S.; Samama, J.-P.; Birck, C. The PHD finger of human UHRF1 reveals a new subgroup of unmethylated histone H3 tail readers. PLoS ONE 2011, 6, e27599. [Google Scholar] [CrossRef]
  39. Servet, C.; e Silva, N.C.; Zhou, D.-X. Histone acetyltransferase AtGCN5/HAG1 is a versatile regulator of developmental and inducible gene expression in Arabidopsis. Mol. Plant 2010, 3, 670–677. [Google Scholar] [CrossRef]
  40. Marmorstein, R.; Berger, S.L. Structure and function of bromodomains in chromatin-regulating complexes. Gene 2001, 272, 1–9. [Google Scholar] [CrossRef]
  41. Cannon, S.B.; Mitra, A.; Baumgarten, A.; Young, N.D.; May, G. The roles of segmental and tandem gene duplication in the evolution of large gene families in Arabidopsis thaliana. BMC Plant Biol. 2004, 4, 10. [Google Scholar] [CrossRef] [PubMed]
  42. Xiao, Y.-H.; Li, D.-M.; Yin, M.-H.; Li, X.-B.; Zhang, M.; Wang, Y.-J.; Dong, J.; Zhao, J.; Luo, M.; Luo, X.-Y. Gibberellin 20-oxidase promotes initiation and elongation of cotton fibers by regulating gibberellin synthesis. J. Plant Physiol. 2010, 167, 829–837. [Google Scholar] [CrossRef] [PubMed]
  43. Wang, L.; Zhu, Y.; Hu, W.; Zhang, X.; Cai, C.; Guo, W. Comparative transcriptomics reveals jasmonic acid-associated metabolism related to cotton fiber initiation. PLoS ONE 2015, 10, e0129854. [Google Scholar] [CrossRef] [PubMed]
  44. Samuel Yang, S.; Cheung, F.; Lee, J.J.; Ha, M.; Wei, N.E.; Sze, S.H.; Stelly, D.M.; Thaxton, P.; Triplett, B.; Town, C.D. Accumulation of genome-specific transcripts, transcription factors and phytohormonal regulators during early stages of fiber cell development in allotetraploid cotton. Plant J. 2006, 47, 761–775. [Google Scholar] [CrossRef] [PubMed] [Green Version]
  45. Shi, Y.-H.; Zhu, S.-W.; Mao, X.-Z.; Feng, J.-X.; Qin, Y.-M.; Zhang, L.; Cheng, J.; Wei, L.-P.; Wang, Z.-Y.; Zhu, Y.-X. Transcriptome profiling, molecular biological, and physiological studies reveal a major role for ethylene in cotton fiber cell elongation. Plant Cell 2006, 18, 651–664. [Google Scholar] [CrossRef] [PubMed]
  46. Zhang, M.; Zheng, X.; Song, S.; Zeng, Q.; Hou, L.; Li, D.; Zhao, J.; Wei, Y.; Li, X.; Luo, M. Spatiotemporal manipulation of auxin biosynthesis in cotton ovule epidermal cells enhances fiber yield and quality. Nat. Biotechnol. 2011, 29, 453. [Google Scholar] [CrossRef] [PubMed]
  47. Manzano, C.; Ramirez-Parra, E.; Casimiro, I.; Otero, S.; Desvoyes, B.; De Rybel, B.; Beeckman, T.; Casero, P.; Gutierrez, C.; del Pozo, J.C. Auxin and epigenetic regulation of SKP2B, an F-box that represses lateral root formation. Plant Physiol. 2012, 160, 749–762. [Google Scholar] [CrossRef]
  48. Anzola, J.M.; Sieberer, T.; Ortbauer, M.; Butt, H.; Korbei, B.; Weinhofer, I.; Mullner, A.E.; Luschnig, C. Putative Arabidopsis transcriptional adaptor protein (PROPORZ1) is required to modulate histone acetylation in response to auxin. Proc. Natl. Acad. Sci. USA 2010, 107, 10308–10313. [Google Scholar] [CrossRef]
  49. Chailleux, C.; Tyteca, S.; Papin, C.; Boudsocq, F.; Puget, N.; Courilleau, C.; Grigoriev, M.; Canitrot, Y.; Trouche, D. Physical interaction between the histone acetyl transferase Tip60 and the DNA double-strand breaks sensor MRN complex. Biochem. J. 2010, 426, 365–371. [Google Scholar] [CrossRef] [Green Version]
  50. Dhar, S.; Gursoy-Yuzugullu, O.; Parasuram, R.; Price, B.D. The tale of a tail: Histone H4 acetylation and the repair of DNA breaks. Philos. Trans. R. Soc. Lond. Ser. B Biol. Sci. 2017, 372. [Google Scholar] [CrossRef]
  51. Murr, R.; Loizou, J.I.; Yang, Y.G.; Cuenin, C.; Li, H.; Wang, Z.Q.; Herceg, Z. Histone acetylation by Trrap-Tip60 modulates loading of repair proteins and repair of DNA double-strand breaks. Nat. Cell Biol. 2006, 8, 91–99. [Google Scholar] [CrossRef] [PubMed]
  52. Yang, X.; Li, L.; Liang, J.; Shi, L.; Yang, J.; Yi, X.; Zhang, D.; Han, X.; Yu, N.; Shang, Y. Histone acetyltransferase 1 promotes homologous recombination in DNA repair by facilitating histone turnover. J. Biol. Chem. 2013, 288, 18271–18282. [Google Scholar] [CrossRef] [PubMed]
  53. Li, L.; Wang, Y. Cross-talk between the H3K36me3 and H4K16ac histone epigenetic marks in DNA double-strand break repair. J. Biol. Chem. 2017, 292, 11951–11959. [Google Scholar] [CrossRef] [PubMed] [Green Version]
  54. Campi, M.; D’Andrea, L.; Emiliani, J.; Casati, P. Participation of chromatin-remodeling proteins in the repair of ultraviolet-B-damaged DNA. Plant Physiol. 2012, 158, 981–995. [Google Scholar] [CrossRef] [PubMed]
  55. Fina, J.P.; Casati, P. HAG3, a Histone Acetyltransferase, Affects UV-B Responses by Negatively Regulating the Expression of DNA Repair Enzymes and Sunscreen Content in Arabidopsis thaliana. Plant Cell Physiol. 2015, 56, 1388–1400. [Google Scholar] [CrossRef]
  56. Kim, J.M.; To, T.K.; Ishida, J.; Morosawa, T.; Kawashima, M.; Matsui, A.; Toyoda, T.; Kimura, H.; Shinozaki, K.; Seki, M. Alterations of lysine modifications on the histone H3 N-tail under drought stress conditions in Arabidopsis thaliana. Plant Cell Physiol. 2008, 49, 1580–1588. [Google Scholar] [CrossRef]
  57. Asensi-Fabado, M.A.; Amtmann, A.; Perrella, G. Plant responses to abiotic stress: The chromatin context of transcriptional regulation. Biochim. Et Biophys. Acta. Gene Regul. Mech. 2017, 1860, 106–122. [Google Scholar] [CrossRef] [Green Version]
  58. Hu, Y.; Zhang, L.; Zhao, L.; Li, J.; He, S.; Zhou, K.; Yang, F.; Huang, M.; Jiang, L.; Li, L. Trichostatin A selectively suppresses the cold-induced transcription of the ZmDREB1 gene in maize. PLoS ONE 2011, 6, e22132. [Google Scholar] [CrossRef]
  59. Altschul, S.F.; Madden, T.L.; Schäffer, A.A.; Zhang, J.; Zhang, Z.; Miller, W.; Lipman, D.J. Gapped BLAST and PSI-BLAST: A new generation of protein database search programs. Nucleic Acids Res. 1997, 25, 3389–3402. [Google Scholar] [CrossRef]
  60. Imran, M.; Tang, K.; Liu, J.-Y. Comparative Genome-Wide Analysis of the Malate Dehydrogenase Gene Families in Cotton. PLoS ONE 2016, 11, e0166341. [Google Scholar] [CrossRef]
  61. Quevillon, E.; Silventoinen, V.; Pillai, S.; Harte, N.; Mulder, N.; Apweiler, R.; Lopez, R. InterProScan: Protein domains identifier. Nucleic Acids Res. 2005, 33, W116–W120. [Google Scholar] [CrossRef] [PubMed]
  62. Krzywinski, M.; Schein, J.; Birol, I.; Connors, J.; Gascoyne, R.; Horsman, D.; Jones, S.J.; Marra, M.A. Circos: An information aesthetic for comparative genomics. Genome Res. 2009, 19, 1639–1645. [Google Scholar] [CrossRef] [PubMed] [Green Version]
  63. Imran, M.; Liu, J.-Y. Genome-wide identification and expression analysis of the malate dehydrogenase gene family in Gossypium arboreum. Pak. J. Bot. 2016, 48, 1081–1090. [Google Scholar]
  64. Blanc, G.; Wolfe, K.H. Widespread paleopolyploidy in model plant species inferred from age distributions of duplicate genes. Plant Cell 2004, 16, 1667–1678. [Google Scholar] [CrossRef] [PubMed]
  65. Thompson, J.D.; Higgins, D.G.; Gibson, T.J. CLUSTAL W: Improving the sensitivity of progressive multiple sequence alignment through sequence weighting, position-specific gap penalties and weight matrix choice. Nucleic Acids Res. 1994, 22, 4673–4680. [Google Scholar] [CrossRef]
  66. Tamura, K.; Stecher, G.; Peterson, D.; Filipski, A.; Kumar, S. MEGA6: Molecular evolutionary genetics analysis version 6.0. Mol. Biol. Evol. 2013, 30, 2725–2729. [Google Scholar] [CrossRef]
  67. Guo, A.; Zhu, Q.; Chen, X.; Luo, J. GSDS: A gene structure display server. Yi Chuan = Hered. 2007, 29, 1023–1026. [Google Scholar] [CrossRef]
  68. Bailey, T.L.; Williams, N.; Misleh, C.; Li, W.W. MEME: Discovering and analyzing DNA and protein sequence motifs. Nucleic Acids Res. 2006, 34, W369–W373. [Google Scholar] [CrossRef]
  69. Lescot, M.; Déhais, P.; Thijs, G.; Marchal, K.; Moreau, Y.; Van de Peer, Y.; Rouzé, P.; Rombauts, S. PlantCARE, a database of plant cis-acting regulatory elements and a portal to tools for in silico analysis of promoter sequences. Nucleic Acids Res. 2002, 30, 325–327. [Google Scholar] [CrossRef]
  70. Trapnell, C.; Roberts, A.; Goff, L.; Pertea, G.; Kim, D.; Kelley, D.R.; Pimentel, H.; Salzberg, S.L.; Rinn, J.L.; Pachter, L. Differential gene and transcript expression analysis of RNA-seq experiments with TopHat and Cufflinks. Nat. Protoc. 2012, 7, 562–578. [Google Scholar] [CrossRef] [Green Version]
  71. Shafiq, S.; Chen, C.; Yang, J.; Cheng, L.; Ma, F.; Widemann, E.; Sun, Q. DNA Topoisomerase 1 prevents R-loop accumulation to modulate auxin-regulated root development in rice. Mol. Plant 2017, 10, 821–833. [Google Scholar] [CrossRef] [PubMed]
  72. Livak, K.J.; Schmittgen, T.D. Analysis of relative gene expression data using real-time quantitative PCR and the 2− ΔΔCT method. Methods 2001, 25, 402–408. [Google Scholar] [CrossRef] [PubMed]
  73. Saeed, A.; Sharov, V.; White, J.; Li, J.; Liang, W.; Bhagabati, N.; Braisted, J.; Klapa, M.; Currier, T.; Thiagarajan, M. TM4: A free, open-source system for microarray data management and analysis. Biotechniques 2003, 34, 374–378. [Google Scholar] [CrossRef] [PubMed]
  74. Sun, Z.; Wang, X.; Liu, Z.; Gu, Q.; Zhang, Y.; Li, Z.; Ke, H.; Yang, J.; Wu, J.; Wu, L.; et al. Genome-wide association study discovered genetic variation and candidate genes of fibre quality traits in Gossypium hirsutum L. Plant Biotechnol. J. 2017, 15, 982–996. [Google Scholar] [CrossRef] [PubMed]
Figure 1. Phylogenetic relationships of histone acetyltransferases (HATs) from Gossypium hirsutum, Gossypium raimondii, Gossypium arboretum, Arabidopsis thaliana, Oryza sativa, Brachypodium distachyon and Vitis vinifera. The un-rooted phylogenetic tree was constructed using MEGA 6 by the neighbor-joining (NJ) method, and the bootstrap analysis was performed with 1000 replicates. For the phylogenetic tree, amino acid sequences were used and the classification of CPB, GNAT and TAFII250 was performed based on the conserved signature domain of each subgroup. The HATs from G. hirsutum, G. raimondii, G. arboretum, Arabidopsis, V. vinifera, Brachypodium distachyon, and Oryza sativa were marked with black, green, red, pink, cyan blue, yellow, and blue dots, respectively.
Ijms 20 05311 g001
Figure 2. Phylogenetic relationships, conserved motifs, domain organization, and gene structure analysis of HATs in Gossypium hirsutum, Gossypium raimondii and Gossypium arboretum. (A) The unrooted phylogenetic tree was constructed using MEGA 6 by the NJ method, and the bootstrap analysis was performed with 1000 replicates. The HAT proteins from G. hirsutum, G. raimondii, and G. arboretum were marked with black, green and red dots, respectively. The branches of each subgroup were indicated in a specific color. (B) Motif identification analysis in HAT proteins from G. hirsutum, G. raimondii and G. arboretum. Each motif is shown in unique color, and the regular expression and sequences of the 1–10 motifs are listed in Figure S1. (C) Domain organization of HAT proteins from G. hirsutum, G. raimondii and G. arboretum. One representative of each subgroup of HAT from G. hirsutum is presented. (D) The intron/exon structure of HAT genes from G. hirsutum, G. raimondii and G. arboretum. The green boxes and grey lines represent exons and introns, respectively.
Ijms 20 05311 g002
Figure 3. Chromosomal distribution and gene duplication of HATs in Gossypium hirsutum (A) and in Gossypium raimondii and Gossypium arboretum (B). The chromosome number was indicated in boxes and represented as Gh1-Gh13A/D (A), Ga1-Ga13, and Gr1-Gr13 (B) for G. hirsutum, G. raimondii, and G. arboretum, respectively. The orthologous HATs are connected by green, while the segment duplication of HATs is represented by light blue and red colors in different genomes.
Ijms 20 05311 g003
Figure 4. Gene expression pattern of Gossypium hirsutum HATs by the analysis of RNA-sequencing in different tissues and at different stages of fiber development (A) and in response to cold, hot, salt, and polyethylene glycol (PEG) 6000 stresses (B). The illumina reads of RNA-seq data were retrieved from the National Center for Biotechnology Information Sequence Read Archive (NCBI SRA) database. The color scale at the bottom of heat map indicates the fragments per kilobase million (FPKM)-normalized log2 transformed counts.
Ijms 20 05311 g004
Figure 5. Gene expression validation of HATs from G. hirsutum by quantitative real-time polymerase chain reaction (qRT-PCR) in different tissues. (A) RNA from the root, leaf, stem and flowers was extracted and reverse transcribed. Ubiquitin 7 (UBQ7) was used as an internal control for qRT-PCR. The relative expression is presented in the heat map, and the color scale at the top represents the relative signal intensity. The primer sequences can be found in Table S5. (B) Gene expression validation of HATs from G. hirsutum by qRT-PCR at different stages of fiber development. The data were normalized to UBQ7. The data presented are the average of three biological replicates. Bar = standard deviation (SD).
Ijms 20 05311 g005
Figure 6. Expression pattern of Gossypium hirsutum HATs in response to abiotic stresses and hormones. RNA from roots after 24 h of CK (control), cadmium (Cd), zinc (Zn), abscisic acid (ABA), auxin (NAA), DNA damage (MMS), cold, salt (NaCl), and drought (PEG4000) was extracted and reverse transcribed. UBQ7 was used as an internal control for qRT-PCR. The data presented are the average of three biological replicates. Different letters indicate significant difference by least significant difference (LSD) test (p ≤ 0.05). Bar = SD.
Ijms 20 05311 g006
Figure 7. Distribution of co-localized HAT genes on chromosomes of A and D subgenomes of G. hirsutum. The scale represents the physical position of genes and quantitative trait loci (QTL)-linked markers in megabases (Mb). QTLs/Single Nucleotide Polymorphism (SNPs) related to fiber length (FL), fiber elongation (FE), fiber micronaire (FM), fiber strength (FS), and fiber uniformity (FU) are shown. Asterisks indicate that the HAT genes co-localized with QTLs/SNPs related to fiber.
Ijms 20 05311 g007

