Article

Magnetic Resonance Imaging and X-Ray Imaging Properties of Ultrasmall Lanthanide Oxide (Ln = Eu, Gd, and Tb) Nanoparticles Synthesized via Thermal Decomposition

1
Department of Chemistry, College of Natural Sciences, Kyungpook National University, Taegu 41566, Republic of Korea
2
Division of Biomedical Science, School of Medicine, Kyungpook National University, Taegu 41944, Republic of Korea
3
Division of RI-Convergence Research, Korea Institute of Radiological & Medical Science, Seoul 01817, Republic of Korea
4
Institute of Biomedical Engineering Research, Kyungpook National University, Taegu 41944, Republic of Korea
5
Department of Chemistry Education, Teachers’ College, Kyungpook National University, Taegu 41566, Republic of Korea
6
Department of Molecular Medicine, School of Medicine, Kyungpook National University, Taegu 41944, Republic of Korea
*
Authors to whom correspondence should be addressed.
Molecules 2025, 30(12), 2519; https://doi.org/10.3390/molecules30122519
Submission received: 29 April 2025 / Revised: 29 May 2025 / Accepted: 6 June 2025 / Published: 9 June 2025
(This article belongs to the Special Issue Advanced Magnetic Resonance Methods in Materials Chemistry Analysis)

Abstract

:
Owing to their 4f electrons and high atomic numbers, lanthanide (Ln) elements impart lanthanide oxide (Ln2O3) nanoparticles with excellent biomedical imaging properties. This study reports synthesis for three types of ultrasmall and monodisperse Ln2O3 nanoparticles (Ln = Eu, Gd, and Tb) via thermal decomposition in oleylamine at 280 °C, followed by ligand exchange with citric acid (CA) to produce water-dispersible, CA-grafted Ln2O3 nanoparticles with high colloidal stability. The resulting CA-grafted Ln2O3 nanoparticles had average diameters of approximately 2 nm. We characterized their physicochemical properties, including in vitro cytotoxicity, magnetic resonance imaging properties (i.e., water proton spin relaxivities), and X-ray imaging properties (i.e., X-ray attenuation).

1. Introduction

Advances in multimodal diagnostic imaging offer the potential for more precise and accurate disease treatment [1,2]. A key challenge is the development of imaging agents, compatible with multiple modalities such as magnetic resonance imaging (MRI), X-ray computed tomography (CT), and fluorescence imaging (FI) [3,4,5,6,7]. These techniques have complementary strengths in terms of spatial and temporal resolution, sensitivity, and contrast. For example, CT provides high-quality 3D images of hard tissues such as bone [8], whereas MRI excels in generating 3D images of soft tissues with high resolution and unlimited imaging depth [9,10]. FI is also valuable for its high sensitivity and capacity for multiplex imaging [11]. Multimodal imaging offers enhanced performance over individual techniques, including greater detection sensitivity, imaging depth, and spatial resolution, enabling more detailed and accurate disease characterization [12,13,14,15,16,17]. Therefore, increasing efforts have been devoted to developing multimodal contrast agents and imaging devices.
Nanoparticles have been widely explored as multimodal imaging agents because of their superior imaging properties compared to molecular imaging agents. Among them, lanthanide oxide (Ln2O3) nanoparticles have attracted significant attention for their multiple imaging properties, attributed to the unique 4f electronic structure and high atomic numbers of Ln elements. The 4f electrons are primarily responsible for the appreciable magnetic moments of the Ln2O3 nanoparticles at room temperature [18], and these moments remain largely unaffected by surface ligands or particle size owing to the shielding of compact 4f orbitals by 5s and 5p orbitals [19]. Therefore, ultrasmall Ln2O3 nanoparticles (<3 nm) can be synthesized without compromising magnetic properties, which are beneficial for renal clearance [20,21]. In addition, their high atomic numbers enable strong X-ray attenuation surpassing that of iodine-based molecular contrast agents.
Previous studies have reported various methods for synthesizing Ln2O3 nanoparticles. Ultrasmall Ln2O3 nanoparticles coated with D-glucuronic acid or polyacrylic acid were synthesized using a one-pot polyol method [22,23,24,25,26]. Eu- and Tb-doped nanomaterials were synthesized using solid-state techniques [27,28]. Other methods included sonochemistry [29], coprecipitation [30,31], and calcination [32,33]. However, these previous methods have several disadvantages, such as particle distributions, large sizes (>5 nm), poor water-solubility, and fluorescence quenching [34,35,36] owing to water coordination.
In this study, we employed a thermal decomposition method [37,38,39] to synthesize ultrasmall and monodispersed Ln2O3 (Ln = Eu, Gd, and Tb) nanoparticles. While this method had been used to synthesize quantum dots and 3d-transition metal oxide nanoparticles in organic solvents [37,38] as well as Ln3+-doped 3d-transition metal oxide nanoparticles [39], it employed oleic acid and oleylamine as solvents and capping agents [37,38]. However, only oleylamine was used in this study as its amine groups are easily exchangeable with the carboxyl groups of grafting ligands. This study aimed to synthesize ultrasmall and monodispersed citric acid (CA)-grafted Ln2O3 nanoparticles with high colloidal stability in aqueous media. Their physicochemical properties were evaluated to assess their potential as multimodal contrast agents for MRI and CT.

2. Results and Discussion

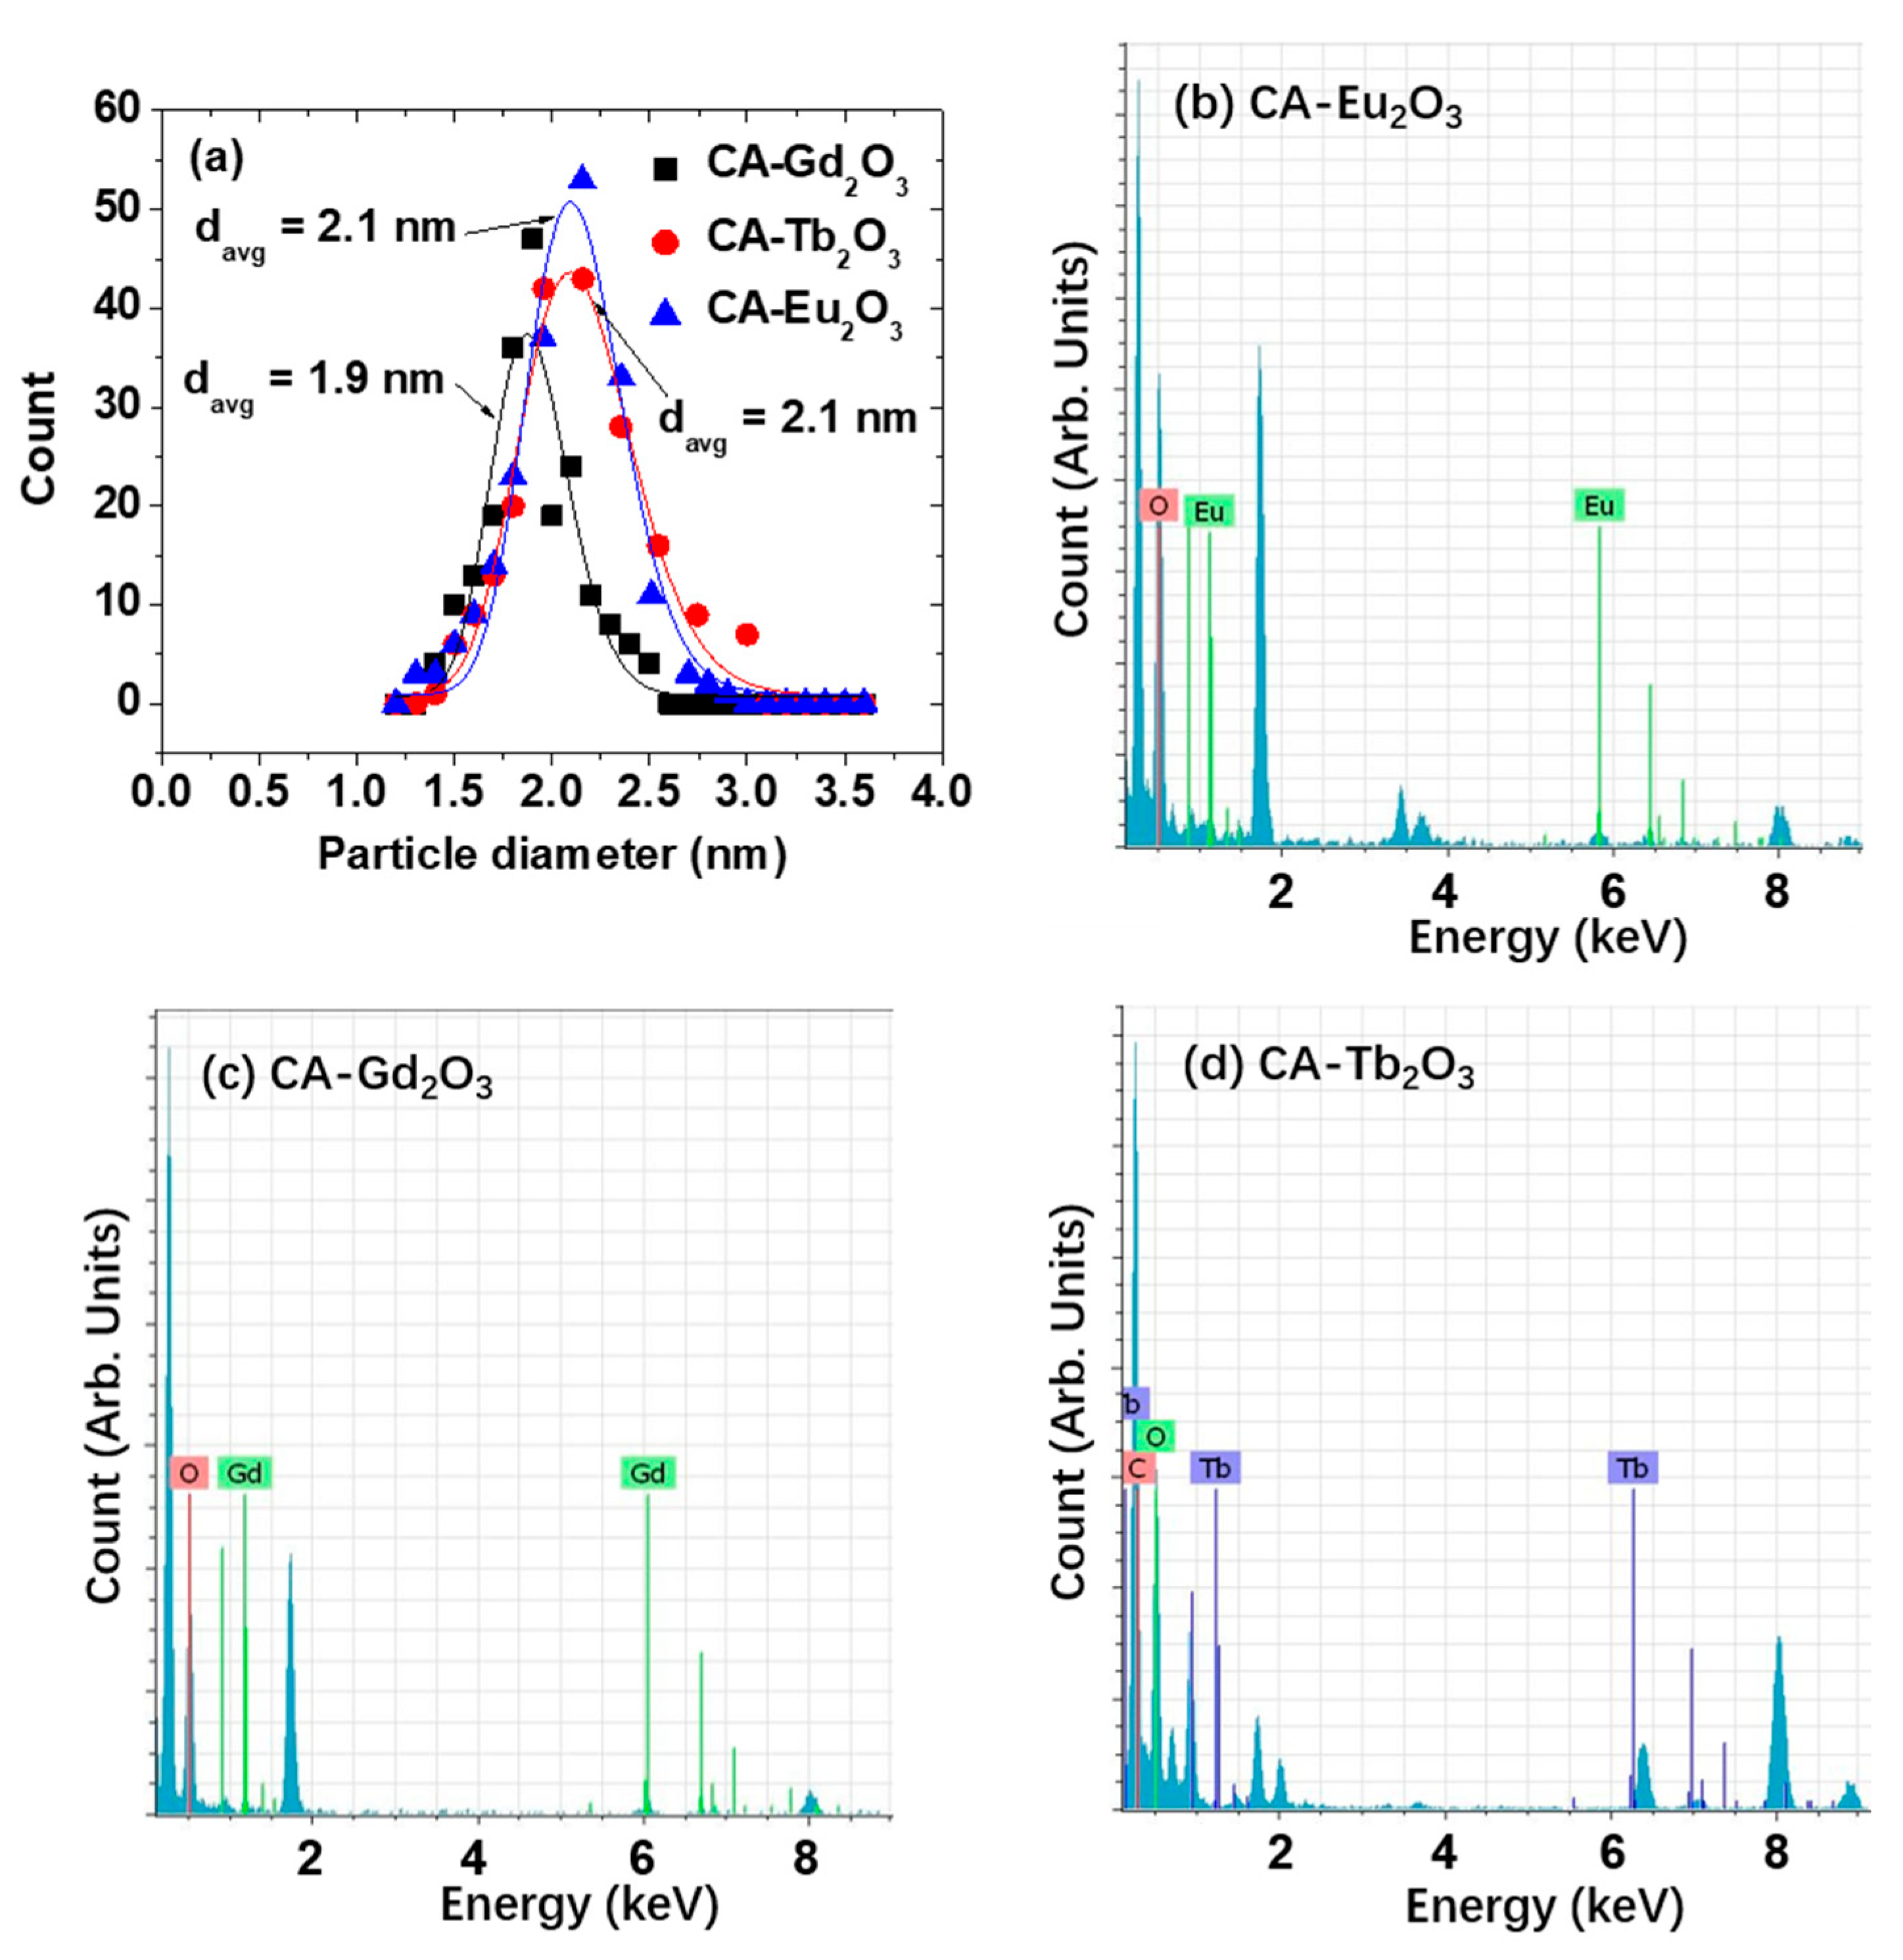
2.1. Physicochemical Properties

CA-grafted Ln2O3 (Ln = Eu, Gd, and Tb) nanoparticles were successfully synthesized via thermal decomposition followed by ligand exchange. High-resolution transmission electron microscopy (HRTEM) revealed particle diameters ranging from 1.1 to 3.0 nm (Figure 1a–c). The average particle diameters (davg), determined by log-normal function fitting of the particle diameter distributions, were 2.1 ± 0.1 nm (Eu), 1.9 ± 0.1 nm (Gd), and 2.1 ± 0.1 nm (Tb) (Figure 2a, Table 1). Energy dispersive spectroscopy (EDS) further confirmed the presence of Eu, Gd, and Tb in the nanoparticles (Figure 2b–d).
Figure 3a shows aqueous solutions of CA-grafted Ln2O3 nanoparticles (Ln = Eu, Gd, and Tb) at concentrations of ~20 mM Ln, forming transparent, well-dispersed colloidal suspensions. Their average hydrodynamic diameters (aavg) were 26.4 ± 1.0 nm, 23.7 ± 1.0 nm, and 27.7 ± 1.0 nm for Ln = Eu, Gd, and Tb, respectively, derived from log-normal functions fits of dynamic light scattering (DLS) data (Figure 3b, Table 1). The nanoparticles exhibited high negative zeta potentials (ζ) of −16.7 ± 0.4 mV, −15.9 ± 0.2 mV, and −11.0 ± 0.3 mV for Ln = Eu, Gd, and Tb (Figure 3c, Table 1), respectively, attributed to the carboxyl groups of CA. The Tyndall effect was observed only in the nanoparticle solutions (Figure 3d), confirming their good colloidal stability compared to triple-distilled water.

2.2. Crystallinity

X-ray diffraction (XRD) patterns of the synthesized nanoparticle powders were recorded before and after thermogravimetric analysis (TGA) (Figure 4). Before TGA, the XRD patterns lacked sharp peaks because of incomplete nanoparticle crystallization from ultrasmall particle sizes [40]. However, after TGA up to 900 °C, sharp cubic Ln2O3 (Ln = Eu, Gd, and Tb) peaks appeared, indicating crystal growth. The lattice constants of TGA-treated nanoparticles were 10.853, 10.802, and 10.556 Å for Ln = Eu, Gd, and Tb, respectively, closely matching reported values of 10.863, 10.813, and 10.700 Å, respectively (Card No. Eu2O3: 03-065-3182, Gd2O3: 00-012-0797, and Tb2O3: 01-074-1986) [41].

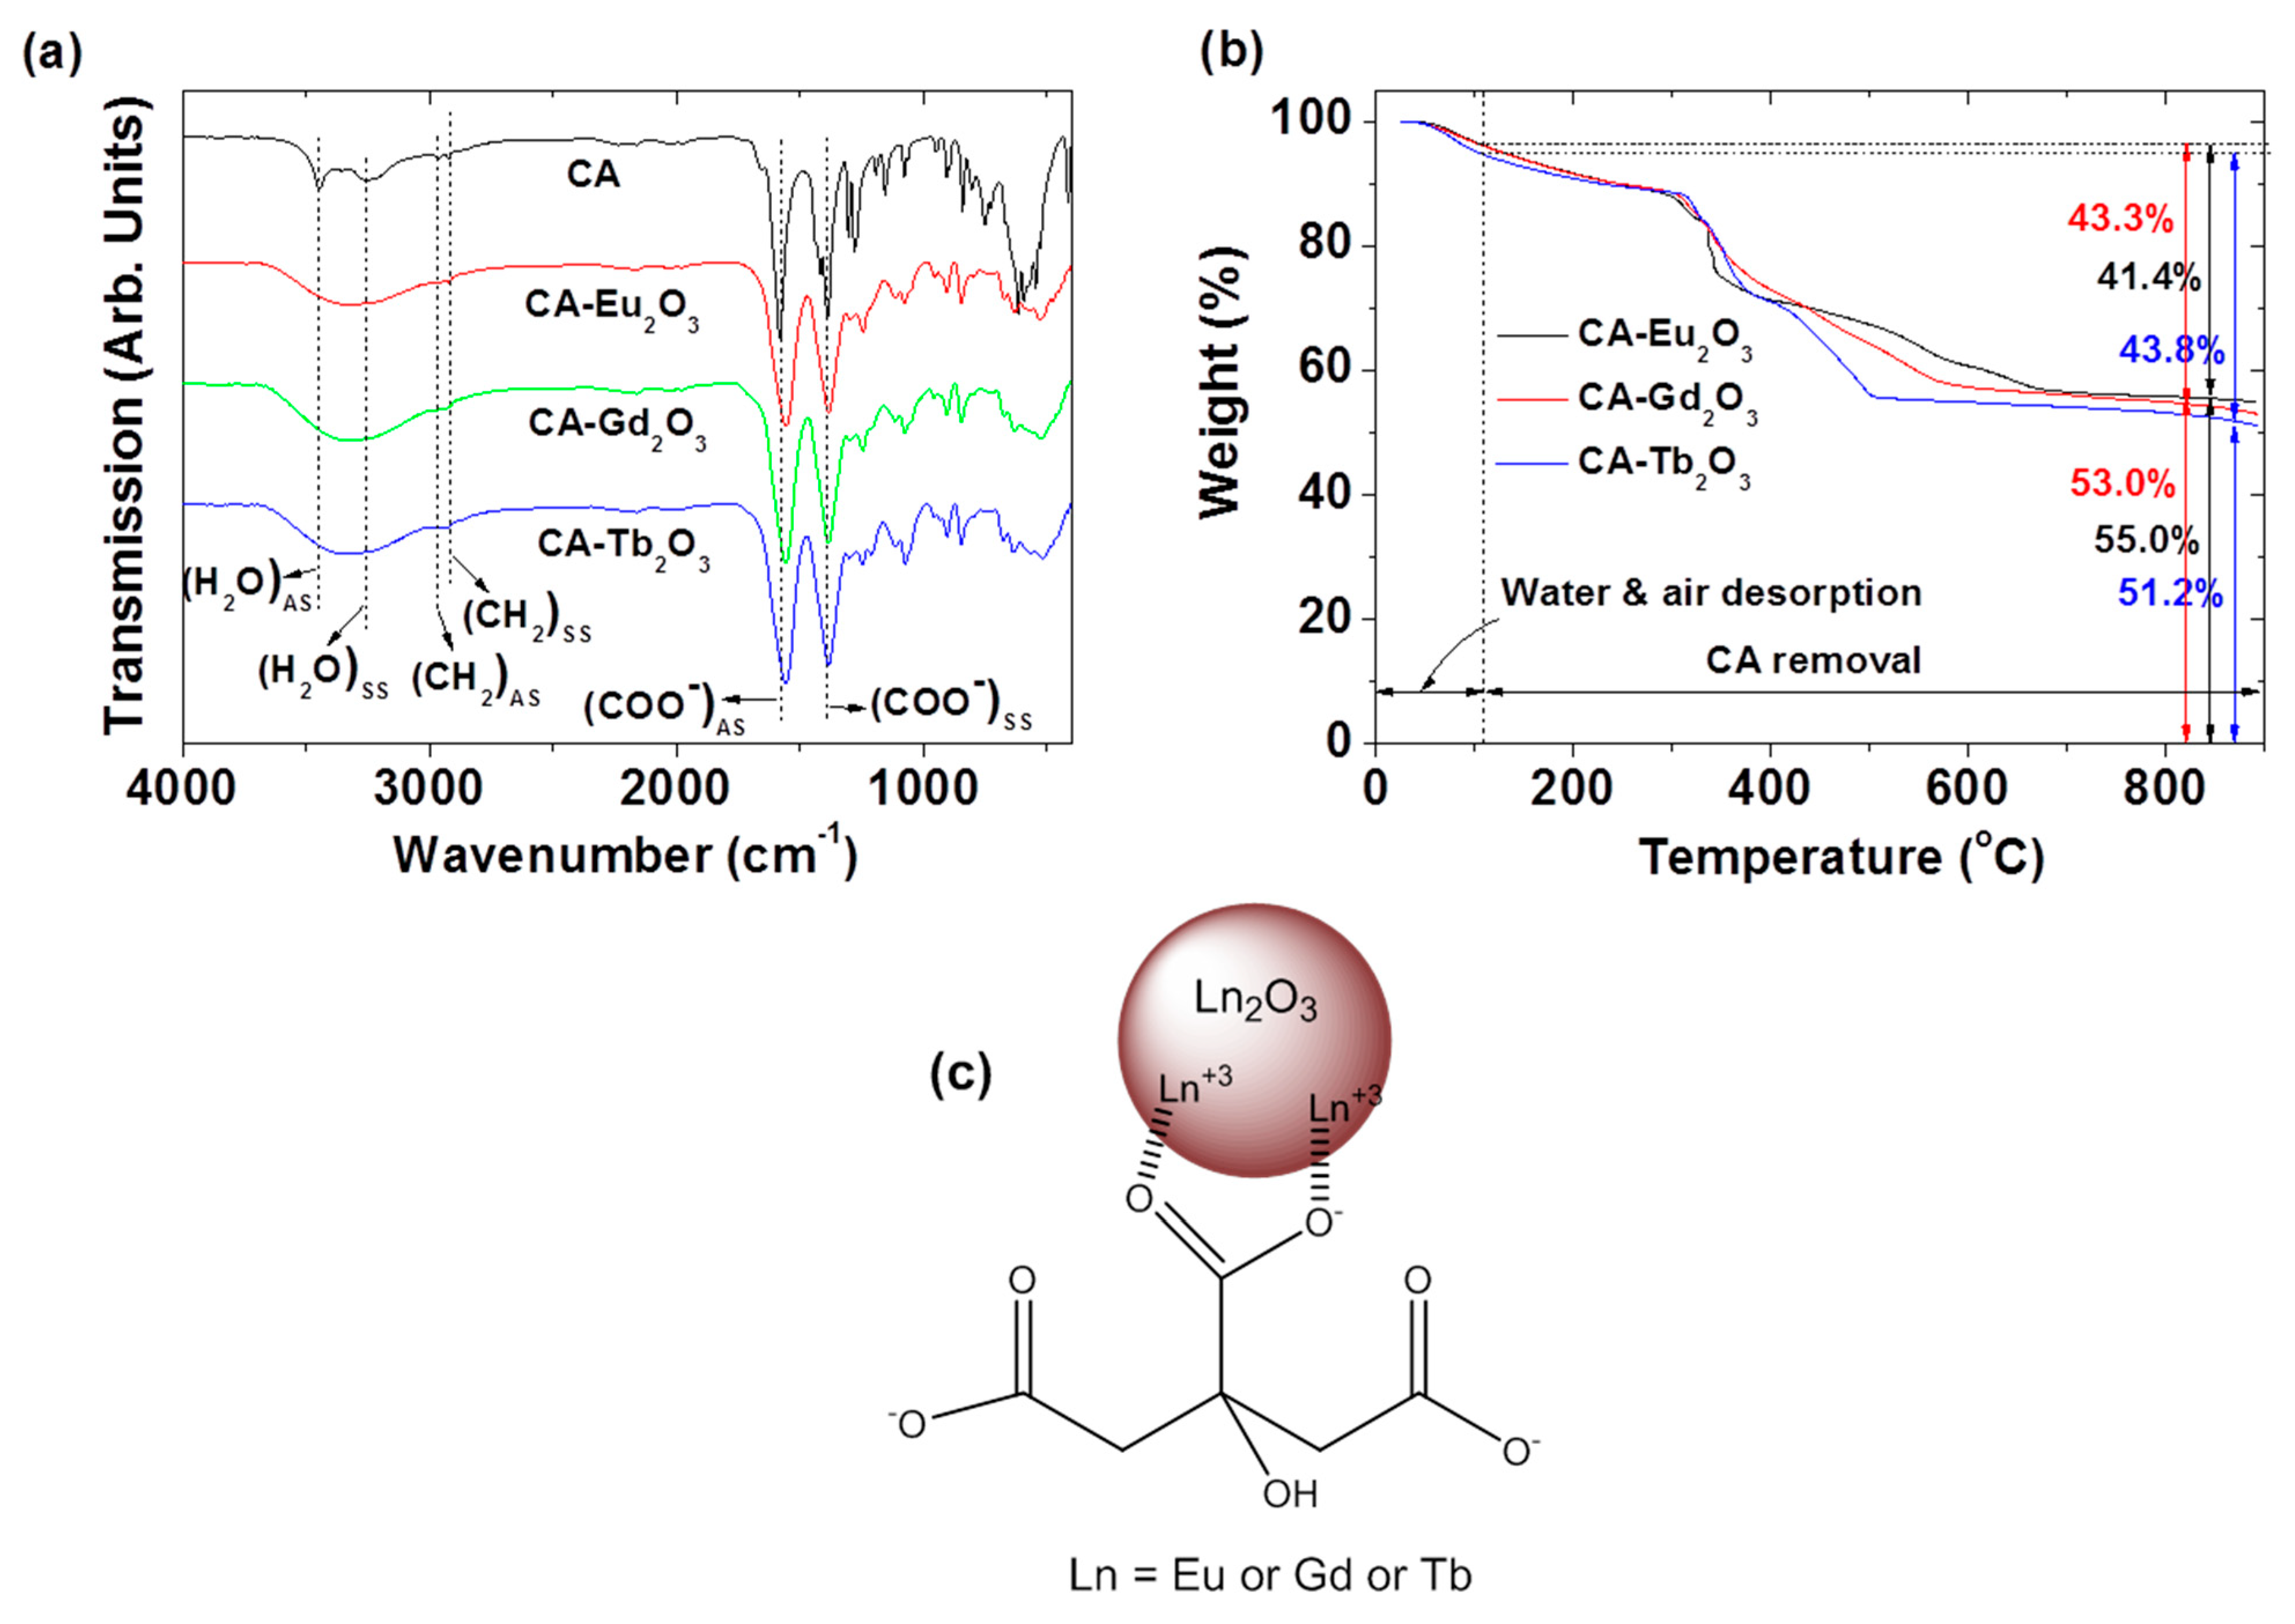
2.3. Surface-Grafting Results

The surface grafting of Ln2O3 nanoparticles (Ln = Eu, Gd, and Tb) with CA was confirmed by Fourier transform-infrared (FT-IR) absorption spectra and compared with that of CA as reference (Figure 5a). The CA characteristic COO antisymmetric (1582 cm−1) and symmetric (1388 cm−1) stretching vibrations [42,43,44] appeared in the FT-IR spectra of the CA-grafted Ln2O3 nanoparticles at 1556–1560 cm−1 and 1384–1389 cm−1, respectively, confirming successful grafting. Grafting resulted from hard acid‒hard base bonding between Ln3+ of Ln2O3 nanoparticles and COO groups of CA [45,46,47], while splitting arose from bridging COO groups bonded to Ln3+ on the nanoparticle surfaces [48]. In addition, the H‒C‒H antisymmetric (2966 cm−1) and symmetric (2922 cm−1) stretching vibrations of CA also appeared in the FT-IR absorption spectra of CA-grafted Ln2O3 nanoparticles, confirming successful CA grafting. The water H‒O‒H antisymmetric (3446 cm−1) and symmetric (~3257 cm−1) stretching vibrations were also observed in all samples as well as CA. The FT-IR absorption frequencies are summarized in Table 2.
Surface-grafting amounts (P) of CA, measured by TGA in wt.%, were 41.4, 43.3, and 43.8% for CA-grafted Ln2O3 nanoparticles (Ln = Eu, Gd, and Tb), respectively, after correcting for water and air desorption below ~105 °C (Figure 5b, Table 1). The residual TGA masses corresponded to the net Ln2O3 nanoparticle masses without CA. The grafting density (σ), defined as the average number of CA molecules per nanoparticle surface area [49], was 4.1, 3.9, and 4.9 for CA-grafted Ln2O3 nanoparticles (Ln = Eu, Gd, and Tb), respectively, using bulk densities of Eu2O3 (7.42 g/cm3), Gd2O3 (7.407 g/cm3), and Tb2O3 (7.91 g/cm3) [50], the davg from HRTEM, and TGA-derived p values. The average number (NNP) of CA molecules per nanoparticle was calculated by multiplying σ by the nanoparticle surface area (=πd2avg). High NNP values indicate sufficient CA grafting for all nanoparticle samples, essential for colloidal stability and low toxicity, as confirmed in this study.
Based on FT-IR absorption spectra, Figure 5c illustrates the proposed CA surface grafting structure on nanoparticles using one representative CA molecule. TGA data shows that 40‒70 CA molecules were grafted per nanoparticle (Table 1).

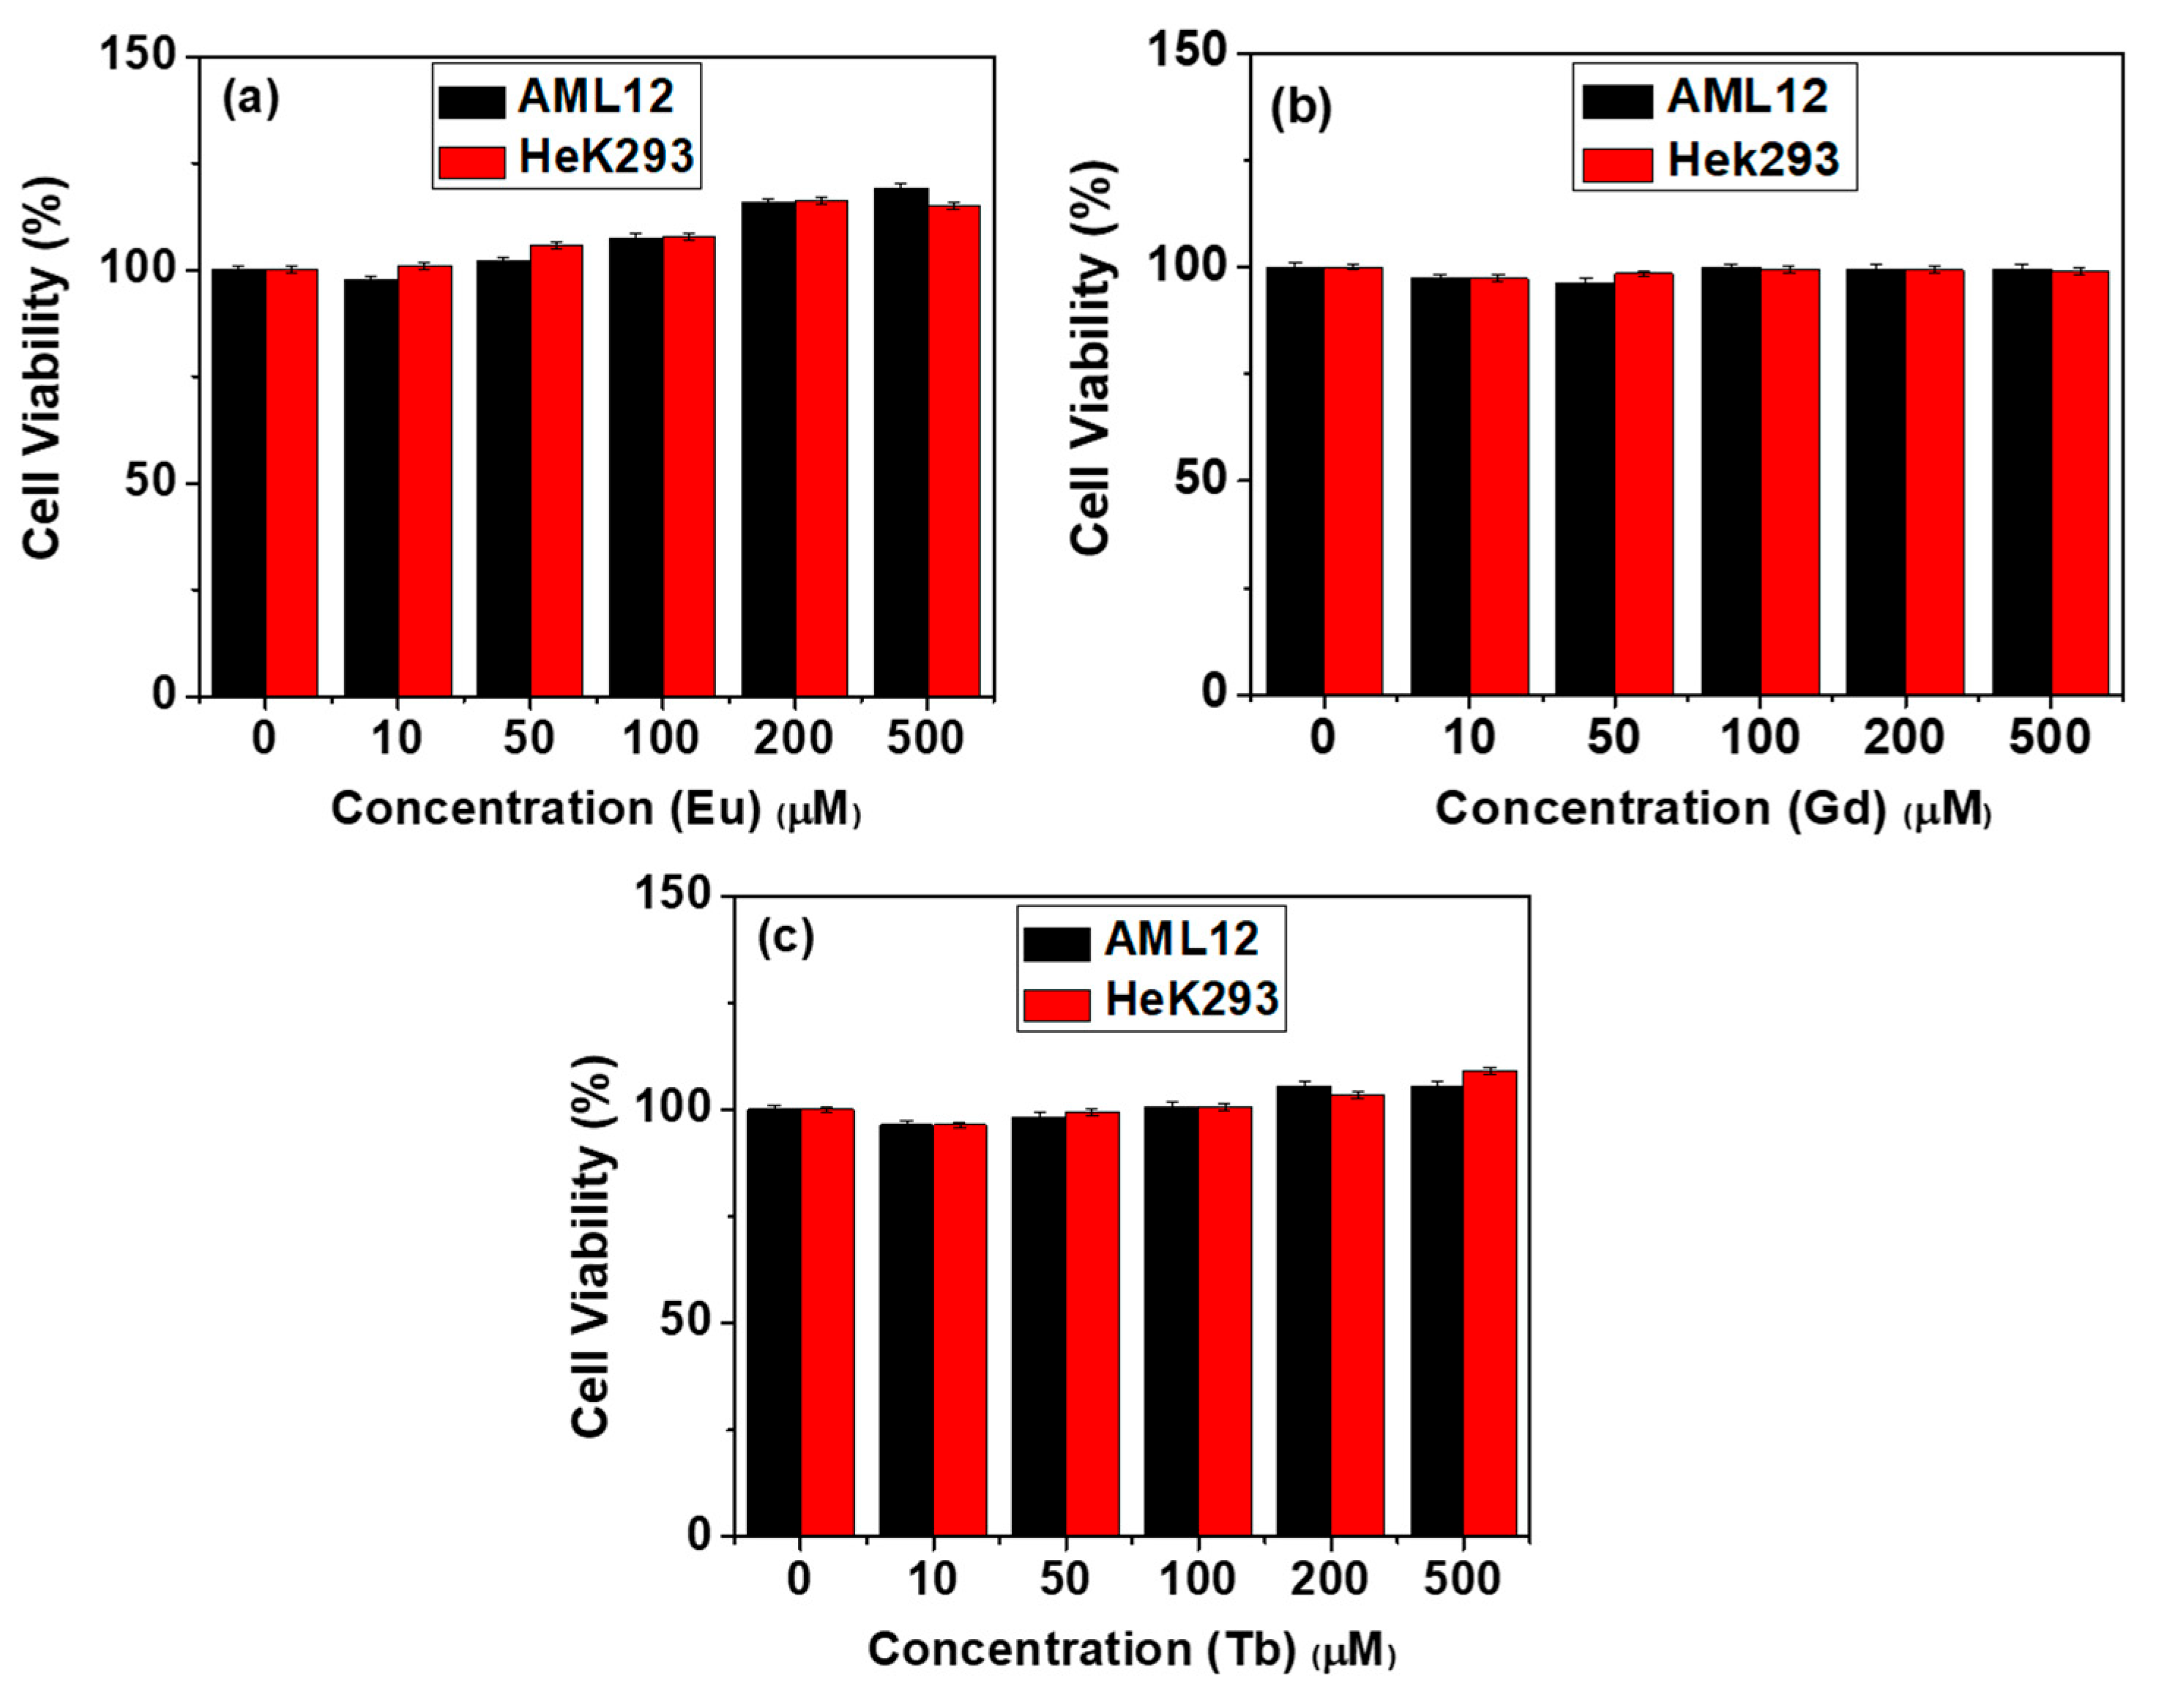
2.4. In Vitro Cytotoxicity

The cellular cytotoxicity of CA-grafted Ln2O3 nanoparticles (Ln = Eu, Gd, and Tb) was assessed by measuring in vitro viability of human embryonic kidney 293 (Hek293) and normal mouse hepatocyte (AML12) cells after 48 h of incubation. All samples exhibited low cytotoxicity up to 500 μM [Ln] (Figure 6a–c).

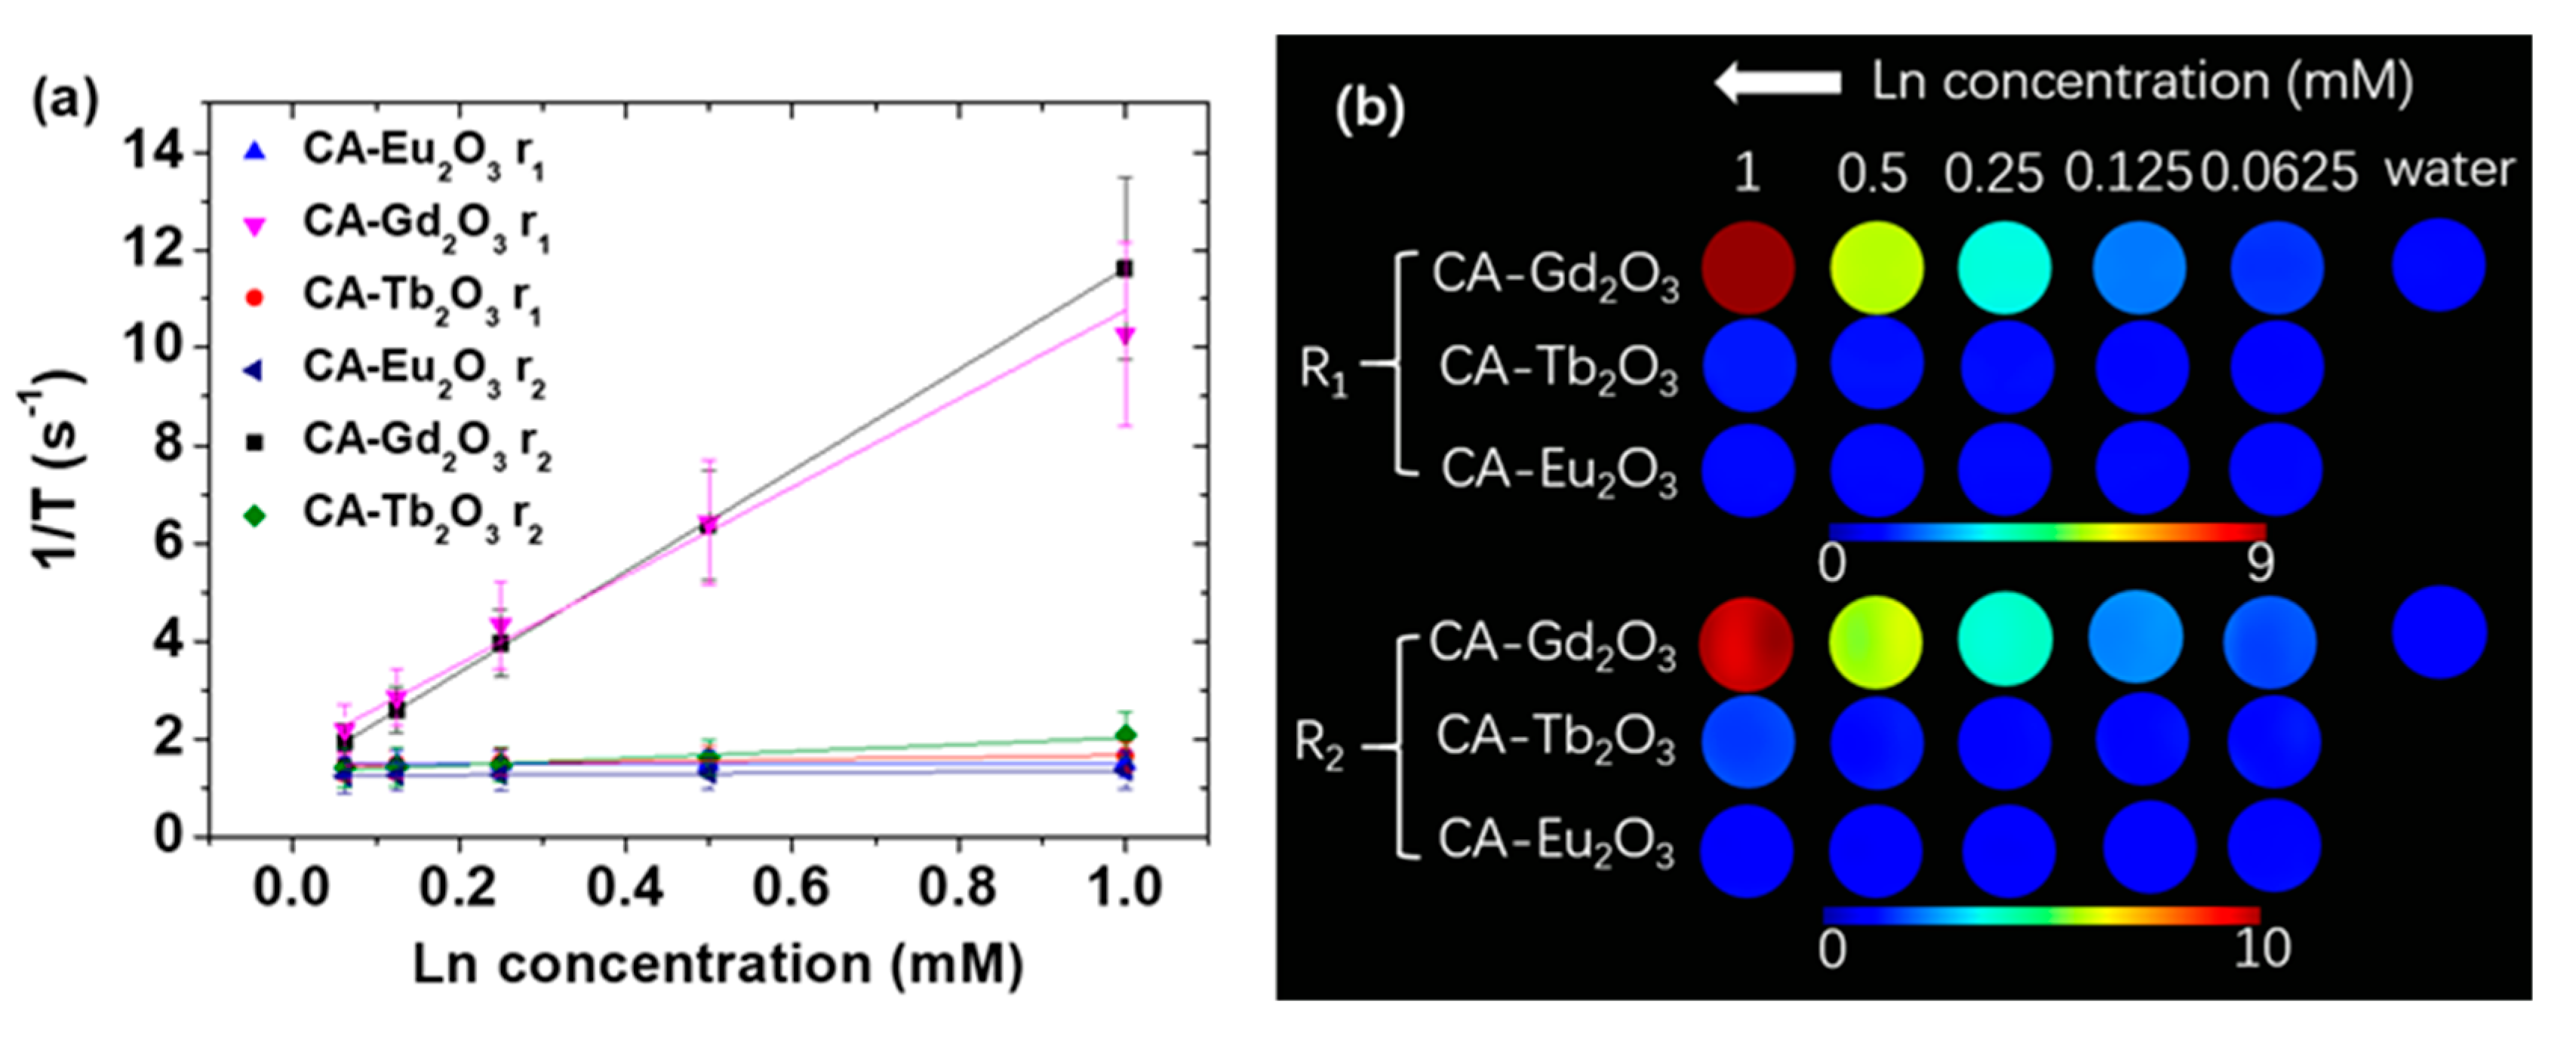
2.5. Magnetic Resonance Imaging Properties

The MRI contrast efficacy of the nanoparticles was assessed by measuring longitudinal (r1) and transverse (r2) water proton spin relaxivities, as well as longitudinal (R1) and transverse (R2) map images at H = 3.0 T. The r1 and r2 values were estimated from the plots of inverse longitudinal (1/T1) and transverse (1/T2) water proton relaxation times versus Ln concentration (Ln = Eu, Gd, and Tb) (Figure 7a, Table 3). CA-grafted Eu2O3 nanoparticles exhibited negligible r1 and r2 values owing to the low magnetic moment of Eu3+ (7F0) [18]. In contrast, CA-grafted Gd2O3 nanoparticles showed r1 and r2 values of 9.04 and 10.33 s−1mM−1, respectively, approximately twice higher than those of commercial Gd-chelates [51,52], indicating their potential as T1 MRI contrast agents given their r2/r1 ratio is close to one. This is attributed to the high density of Gd3+ (8S7/2) with a large 4f electron spin magnetic moment (s = 7/2) [18] per nanoparticle. For CA-grafted Tb2O3 nanoparticles, the r1 value was tiny because of 4f electron orbital motion contribution to the magnetic moment of Tb3+ (7F6) [52], while the small r2 value was because of the moderate magnetic moment of densely packed Tb3+ ions in nanoparticles. These properties suggest their potential as T2 MRI contrast agents at high MR fields (>3 T), where r2 is expected to increase [53]. By comparison, superparamagnetic iron oxide nanoparticles, such as Ferumoxytol (r1 = 13–25 s−1mM−1 and r2 = 150–350 s−1mM−1) [54], are well-known T2 MRI contrast agents owing to their high r2 values and large r2/r1 ratios. However, paramagnetic nanoparticles such as Ln2O3 (Ln = Dy, Tb, and Ho) nanoparticles are considered potential T2 MRI contrast agents at high MR fields owing to their r2 values which increase with MR field strength and tiny r1 values (<0.5 s−1mM−1) [53], enabling them to selectively enhance transverse water proton spin relaxations.
As provided in Table 3, CA-grafted Eu2O3 and Tb2O3 nanoparticles exhibited similarly low r1 values but lower r2 values than their D-glucuronic acid-grafted counterparts [22,53]. In contrast, CA-grafted Gd2O3 nanoparticles showed a higher r1 but a lower r2 value than those grafted with D-glucuronic acid [22]. These differences could be attributed to slight variations in particle size and ligands.
R1 and R2 map images help evaluate the potential of a material as an MRI contrast agent. CA-grafted Gd2O3 nanoparticles exhibited strong dose-dependent contrast enhancements in both map images, indicating their suitability to function as T1 or T2 MRI contrast agents, especially as T1 MRI contrast agents, owing to an r2/r1 ratio close to one (Figure 7b) [51]. In contrast, CA-grafted Eu2O3 nanoparticles displayed negligible dose-dependent contrast enhancements in the R1 and R2 map images, reflecting their minimal r1 and r2 values and unsuitability as contrast agents. CA-grafted Tb2O3 nanoparticles exhibited modest dose-dependent R2 contrast enhancements owing to a small r2 value, suggesting potential as T2 MRI contrast agents at high MR fields (>3 T) [53].

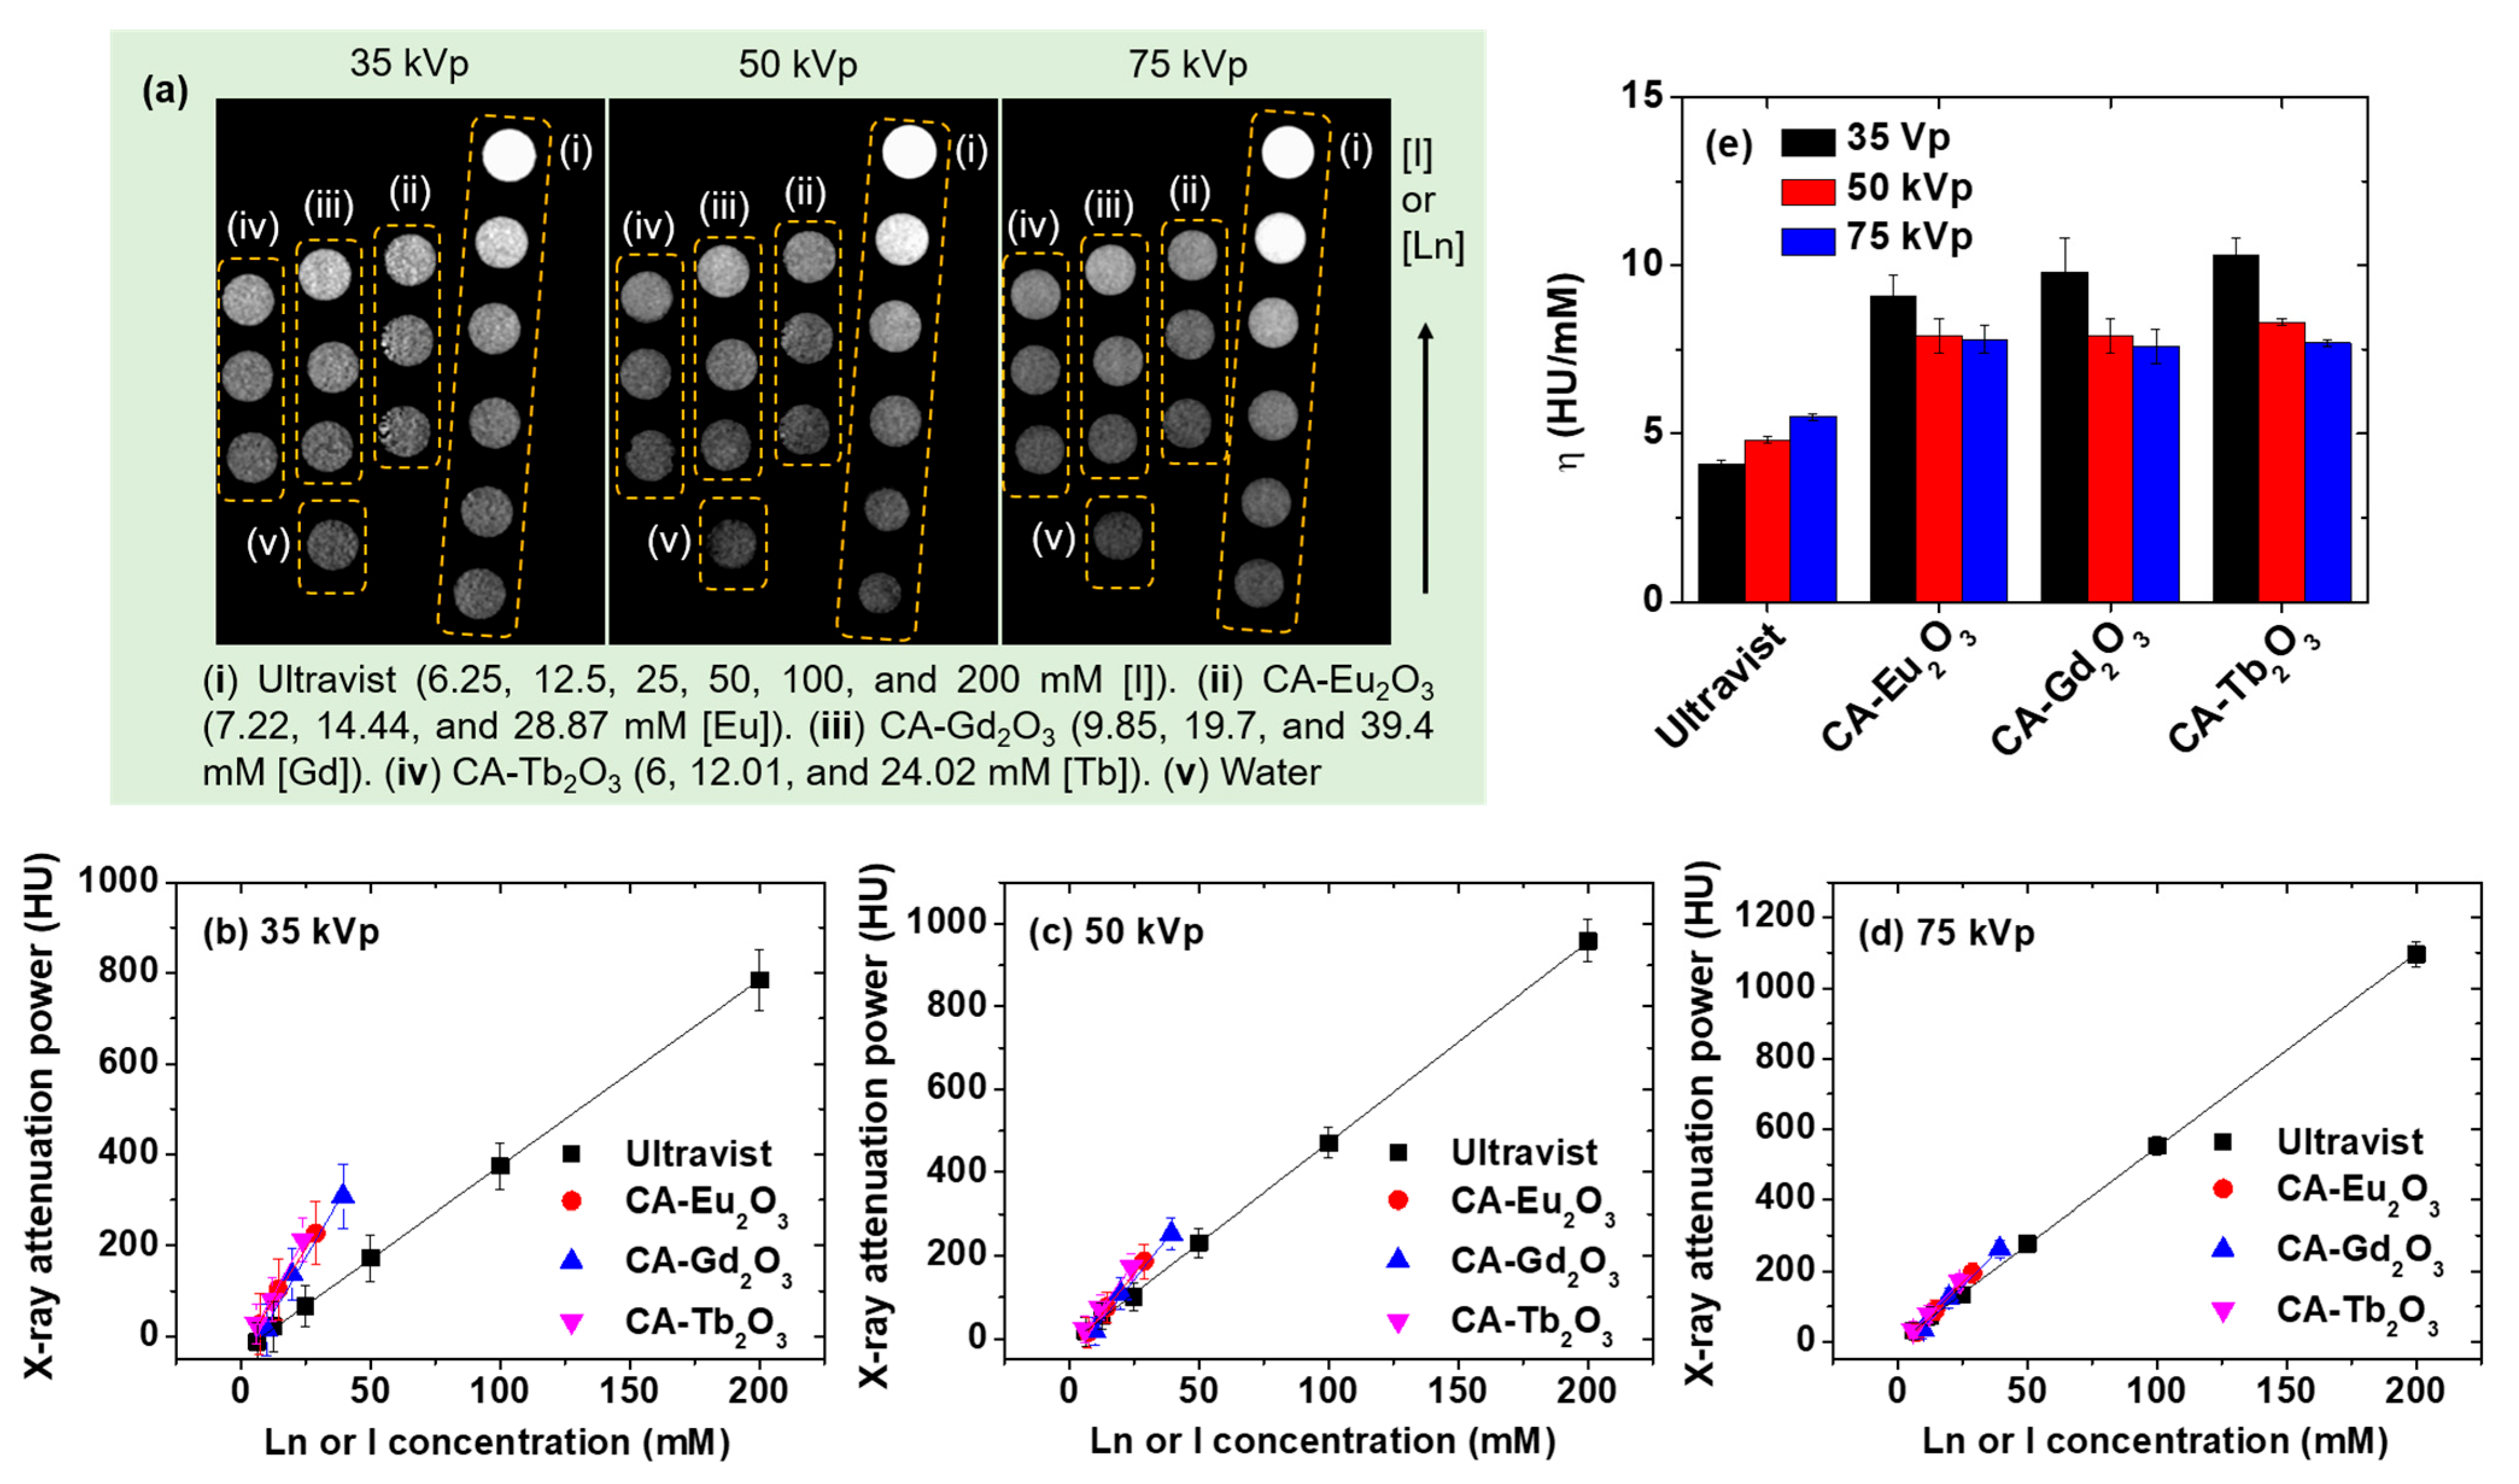
2.6. X-Ray Imaging Properties

The X-ray phantom images were acquired at 35, 50, and 75 kVp to estimate X-ray attenuation of CA-grafted Ln2O3 (Ln = Eu, Gd, and Tb) nanoparticles dispersed in water (Figure 8a). Phantom images of water and Ultravist served as references. Plots of X-ray attenuation power in Hounsfield units (HU) extracted from the phantom images showed that all samples exhibited higher X-ray attenuation than Ultravist at equivalent atomic concentrations (Figure 8b‒d). This is because of the higher atomic numbers of Eu, Gd, and Tb (63, 64, and 65) compared to iodine (53) [56].
The X-ray attenuation efficiency (η) of the nanoparticles as well as Ultravist was estimated from the slopes (Figure 8b‒d) and listed in Table 3. At all X-ray voltages, the nanoparticles exhibited η values approximately two times higher than those of Ultravist (Table 3, Figure 8e), highlighting their potential as CT contrast agents. Additionally, compared to other studies [55], the η values of CA-grafted Ln2O3 nanoparticles were higher or similar compared to PAA-grafted Gd2O3 nanoparticles and PAA-grafted GdF3 nanoplates, confirming their potential as CT contrast agents.

3. Materials and Methods

3.1. Chemicals

GdCl3∙6H2O (99.9%), Tb(NO3)3∙5H2O (99.9%), Eu(NO3)3∙5H2O (99.9%), oleylamine (70%), sodium citrate tribasic dihydrate (CA) (99.0%), and dialysis tube [molecular weight cut-off (MWCO) = ~500 amu] were purchased from Sigma-Aldrich (St. Louis, MO, USA). Ethanol (>99%), hexane (>99%), and acetone (99%) were purchased from Duksan, Ansan, Republic of Korea. All chemicals were used as received. Triple-distilled water was used for washing the nanoparticles and preparing aqueous suspensions.

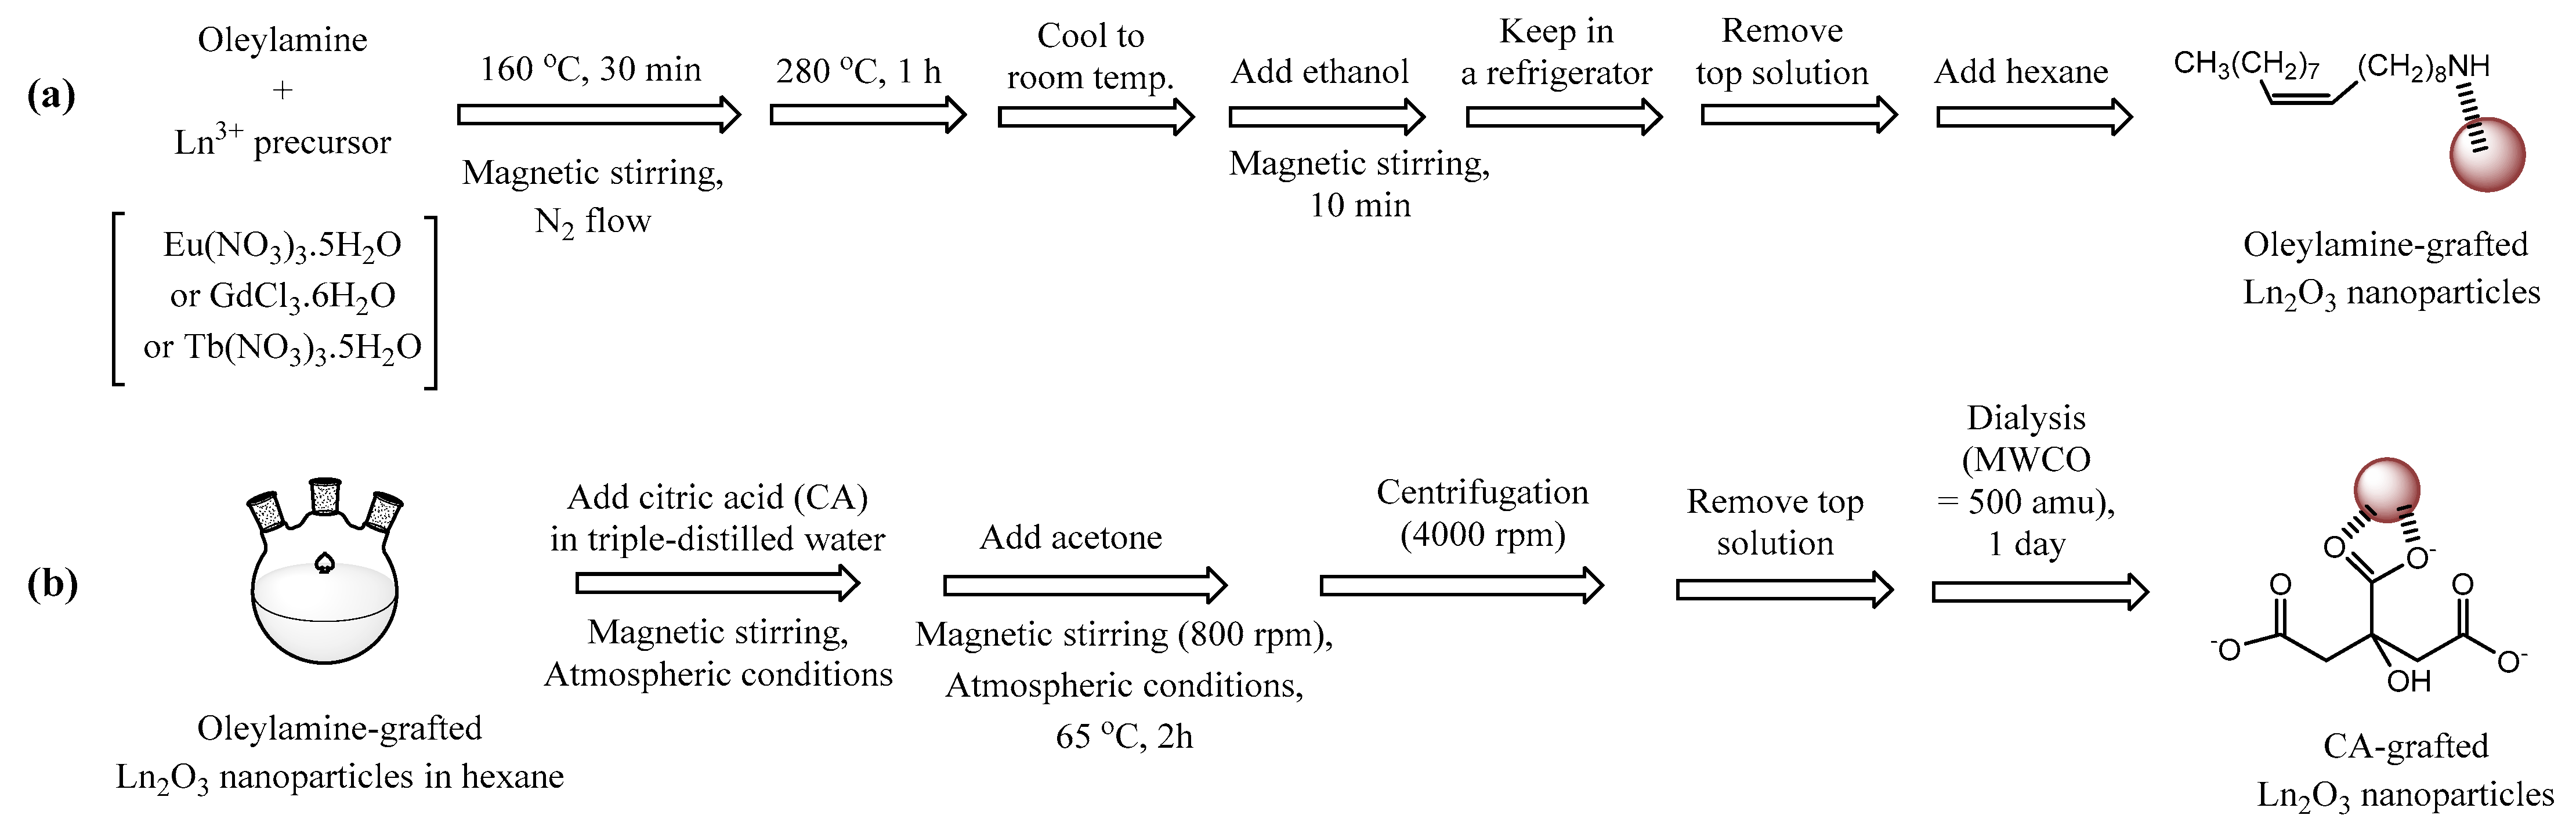
3.2. Synthesis of Ln2O3 (Ln = Eu, Gd, and Tb) Nanoparticles via Thermal Decomposition

Ln2O3 (Ln = Eu, Gd, and Tb) nanoparticles were synthesized by thermal decomposition (Figure 9a). About 2 mmol of Ln3+ precursors [Eu(NO3)3∙5H2O, GdCl3∙6H2O, or Tb(NO3)3∙5H2O] were added to 20 mL of oleylamine in a three-neck round bottom flask under N2 flow and heated to 160 °C for 30 min with magnetic stirring to remove water. Subsequently, the solution was heated to 280 °C at 5 °C/min and maintained for 1 h. After cooling to room temperature, the mixture was transferred to a 500 mL beaker, stirred with 400 mL of ethanol for 10 min, and preserved in a refrigerator until the oleylamine-grafted Ln2O3 nanoparticles settled. The supernatant was removed, and the nanoparticles were redispersed in 20 mL hexane.

3.3. Synthesis of CA-Grafted Ln2O3 Nanoparticles via Ligand Exchange

CA (5 mmol) was dissolved in 40 mL of triple-distilled water in a three-neck round bottom flask and mixed with 20 mL oleylamine-grafted Ln2O3 nanoparticles dispersed in hexane (Figure 9b). Thereafter, 15 mL of acetone was added and magnetically stirred at 800 rpm and 65 °C for 12 h under atmospheric conditions. After centrifugation, the aqueous phase (water and CA-grafted Ln2O3 nanoparticles) was separated by removing top organic phase (hexane and oleylamine). The product was dialyzed (MWCO = ~500 amu) against 1 L of triple-distilled water for 1 day to remove free CA, hexane, and acetone.

3.4. General Characterization

Nanoparticle diameter was measured by HRTEM (Titan G2 ChemiSTEM CS Probe; FEI, Hillsboro, OR, USA) at 200 kV after dispersing nanoparticles on a carbon film supported by a 200-mesh copper grid (Pelco No. 160, Ted Pella Inc., Redding, CA, USA). Elemental analysis was performed using an EDS instrument (Quantax Nano, Bruker, Berlin, Germany) inside the HRTEM.
Ln (Eu, Gd, or Tb) concentrations in aqueous nanoparticle suspensions were determined by inductively coupled plasma-atomic emission spectrometer (IRIS/AP, Thermo Jarrell Ash Co., Waltham, MA, USA).
Hydrodynamic diameter (a) and the zeta potential (ζ) of nanoparticle colloids (0.05 mM [Ln], Ln = Eu, Gd, and Tb) dispersed in aqueous media were measured using a DLS analyzer (Zetasizer Nano ZS, Malvern, UK).
The crystallinity of nanoparticle powder samples was characterized using a multipurpose XRD instrument (X’PERT PRO MRD, Philips, The Netherlands) with unfiltered CuKa (λ = 0.154184 nm) radiation, using a 0.033° scanning step over a 2θ scan range of 15°–100°.
CA attachment to Ln2O3 nanoparticles was analyzed by FT-IR absorption spectroscopy (Galaxy 7020A, Mattson Instrument Inc., Madison, WI, USA) on KBr pelletized powder samples over 400–4000 cm−1.
A TGA instrument (SDT-Q600, TA Instrument, New Castle, DE, USA) was used to measure CA grafting by heating powder samples from room temperature to 900 °C under air flow. After TGA, the remaining samples were subjected to XRD analysis for identification. The average CA content (wt.%) was estimated from mass loss after water and air desorption below ~105 °C, with the Ln2O3 amount estimated from the remaining mass.

3.5. MRI Imaging Parameters

T1 and T2 water proton spin relaxation times and R1 and R2 map images of CA-grafted Ln2O3 nanoparticles (Ln = Eu, Gd, and Tb) in aqueous media were measured using a 3.0 T MRI scanner (Magnetom Trio Tim, Siemens, Munich, Bayern, Germany). Aqueous solutions at 1, 0.5, 0.25, 0.125, and 0.0625 mM [Ln] were prepared by diluting the original concentrated samples with triple-distilled water. T1 relaxation was measured via inversion recovery, which varies inversion time (TI) over 35 TI values in the range of 50–1750 ms. T1 relaxation times were obtained by nonlinear least-square fitting of signal intensities at various TI values. T2 relaxation times were measured using the Carr–Purcell–Meiboom–Gill pulse sequence with 34 images acquired at 34 echo times (TE) ranging from 10 to 1900 ms and fitted similarly to mean pixel values. r1 and r2 values were then estimated from the slopes of inverse T1 and T2 versus Ln concentration plots, respectively.

3.6. X-Ray Imaging Parameters

X-ray phantom images of the CA-grafted Ln2O3 nanoparticles (Ln = Eu, Gd, and Tb) dispersed in aqueous media were acquired using a micro-CT scanner (Inveon, Simens Healthcare, Erlangen, Germany). Water and the commercial iodine CT contrast agent Ultravist were also imaged for comparison. X-ray attenuation power (HU) was estimated from these images. Measurement used X-ray source voltages/currents of 35 kVp/500 μA, 50 kVp/500 μA, and 75 kVp/500 μA, with a 170 ms imaging time per frame.

3.7. In Vitro Cellular Cytotoxicity Measurements

The in vitro cytotoxicity of the CA-grafted Ln2O3 nanoparticles (Ln = Eu, Gd, and Tb) was assessed using a CellTiter-Glo Luminescent Cell Viability Assay (Promega, Madison, WI, USA). Intracellular adenosine triphosphate was quantified using a Victor 3 luminometer (Perkin Elmer, Waltham, MA, USA). Hek293 and AML12 cells were seeded separately in 96-well plates and incubated for 24 h (1.5 × 10⁴ cells/well for AML12, 2 × 10⁴ cells/well for Hek293, 500 μL/well, 5% CO2, and 37 °C). Five test solutions (0.01, 0.05, 0.1, 0.2, 0.5 mM Ln, Ln = Eu, Gd, and Tb) were prepared by diluting the original concentrated nanoparticles dispersed in triple-distilled water with sterile phosphate-buffered saline (PBS) solution. Cells were treated with 2 μL aliquots and incubated for 48 h. Cell viability, measured in triplicate, was averaged and normalized to untreated control cells (PBS only, 0.0 mM Ln).

4. Conclusions

We successfully synthesized Ln2O3 nanoparticles (Ln = Eu, Gd, and Tb) via thermal decomposition and grafted them with hydrophilic and biocompatible CA through ligand exchange. The CA-grafted Ln2O3 nanoparticles were ultrasmall (2 nm), monodispersed, exhibited excellent colloidal stability in aqueous media, and had low in vitro cellular toxicity. Notably, the CA-grafted Gd2O3 nanoparticles had an r1 value approximately twice that of commercial Gd-chelates such as Gadovist and an r2/r1 ratio near one, indicating their potential as T1 MRI contrast agents. CA-grafted Tb2O3 nanoparticles exhibited low r1 and moderate r2 values, indicating their potential as T2 MRI contrast agents at high MR fields (>3 T), while CA-grafted Eu2O3 nanoparticles had negligible r1 and r2 values, making them unsuitable for MRI. In addition, all CA-grafted Ln2O3 nanoparticles exhibited η values approximately two times higher than that of the commercial iodine contrast agent Ultravist, indicating their potential as CT contrast agents.

Author Contributions

Conceptualization, S.L., T.T. and S.L.H.; methodology, S.L. and H.Y.; formal analysis, S.L., T.T., D.Z., Y.L., E.M. and X.C.; investigation, S.L., H.L., D.A., J.-u.Y., J.A.P., A.B. and J.K.; writing—original draft preparation, S.L.; writing—review and editing, Y.C. and G.H.L.; funding acquisition, J.K., Y.C. and G.H.L. All authors have read and agreed to the published version of the manuscript.

Funding

This research was funded by the Basic Science Research Program of the National Research Foundation (NRF) funded by the Korea government (Ministry of Science, and Information and Communications Technology: MSIT) (Basic Research Laboratory, No. RS-2024-00406209) and NRF funded by the Ministry of Education (Post-Doc. Growth Type Cooperational Research, No. RS-2024-00459895).

Institutional Review Board Statement

Not applicable.

Informed Consent Statement

Not applicable.

Data Availability Statement

The original contributions presented in this study are included in the article.

Conflicts of Interest

The authors declare no conflicts of interest.

References

  1. Martí-Bonmatí, L.; Sopena, R.; Bartumeus, P.; Sopena, P. Multimodality imaging techniques. Contrast Media Mol. Imaging 2010, 5, 180–189. [Google Scholar] [CrossRef] [PubMed]
  2. Huang, W.Y.; Davis, J.J. Multimodality and nanoparticles in medical imaging. Dalton Trans. 2011, 40, 6087–6103. [Google Scholar] [CrossRef] [PubMed]
  3. Frullano, L.; Meade, T.J. Multimodal MRI contrast agents. J. Biol. Inorg. Chem. 2007, 12, 939–949. [Google Scholar] [CrossRef]
  4. Zheng, J.; Perkins, G.; Kirilova, A.; Allen, C.; Jaffray, D.A. Multimodal contrast agent for combined computed tomography and magnetic resonance imaging applications. Investig. Radiol. 2006, 41, 339–348. [Google Scholar] [CrossRef]
  5. Koole, R.; van Schooneveld, M.M.; Hilhorst, J.; Castermans, K.; Cormode, D.P.; Strijkers, G.J.; Donega, C.M.; Vanmaekelbergh, D.; Griffioen, A.W.; Nicolay, K.; et al. Paramagnetic lipid-coated silica nanoparticles with a fluorescent quantum dot core: A new contrast agent platform for multimodality imaging. Bioconjug. Chem. 2008, 19, 2471–2479. [Google Scholar] [CrossRef] [PubMed]
  6. Song, Y.; Zong, H.; Trivedi, E.R.; Vesper, B.J.; Waters, E.A.; Barrett, A.G.M.; Radosevich, J.A.; Hoffman, B.M.; Meade, T.J. Synthesis and characterization of new porphyrazine-Gd (III) conjugates as multimodal MR contrast agents. Bioconjug. Chem. 2010, 21, 2267–2275. [Google Scholar] [CrossRef]
  7. Zhao, H.Y.; Liu, S.; He, J.; Pan, C.C.; Li, H.; Zhou, Z.Y.; Ding, Y.; Huo, D.; Hu, Y. Synthesis and Application of Strawberry-Like Fe3O4-Au Nanoparticles as CT-MR Dual-Modality Contrast Agents in Accurate Detection of the Progressive Liver Disease. Biomaterials 2015, 51, 194–207. [Google Scholar] [CrossRef]
  8. Blum, A.; Gillet, R.; Rauch, A.; Urbaneja, A.; Biouichi, H.; Dodin, G.; Germain, E.; Lombard, C.; Jaquet, P.; Louis, M.; et al. 3D reconstructions, 4D imaging and postprocessing with CT in musculoskeletal disorders: Past, present and future. Diagn. Interv. Imaging 2020, 101, 693–705. [Google Scholar] [CrossRef]
  9. Schaefer, P.W.; Grant, P.E.; Gonzalez, R.G. Diffusion-weighted MR imaging of the brain. Radiology 2000, 217, 331–345. [Google Scholar] [CrossRef]
  10. Wang, Z.J.; Reddy, G.P.; Gotway, M.B.; Yeh, B.M.; Hetts, S.W.; Higgins, C.B. CT and MR imaging of pericardial disease. RadioGraphics 2003, 23, S167–S180. [Google Scholar] [CrossRef]
  11. Andersson-Engels, S.; Klinteberg, C.; Svanberg, K.; Svanberg, S. In vivo fluorescence imaging for tissue diagnostics. Phys. Med. Biol. 1997, 42, 815. [Google Scholar] [CrossRef] [PubMed]
  12. Wang, G.; Qian, K.; Mei, X. A theranostic nanoplatform: Magneto-gold@fluorescence polymer nanoparticles for tumor targeting T1 & T2-MRI/CT/NIR fluorescence imaging and induction of genuine autophagy mediated chemotherapy. Nanoscale 2018, 10, 10467–10478. [Google Scholar] [CrossRef] [PubMed]
  13. Xue, S.; Wang, Y.; Wang, M.; Zhang, L.; Du, X.; Gu, H.; Zhang, C. Iodinated oil-loaded, fluorescent mesoporous silica-coated iron oxide nanoparticles for magnetic resonance imaging/computed tomography/fluorescence trimodal imaging. Int. J. Nanomed. 2014, 9, 2527. [Google Scholar] [CrossRef]
  14. Zhao, Y.; Hao, X.; Lu, W.; Wang, R.; Shan, X.; Chen, Q.; Sun, G.; Liu, J. Facile preparation of double rare earth-doped carbon dots for MRI/CT/FI multimodal imaging. ACS Appl. Nano Mater. 2018, 1, 2544–2551. [Google Scholar] [CrossRef]
  15. Li, X.; Zhang, X.N.; Li, X.D.; Chang, J. Multimodality imaging in nanomedicine and nanotheranostics. Cancer Biol. Med. 2016, 13, 339. [Google Scholar] [CrossRef]
  16. Bridot, J.L.; Faure, A.C.; Laurent, S.; Riviere, C.; Billotey, C.; Hiba, B.; Janier, M.; Josserand, V.; Coll, J.-L.; Elst, L.V.; et al. Hybrid gadolinium oxide nanoparticles: Multimodal contrast agents for in vivo imaging. J. Am. Chem. Soc. 2007, 129, 5076–5084. [Google Scholar] [CrossRef]
  17. Fang, C.; Zhang, M. Multifunctional magnetic nanoparticles for medical imaging applications. J. Mater. Chem. 2009, 19, 6258–6266. [Google Scholar] [CrossRef]
  18. Greenwood, N.N.; Earnshaw, A. Chemistry of the Elements; Butterworth-Heinemann: New York, NY, USA, 1997; p. 1243. [Google Scholar]
  19. Cotton, F.A.; Wilkinson, G. Advanced Inorganic Chemistry, 4th ed.; A Wiley-Interscience Publication: New York, NY, USA, 1980; p. 984. [Google Scholar]
  20. Longmire, M.; Choyke, P.L.; Kobayashi, H. Clearance properties of nano-sized particles and molecules as imaging agents: Considerations and caveats. Nanomedicine 2008, 3, 703–717. [Google Scholar] [CrossRef]
  21. Choi, H.S.; Liu, W.; Misra, P.; Tanaka, E.; Zimmer, J.P.; Ipe, B.I.; Bawendi, M.G.; Frangioni, J.V. Renal clearance of nanoparticles. Nat. Biotechnol. 2007, 25, 1165–1170. [Google Scholar] [CrossRef]
  22. Kattel, K.; Park, J.Y.; Xu, W.; Kim, H.G.; Lee, E.J.; Bony, B.A.; Heo, W.C.; Lee, J.J.; Jin, S.; Baeck, J.S.; et al. A facile synthesis, in vitro and in vivo MR studies of D-glucuronic acid-coated ultrasmall Ln2O3 (Ln = Eu, Gd, Dy, Ho, and Er) nanoparticles as a new potential MRI contrast agent. ACS Appl. Mater. Interfaces 2011, 3, 3325–3334. [Google Scholar] [CrossRef]
  23. Miao, X.; Xu, W.; Cha, H.; Chang, Y.; Oh, I.T.; Chae, K.S.; Tegafaw, T.; Ho, S.L.; Kim, S.J.; Lee, G.H. Ultrasmall Gd2O3 nanoparticles surface-coated by polyacrylic acid (PAA) and their PAA-size dependent relaxometric properties. Appl. Surf. Sci. 2019, 477, 111–115. [Google Scholar] [CrossRef]
  24. Xu, W.; Bony, B.A.; Kim, C.R.; Baeck, J.S.; Chang, Y.; Bae, J.E.; Chae, K.S.; Kim, T.J.; Lee, G.H. Mixed lanthanide oxide nanoparticles as dual imaging agent in biomedicine. Sci. Rep. 2013, 3, 3210. [Google Scholar] [CrossRef]
  25. Liu, S.; Yue, H.; Ho, S.L.; Kim, S.; Park, J.A.; Tegafaw, T.; Ahmad, M.Y.; Kim, S.; Al Saidi, A.K.A.; Zhao, D.; et al. Enhanced Tumor Imaging Using Glucosamine-Conjugated Polyacrylic Acid-Coated Ultrasmall Gadolinium Oxide Nanoparticles in Magnetic Resonance Imaging. Int. J. Mol. Sci. 2022, 23, 1792. [Google Scholar] [CrossRef]
  26. Ghazanfari, A.; Marasini, S.; Miao, X.; Park, J.A.; Jung, K.H.; Ahmad, M.Y.; Yue, H.; Ho, S.L.; Liu, S.; Jang, Y.J.; et al. Synthesis, characterization, and X-ray attenuation properties of polyacrylic acid-coated ultrasmall heavy metal oxide (Bi2O3, Yb2O3, NaTaO3, Dy2O3, and Gd2O3) nanoparticles as potential CT contrast agents. Colloids Surf. A Physicochem. Eng. Asp. 2019, 576, 73–81. [Google Scholar] [CrossRef]
  27. Ucar, Z.G.P.; Akca, S.; Dogan, T.; Halefoglu, Y.Z.; Kaynar, U.H.; Ayvacikli, M.; Guinea, J.G.; Topaksu, M.; Can, N. Comprehensive study of photoluminescence and cathodoluminescence of Eu and Tb doped Mg2SiO4 prepared via a solid-state reaction technique. Opt. Mater. 2020, 100, 109698. [Google Scholar] [CrossRef]
  28. Chen, F.; Chen, M.; Yang, C.; Liu, J.; Luo, N.; Yang, G.; Chen, D.; Li, L. Terbium-doped gadolinium oxide nanoparticles prepared by laser ablation in liquid for use as a fluorescence and magnetic resonance imaging dual-modal contrast agent. Phys. Chem. Chem. Phys. 2015, 17, 1189–1196. [Google Scholar] [CrossRef] [PubMed]
  29. Jung, J.; Kim, M.A.; Cho, J.H.; Lee, S.J.; Yang, I.; Cho, J.; Kim, S.K.; Lee, C.; Park, J.K. Europium-doped gadolinium sulfide nanoparticles as a dual-mode imaging agent for T1-weighted MR and photoluminescence imaging. Biomaterials 2012, 33, 5865–5874. [Google Scholar] [CrossRef] [PubMed]
  30. Xie, Y.; He, W.; Li, F.; Perera, T.S.H.; Gan, L.; Han, Y.; Wang, X.; Li, S.; Dai, H. Luminescence enhanced Eu3+/Gd3+ co-doped hydroxyapatite nanocrystals as imaging agents in vitro and in vivo. ACS Appl. Mater. Interfaces 2016, 8, 10212–10219. [Google Scholar] [CrossRef]
  31. Mondal, S.; Nguyen, V.T.; Park, S.; Choi, J.; Vo, T.M.T.; Shin, J.H.; Kang, Y.H.; Oh, J. Rare earth element doped hydroxyapatite luminescent bioceramics contrast agent for enhanced biomedical imaging and therapeutic applications. Ceram. Int. 2020, 46, 29249–29260. [Google Scholar] [CrossRef]
  32. Chaudhary, S.; Kumar, S.; Umar, A.; Singh, J.; Rawat, M.; Mehta, S.K. Europium-doped gadolinium oxide nanoparticles: A potential photoluminescencent probe for highly selective and sensitive detection of Fe3+ and Cr3+ ions. Sens. Actuators B Chem. 2017, 243, 579–588. [Google Scholar] [CrossRef]
  33. Fu, R.; Ou, M.; Yang, C.; Hu, Y.; Yin, H. Enhanced luminescence and paramagnetic properties of Gd2O3: Tb3+ multifunctional nanoparticles by K+/Co2+ doping. J. Lumin. 2020, 222, 117154. [Google Scholar] [CrossRef]
  34. Zhang, Y.; Li, B.; Ma, H.; Zhang, L.; Jiang, H.; Song, H.; Zhang, L.; Luo, Y. A nanoscaled lanthanide metal–organic framework as a colorimetric fluorescence sensor for dipicolinic acid based on modulating energy transfer. J. Mater. Chem. C 2016, 4, 7294–7301. [Google Scholar] [CrossRef]
  35. Binnemans, K.; Van Herck, K.; Görller-Walrand, C. Influence of dipicolinate ligands on the spectroscopic properties of europium (III) in solution. Chem. Phys. Lett. 1997, 266, 297–302. [Google Scholar] [CrossRef]
  36. Carr, R.; Evans, N.H.; Parker, D. Lanthanide complexes as chiral probes exploiting circularly polarized luminescence. Chem. Soc. Rev. 2012, 41, 7673–7686. [Google Scholar] [CrossRef]
  37. Bera, D.; Qian, L.; Tseng, T.-K.; Holloway, P.H. Quantum Dots and Their Multimodal Applications: A Review. Materials 2010, 3, 2260–2345. [Google Scholar] [CrossRef]
  38. Nikam, A.V.; Prasad, B.L.V.; Kulkarni, A.A. Wet chemical synthesis of metal oxide nanoparticles: A review. CrystEngComm 2018, 20, 5091–5107. [Google Scholar] [CrossRef]
  39. Pan, Y.; Xie, X.; Huang, Q.; Gao, C.; Wang, Y.; Wang, L.; Yang, B.; Su, H.; Huang, L.; Huang, W. Inherently Eu2+/Eu3+ codoped Sc2O3 nanoparticles as high-performance nanothermometers. Adv. Mater. 2018, 30, 1705256. [Google Scholar] [CrossRef]
  40. Söderlind, F.; Pedersen, H.; Petoral, R.M.; Käll, P.-O.; Uvdal, K. Synthesis and characterization of Gd2O3 nanocrystals functionalized by organic acids. J. Colloid Interface Sci. 2005, 288, 140–148. [Google Scholar] [CrossRef]
  41. X’Pert High Score, PANalytical Software; Version 1.1; Card No.Gd2O3: 00-012-0797, Tb2O3: 01-074-1986, Eu2O3: 03-065-3182; Malvern Panalytical: Almelo, The Netherlands, 1998.
  42. Ranoszek-Soliwoda, K.; Tomaszewska, E.; Socha, E.; Krzyczmonik, P.; Ignaczak, A.; Orlowski, P.; Krzyzowska, M.; Celichowski, G.; Grobelny, J. The role of tannic acid and sodium citrate in the synthesis of silver nanoparticles. J. Nanopart. Res. 2017, 19, 273. [Google Scholar] [CrossRef]
  43. Zhang, L.; Liu, P.; Wang, T. Preparation of superparamagnetic polyaniline hybrid hollow microspheres in oil/water emulsion with magnetic nanoparticles as cosurfactant. Chem. Eng. J. 2011, 171, 711–716. [Google Scholar] [CrossRef]
  44. Abboud, M.; Youssef, S.; Podlecki, J.; Habchi, R.; Germanos, G.; Foucaran, A. Superparamagnetic Fe3O4 nanoparticles, synthesis and surface modification. Mater. Sci. Semicond. Process 2015, 39, 641–648. [Google Scholar] [CrossRef]
  45. Pearson, R.G. Hard and Soft Acids and Bases. J. Am. Chem. Soc. 1963, 85, 3533–3539. [Google Scholar] [CrossRef]
  46. Pearson, R.G. Hard and soft acids and bases, HSAB, Part I: Fundamental principles. J. Chem. Educ. 1968, 45, 581–587. [Google Scholar] [CrossRef]
  47. Pearson, R.G. Hard and soft acids and bases, HSAB, Part II: Underlying theories. J. Chem. Educ. 1968, 45, 643–648. [Google Scholar] [CrossRef]
  48. Deacon, G.B.; Phillips, R.J. Relationships between the carbon-oxygen stretching frequencies of carboxylato complexes and the type of carboxylate coordination. Coord. Chem. Rev. 1980, 33, 227–250. [Google Scholar] [CrossRef]
  49. Corbierre, M.K.; Cameron, N.S.; Lennox, R.B. Polymer-stabilized gold nanoparticles with high grafting densities. Langmuir 2004, 20, 2867–2873. [Google Scholar] [CrossRef]
  50. Haynes, W.M.; Lide, D.R.; Bruno, T.J. CRC Handbook of Chemistry and Physics, 96th ed.; CRC Press: Boca Raton, FL, USA, 2015–2016; pp. 4–64. [Google Scholar] [CrossRef]
  51. Wahsner, J.; Gale, E.M.; Rodríguez-Rodríguez, A.; Caravan, P. Chemistry of MRI contrast agents: Current challenges and new frontiers. Chem. Rev. 2018, 119, 957–1057. [Google Scholar] [CrossRef]
  52. Lauffer, R.B. Paramagnetic metal complexes as water proton relaxation agents for NMR imaging: Theory and design. Chem. Rev. 1987, 87, 901–927. [Google Scholar] [CrossRef]
  53. Marasini, S.; Yue, H.; Ho, S.L.; Jung, K.-H.; Park, J.A.; Cha, H.; Ghazanfari, A.; Ahmad, M.Y.; Liu, S.; Jang, Y.J.; et al. D-Glucuronic Acid-Coated Ultrasmall Paramagnetic Ln2O3 (Ln = Tb, Dy, and Ho) Nanoparticles: Magnetic Properties, Water Proton Relaxivities, and Fluorescence Properties. Eur. J. Inorg. Chem. 2019, 34, 3832–3839. [Google Scholar] [CrossRef]
  54. LaConte, L.E.W.; Nitin, N.; Zurkiya, O.; Caruntu, D.; O’Conner, C.J.; Hu, X.; Bao, G. Coating Thickness of Magnetic Iron Oxide Nanoparticles Affects R2 Relaxivity. J. Magn. Reson. Imaging 2007, 26, 1634–1641. [Google Scholar] [CrossRef]
  55. Ahmad, M.Y.; Liu, S.; Tegafaw, T.; Saidi, A.K.A.A.; Zhao, D.; Liu, Y.; Nam, S.-W.; Chang, Y.; Lee, G.H. Heavy Metal-Based Nanoparticles as High-Performance X-ray Computed Tomography Contrast Agents. Pharmaceuticals 2023, 16, 1463. [Google Scholar] [CrossRef] [PubMed]
  56. Hubbell, J.H.; Seltzer, S.M. Tables of X-Ray Mass Attenuation Coefficients and Mass Energy-Absorption Coefficients from 1 keV to 20 MeV for Elements Z = 1 to 92 and 48 Additional Substances of Dosimetric Interest. Gaithersburg, NIST, USA. 1996. Available online: http://www.nist.gov/pml/data/xraycoef (accessed on 5 June 2025).
Figure 1. HRTEM images of CA-grafted Ln2O3 nanoparticles: Ln = (a-i,a-ii) Eu, (b-i,b-ii) Gd, and (c-i,c-ii) Tb, shown at 2 and 10 nm scales. Arrows indicate CA-grafted Ln2O3 nanoparticles.
Molecules 30 02519 g001
Figure 2. (a) Log-normal function fits of particle diameter distributions for CA-grafted Ln2O3 nanoparticles used to determine davg. EDS spectra of CA-grafted Ln2O3 nanoparticles: Ln = (b) Eu, (c) Gd, and (d) Tb.
Molecules 30 02519 g002
Figure 3. (a) Photographs of CA-grafted Ln2O3 nanoparticles (Ln = Eu, Gd, and Tb) dispersed in aqueous media. (b) Log-normal function fits to DLS data. (c) Zeta potential plots. (d) Tyndall effects confirming nanoparticle colloidal dispersion in aqueous media; arrows indicate laser scattering by the nanoparticles.
Molecules 30 02519 g003
Figure 4. XRD patterns of CA-grafted Ln2O3 nanoparticles (Ln = Eu, Gd, and Tb) before (as-prepared) and after TGA. After TGA, all peaks corresponded to cubic Eu2O3, Gd2O3, and Tb2O3 (hkl) indices, with only the strong peaks explicitly indexed.
Molecules 30 02519 g004
Figure 5. (a) FT-IR absorption spectra of CA and CA-grafted Ln2O3 nanoparticles (Ln = Eu, Gd, and Tb). Subscripts AS and SS indicate asymmetric and symmetric stretching, respectively. (b) TGA curves of CA-grafted Ln2O3 nanoparticles (Ln = Eu, Gd, and Tb). (c) Grafting structure of CA on Ln2O3 nanoparticle surfaces (Ln = Eu, Gd, and Tb). TGA data indicate that 40–70 CA molecules were grafter per nanoparticle (Table 1).
Molecules 30 02519 g005
Figure 6. In vitro cell viability of AML12 and Hek293 cells after incubation with CA-grafted Ln2O3 nanoparticles: Ln = (a) Eu, (b) Gd, and (c) Tb.
Molecules 30 02519 g006
Figure 7. (a) Plots of 1/T1 and 1/T2 versus Ln concentration (Ln = Eu, Gd, and Tb) at H = 3.0 T. The slopes represent r1 and r2 values, respectively. (b) R1 and R2 map images as a function of Ln concentration.
Molecules 30 02519 g007
Figure 8. (a) Phantom images of CA-grafted Ln2O3 (Ln = Eu, Gd, and Tb) nanoparticles, Ultravist, and water at three X-ray voltages. Plots of X-ray attenuation versus atomic concentration [I] or [Ln] at (b) 35, (c) 50, and (d) 75 kVp. (e) Plots of X-ray attenuation efficiencies (η).
Molecules 30 02519 g008
Figure 9. (a) Thermal decomposition synthesis of oleylamine-grafted Ln2O3 nanoparticles and (b) ligand exchange of oleylamine with CA to obtain CA-grafted Ln2O3 nanoparticles (Ln = Eu, Gd, and Tb).
Molecules 30 02519 g009
Table 1. Physicochemical properties of CA-grafted Ln2O3 nanoparticles (Ln = Eu, Gd, and Tb).
Nanoparticledavg (nm)aavg (nm)ζ (mV)Surface-Grafting Amount
P a (wt%)σ b (nm−2)NNP c
Eu2O32.1 ± 0.126.4 ± 1.0−16.7 ± 0.441.44.158
Gd2O31.9 ± 0.123.7 ± 1.0−15.9 ± 0.243.33.944
Tb2O32.1 ± 0.127.7 ± 1.0−11.0 ± 0.343.84.969
a Average amount of CA molecules grafting a nanoparticle (in wt%). b Grafting density, i.e., average number of CA molecules grafting a nanoparticle unit surface area. c Average number of CA molecules grafting a nanoparticle.
Table 2. Summary of observed FT-IR absorption frequencies (cm−1).
Vibration aCACA-Eu2O3CA-Gd2O3CA-Tb2O3
(COO) AS1582155615601556
(COO) SS1388138413891384
(CH2) AS2966~2966~2966~2966
(CH2) SS2922292229222922
(H2O) AS3446~3318~3318~3318
(H2O) SS~3257
a The subscripts, AS and SS indicate asymmetric stretching and symmetric stretching, respectively.
Table 3. r1, r2, and η values of CA-grafted Ln2O3 nanoparticles (Ln = Eu, Gd, and Tb) compared with those from other studies.
Materialdavg
(nm)
r1
(s−1mM−1)
r2
(s−1mM−1)
η (HU/mM)Ref.
35 kVp50 kVp75 kVp
CA-Eu2O32.10.02 ± 0.010.11 ± 0.019.1 ± 0.67.9 ± 0.27.8 ± 0.4This study
CA-Gd2O31.99.04 ± 0.5310.33 ± 0.149.8 ± 1.07.9 ± 0.57.6 ± 0.5This study
CA-Tb2O32.10.22 ± 0.030.71 ± 0.0910.3 ± 0.58.3 ± 0.17.7 ± 0.1This study
D-glucuronic acid-Eu2O32.00.0063.82---[22]
D-glucuronic acid-Gd2O32.44.2527.11---[22]
D-glucuronic acid-Tb2O32.0<1.07.68---[53]
PAA 1-Gd2O31.9--5.9 (70 kVp)[55]
PAA 1-GdF3 nanoplate10.6 × 7.0 × 4.2 2--~7.9 (60 kVp)[55]
Ultravist---4.1 ± 0.14.8 ± 0.15.5 ± 0.1This study
Gadovist-4.4 ± 0.14.7 ± 0.1---[51]
1 PAA = polyacrylic acid (Mw = ~1800 amu). 2 Nanoplate size = diameter × length × thickness.
Disclaimer/Publisher’s Note: The statements, opinions and data contained in all publications are solely those of the individual author(s) and contributor(s) and not of MDPI and/or the editor(s). MDPI and/or the editor(s) disclaim responsibility for any injury to people or property resulting from any ideas, methods, instructions or products referred to in the content.

