Article

Optimized Solar-Simulated Photocatalysis of Congo Red Dye Using TiO2: Toward a Sustainable Water Treatment Approach

1
Faculty of Mechanical Engineering and Naval Architecture, University of Zagreb, 10000 Zagreb, Croatia
2
The Department of Branch Tactics, Croatian Military Academy “Dr. Franjo Tuđman”, 10000 Zagreb, Croatia
*
Author to whom correspondence should be addressed.
Molecules 2025, 30(11), 2388; https://doi.org/10.3390/molecules30112388
Submission received: 22 April 2025 / Revised: 27 May 2025 / Accepted: 27 May 2025 / Published: 29 May 2025
(This article belongs to the Special Issue Heterogeneous Catalysis for Sustainability and Carbon-Neutrality)

Abstract

:
This study investigates a sustainable approach to the photocatalytic degradation of Congo red (CR) dye using titanium dioxide (TiO2) under simulated solar radiation, with a specific focus on the UV-A component of the radiation. The aim was to optimize reaction conditions to maximize dye removal efficiency while promoting environmentally friendly wastewater treatment practices. A central composite design (CCD) was implemented, and results were analyzed using analysis of variance (ANOVA). The key factors examined included TiO2 concentration, UV-A radiation intensity, CR dye concentration, and suspension depth. The optimal conditions determined were 222.37 mg/L TiO2, 20 W/m2 UV-A irradiation, 25 µmol/L CR dye concentration, and a suspension depth of 29 mm. Under these conditions, decolorization was achieved with the lowest absorbance (0.367 at 498 nm) and total organic carbon (0.805 mg/L) values, indicating effective dye degradation. The findings confirm that TiO2-assisted photocatalysis is a green and promising method for wastewater treatment. The potential use of natural solar radiation could reduce operational costs, making the process more sustainable. However, challenges such as photocatalyst recovery, aggregation, and the impact of the real wastewater matrices need further investigation.

1. Introduction

Dyes are known for their coloring effects and, unfortunately, their toxicity. Azo dyes, which contain azo aromatic groups, are widely used in industry and pose a significant environmental hazard due to their persistence and harmful effects on living organisms [1,2]. Therefore, it is very important to remove or degrade them from wastewater before releasing it into the environment. Congo red (CR) is a typical example of a synthetic anionic azo dye that finds application in the rubber, plastic, textile, paper, printing, and dyeing industries [3].
The toxicity of dyes is often associated with their mutagenic, carcinogenic, and teratogenic properties [4]. CR exhibits cytotoxic (genotoxic, hemotoxic, and neurotoxic), carcinogenic, and mutagenic effects, posing serious health risks, including potentially fatal outcomes at high concentrations.
CR affects the eyes, skin, and respiratory and reproductive systems. While CR itself is not always harmful, its reduction to aromatic amines increases its toxic effects. Benzidine, a toxic metabolite of CR, is a known bladder carcinogen that can cause allergic reactions and inhibit enzymatic activity by binding covalently to cellular macromolecules [1,5,6].
The lethal dose low (LDLo) refers to the smallest amount of a toxic substance that causes death in test animals under controlled conditions. This dosage is typically expressed in milligrams per kilogram of body weight and varies depending on the species studied. The substance can enter the body through ingestion, inhalation, or intravenous administration. The LDLo value of CR for humans is 143 mg/kg, indicating its toxicity. The harmful effects of azo dyes, including their genotoxic and cytotoxic properties, are also evident in aquatic plant life. When released into water, these dyes reduce light penetration, disrupting photosynthesis and negatively impacting the ecosystem [1,7].
Aquatic flora constitutes a main source of protein for the human diet. Thus, the consumption of aquatic animals known to have bioaccumulated CR can induce sicknesses like hypertension, fever, and cramps. Previous studies have assessed the toxicity of CR on the photosynthetic metabolism and growth of green algae, e.g., Chlorella vulgaris. Findings revealed that Chlorella vulgaris experienced a reduced rate of development, photosynthetic activity, and respiration [3].
Azo dyes exhibit significant resistance to biodegradation processes [6], making their removal or degradation crucial for environmental protection. The methods for removing azo dyes can be categorized into three main groups: (a) physical methods, such as adsorption, nanofiltration, ion exchange, and flocculation; (b) chemical methods, including H2O2-UV radiation, NaClO, O3, and others; and (c) biological degradation, encompassing both aerobic and anaerobic processes [8,9,10,11,12]. Despite their potential, biodegradation processes are often hindered by relatively low degradation efficiency [13].
Advanced oxidation processes (AOPs) are considered highly effective for wastewater treatment, as they enable the thorough degradation of contaminants without generating harmful by-products. These processes are driven by hydroxyl radicals (OH), which can oxidize a wide spectrum of organic contaminants in a highly efficient and non-selective manner. Among AOPs, solar photocatalytic oxidation with semiconductor materials like titanium dioxide (TiO2) has garnered significant interest due to its promising performance [14,15,16,17].
While solar radiation alone does not provide sufficient energy for efficient dye degradation, its combination with a heterogeneous photocatalyst such as TiO2 greatly improves the degradation process. TiO2 absorbs UV radiation (wavelengths < 400 nm), which triggers electron excitation and leads to the formation of hydroxyl radicals, capable of breaking down organic pollutants [18,19,20]. Utilizing natural solar radiation to activate TiO2 also offers cost advantages over artificial UV sources, making it a more economically sustainable approach for wastewater treatment. In this study, we employed an artificial, lab-scale, solar-like lamp to evaluate the most suitable TiO2 crystalline structure and dosage for effective CR degradation.
The photocatalytic degradation efficiency and total organic carbon (TOC) removal were optimized using the Design-Expert 13.0. software. A central composite design (CCD) in the design of experiments was applied, extending the first-order model with additional measurement points at central and axial positions for enhanced model accuracy [21,22,23,24].
The primary objective of this research was to develop a predictive model, using the design of experiments methodology, that accurately describes the CR degradation process and optimizes key reaction parameters, including TiO2 concentration, UV-A irradiation intensity, CR dye concentration, and suspension depth. Optimization of photocatalysis is a crucial step to reach sustainable wastewater treatment using this AOP process [25,26]. The study’s novelty stems from its detailed, systematic optimization of the degradation process under simulated solar radiation, accounting for less commonly explored but practically crucial parameters such as suspension depth, thereby yielding directly applicable solutions for sustainable wastewater treatment. Through a systematic analysis of these factors, we aim to improve process efficiency while reducing the necessity for further experimental trials. In future work, we aim to employ advanced TiO2-based materials in this type of experiment, including those that (a) facilitate separation from suspensions, such as magnetic hybrid particles [18]; (b) incorporate modified nanocrystalline structures and dopants to enhance photocatalytic efficiency [27]; (c) are hybridized with graphitic carbon to achieve higher degradation rates of organic pollutants [28]; and (d) utilize various mixtures of anatase and rutile TiO2 to exploit their synergistic effects in degrading organic pollutants in water [29], among other possibilities. Furthermore, to address the challenge of photocatalyst recovery after the degradation process, particular attention should be given to the application of photocatalytic films, whose fixed configuration eliminates the need for post-treatment separation.

2. Results and Discussion

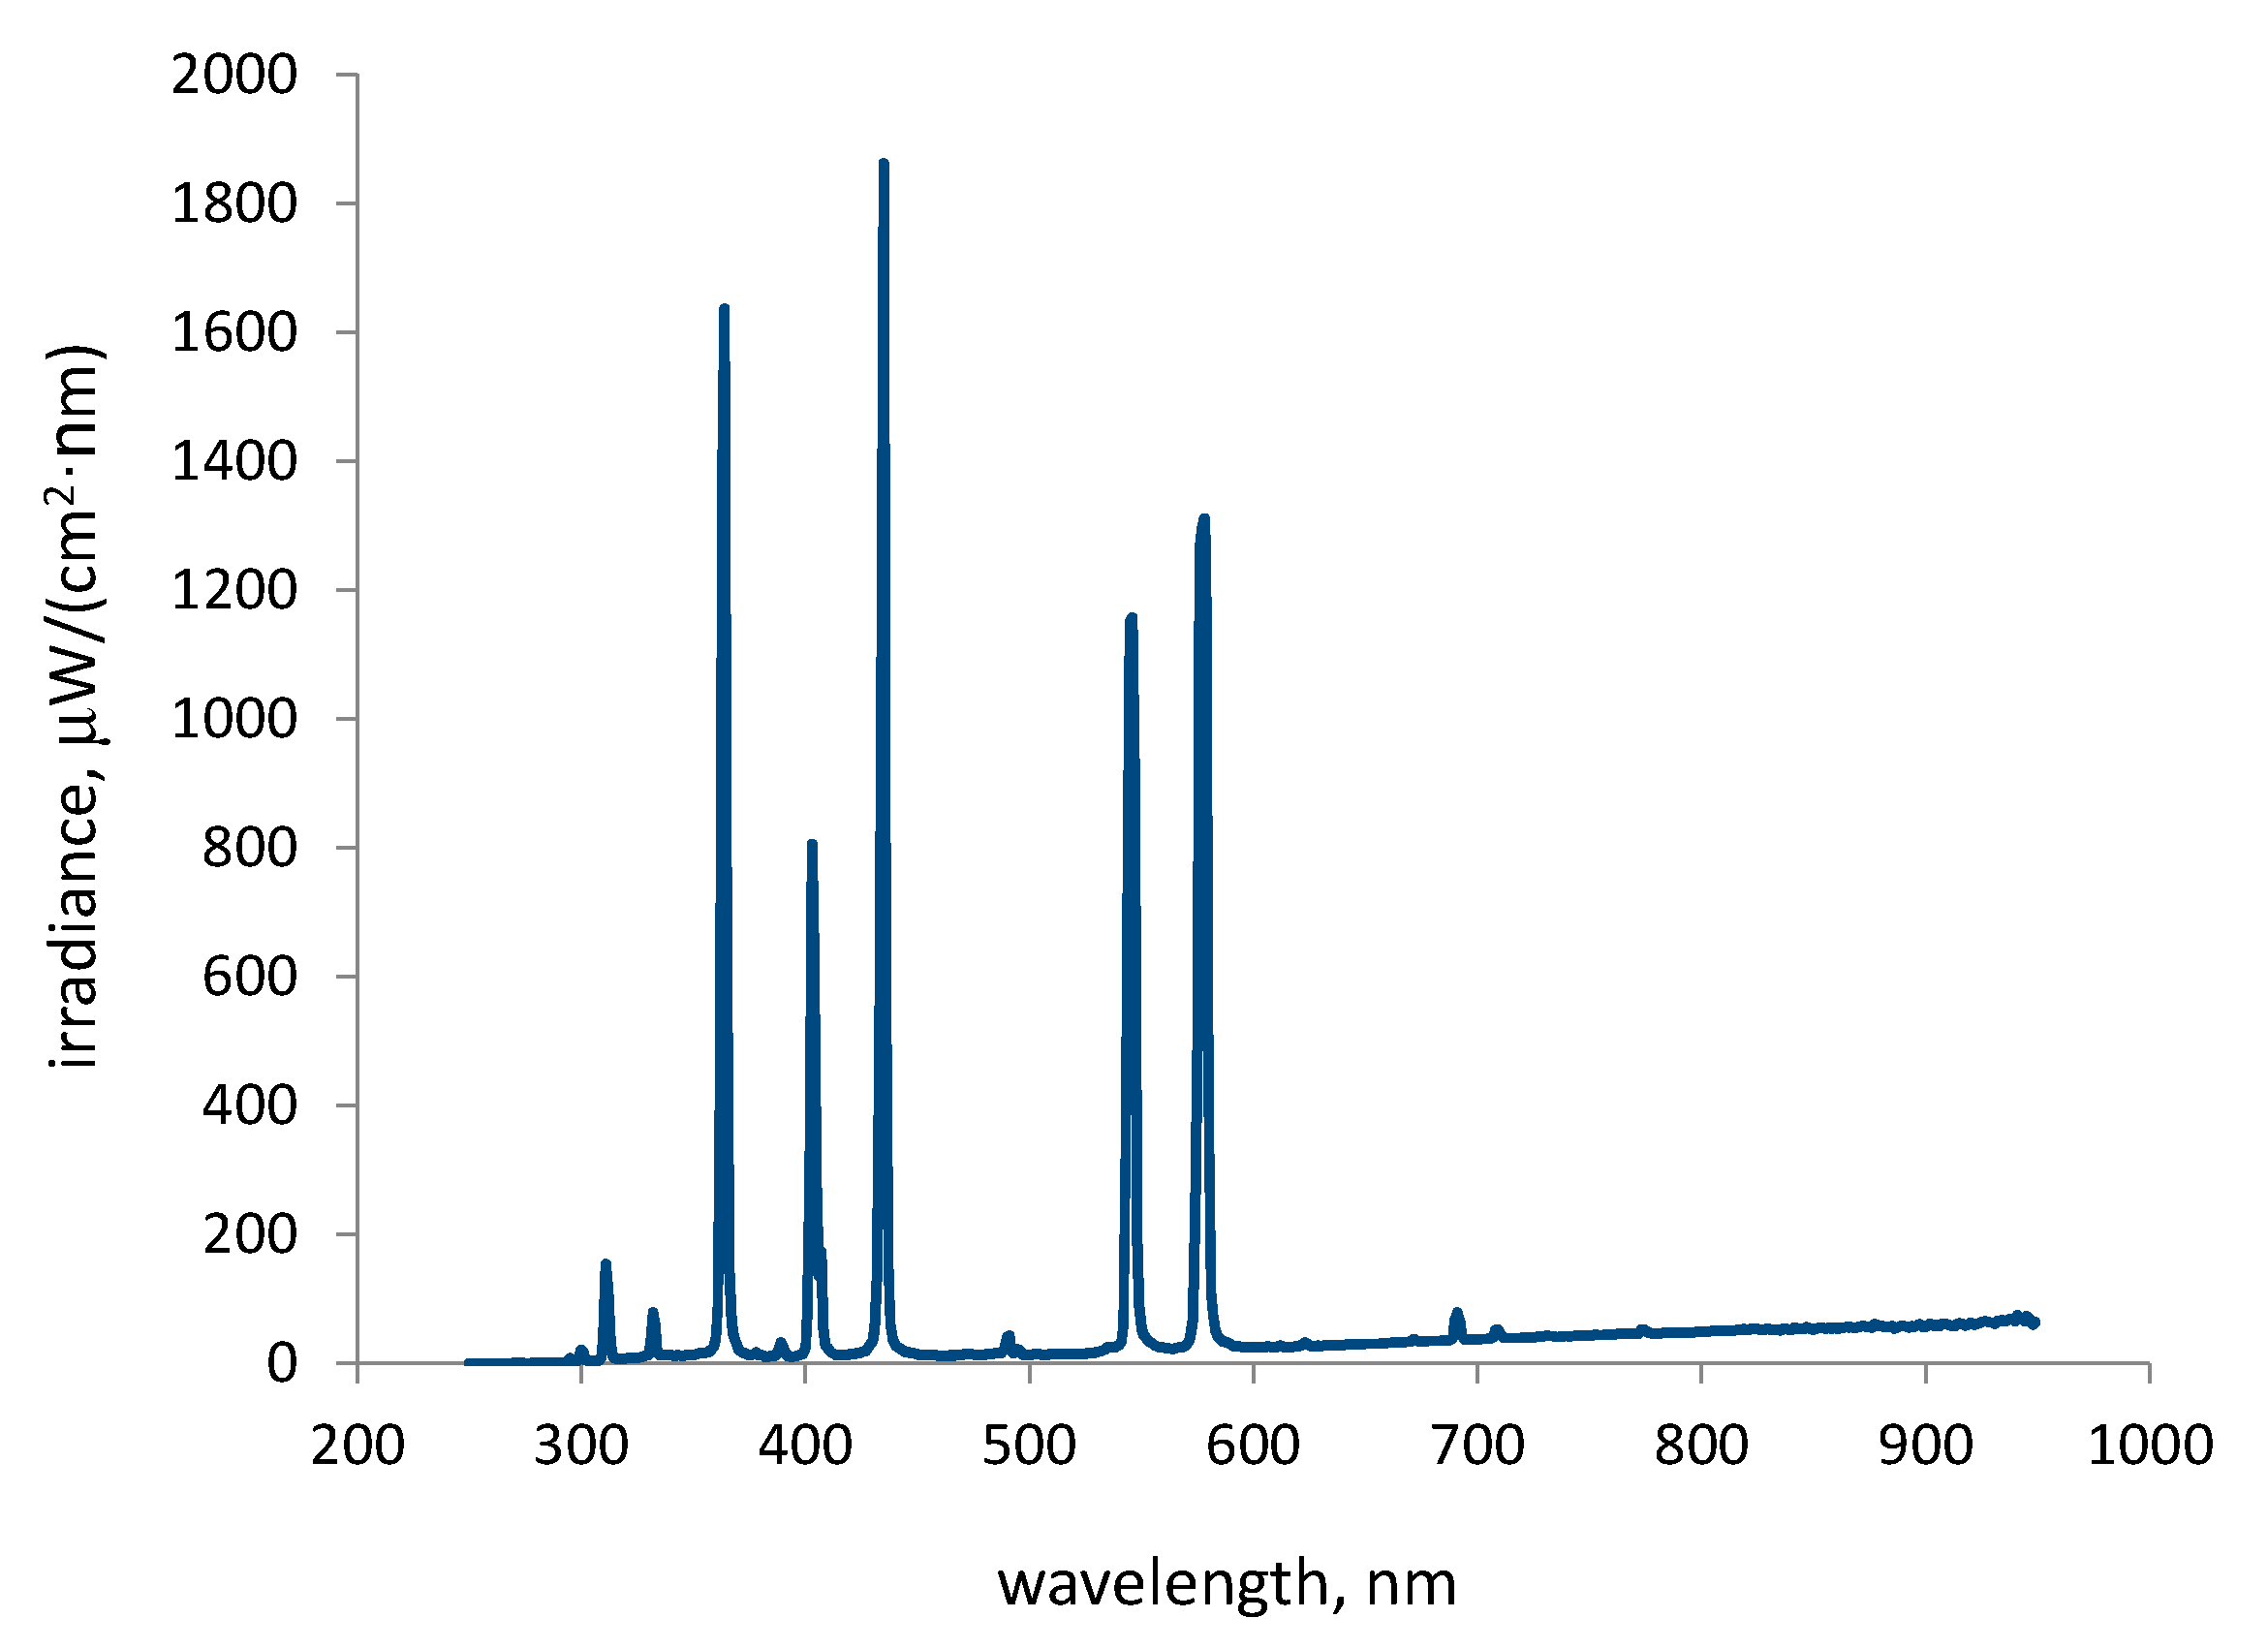
2.1. Irradiation Spectrum

The irradiation spectrum of the solar-like lamp at the distance from the top of the reactor of 20 cm is shown in Figure 1, and the measured and calculated values for radiation in the most relevant spectral ranges are presented in Table 1.
As can be seen in Table 1, the chosen distance between the lamp and the solution surface in the reactor ensured the UV-A irradiance (which is important for activation of the photocatalyst) around two times higher than usually expected UV-A irradiance from the natural sunlight measured in the city of Zagreb in the time interval 10 a.m.–3 p.m. during summer months [30]. The higher irradiance was used with the intention to accelerate the degradation reactions of CR in aqueous solution, thereby enabling a faster optimization of the influential parameters.
Global radiation of the solar-like lamp was, at the distance of 20 cm, 1345.02 W/m2.

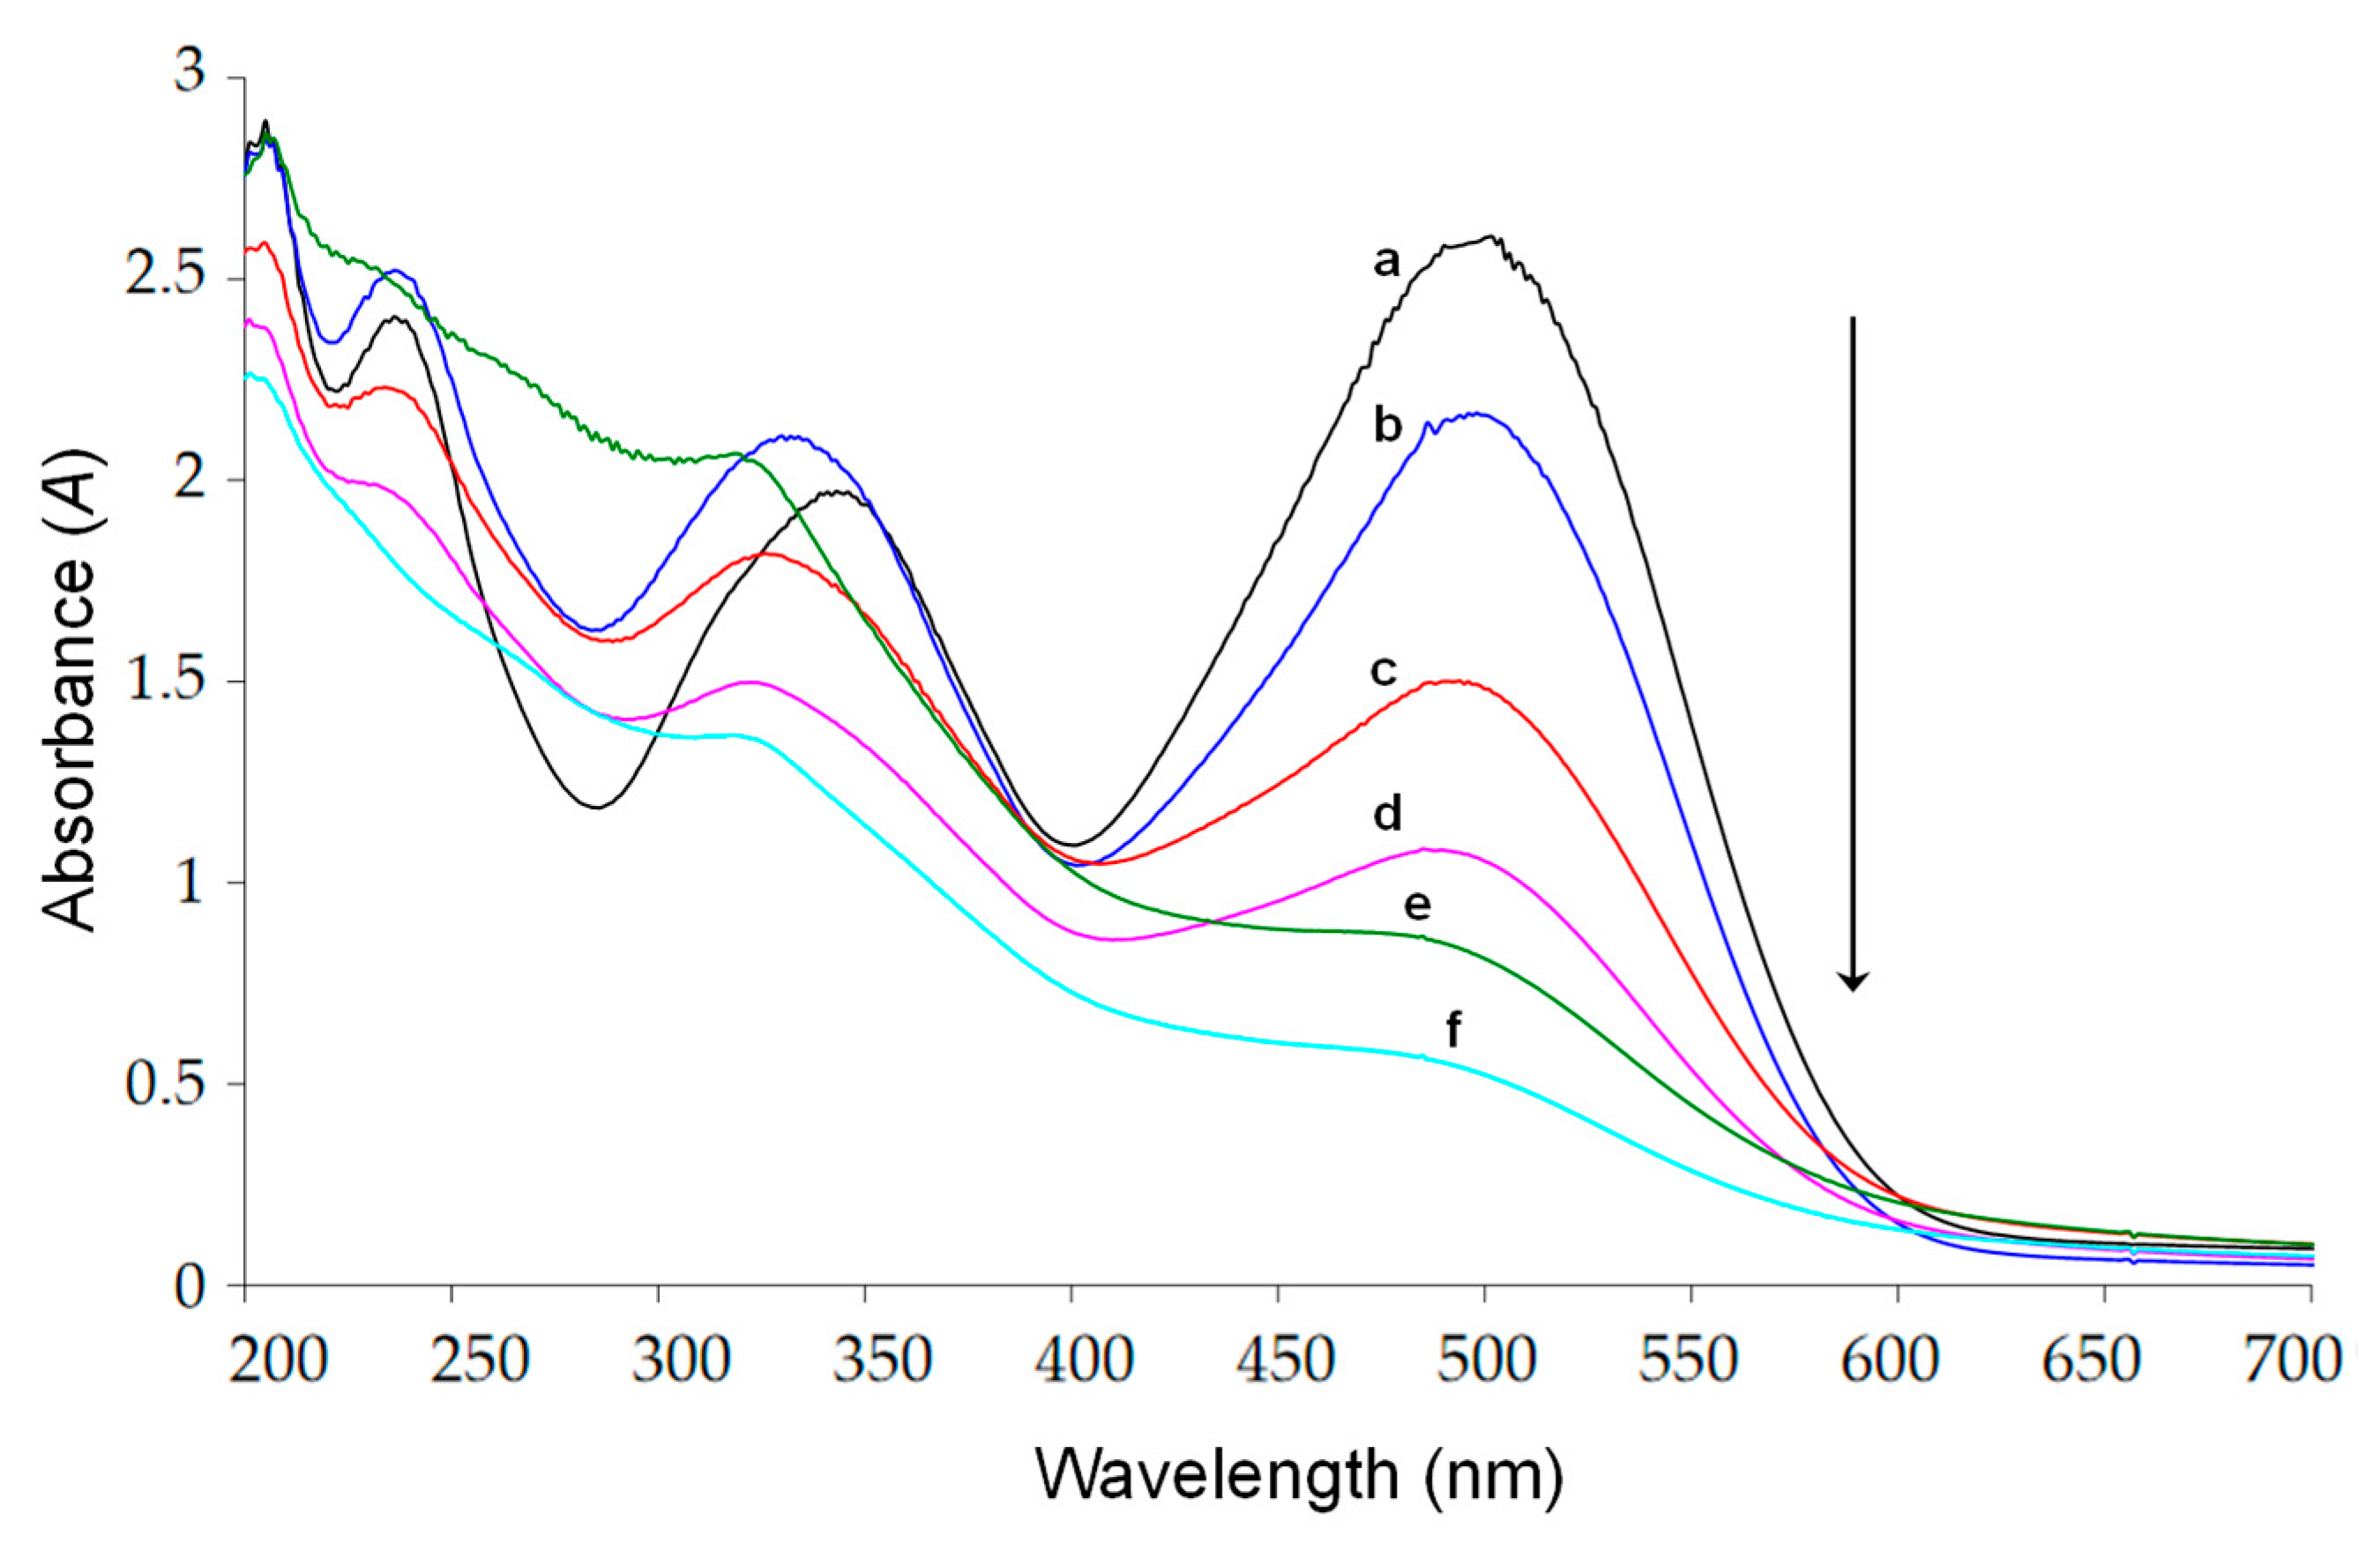
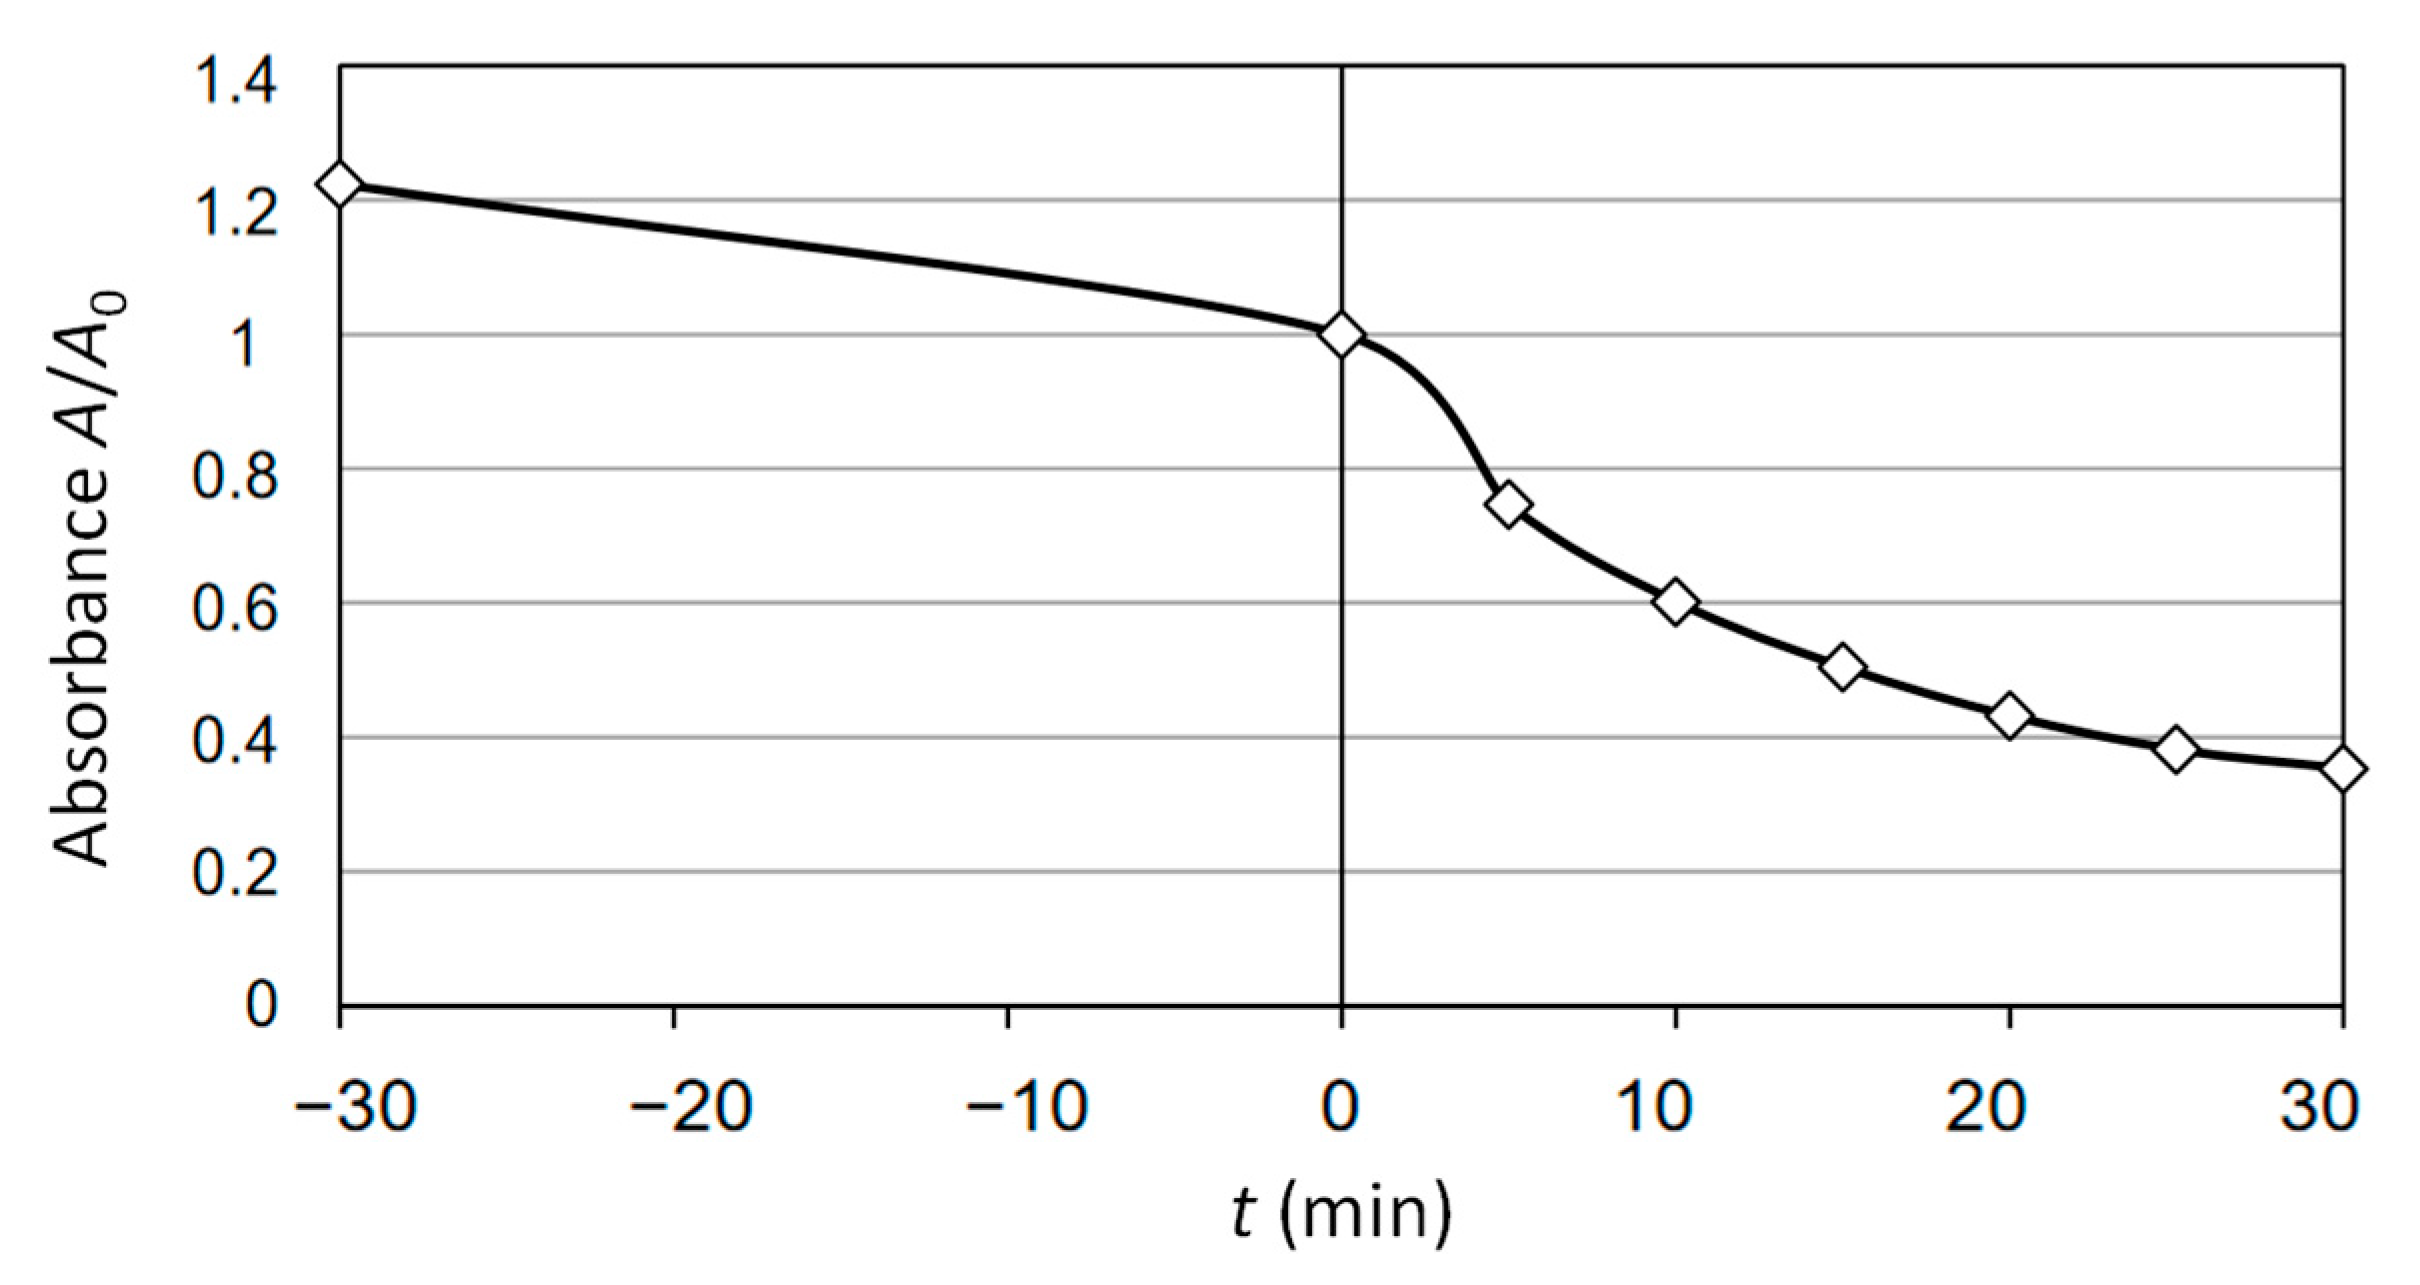
2.2. Absorbance and TOC

The results of absorbance and TOC for each run are presented in Table 2, and the UV-VIS spectrum of the CR solution is in Figure 2. To ensure the most accurate representation of the responses (analytic results), they are presented as the ratio of the final (f) to the initial (0) value according to fractions for absorbance (A) and TOC:
A f A 0 ,   T O C f T O C 0 .
An additional test was conducted to evaluate the influence of reducing the suspension volume by comparing two experiments: one using 70 mL and the other 100 mL of suspension in the reactor. The results showed negligible differences, leading to the conclusion that the effect of volume reduction during sampling is also negligible.
As presented in Table 2, the absorbance parameter A exhibits more pronounced changes within the first 30 min compared to TOC. This can be attributed to the fact that absorbance measurements capture structural transformations of the parent compound (degradation), whereas TOC reflects only the extent of complete mineralization—specifically, the portion of the organic compound that has been fully oxidized and released as CO2 from the solution (total removal from water).

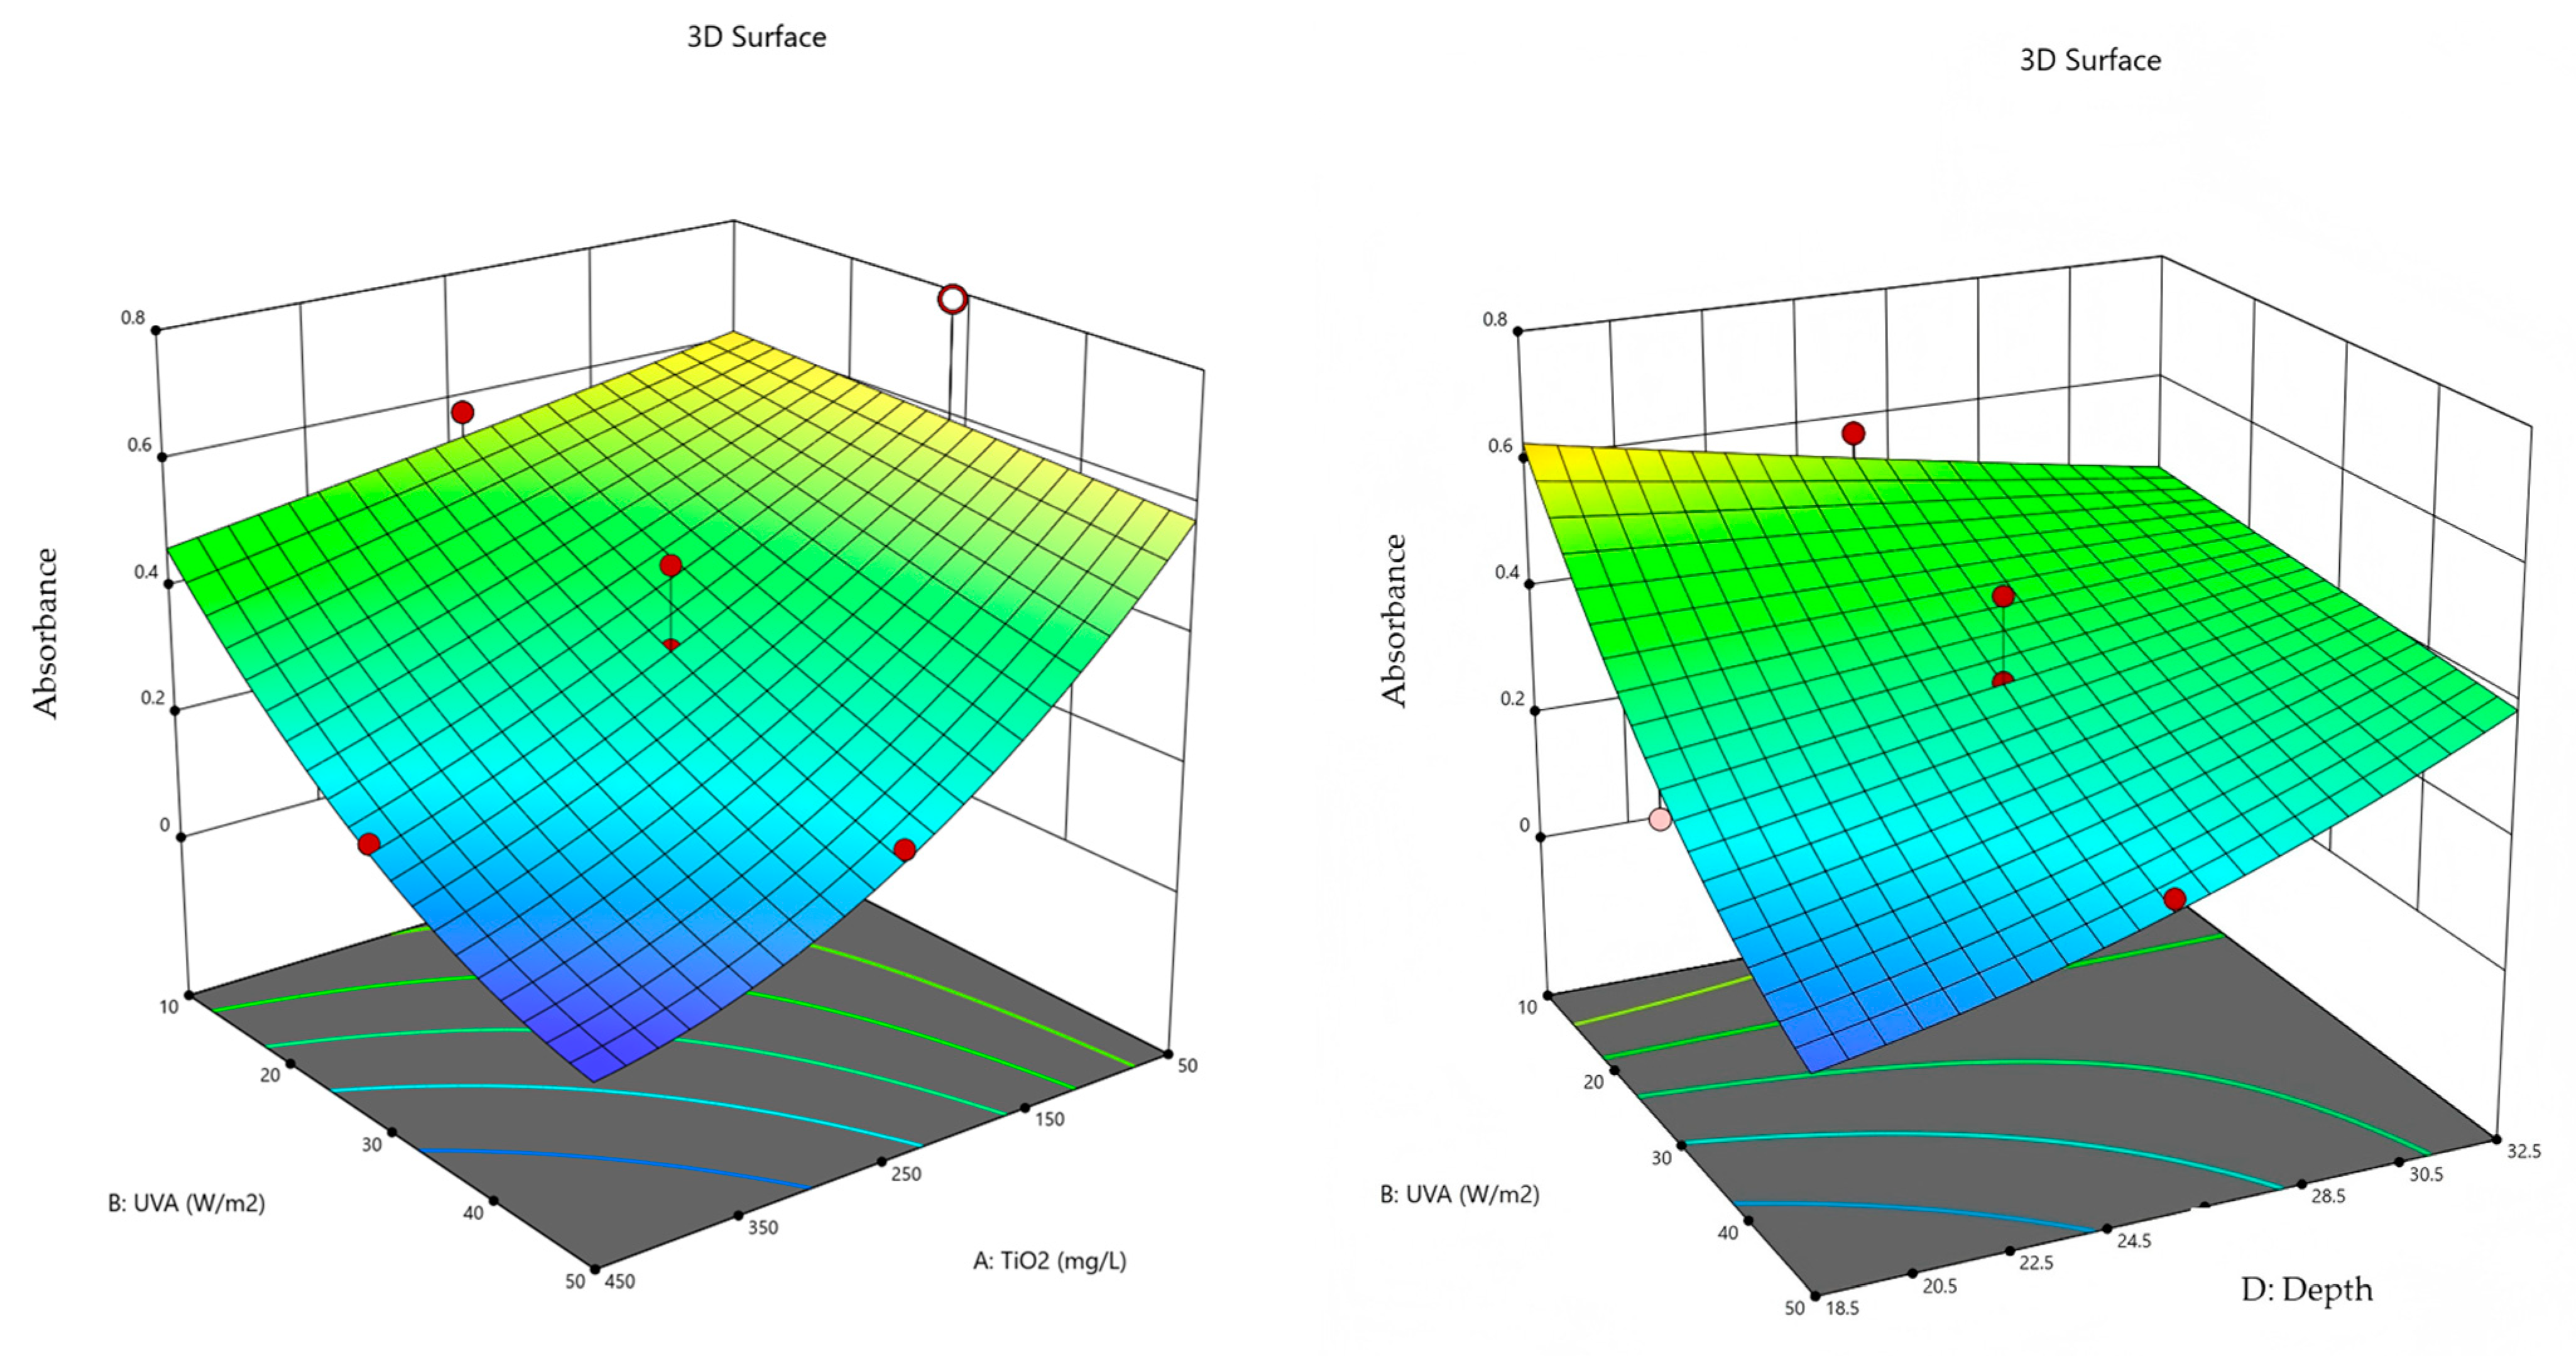
2.3. Results of ANOVA 2FI Model

The results of the analysis of variance (ANOVA) presented in Table 3 provide insights into the statistical significance model.
The F-test value of 34.74 indicates that the model is statistically significant, with less than a 0.01% probability that this high value occurs due to random noise. Furthermore, all variables with a p-value lower than 0.0500 are considered statistically significant. The significant variables are A (TiO2 concentration), B (UV-A intensity), C (CR concentration), D (suspension depth), and the interaction AB (TiO2 × UV-A). Other variables with p-values greater than 0.1000 are not statistically significant; however, they contribute to the model’s hierarchy and are therefore retained.
The F-test value of 10.22 in Table 4 indicates that the model is statistically significant, with less than a 0.01% probability that this high value could be caused by noise. The variables A, B, C, AD, BD, CD, and C2 are statistically significant.
The regression equation for absorbance is:
Absorbance = 0.80541 + 8.750738 × 10⁻⁵ × A − 0.02202 × B + 0.01426 × C − 0.01763 × D − 3.45184 × 10⁻⁵ × AB + 0.00091 × BD
while the regression equation for TOC is:
TOC = 2.36159 + 0.00259 × A − 0.03570 × B − 0.05031 × C − 0.03820 × D − 0.00014 × AD + 0.00133 × BD + 0.00114 × CD + 0.00041 × C2

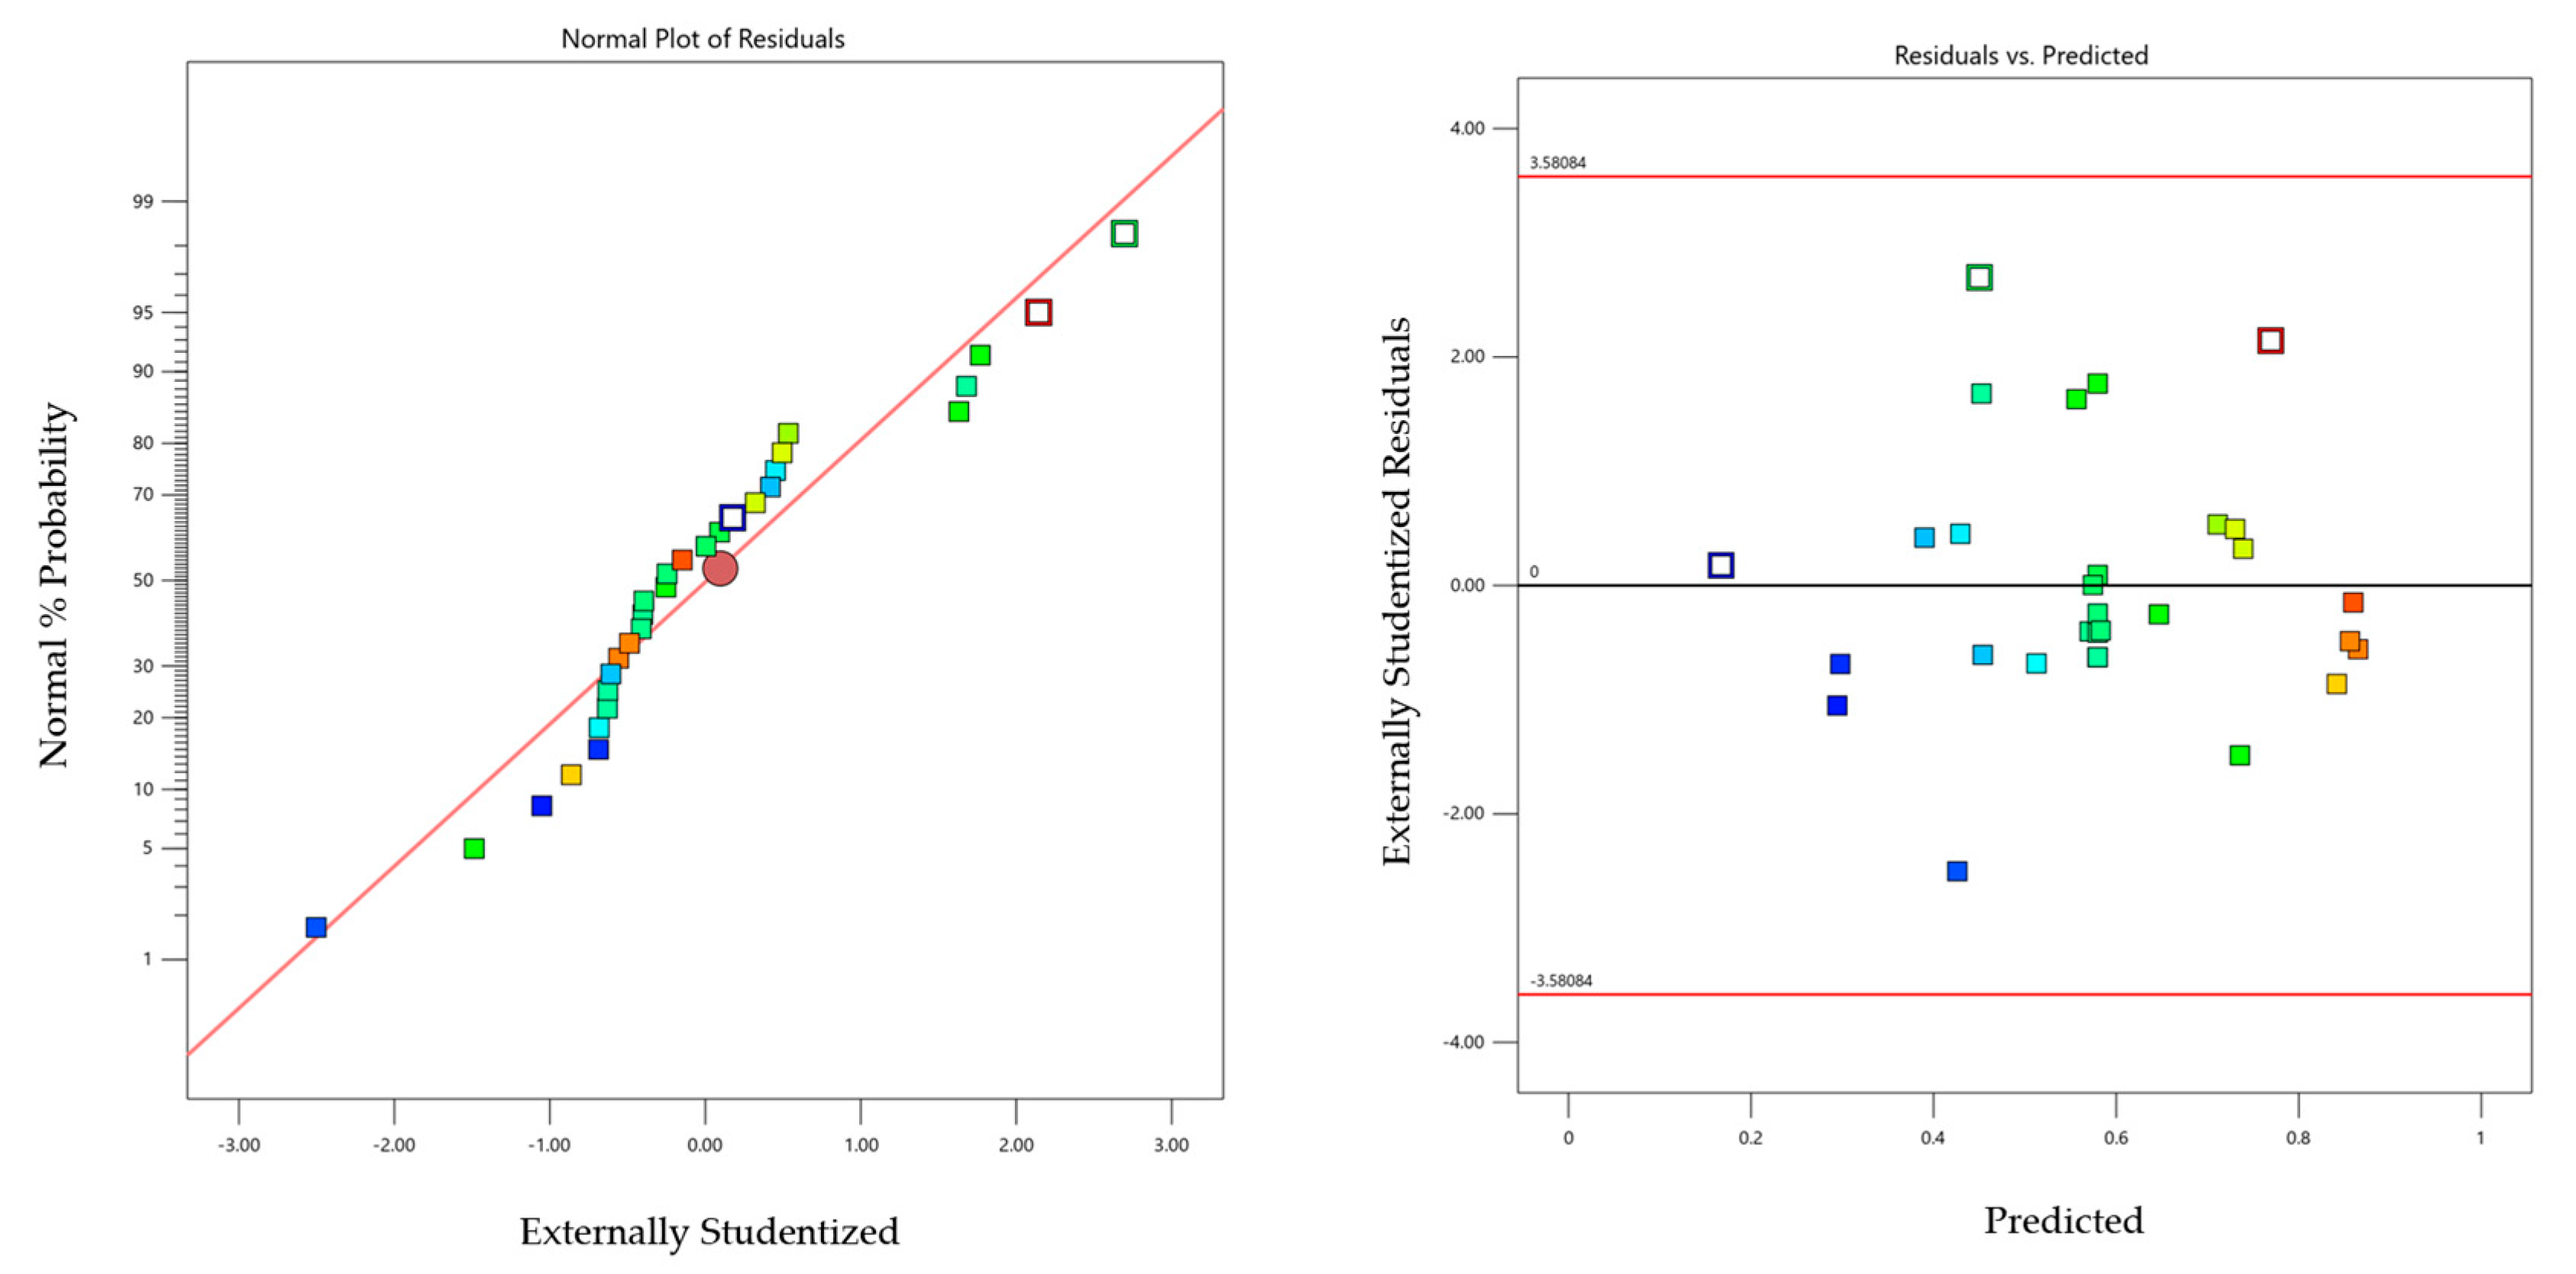
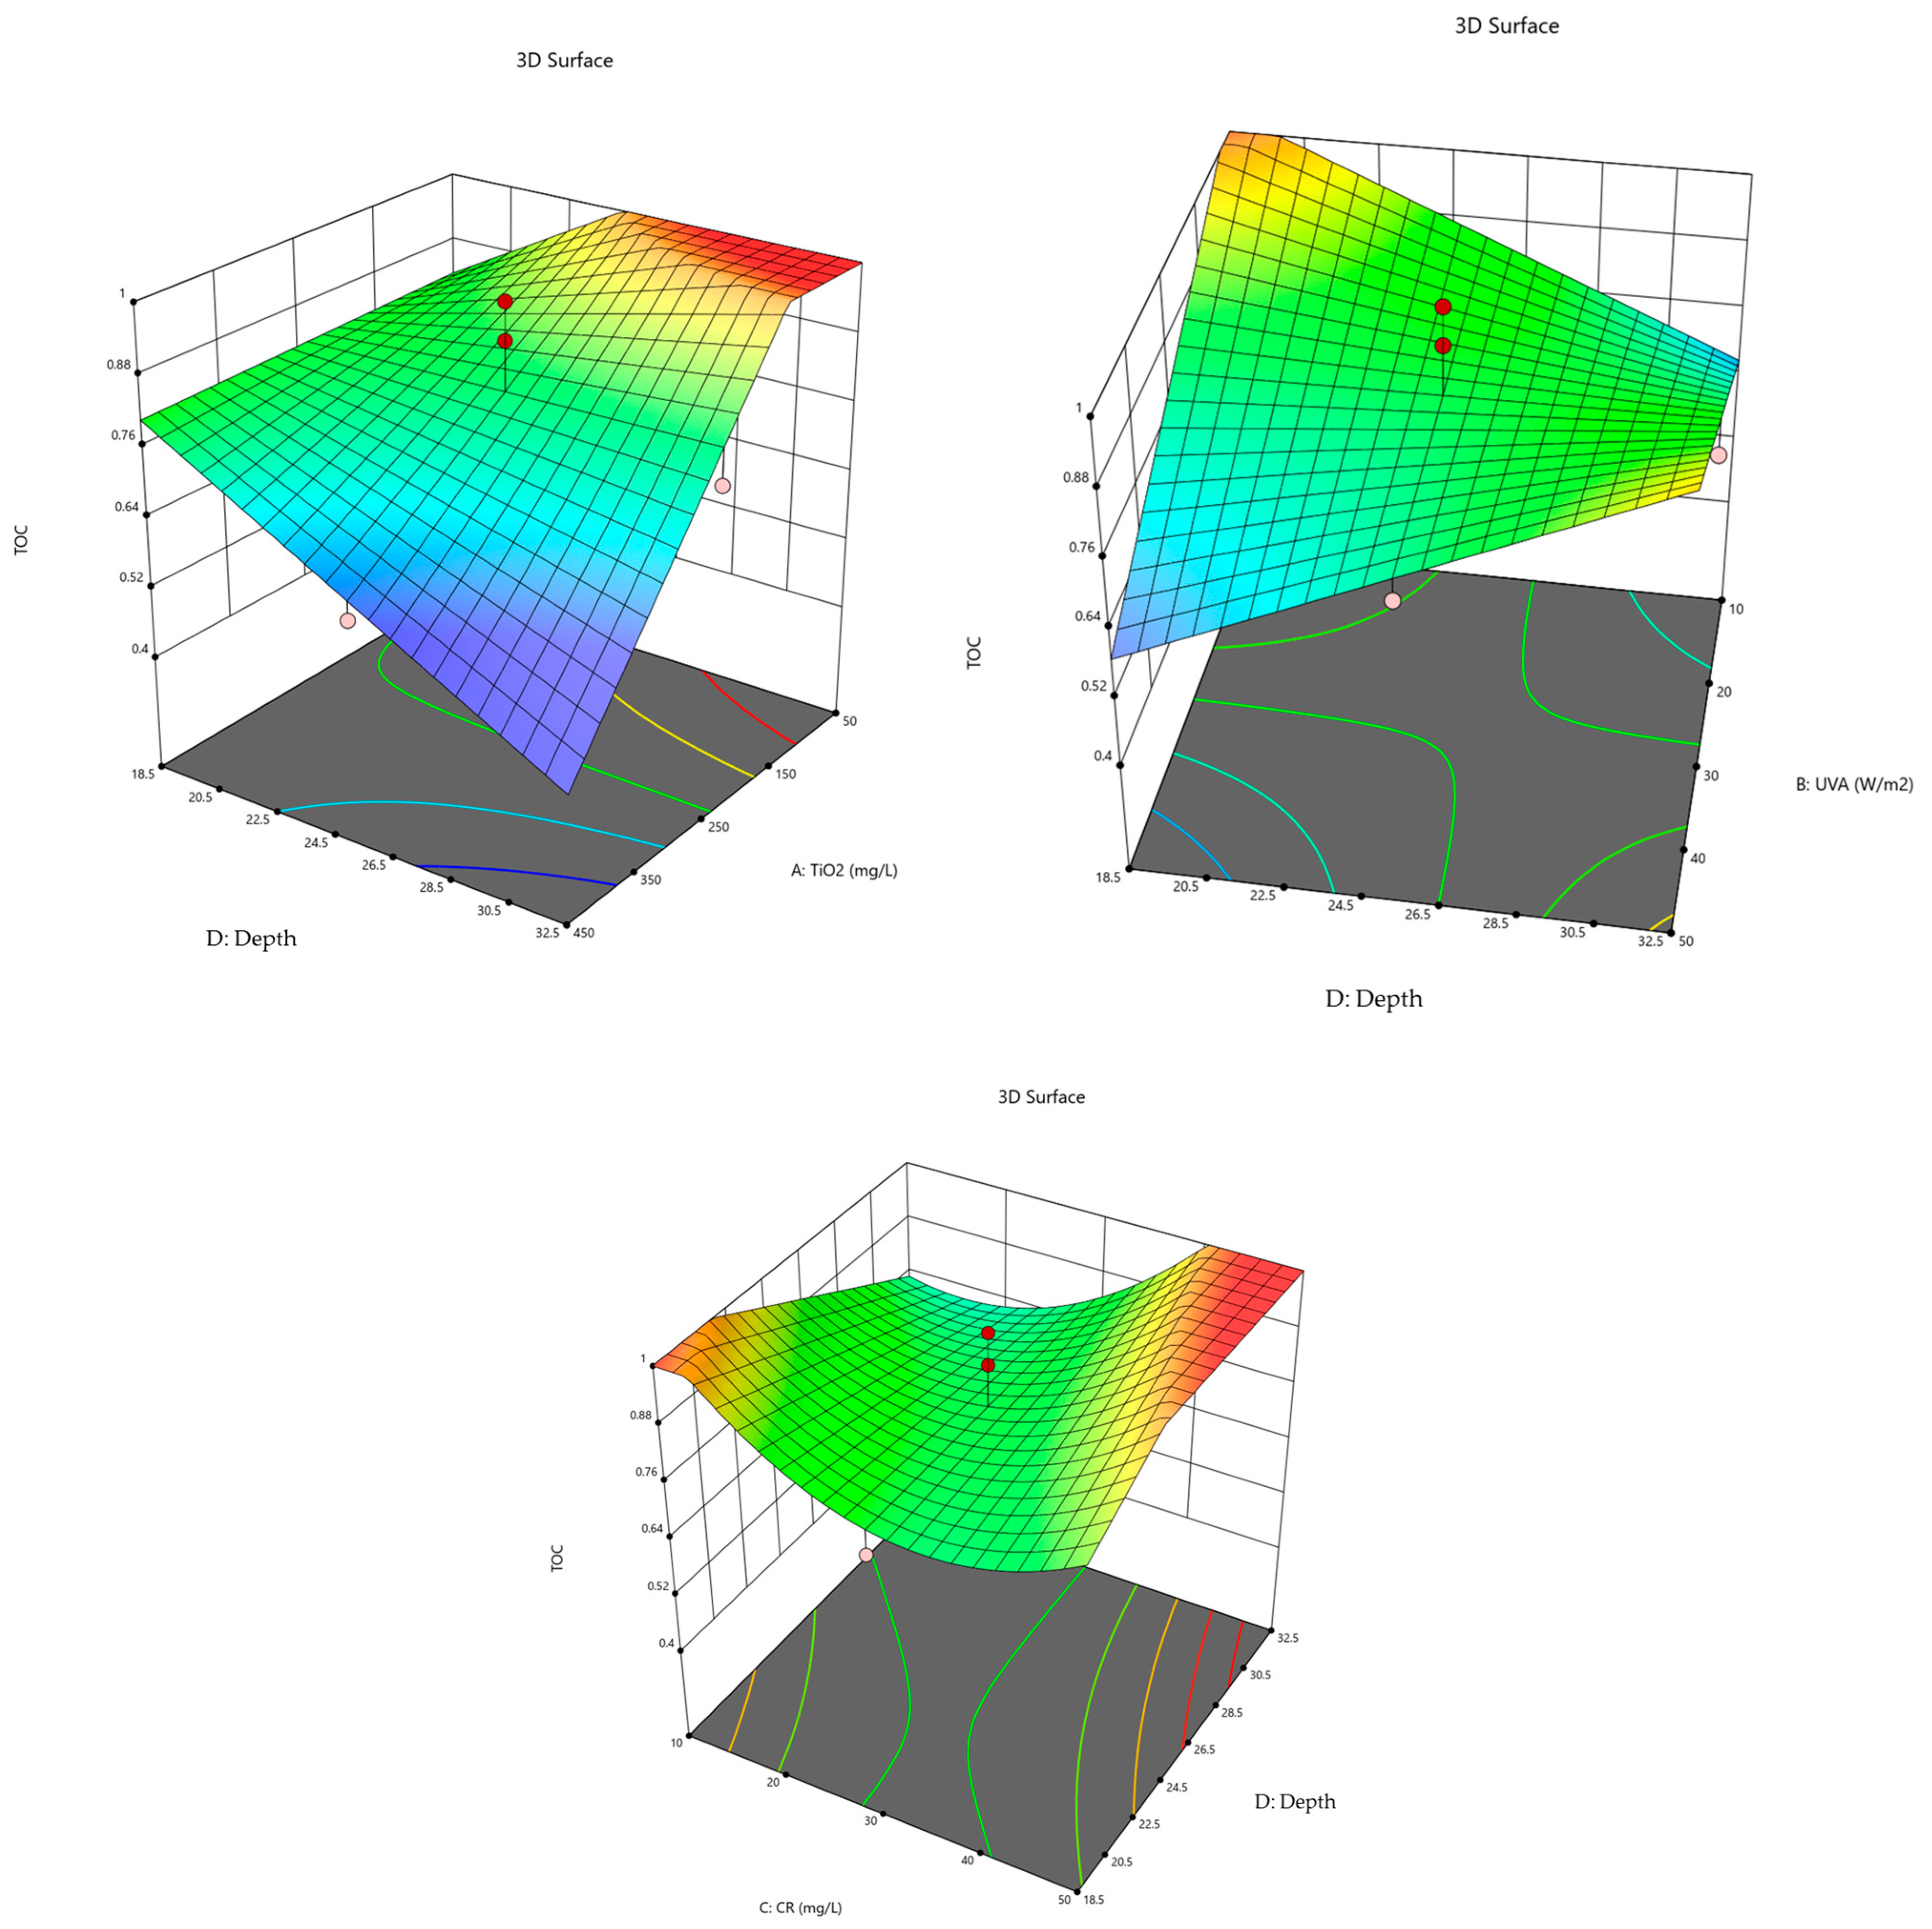
2.4. Model Diagnostics —Graphs

The normal probability and studentized residual graphs are presented in Figure 3. The studentized residuals indicate how well the actual and predicted standard deviations of the results overlap.
Residual analysis for the TOC variable exhibited similar features.
Response Surface Analysis: the response surfaces for the degradation of CR dye are presented in Figure 4 and Figure 5.
In Figure 4 (left), the dependence of absorbance on the concentration of the TiO2 photocatalyst and the intensity of UV irradiation is shown for a CR dye concentration of 30 µmol/L and a suspension depth of 25.5 mm in the reactor. The absorbance value increases with a lower amount of photocatalyst and lower irradiation intensity, resulting in reduced dye degradation. The best degradation is achieved at the lowest absorbance value, which is expected at the highest photocatalyst concentration and the strongest UV-A irradiation. In Figure 4 (right), the dependence of absorbance on irradiation intensity and suspension depth in the reactor is presented for a photocatalyst concentration of 250 mg/L and irradiation of 30 W/m2. It is evident that absorbance reaches its lowest values at the highest irradiation intensity and the smallest suspension depth.
In Figure 5 (top left), the dependence of TOC values on the concentration of the TiO2 photocatalyst and suspension depth is shown for a CR dye concentration of 30 µmol/L and an irradiation intensity of 30 W/m2. The TOC value increases with lower photocatalyst concentration and greater suspension depth, resulting in reduced dye degradation efficiency. The best degradation efficiency is achieved at the lowest TOC value, which corresponds to the highest photocatalyst concentration and shallowest suspension.
In Figure 5 (top right), the dependence of TOC values on irradiation intensity and suspension depth in the reactor is shown for a photocatalyst concentration of 250 mg/L and a CR dye concentration of 30 µmol/L. It is evident that TOC reaches its lowest values at the highest irradiation intensity and the smallest suspension depth.
The dependence of TOC values on CR dye concentration and suspension depth in the reactor is shown in Figure 5 (bottom) for a photocatalyst concentration of 250 mg/L and an irradiation intensity of 30 W/m2. It is observed that TOC reaches its lowest values at the lowest CR dye concentration and the highest suspension depth, indicating that a low pollutant load combined with optimized geometry enhances mineralization.

2.5. Conditions for Optimization

Table 5 describes the conditions for the optimization of the photocatalytic degradation of CR dye, while Table 6 presents the optimal factor values and their alignment with the desired conditions.
At the optimized factor values of TiO2 concentration of 222.37 mg/L, UV-A irradiation intensity of 20 W/m2, CR dye concentration of 25 µg/L, and a suspension depth of 29 mm, the best degradation of CR dye and the lowest TOC value are achieved, which still require further validation through confirmatory experiments (control run).
The outcome of the control run is presented in Figure 6, where the final absorbance ratio (A₃₀/A₀) was 0.3533, differing from the predicted value of 0.367 by 3.75%. The time period marked as −30 to 0 min was a period of the adsorption process (stirring “in the dark”).
The experimental results showed that the TiO2 concentration and UV-A irradiation intensity significantly influenced the extent of CR dye degradation. ANOVA results indicated that factors A (TiO2), B (UV-A), C (CR), and D (suspension depth) were significant in the model (p < 0.05).
Response surface analysis revealed that optimal CR dye degradation requires higher TiO2 concentrations and stronger UV irradiation, while excessive TiO2 concentrations can lead to agglomeration, reducing its active surface area and degradation efficiency. On the other hand, increasing suspension depth resulted in lower degradation efficiency due to reduced light penetration.
The design of experiments (DOE) and ANOVA, combined with a lamp with the radiation wavelengths that can be found in natural solar radiation, show a key sustainability advantage of this approach—its ability to harness natural solar energy, particularly in the UV-A spectrum, leading to substantial reductions in energy consumption and associated environmental impacts relative to artificial illumination. In addition, the process demonstrates a high potential for achieving appropriate mineralization of organic contaminants, positioning it as a promising candidate for large-scale wastewater treatment applications.

2.6. Comparison of Azo Dye Treatment Methods in Wastewaters

To highlight the potential of applying this method—photocatalytic treatment utilizing solar radiation—a comparative overview of five applicable techniques is presented in Table 7. These methods are considered for the treatment and degradation of azo dyes in wastewater streams prior to their discharge into the environment.
As illustrated, each treatment method has inherent advantages and limitations. Therefore, combining complementary techniques can lead to more efficient and environmentally sustainable solutions. One particularly promising approach is the integration of membrane separation with photocatalysis, whereby photocatalysis is utilized to degrade concentrated effluents, ideally harnessing natural solar radiation during optimal periods. This synergy maximizes treatment efficiency while minimizing environmental impact.

3. Materials and Methods

3.1. Methods

For the purpose of the study, 30 experiments were performed, and their results are presented in Table 8. The table includes independent variables, i.e., influencing factors such as TiO2 concentration, UV-A intensity, CR concentration, and suspension depth, along with the photocatalytic degradation (measured as absorbance A (498)) and TOC as response variables. Variation in the independent variables is presented in Figure 7.
The experiments were conducted in a randomized order, while the central value of the CCD model was repeated six times to determine the pure error. The efficiency of CR dye removal from the suspension was assessed by response analysis within the model.
To determine the interactions among variables and their impact on responses, analysis of variance (ANOVA) was employed. The model’s fit was evaluated using the coefficients of determination (R2 and adjusted R2), while statistical significance was verified through adequate precision values and the F-test.

3.2. Materials

The TiO2 powder used in the experiments was Degussa P-25 (currently marketed by Evonik Co.), a well-characterized material with well-established properties. The P-25 TiO2 had a purity of 99.9% and was used as received, without any further modification. It consists primarily of the anatase phase (75–80%) with a rutile content of 20–25% and has a specific surface area (BET) of 50–54 m2/g, corresponding to a mean particle size of approximately 30 nm. The pore volume is 0.196 cm3/g, and the band gap energy (Eg) is 3.15 eV [32,33].
CR dye was supplied by ACROS Co. as a high-purity biological stain (90%) and used as a model compound without further purification.
The samples were filtered by vacuum filtration through 0.45 μm cellulose nitrate membranes provided by Sartorius Co. (Göttingen, Germany). All the chemicals and materials were used as received, without further purification.

3.3. Experimental Section

For the experiment, a 500 mL aqueous solution of CR dye was prepared. The solution was stirred in the dark for 24 h and subsequently filtered through a 0.45 µm pore size membrane filter with a diameter of 47 mm (Lobex Ltd. MCE Filter-Bio). A 250 mL aliquot of the solution, containing varying CR dye concentrations (10–50 µmol/L), was transferred to a glass reactor, followed by the addition of TiO2 at different concentrations (50, 150, 250, 350, and 450 mg/L). The experiments were conducted in glass reactors with depths ranging from 18.5 to 32.5 mm and with the stirring speed of approximately 120 rpm. During the experiments, samples were collected at intervals of 5 to 30 min and analyzed using a UV-VIS spectrophotometer at a wavelength of 498 nm. Additionally, total organic carbon (TOC) was measured as an indicator of the degree of CR dye mineralization.
The experimental setup with the UV-VIS-IR lamp is shown in Figure 8. The lamp’s radiation components correspond to parts of the natural solar spectrum, as illustrated in Figure 1. Although this lamp is not a solar simulator, throughout the text we will refer to it as a lamp simulating solar radiation, since it provides artificial radiation that partially resembles solar light.
The lamp employed in this study was the Ultra Vitalux 300W model, manufactured by Osram Co (Munich, Germany).
After homogenizing the suspension in an ultrasonic bath for 5 min, a sample was taken for TOC measurement. Prior to exposing the reactor to UV light, the solution was stirred in the dark on a magnetic stirrer for 30 min to establish adsorption–desorption equilibrium. The reactor was then placed on a magnetic stirrer under a UV lamp at varying distances (22, 25, 30, 40, and 55 cm) to achieve different radiation intensities (10, 20, 30, 40, and 50 W/m2). Additionally, two distinct glass reactors were used to accommodate different solution depths (18.5, 22, 25.5, 29, and 32.5 mm).
Samples of 5 mL were collected using a syringe at time intervals of 5, 10, 15, 20, 25, and 30 min and filtered through a 0.45 µm membrane filter with a 25 mm diameter. The filtered samples were analyzed using a UV-VIS spectrophotometer (type 8453, manufactured by Hewlett Packard Co.; Palo Alto, USA) to determine CR absorbance at 498 nm. At the end of the experiment (after 30 min), an additional sample was taken for TOC measurement. TOC analysis was performed using a Shimadzu TOC-VCPH analyzer. The sample volume was 20 mL, and the NPOC (non-purgeable organic carbon) method was applied.
The pH value of the solution was measured both before UV exposure and at the end of the experiment.

4. Conclusions

This study demonstrated the effectiveness of TiO2-assisted photocatalysis under artificial solar-like UV-A irradiation for the degradation of Congo red (CR) dye in aqueous solutions. Using a central composite design (CCD) and analysis of variance (ANOVA), we optimized reaction conditions to achieve maximum dye degradation efficiency. The results suggest that TiO2 photocatalysis is a promising method for treating dye-contaminated wastewater, providing an environmentally sustainable approach to pollution control. By optimizing key operational parameters, high removal efficiency and significant mineralization were achieved, indicating the potential of this process for practical wastewater treatment applications. A key strength of this study lies in the integration of Design of Experiments (DOE) methodology with photocatalytic treatment to identify optimal parameters among four of them.
Key parameters influencing degradation efficiency include TiO2 concentration, UV-A intensity, CR dye concentration, and suspension depth. Response surface methodology (RSM) confirmed the significance of these factors, with optimal conditions identified as 222.37 mg/L TiO2, 20 W/m2 UV-A irradiation, 25 µg/L CR dye, and a suspension depth of 29 mm. Under these conditions, the lowest absorbance at 498 nm (0.367) and TOC (0.805 mg/L) values were achieved, indicating effective CR dye removal.
Although this study successfully demonstrated CR dye degradation, some limitations should be addressed in future research. TiO2 nanoparticle aggregation at higher concentrations can reduce its photocatalytic efficiency, necessitating strategies for improved catalyst dispersion. Additionally, real wastewater contains diverse contaminants that may affect photocatalytic performance, requiring further optimization under complex environmental conditions.
One of the major sustainability benefits of this method is the potential to utilize natural solar radiation, particularly its UV-A component, which can dramatically reduce operational energy costs and environmental impact compared to artificial light sources. Furthermore, the method enables near-complete mineralization of organic pollutants, making it an attractive alternative for large-scale wastewater treatment. However, further research is needed to assess long-term photocatalyst stability, reusability, and scalability for real wastewater treatment systems.

Author Contributions

Conceptualization, D.L., D.B., A.V.; methodology, D.L., H.C., H.J.; software, H.C.; validation, D.L., D.B., H.C., H.J.; formal analysis, D.L., A.V.; investigation, D.L., D.B., H.J., A.V., H.C.; resources, D.L.; data curation, H.C., D.B.; writing—original draft preparation, D.L., A.V., D.B.; writing—review and editing, D.L., H.J., H.C.; visualization, D.B., H.C.; supervision, D.L., H.J.; project administration, D.L. All authors have read and agreed to the published version of the manuscript.

Funding

This research received no external funding.

Institutional Review Board Statement

Not applicable.

Informed Consent Statement

Not applicable.

Data Availability Statement

Data can be provided upon request.

Acknowledgments

We thank Marko Skozrit for his valuable technical assistance during the experiments.

Conflicts of Interest

The authors declare no conflicts of interest.

References

  1. Siddiqui, S.I.; Allehyani, E.S.; Al-Harbi, S.A.; Hasan, Z.; Abomuti, M.A.; Rajor, H.K.; Oh, S. Investigation of Congo Red Toxicity towards Different Living Organisms: A Review. Processes 2023, 11, 807. [Google Scholar] [CrossRef]
  2. Hoang, N.T.T.; Nguyen, D.D. Improving the Degradation Kinetics of Industrial Dyes with Chitosan/TiO2/Glycerol Films for the Sustainable Recovery of Chitosan from Waste Streams. Sustainability 2023, 15, 6979. [Google Scholar] [CrossRef]
  3. Oladoye, P.O.; Bamigboye, M.O.; Ogunbiyi, O.D.; Akano, M.T. Toxicity and decontamination strategies of Congo red dye. Groundw. Sustain. Dev. 2022, 19, 100844. [Google Scholar] [CrossRef]
  4. Periyasamy, A.P. Recent Advances in the Remediation of Textile-Dye-Containing Wastewater: Prioritizing Human Health and Sustainable Wastewater Treatment. Sustainability 2024, 16, 495. [Google Scholar] [CrossRef]
  5. Lellis, B.; Fávaro-Polonio, C.Z.; Pamphile, J.A.; Polonio, J.C. Effects of textile dyes on health and the environment and bioremediation potential of living organisms. Biotechnol. Res. Innov. 2019, 3, 275–290. [Google Scholar] [CrossRef]
  6. Naseem, K.; Farooqi, Z.H.; Begum, R.; Irfan, A. Removal of Congo red dye from aqueous medium by its catalytic reduction using sodium borohydride in the presence of various inorganic nano-catalysts: A review. J. Clean. Prod. 2018, 187, 296–307. [Google Scholar] [CrossRef]
  7. Imran, M.; Shaharoona, B.; Crowley, D.; Khalid, A.; Hussain, S.; Arshad, M. The stability of textile azo dyes in soil and their impact on microbial phospholipid fatty acid profiles. Ecotoxicol. Environ. Saf. 2015, 120, 163–168. [Google Scholar] [CrossRef]
  8. Muruganandham, M.; Swaminathan, M. Solar photocatalytic degradation of a reactive azo dye in TiO2-suspension. Sol. Energy Mater. Sol. Cells 2004, 8, 439–457. [Google Scholar] [CrossRef]
  9. Bouberka, Z.; Kacha, S.; Kameche, M.; Elmaleh, S.; Derriche, Z. Sorption study of an acid dye from aqueous solutions using modified clays. J. Hazard. Mater. 2005, 119, 117–124. [Google Scholar] [CrossRef]
  10. Scott, J.P.; Ollis, D.F. Integration of chemical and biological oxidation process for water treatment: Review and recommendation. Environ. Prog. 1995, 14, 88–103. [Google Scholar] [CrossRef]
  11. Amagan, B.; Turan, M.; Celike, M. Equilibrium studies on the adsorption of reactive azo dyes into zeolite. Desalination 2004, 170, 33–39. [Google Scholar] [CrossRef]
  12. Hashemian, D. Study of adsorption of acid dye from aqueous solutions using bentonite. Main Group Chem. 2007, 6, 97–107. [Google Scholar] [CrossRef]
  13. Purkait, M.K.; Maiti, A.; DasGupta, S.; De, S. Removal of congo red using activated carbon and its regeneration. J. Hazard. Mater. 2007, 145, 287–295. [Google Scholar] [CrossRef]
  14. Dai, S.; Zhuang, Y.; Chen, Y.; Chen, L. Study on the relationship between structure of synthetic organic chemicals and their biodegradability. Environ. Chem. 1995, 14, 354–367. [Google Scholar]
  15. Legrini, O.; Oliveros, E.; Braun, A.M. Photochemical Processes for Water Treatment. Chem. Rev. 1993, 93, 671–698. [Google Scholar] [CrossRef]
  16. Goslich, R.; Dillert, R.; Bahnemann, D. Solar water treatment: Principles and reactors. Water Sci. Technol. 1997, 35, 137–148. [Google Scholar] [CrossRef]
  17. Vidal, A. Developments in solar photocatalysis for water purification. Chemosphere 1998, 36, 2593–2606. [Google Scholar] [CrossRef]
  18. Ljubas, D.; Franzreb, M.; Hansen, H.C.B.; Weidler, P.G. Magnetizing of nano-materials on example of Degussa’s P-25 TiO2 photocatalyst: Synthesis of magnetic aggregates, characterization and possible use. Sep. Purif. Technol. 2014, 136, 274–285. [Google Scholar] [CrossRef]
  19. Ljubas, D. Solar photocatalysis-a possible step in drinking water treatment. Energy 2005, 30, 1699–1710. [Google Scholar] [CrossRef]
  20. Linsebigler, A.L.; Lu, G.; Yates, J.T., Jr. Photocatalysis on TiO2 surfaces: Principles, Mechanisms and selected results. Chem. Rev. 1995, 95, 735–758. [Google Scholar] [CrossRef]
  21. Serpone, N.; Sauvé, G.; Koch, R.; Tahiri, H.; Pichat, P.; Piccinini, P.; Pelizzeti, E.; Hidaka, H. Standardization protocol of process efficiencies and activation parameters in heterogeneous photocatalysis: Relative photonic efficiencies ζr. J. Photochem. Photobiol. A 1996, 94, 191–203. [Google Scholar] [CrossRef]
  22. Ponnusamy, S.K.; Subramarian, R. Process optimization studies of Congo red dye adsorption onto cashew nut shell using response surface methodology. Int. J. Ind. Chem. 2013, 4, 17. [Google Scholar] [CrossRef]
  23. Cho, H.; Zoh, K.D. Photocatalytic degradation of azo dye (Reactive Red 120) in TiO2/UV system: Optimization and modeling using a response surface methodology (RSM) based on the central composite desig. Dyes Pigment. 2007, 75, 533–543. [Google Scholar] [CrossRef]
  24. Fathinia, M.; Khataee, A.R.; Zarei, M.; Aber, S. Comparative Photocatalytic Degradation of Two Dyes on Immobilized TiO2 Nanoparticles: Effect of Dye Molecular Structure and Response Surface Approach. J. Mol. Catal. A 2010, 333, 73–84. [Google Scholar] [CrossRef]
  25. Ngulube, K.F.; Abdelhaleem, A.; Fujii, M.; Nasr, M. Synergism of Artificial Intelligence and Techno-Economic for Sustainable Treatment of Methylene Blue Dye-Containing Wastewater by Photocatalysis. Sustainability 2024, 16, 529. [Google Scholar] [CrossRef]
  26. Korbahti, K.; Rauf, M.A. Application of Response Surface Analysis to the Photolytic Degradation of Basic Red 2 Dye. Chem. Eng. J. 2008, 138, 166–171. [Google Scholar] [CrossRef]
  27. Zhang, Z.; Wang, C.C.; Zakaria, R.; Ying, J.Y. Role of Particle Size in Nanocrystalline TiO2-Based Photocatalysts. J. Phys. Chem. B 1998, 102, 10871–10878. [Google Scholar] [CrossRef]
  28. Sanchez Tobon, C.; Panžić, I.; Bafti, A.; Matijašić, G.; Ljubas, D.; Ćurković, L. Rapid Microwave-Assisted Synthesis of N/TiO2/rGO Nanoparticles for the Photocatalytic Degradation of Pharmaceuticals. Nanomaterials 2022, 12, 3975. [Google Scholar] [CrossRef]
  29. Guimarães, R.R.; Parussulo, A.L.A.; Toma, H.E.; Araki, K. Enlightening the synergic effect of anatase/rutile mixtures in solar cells. Electrochim. Acta 2016, 188, 523–528. [Google Scholar] [CrossRef]
  30. Kulišić, P. New Energy Sources: Solar Energy and Wind Energy (Novi Izvori Energije: Sunčana Energija i Energija Vjetra); Školska knjiga: Zagreb, Croatia, 1991. (In Croatian) [Google Scholar]
  31. Guo, J.; Zhou, T.; Guo, H.; Ge, C.; Lu, J. Application of nano-TiO2@adsorbent composites in the treatment of dye wastewater: A review. J. Eng. Fibers Fabr. 2025, 20, 1558–9250. [Google Scholar]
  32. Sanchez Tobon, C.; Ljubas, D.; Mandić, V.; Panžić, I.; Matijašić, G.; Ćurković, L. Microwave-Assisted Synthesis of N/TiO2 Nanoparticles for Photocatalysis under Different Irradiation Spectra. Nanomaterials 2022, 12, 1473. [Google Scholar] [CrossRef]
  33. Patil, S.R.; Akpan, U.G.; Hameed, S.K.; Samdarshi, S.K. A comparative study of the photocatalytic efficiency of Degussa P25, Qualigens, and Hombikat UV-100 in the degradation kinetic of congo red dye. Desalination Water Treat. 2012, 46, 188–195. [Google Scholar] [CrossRef]
Figure 1. Overview of the irradiation spectrum of the OSRAM Ultra Vitalux 300 W lamp.
Molecules 30 02388 g001
Figure 2. An example of the absorbance spectrum of Congo red before irradiation (a) and spectra of the irradiated solution (bf).
Molecules 30 02388 g002
Figure 3. Graphical analysis of residuals in the case of the variable absorbance.
Molecules 30 02388 g003
Figure 4. Response surface in relation to absorbance A.
Molecules 30 02388 g004
Figure 5. Response surface in relation to TOC.
Molecules 30 02388 g005
Figure 6. Control run with selected parameters from Table 6.
Molecules 30 02388 g006
Figure 7. Overview of independent variables’ variation in experiments.
Molecules 30 02388 g007
Figure 8. Schematic diagram of photoreaction apparatus. 1. reactor, 2. magnetic agitator, 3. UV-VIS-IR lamp (“solar like” lamp), 4. stirring bar, 5. water cooling inlet, 6. water cooling outlet.
Molecules 30 02388 g008
Table 1. Measured and calculated (integrated) values of the irradiance at 20 cm distance from the lamp.
Irradiation RangeTotal Irradiance in the Range, W/m2
UV C: 250–289 nm0.173
UV B: 290–319 nm4.92
UV A: 320–399 nm56.63
VIS: 400–750 nm268.20
IR radiation was not measured because it does not possess sufficient energy to initiate the photocatalytic process (or photolytic process).
Table 2. Experimental values A(498) and TOC obtained after each test run. A(498)0 and TOC0 represent the initial values after filtering the CR solution through a 0.45 µm membrane, and A30 and TOC30 represent values of the parameters after 30 min of irradiation.
RunA(498)0TOC0, mg/LA30/A0TOC30/TOC0
10.518335.0070.092410.922
20.723606.1980.208300.747
30.765299.0470.398990.761
40.781618.3530.335880.986
50.833068.6890.343270.903
61.236812.8750.631901.000
71.22158.7920.548370.845
80.402223.0240.031350.686
91.03876.8730.786271.000
100.529654.8420.411761.000
110.795846.3710.222890.763
120.492483.5350.301210.853
131.45729.9550.691741.000
140.704455.2200.305400.783
150.701984.9890.172470.581
160.788375.6890.317610.791
170.945567.6340.572890.819
180.805155.9570.290050.781
190.073640.9750.054231.000
201.03487.3610.315140.867
210.52294.4780.330330.883
220.730026.2070.290180.968
231.05988.1070.432020.856
240.34193.8130.067770.632
250.349694.3710.176950.581
261.426110.45150.725121.000
270.826279.1600.475060.806
280.861678.7040.577400.816
291.26399.6350.687851.000
300.954488.5720.2915830.739
Table 3. Results of ANOVA 2FI model for absorbance.
SourceSum of SquaresdfMean SquareF-Valuep-Value
Model0.901960.150334.74<0.0001significant
A-TiO20.215710.215749.85<0.0001
B-UVA0.135910.135931.40<0.0001
C-CR0.488110.4881112.80<0.0001
D-Depth0.027010.02706.230.0201
AB0.019110.01914.410.0470
BD0.016110.01613.730.0660
Residual0.0995230.0043
Lack of Fit0.0831180.00461.410.3761not significant
Pure Error0.016450.0033
Cor Total1.0029
Table 4. Results of ANOVA 2FI reduced squared model for TOC.
SourceSum of SquaresdfMean SquareF-Valuep-Value
Model0.438280.054810.22<0.0001significant
A-TiO20.252010.252047.00<0.0001
B-UVA0.006910.00691.290.2696
C-CR0.024210.02424.510.0463
D-Depth0.000110.00010.02320.8806
AD0.039410.03947.350.0135
BD0.034810.03486.500.0191
CD0.025610.02564.780.0409
C20.027510.02755.130.0348
Residual0.1073200.0054
Lack of Fit0.0767150.00510.83830.6412not significant
Table 5. Conditions for the optimization of CR degradation.
NameGoalLower LimitUpper LimitLower WeightUpper WeightImportance
A:TiO2minimize150350113
B:UVAminimize2040113
C:CRis target = 252040113
D:Depthis in range2229113
Absorbanceminimize0.0313560.786271113
TOCminimize0.5815121.07353113
Table 6. Optimal factor values.
NumberTiO2UV-ACRDepthAbsorbanceTOCDesirability
1222.37220.00025.00029.0000.3670.8050.674Selected
2222.07520.00024.99729.0000.3670.8060.674
3218.48720.00025.00029.0000.3700.8110.674
4226.25420.00025.00029.0000.3640.7990.674
5216.15920.00025.00029.0000.3710.8150.674
Table 7. Comparative analysis of water treatment methods in use today [31].
Water Treatment
Method
Advantages and
Positive Aspects
Drawbacks and
Limitations
Adsorption (on granulated or powdered activated carbon)Provides effective dye removal from wastewater; the treatment is easy to implement and represents a well-established and widely adopted approach.Efficiency depends on the properties of the adsorbent and environmental conditions; there is a risk of secondary pollution generation.
Membrane Separation (ultrafiltration, nanofiltration, reverse osmosis)Capable of removing various dye types, allows selective separation, and occupies a relatively limited spatial footprint.Installation and operational costs are high; it requires specific conditions such as pressurization; it is susceptible to clogging and has a limited operational lifespan; and there is a problem with concentrated flow with pollutants.
Coagulation and flocculationA straightforward process requiring low-cost equipment; especially effective for hydrophobic dyes.Generates significant amounts of sludge that are difficult to manage; less suitable for hydrophilic dye removal, equipment material can easily corrode.
PhotocatalysisEfficient in degrading persistent dye molecules, enabling complete breakdown; characterized by high energy efficiency if natural solar radiation is usedSeparation of photocatalyst; if the process uses suspended particles, intermediate products can be more toxic after treatment than the parent product
Biological treatment
(biodegradation by microorganisms)
Enables selective biodegradation via microorganisms, with minimal ecological toxicity.Ineffective for high-concentration dye wastewaters or those with poor light penetration; slow process dependent on specific environmental conditions.
Table 8. Experimental values for photocatalytic tests.
RunTiO2, mg/LUV-A, W/m2CR, μmol/LDepth, mm
1150402022
2250503025.5
3250303032.5
4350202022
5250303025.5
6150404029
7150404022
8350402022
950303025.5
10150402029
11250303018.5
12150202022
13250305025.5
14250303025.5
15450303025.5
16250303025.5
17350204029
18250303025.5
19250301025.5
20350404029
21150202029
22250303025.5
23350204022
24350402029
25350202029
26150204029
27250303025.5
28250103025.5
29150204022
30350404022
Disclaimer/Publisher’s Note: The statements, opinions and data contained in all publications are solely those of the individual author(s) and contributor(s) and not of MDPI and/or the editor(s). MDPI and/or the editor(s) disclaim responsibility for any injury to people or property resulting from any ideas, methods, instructions or products referred to in the content.

