
Preliminary Exploration of the Protective Mechanism of Eugenol Against Acute Liver Injury Induced by Thioacetamide Based on Metabolomics


Abstract
1. Introduction
2. Results
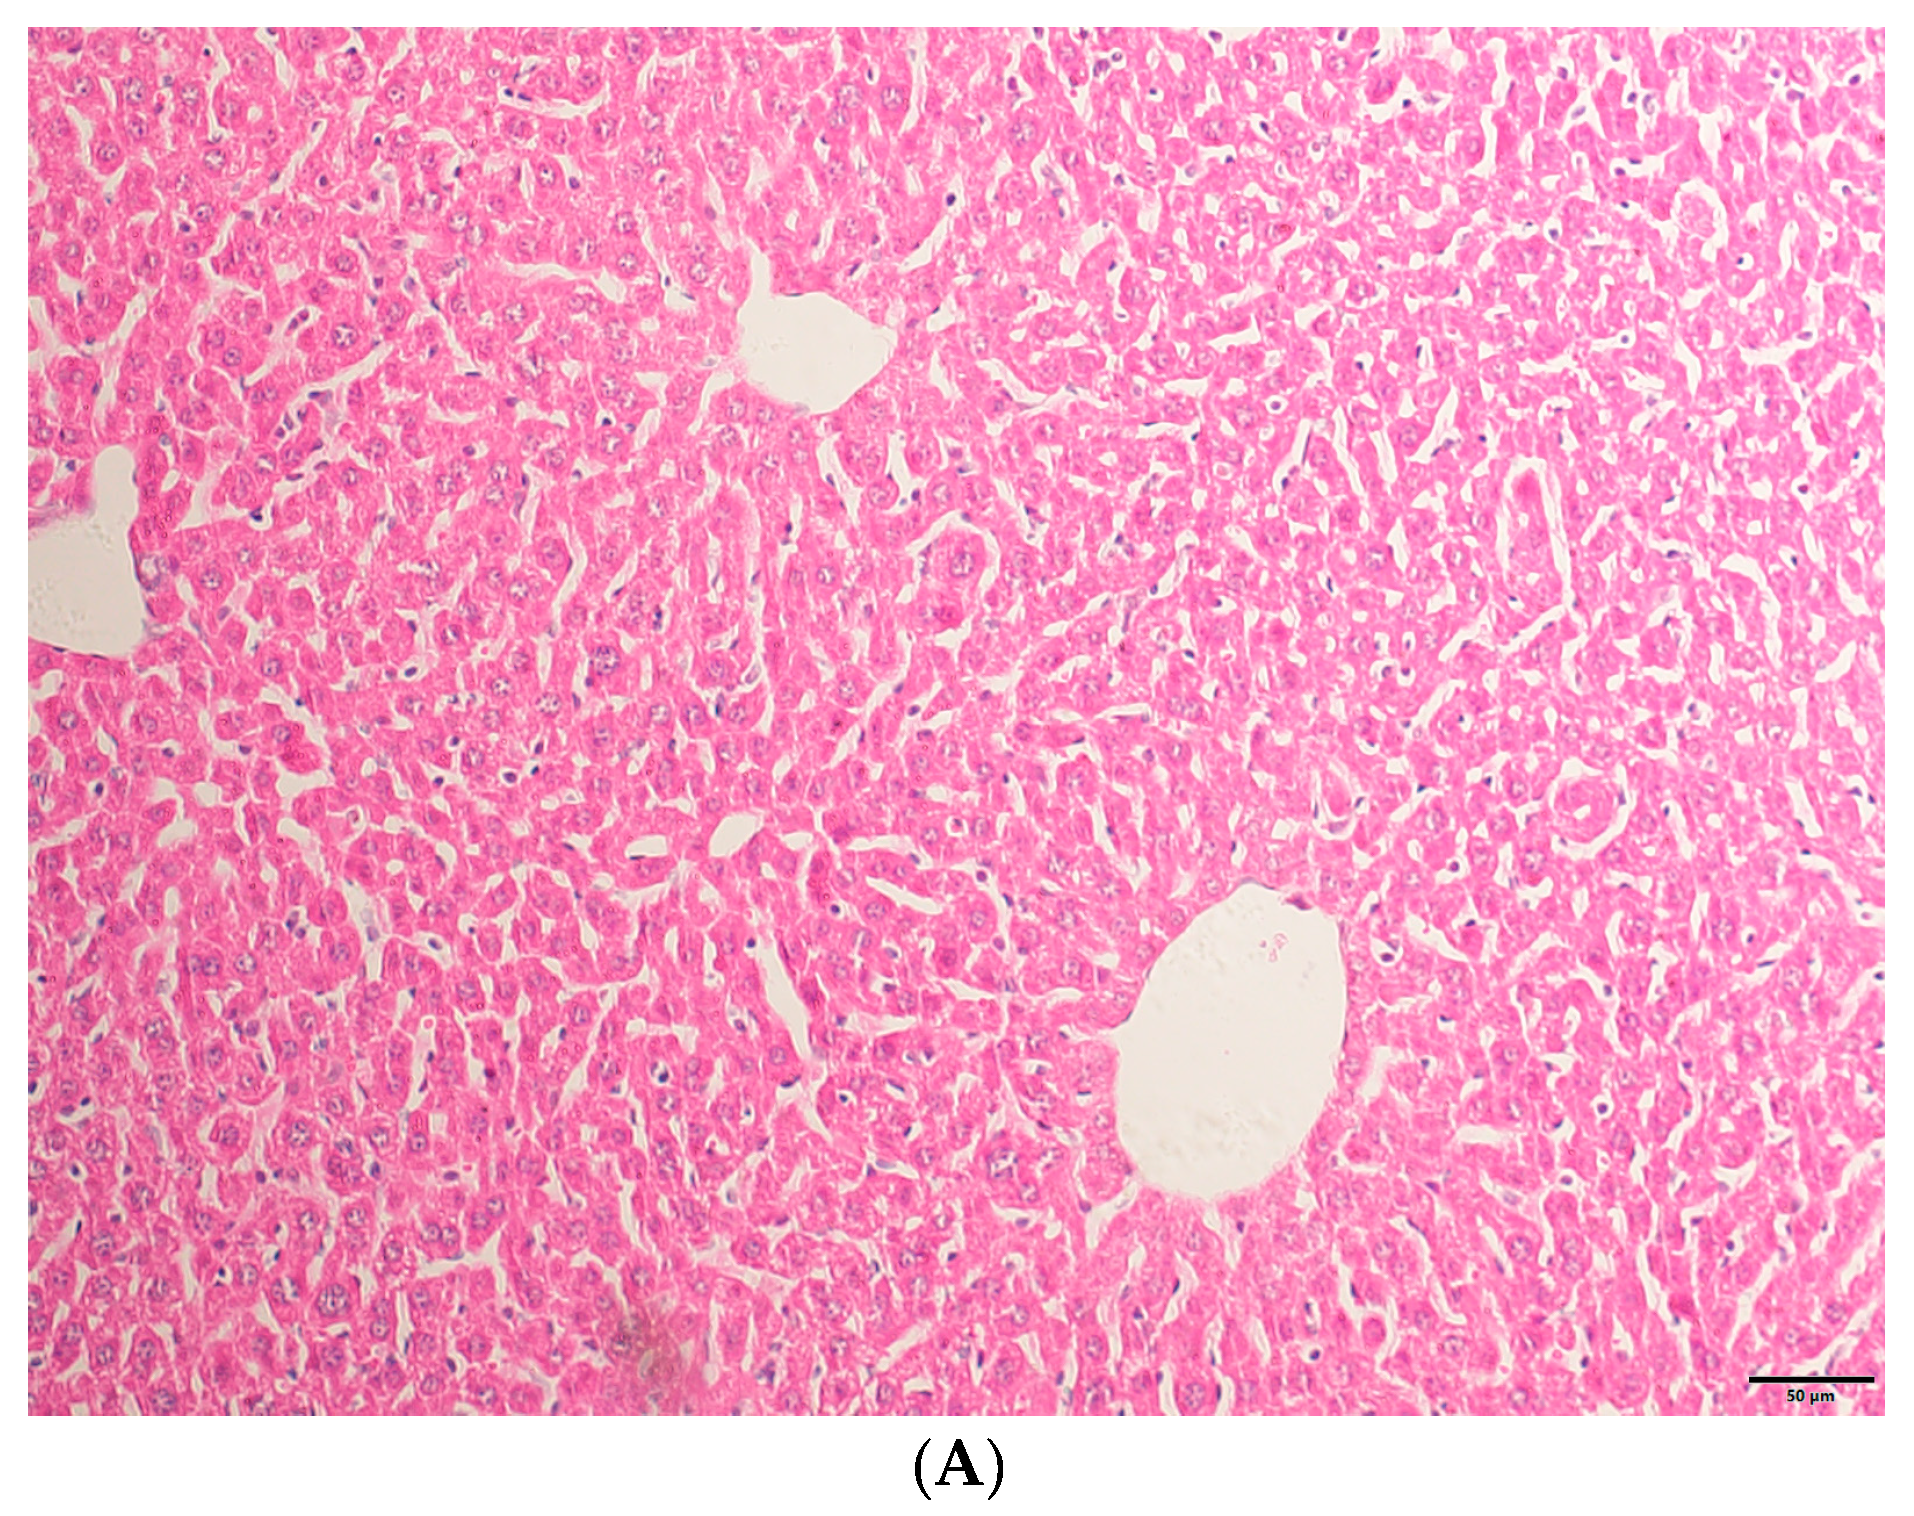
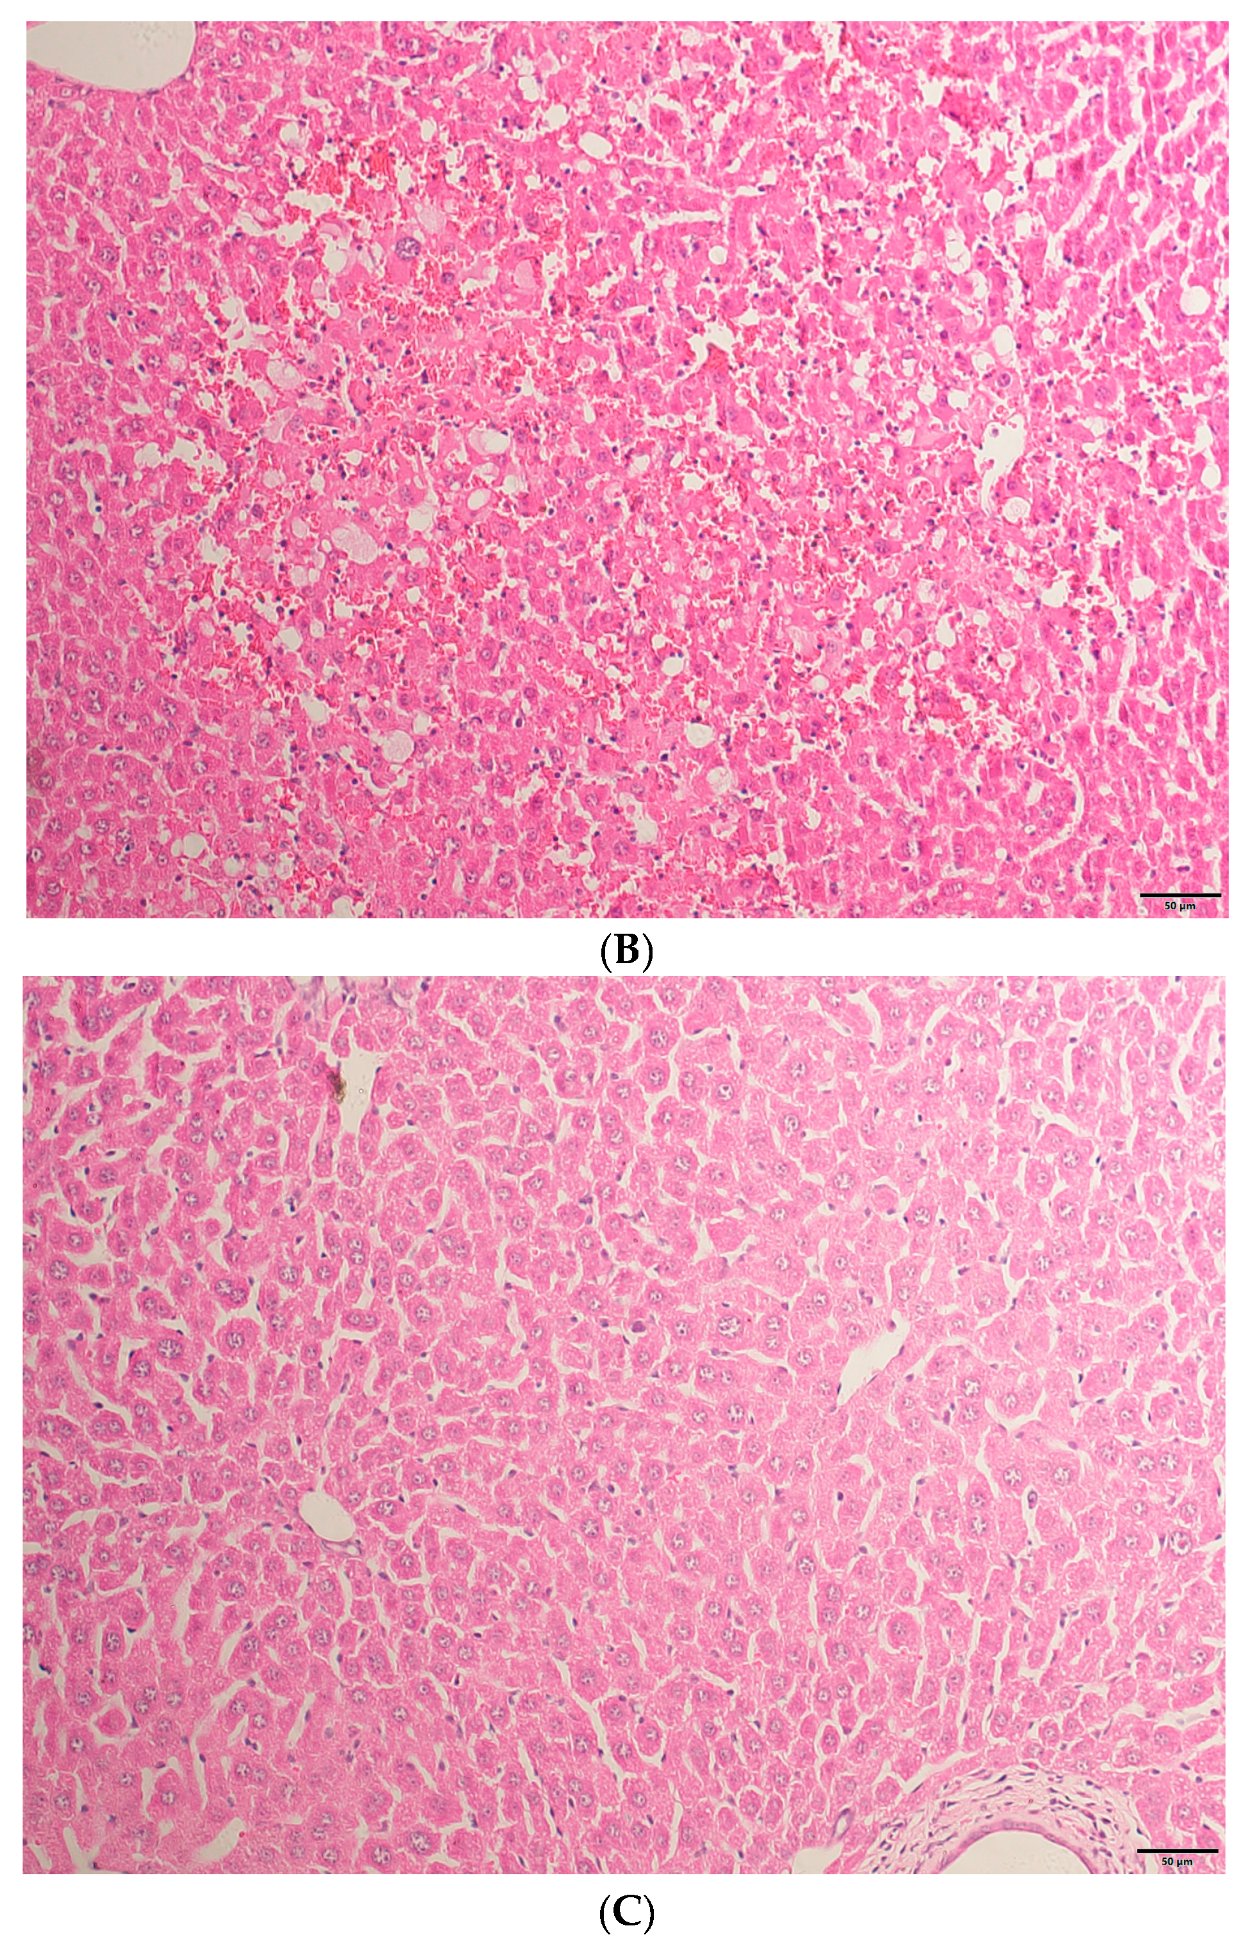
2.1. HE Staining Results
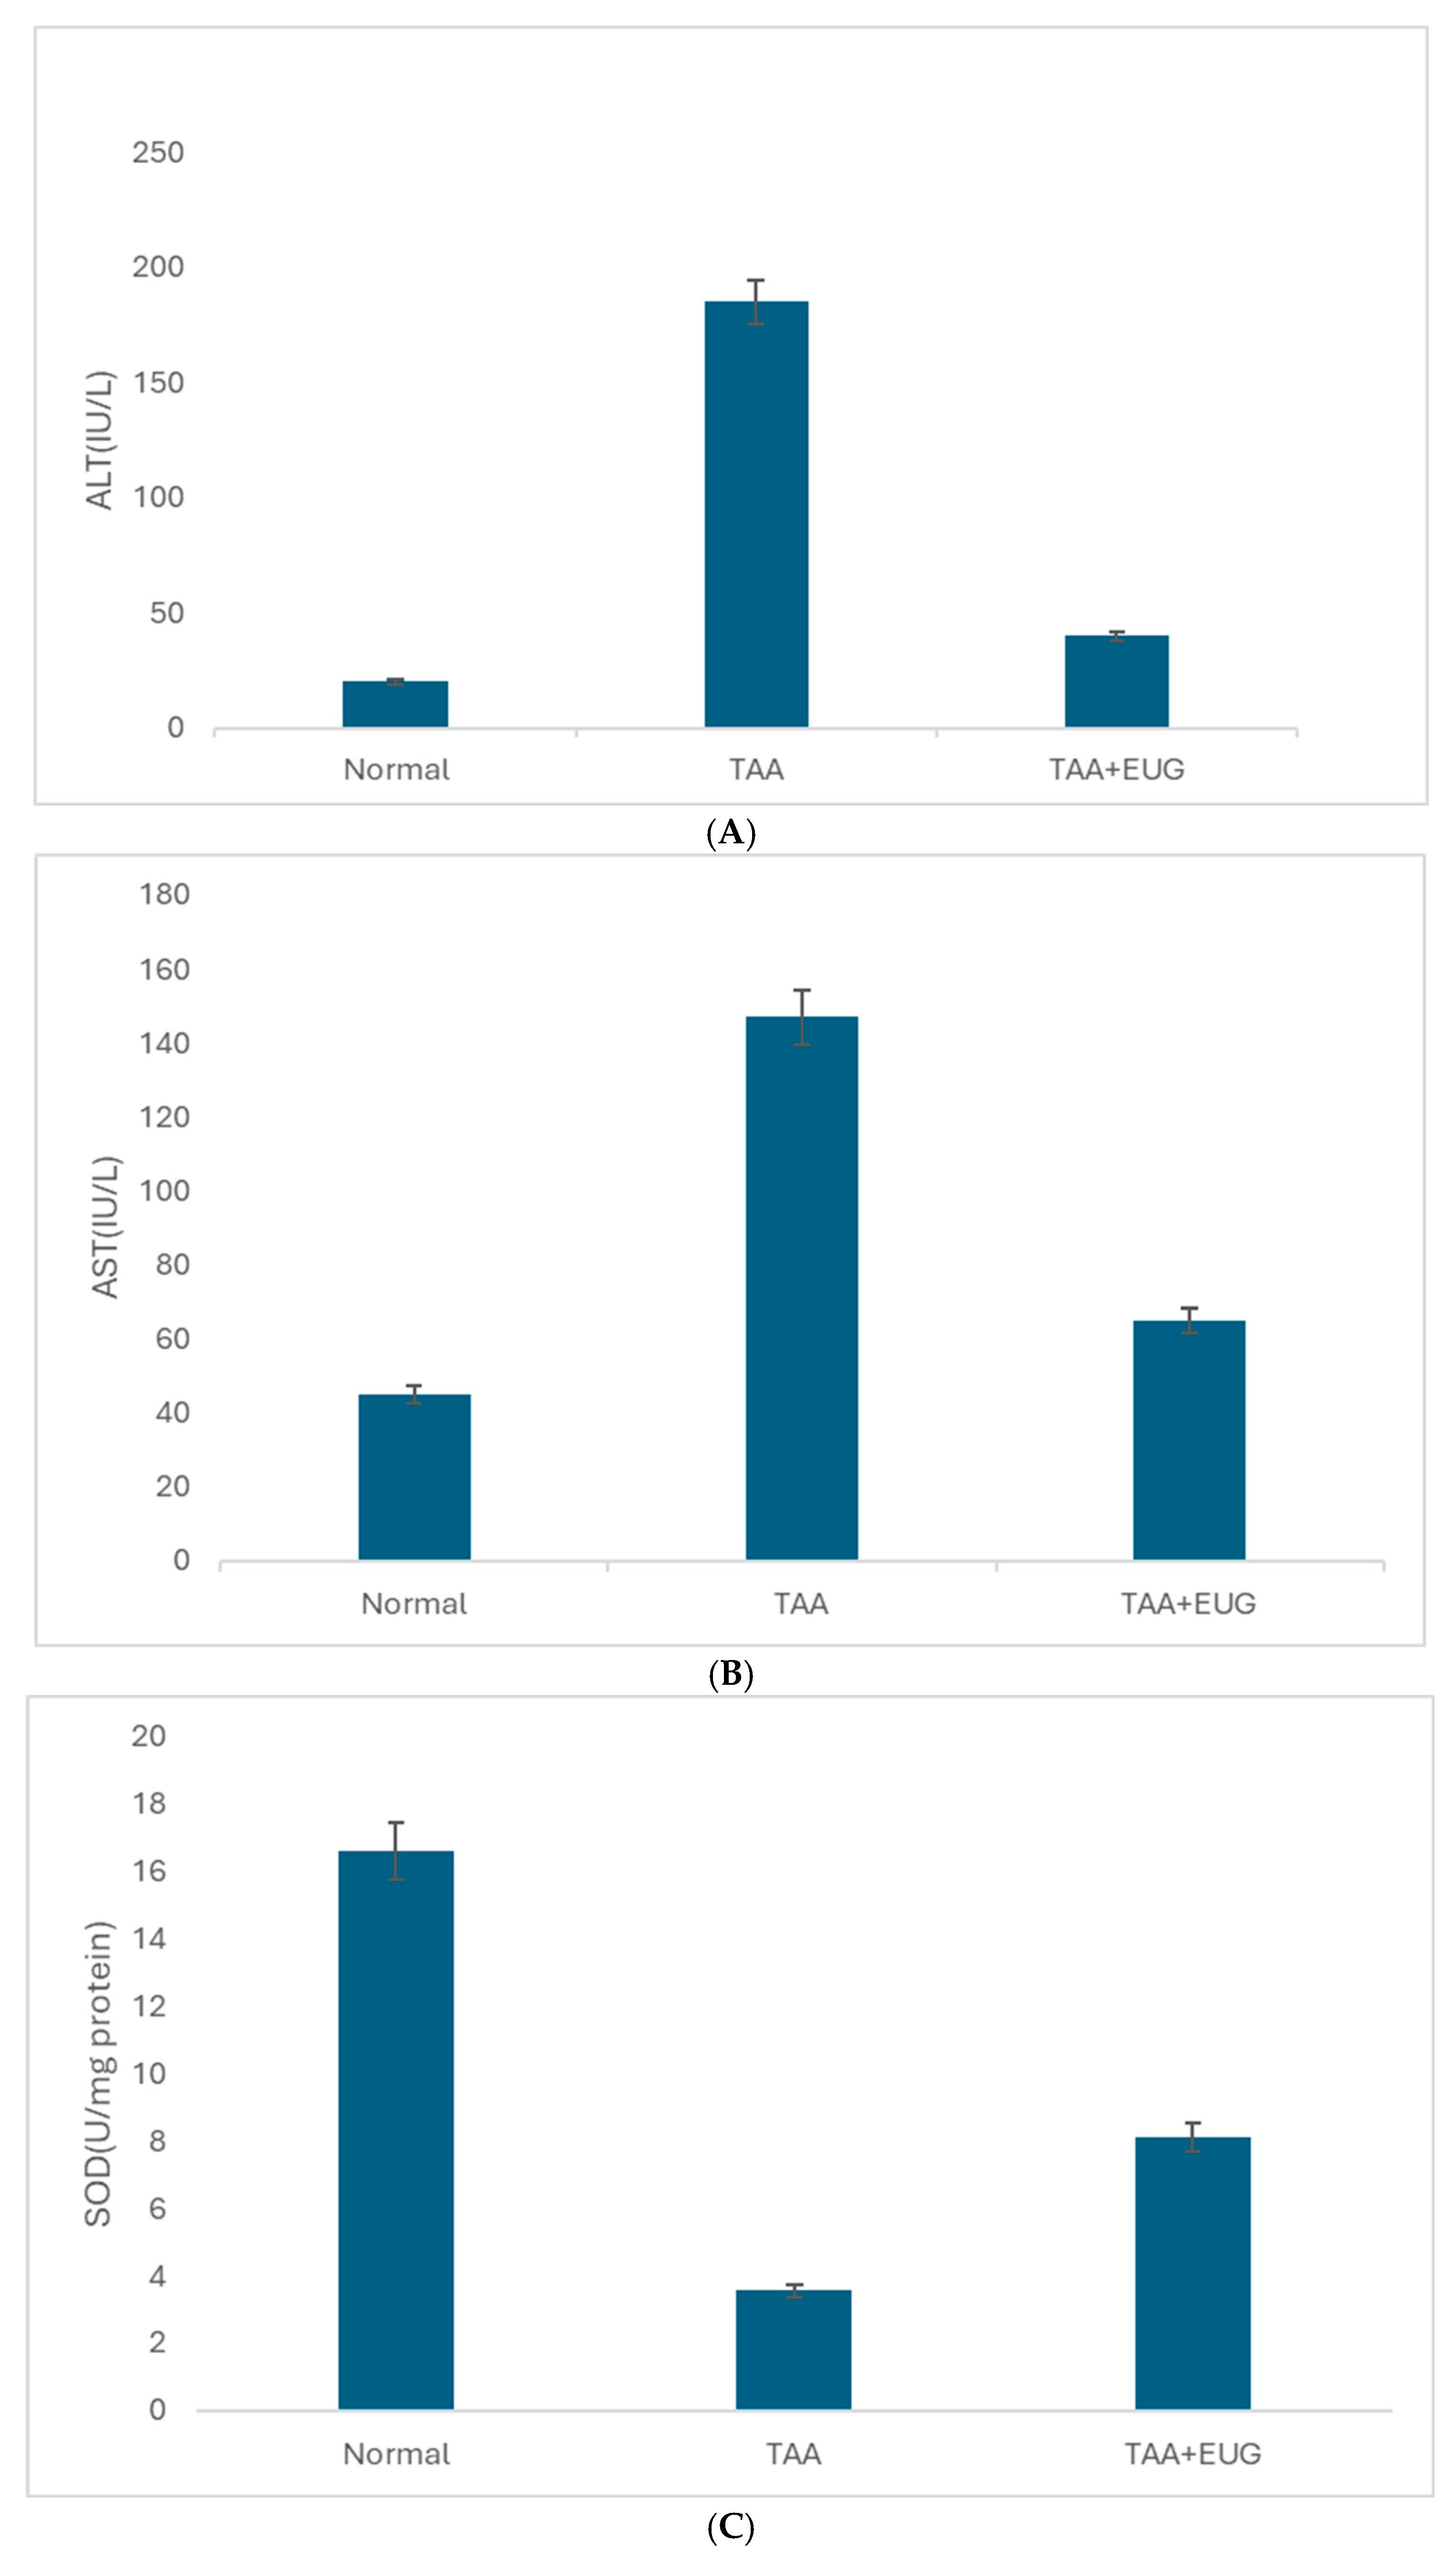
2.2. ALT, AST, and SOD Results
2.3. Metabolomics Quality Control Results
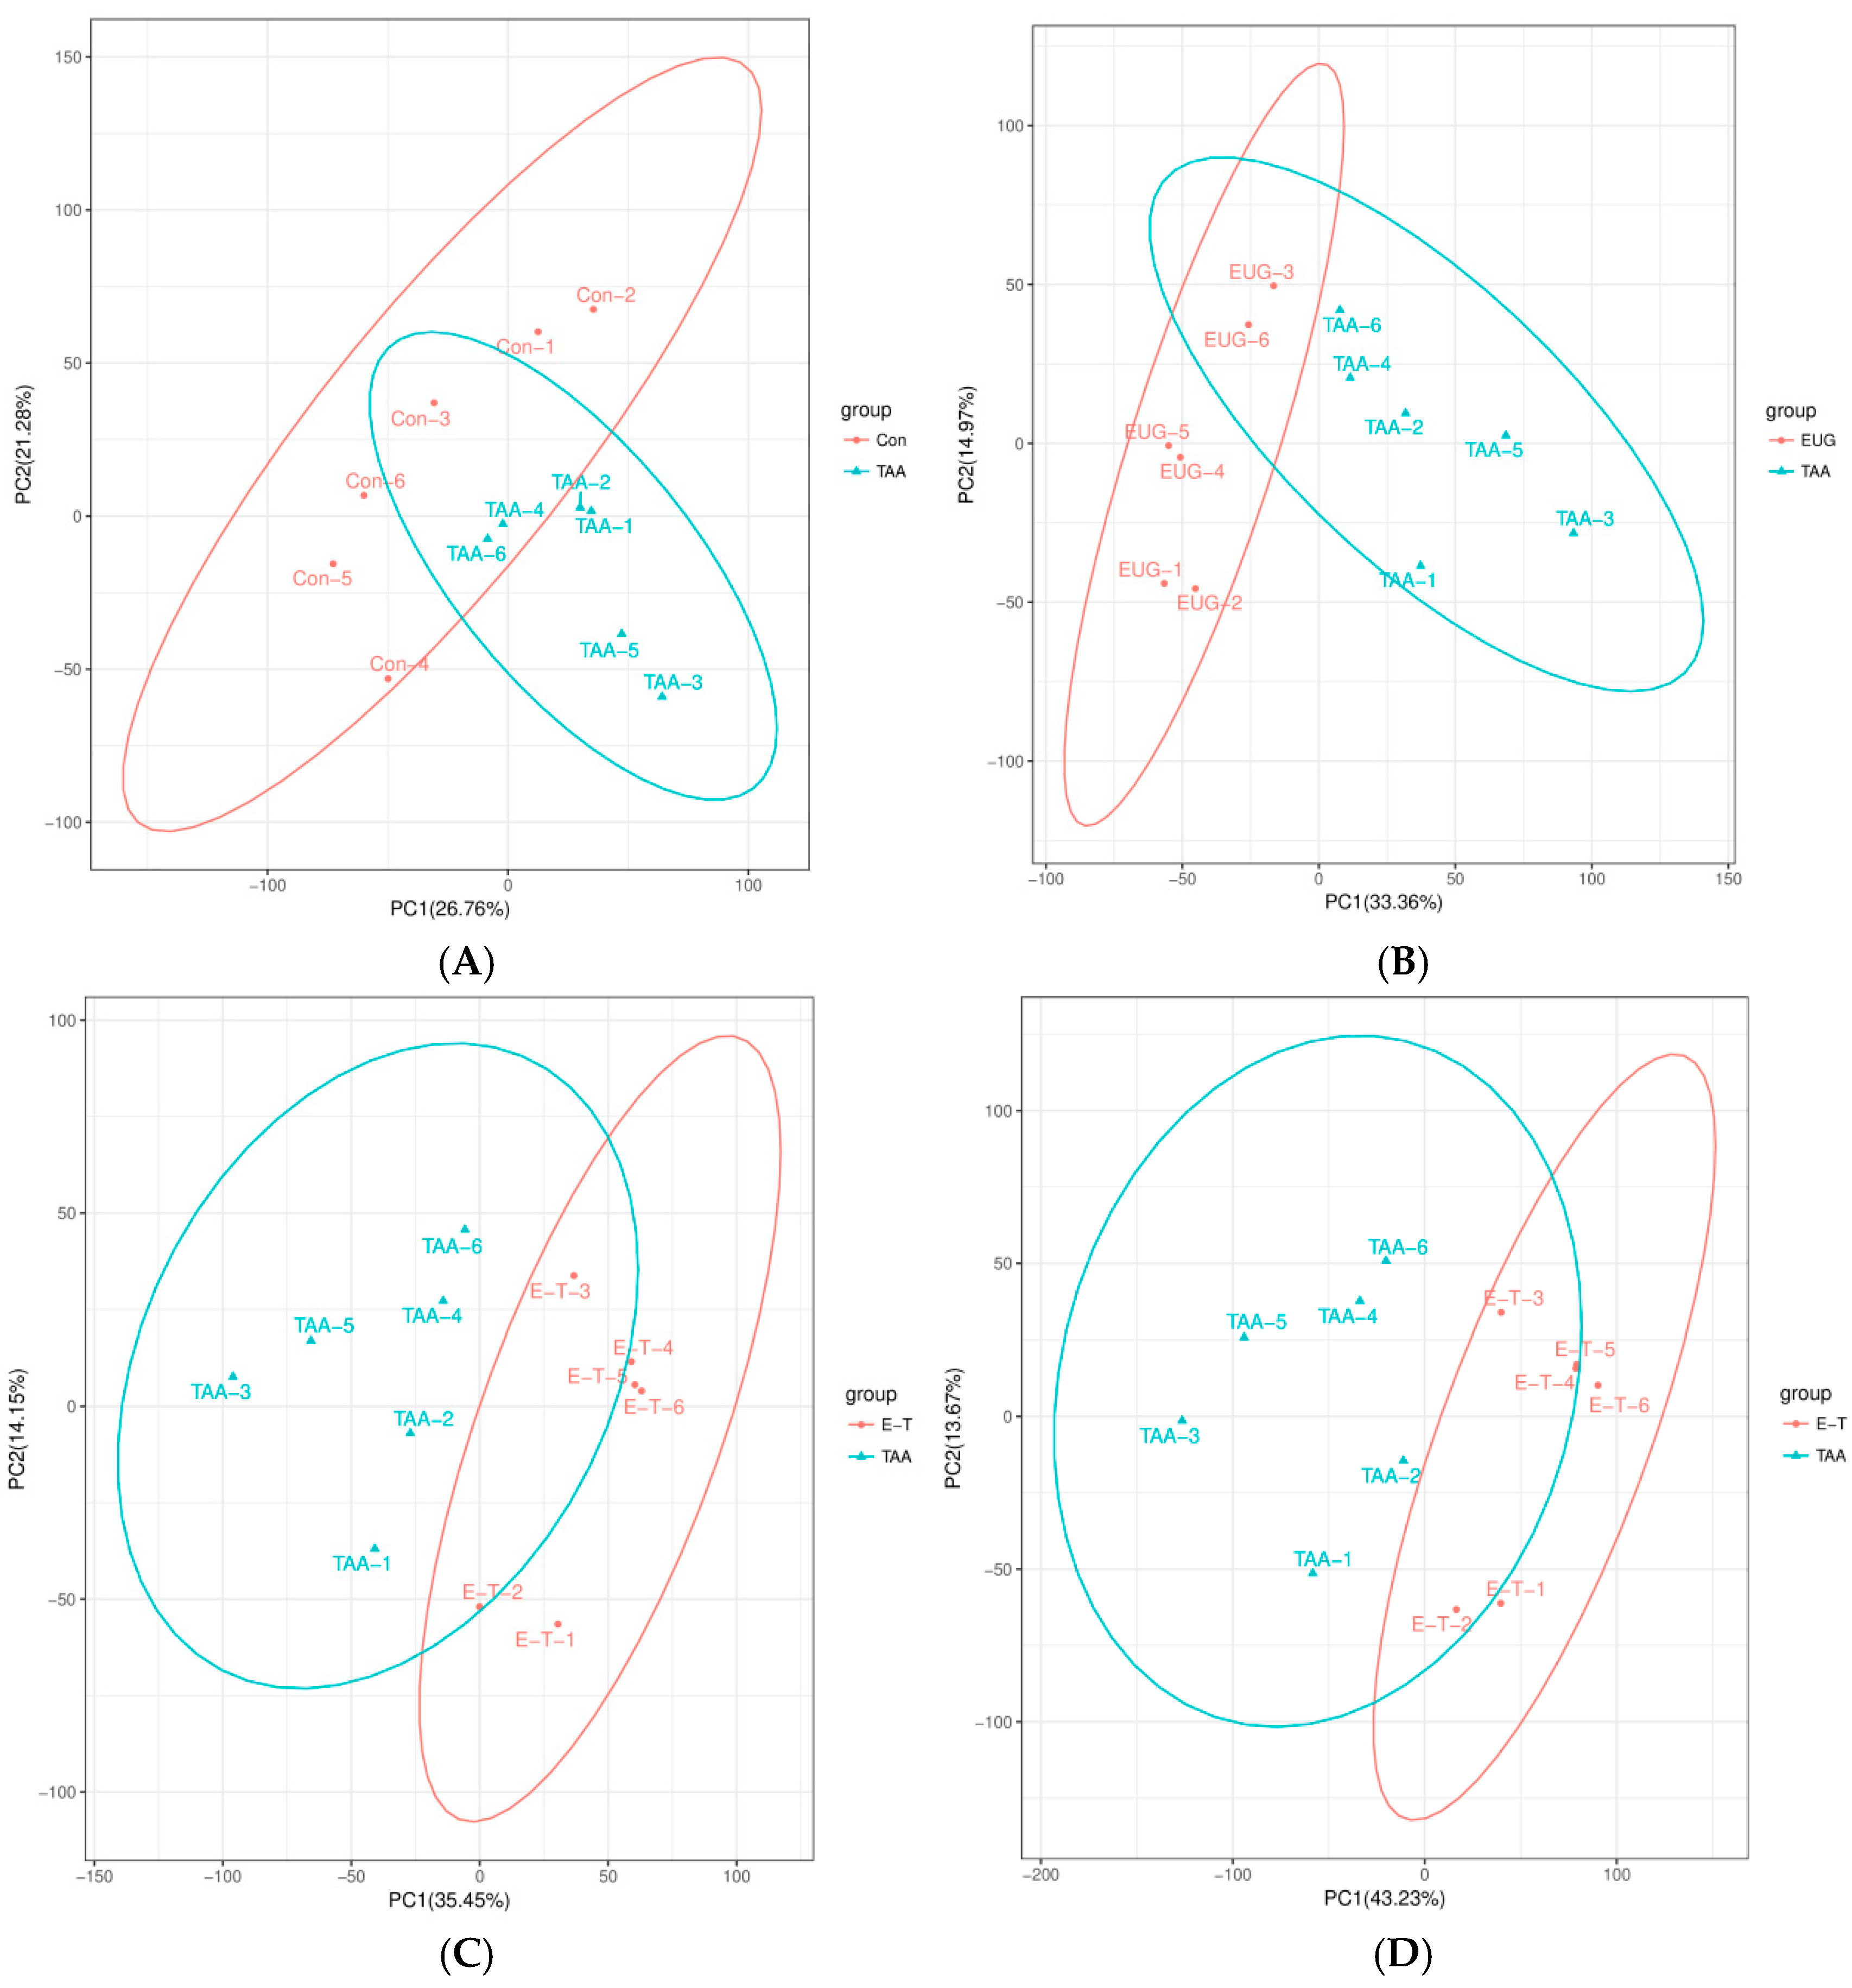
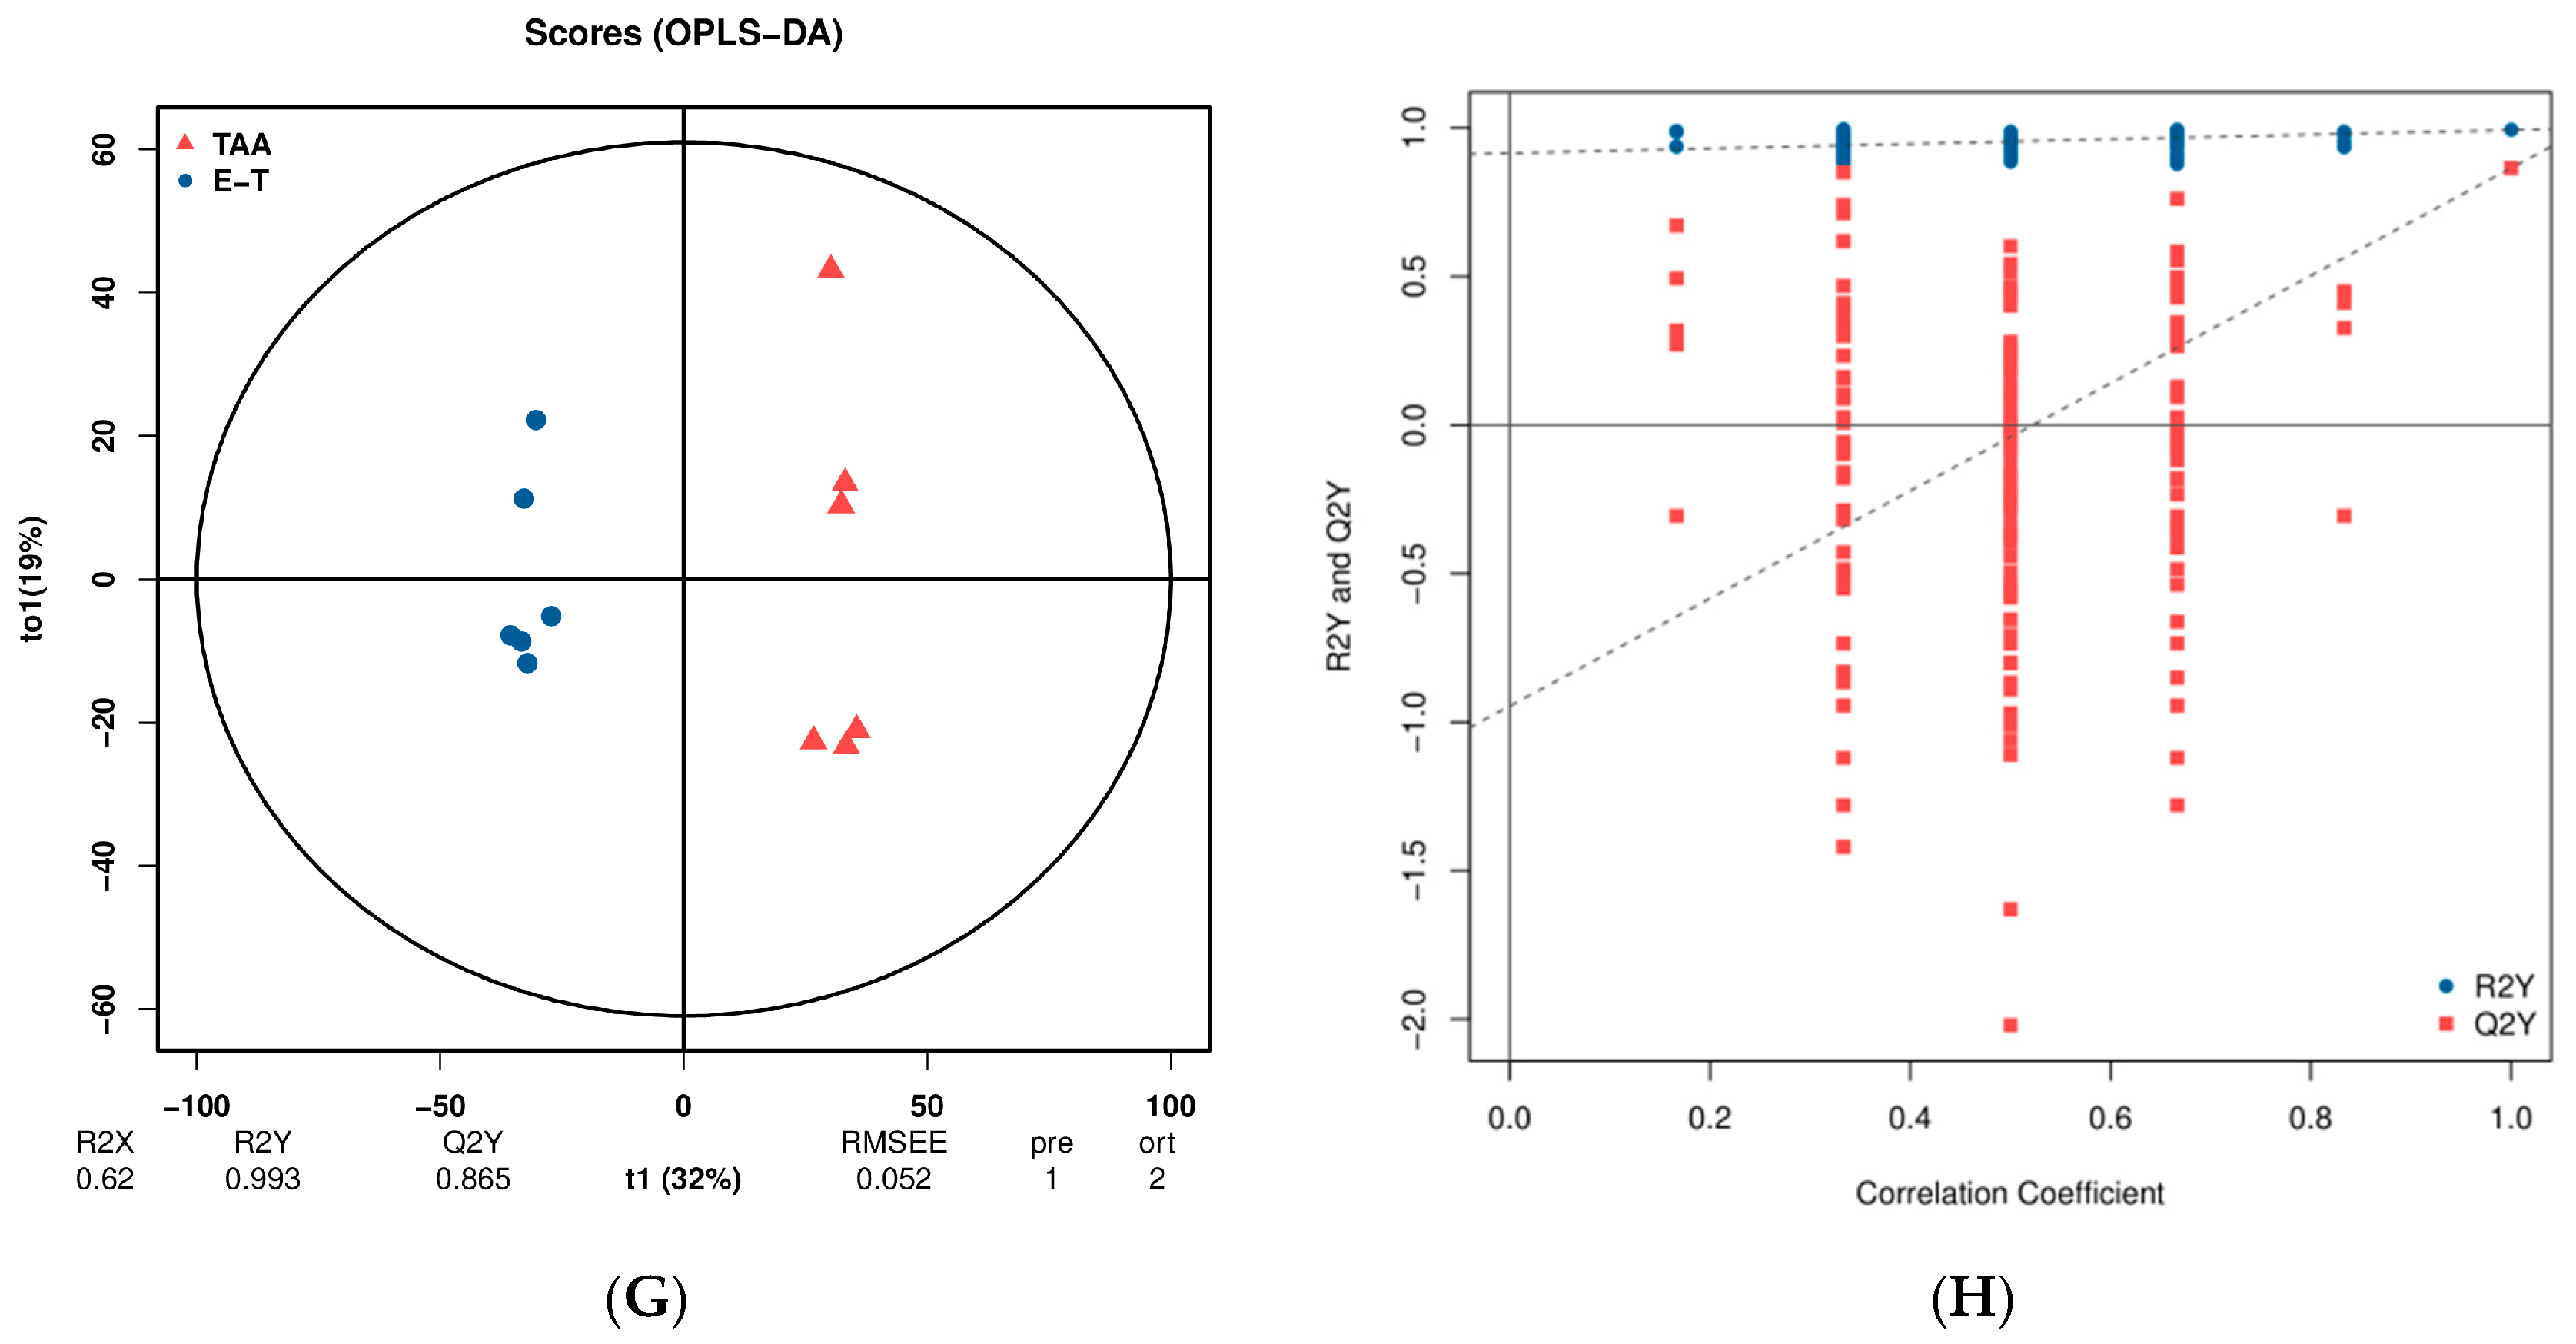
2.4. PCA and OPLS-DA Results
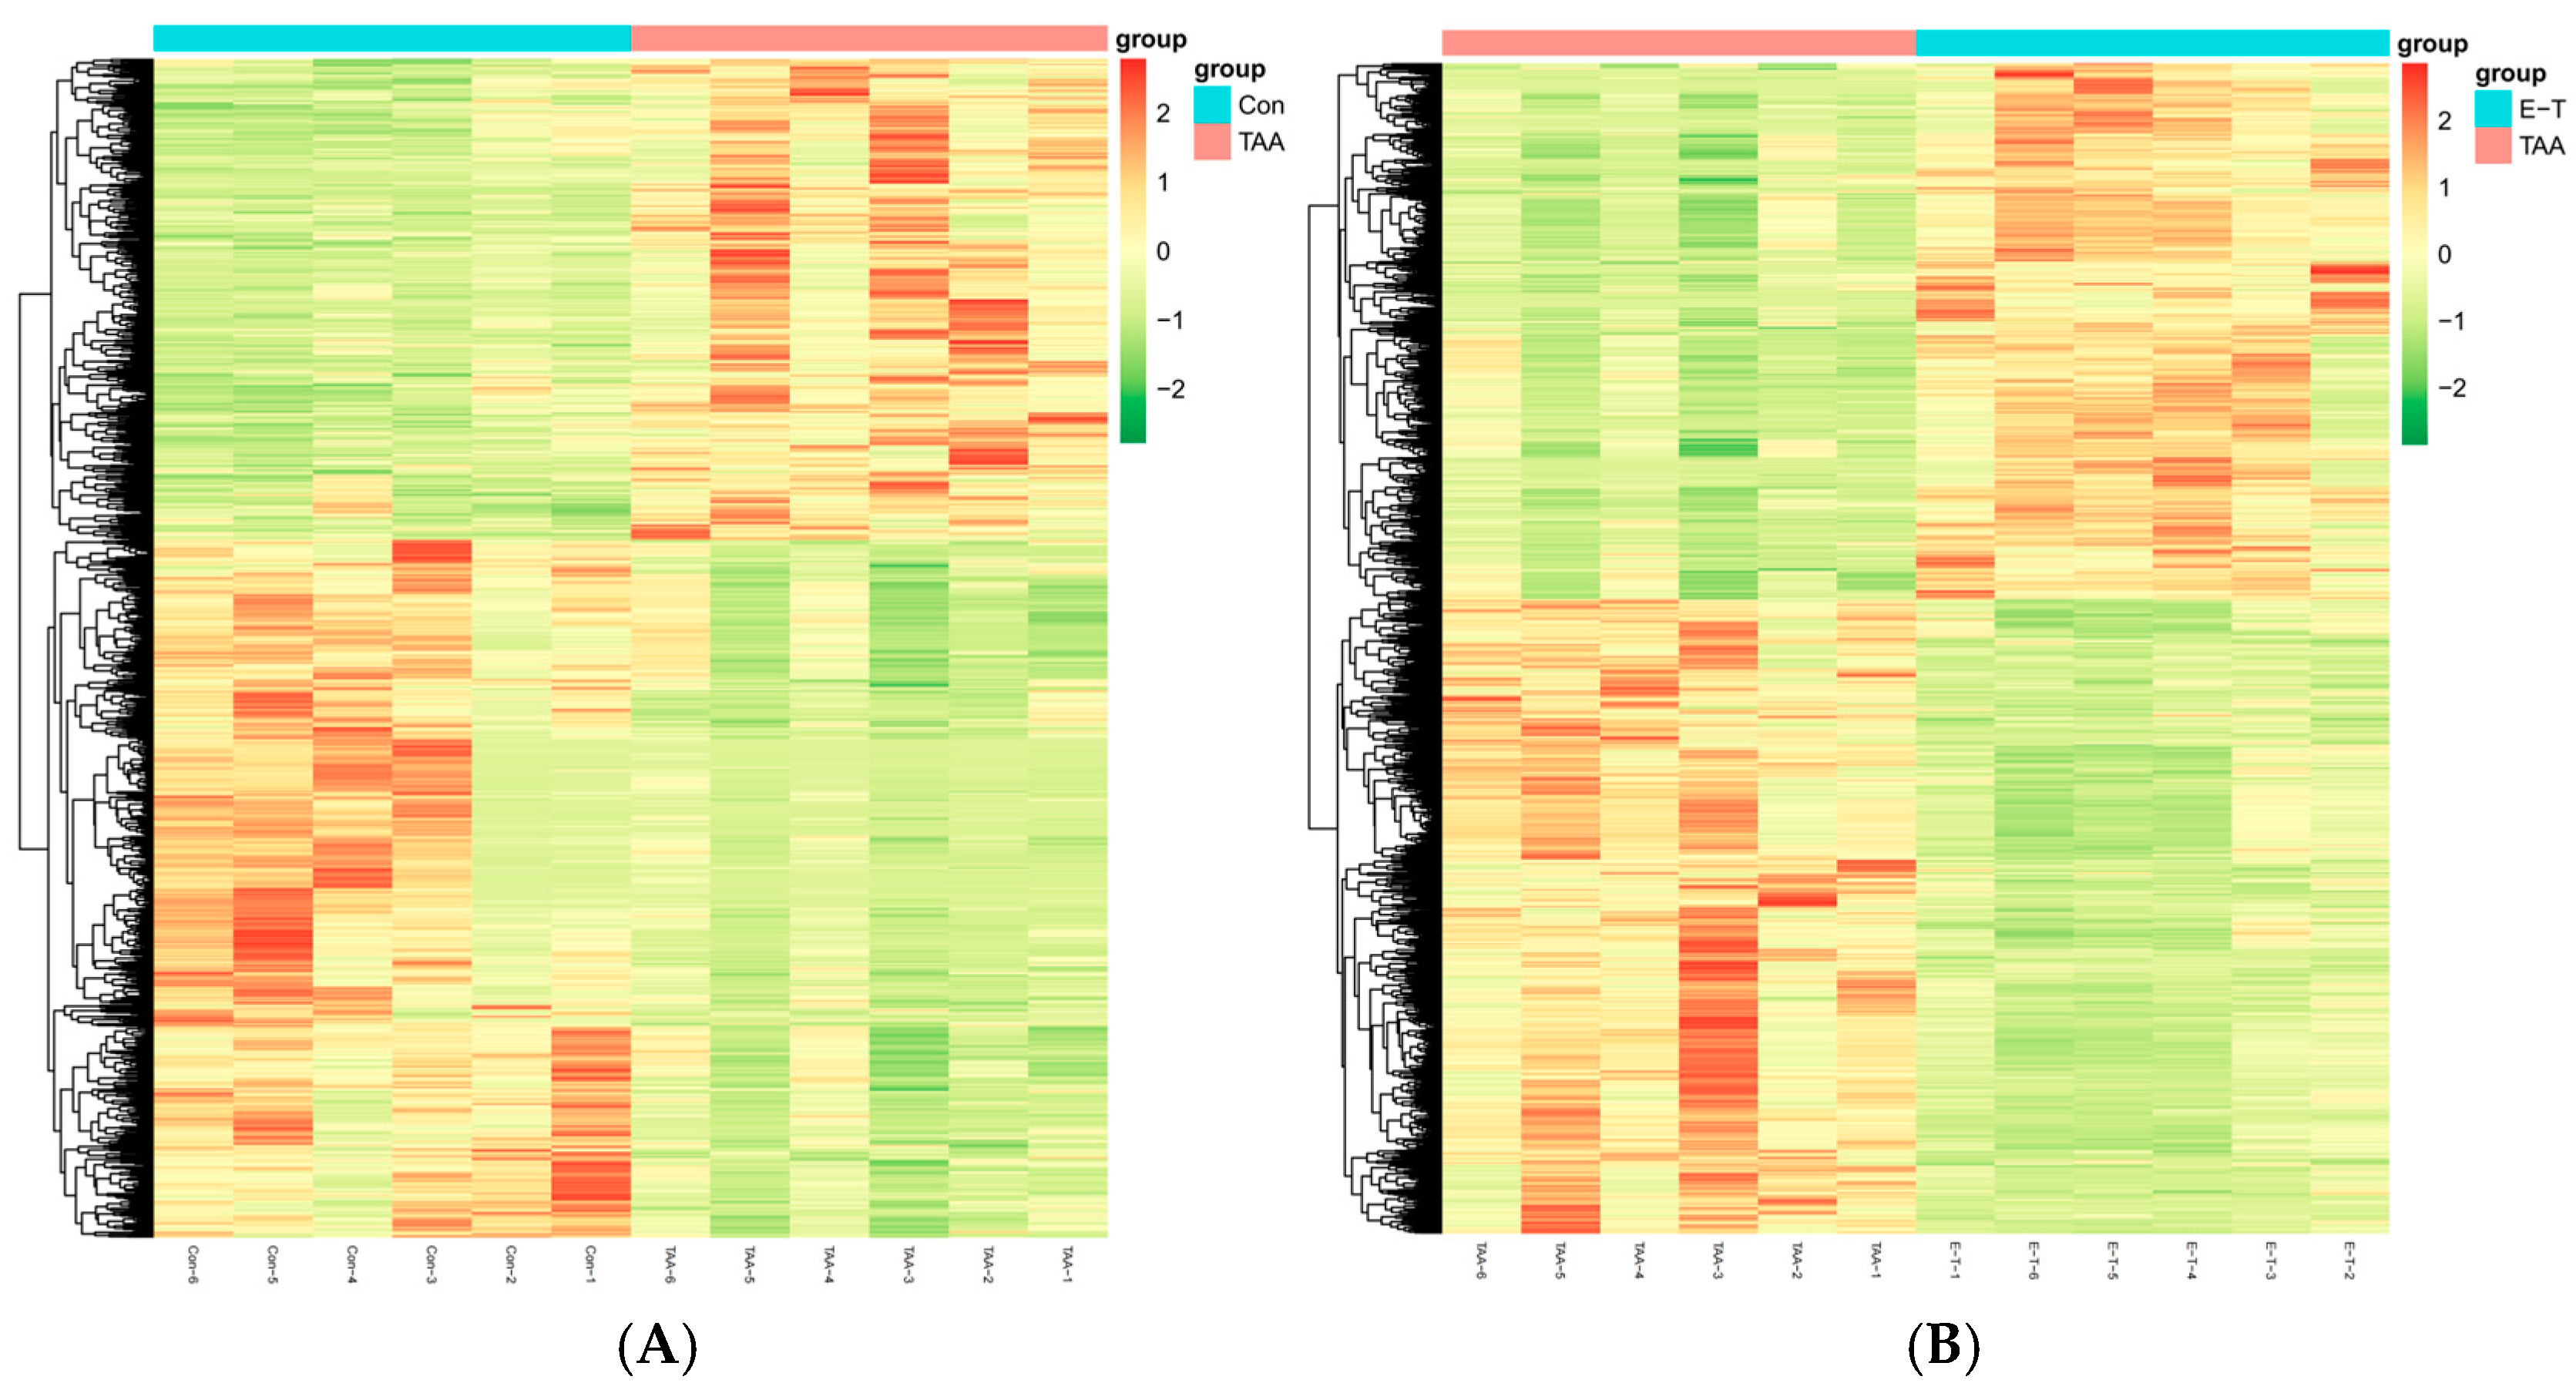
2.5. Differential Expressed Metabolites
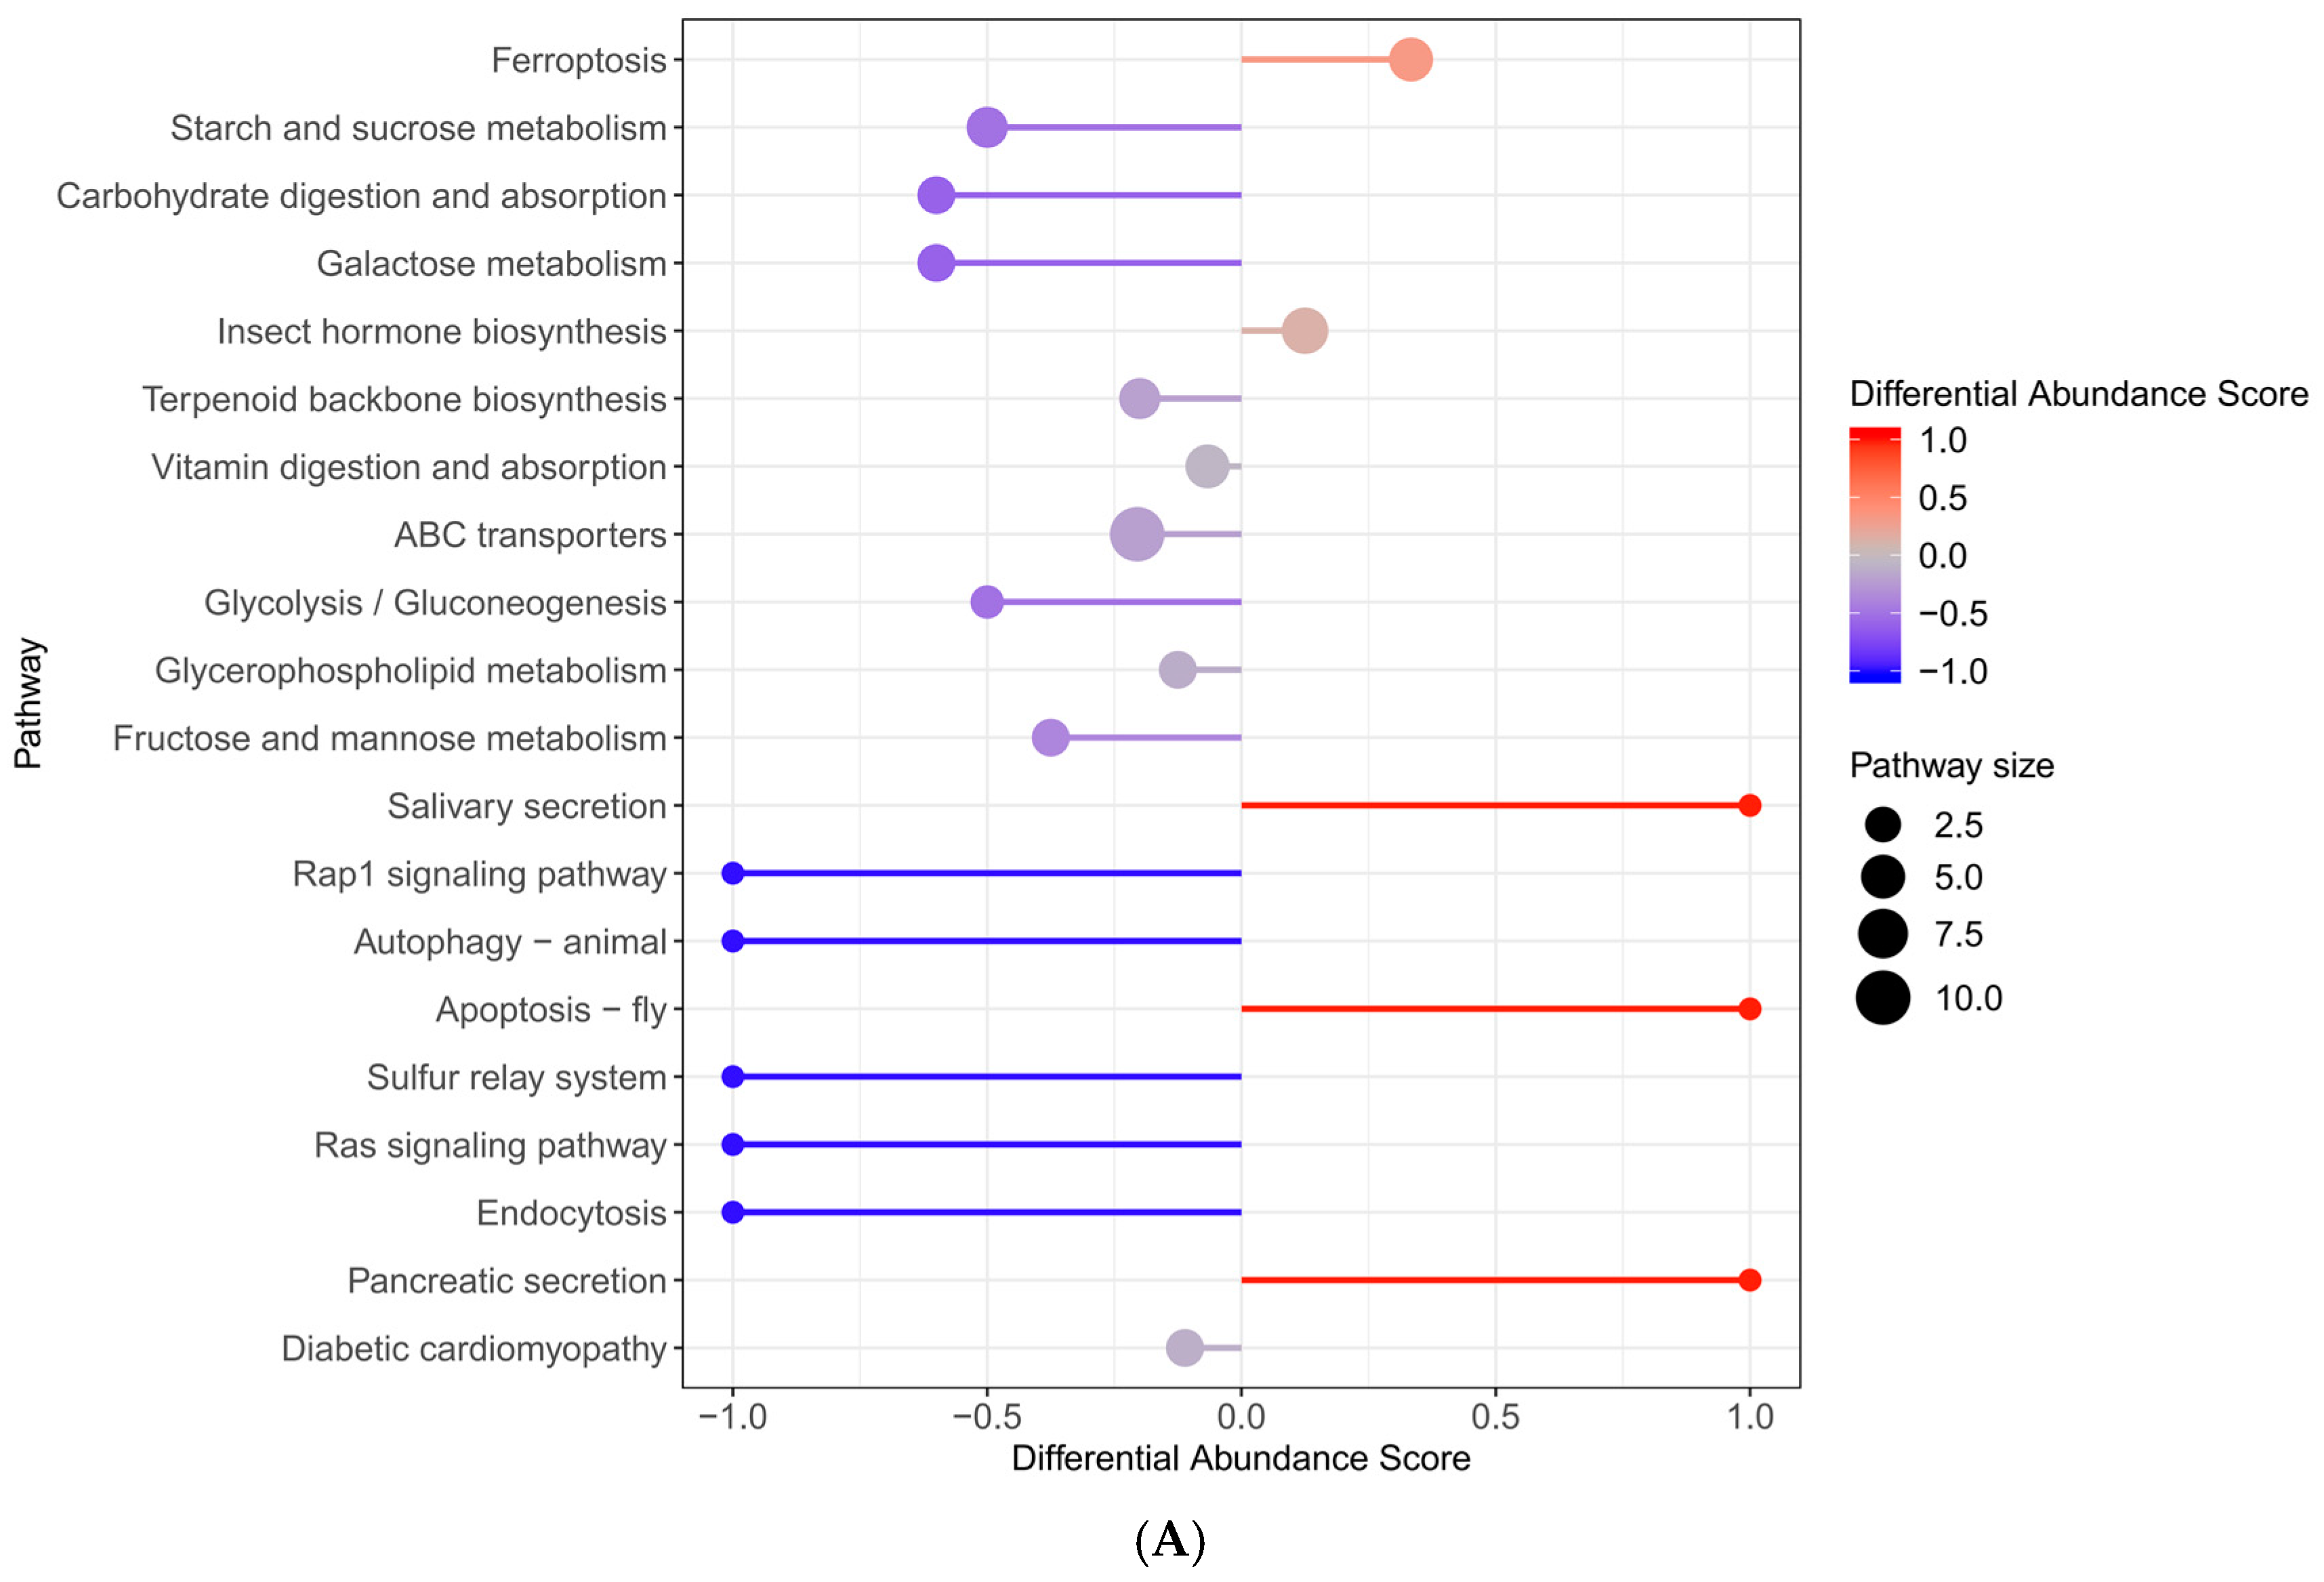
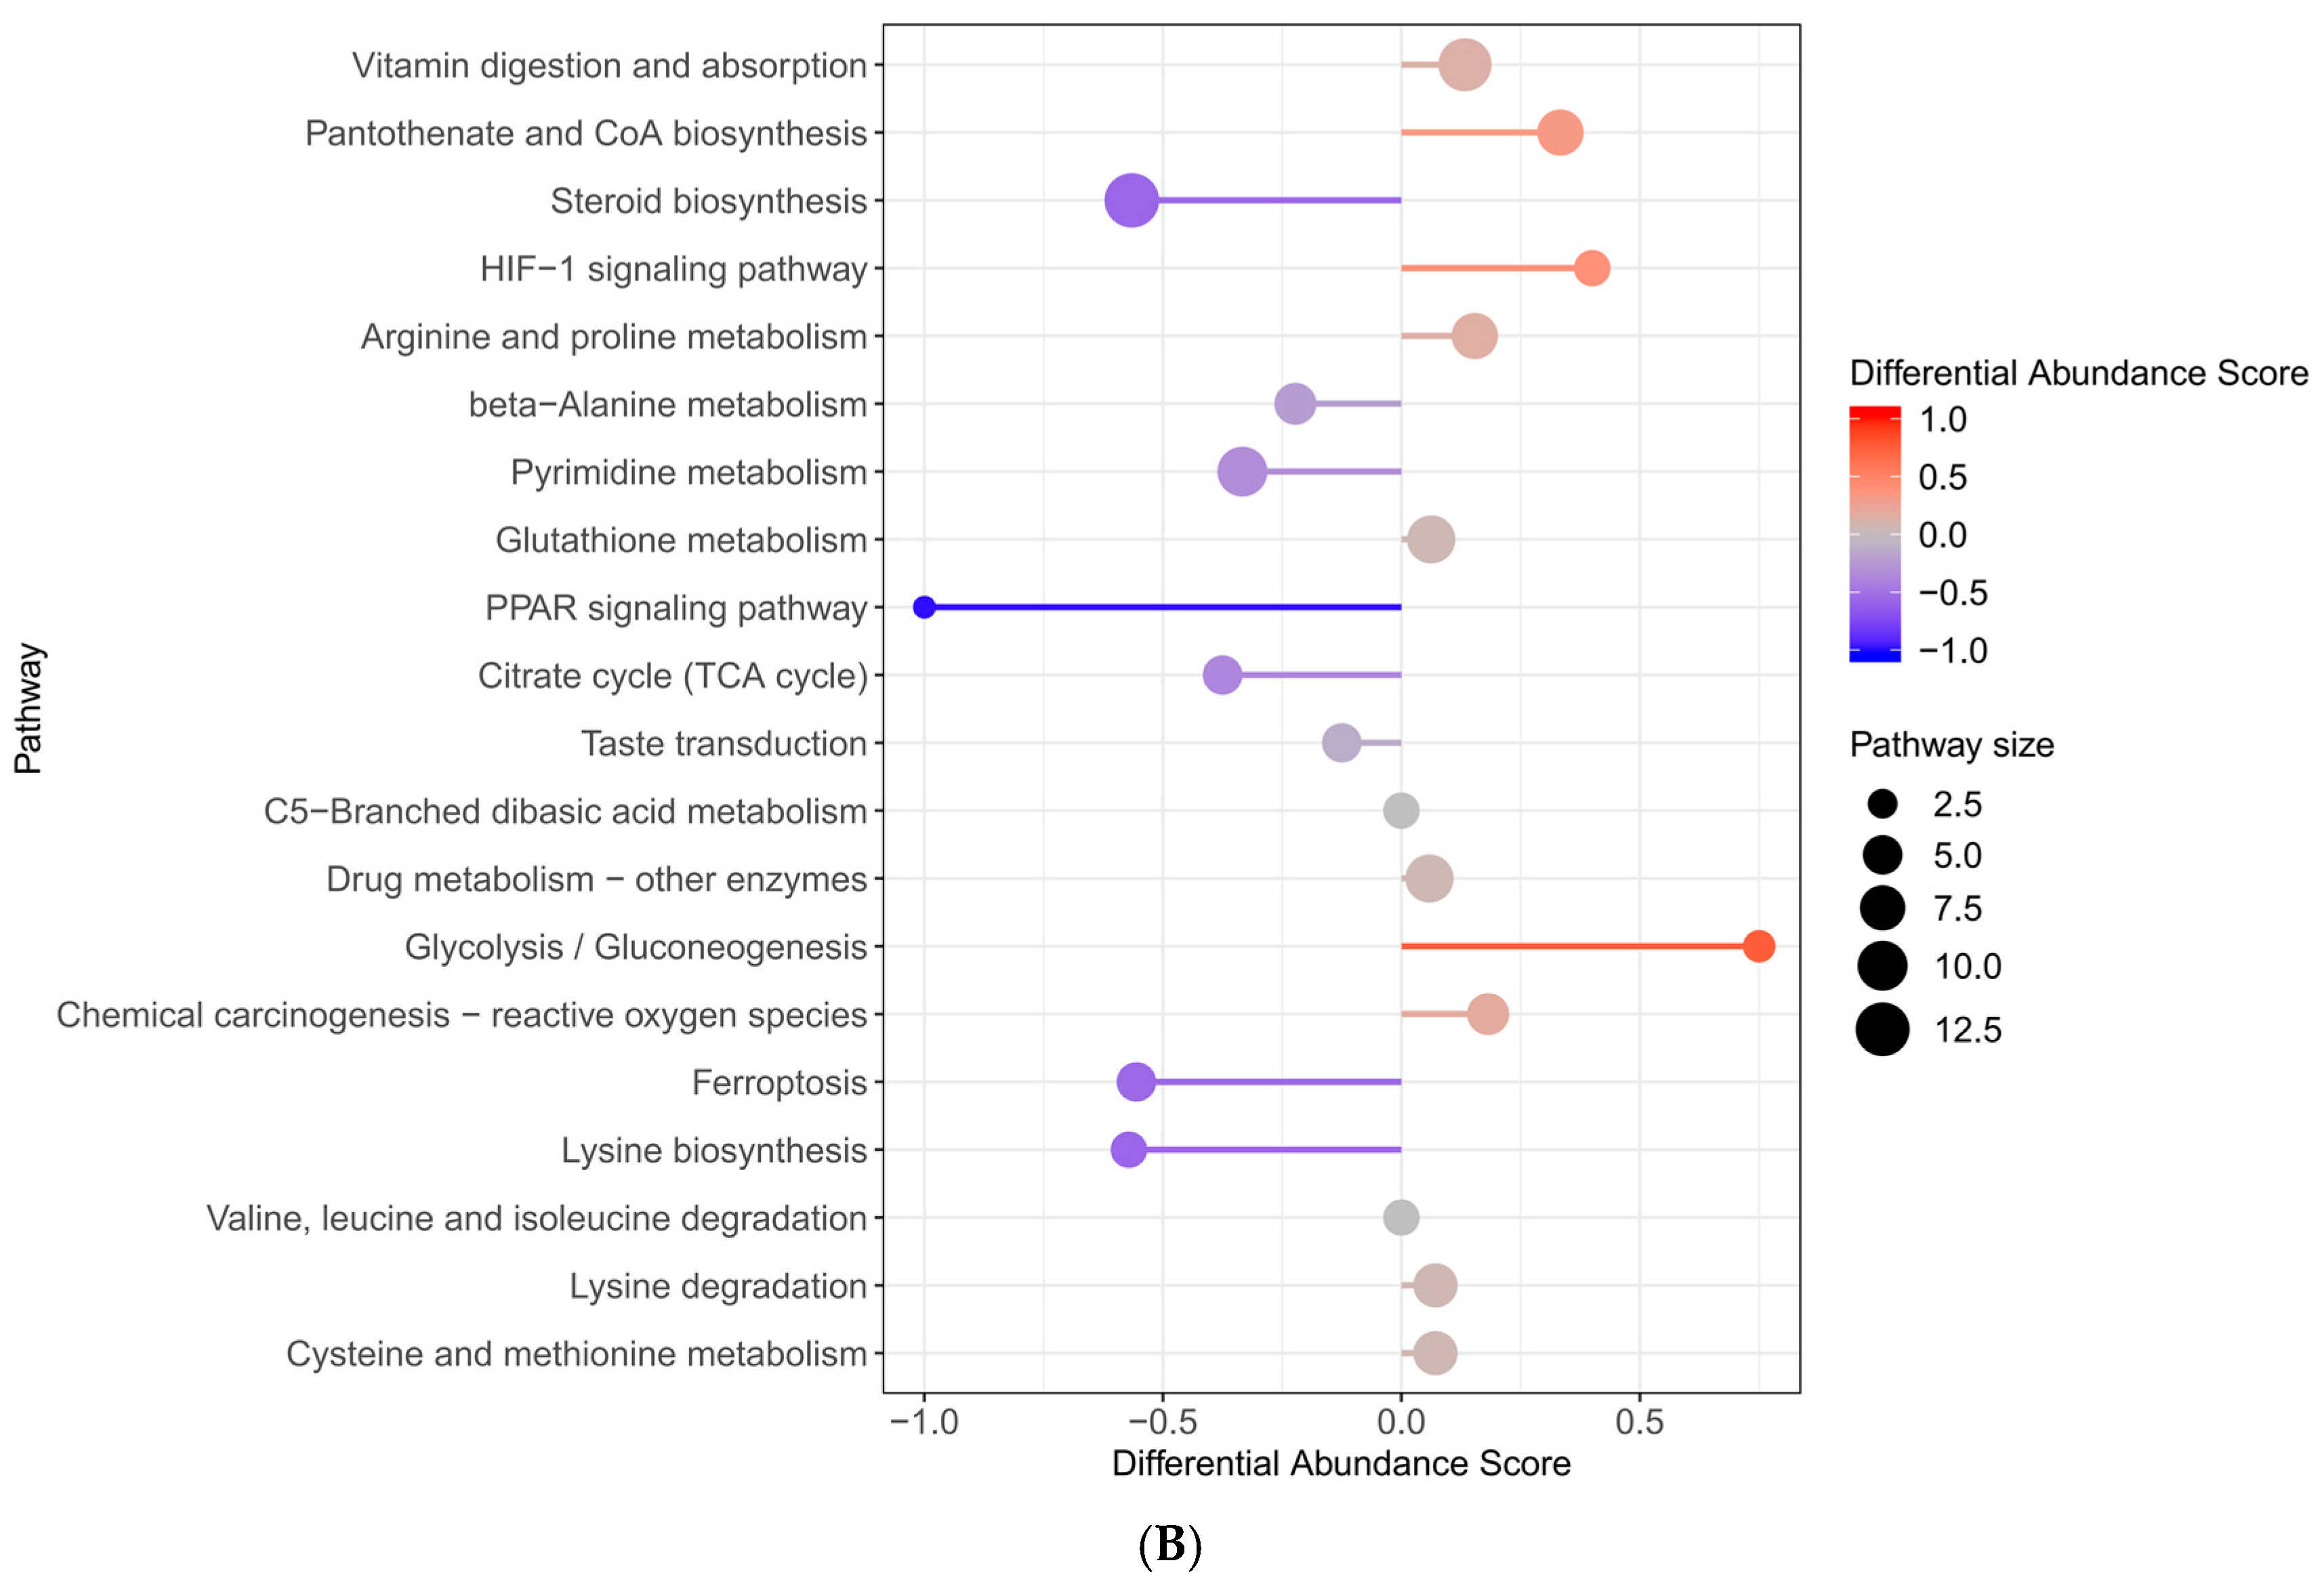
2.6. Enrichment of KEGG Pathway
3. Discussion
4. Materials and Methods
4.1. Chemicals and Reagents
4.2. Animals Grouping
4.3. Metabolomics
4.3.1. Metabolites Extraction
4.3.2. LC-MS/MS Analysis, Data Preprocessing
4.3.3. Data Analysis
4.4. Hematoxylin and Eosin (H&E) Staining
4.5. SOD, ALT and AST
4.6. Statistical Analysis
5. Conclusions
Supplementary Materials
Author Contributions
Funding
Institutional Review Board Statement
Informed Consent Statement
Data Availability Statement
Conflicts of Interest
References
- Xiao, J.; Wang, F.; Wong, N.K.; He, J.; Zhang, R.; Sun, R.; Xu, Y.; Liu, Y.; Li, W.; Koike, K.; et al. Global liver disease burdens and research trends: Analysis from a Chinese perspective. J. Hepatol. 2019, 71, 212–221. [Google Scholar] [CrossRef] [PubMed]
- Wang, F.S.; Fan, J.G.; Zhang, Z.; Gao, B.; Wang, H.Y. The global burden of liver disease: The major impact of China. Hepatology 2014, 60, 2099–2108. [Google Scholar] [CrossRef] [PubMed] [PubMed Central]
- Jaeschke, H.; Akakpo, J.Y.; Umbaugh, D.S.; Ramachandran, A. Novel Therapeutic Approaches Against Acetaminophen-induced Liver Injury and Acute Liver Failure. Toxicol. Sci. 2020, 174, 159–167. [Google Scholar] [CrossRef] [PubMed] [PubMed Central]
- Batiha, G.E.; Alkazmi, L.M.; Wasef, L.G.; Beshbishy, A.M.; Nadwa, E.H.; Rashwan, E.K. Syzygium aromaticum L. (Myrtaceae): Traditional Uses, Bioactive Chemical Constituents, Pharmacological and Toxicological Activities. Biomolecules 2020, 10, 202. [Google Scholar] [CrossRef]
- Ulanowska, M.; Olas, B. Biological Properties and Prospects for the Application of Eugenol-A Review. Int. J. Mol. Sci. 2021, 22, 3671. [Google Scholar] [CrossRef] [PubMed] [PubMed Central]
- Barboza, J.N.; da Silva Maia Bezerra Filho, C.; Silva, R.O.; Medeiros, J.V.R.; de Sousa, D.P. An Overview on the Anti-inflammatory Potential and Antioxidant Profile of Eugenol. Oxid. Med. Cell Longev. 2018, 2018, 3957262. [Google Scholar] [CrossRef] [PubMed] [PubMed Central]
- Marchese, A.; Barbieri, R.; Coppo, E.; Orhan, I.E.; Daglia, M.; Nabavi, S.F.; Izadi, M.; Abdollahi, M.; Nabavi, S.M.; Ajami, M. Antimicrobial activity of eugenol and essential oils containing eugenol: A mechanistic viewpoint. Crit. Rev. Microbiol. 2017, 43, 668–689. [Google Scholar] [CrossRef] [PubMed]
- Ali, S.; Prasad, R.; Mahmood, A.; Routray, I.; Shinkafi, T.S.; Sahin, K.; Kucuk, O. Eugenol-rich Fraction of Syzygium aromaticum (Clove) Reverses Biochemical and Histopathological Changes in Liver Cirrhosis and Inhibits Hepatic Cell Proliferation. J. Cancer Prev. 2014, 19, 288–300. [Google Scholar] [CrossRef] [PubMed] [PubMed Central]
- Porto Mde, P.; da Silva, G.N.; Luperini, B.C.; Bachiega, T.F.; de Castro Marcondes, J.P.; Sforcin, J.M.; Salvadori, D.M. Citral and eugenol modulate DNA damage and pro-inflammatory mediator genes in murine peritoneal macrophages. Mol. Biol. Rep. 2014, 41, 7043–7051. [Google Scholar] [CrossRef] [PubMed]
- Kar Mahapatra, S.; Chakraborty, S.P.; Majumdar, S.; Bag, B.G.; Roy, S. Eugenol protects nicotine-induced superoxide mediated oxidative damage in murine peritoneal macrophages in vitro. Eur. J. Pharmacol. 2009, 623, 132–140. [Google Scholar] [CrossRef] [PubMed]
- Kim, S.S.; Oh, O.J.; Min, H.Y.; Park, E.J.; Kim, Y.; Park, H.J.; Nam Han, Y.; Lee, S.K. Eugenol suppresses cyclooxygenase-2 expression in lipopolysaccharide-stimulated mouse macrophage RAW264.7 cells. Life Sci. 2003, 73, 337–348. [Google Scholar] [CrossRef] [PubMed]
- Raghavenra, H.; Diwakr, B.T.; Lokesh, B.R.; Naidu, K.A. Eugenol--the active principle from cloves inhibits 5-lipoxygenase activity and leukotriene-C4 in human PMNL cells. Prostagland. Leukot. Essent. Fat. Acids. 2006, 74, 23–27. [Google Scholar] [CrossRef] [PubMed]
- Schrimpe-Rutledge, A.C.; Codreanu, S.G.; Sherrod, S.D.; McLean, J.A. Untargeted Metabolomics Strategies-Challenges and Emerging Directions. J. Am. Soc. Mass. Spectrom. 2016, 27, 1897–1905. [Google Scholar] [CrossRef] [PubMed] [PubMed Central]
- Wang, R.; Li, B.; Lam, S.M.; Shui, G. Integration of lipidomics and metabolomics for in-depth understanding of cellular mechanism and disease progression. J. Genet. Genom. 2020, 47, 69–83. [Google Scholar] [CrossRef] [PubMed]
- Shastry, A.; Dunham-Snary, K. Metabolomics and mitochondrial dysfunction in cardiometabolic disease. Life Sci. 2023, 333, 122137. [Google Scholar] [CrossRef] [PubMed]
- Zhang, F.; Mao, Y.; Qiao, H.; Jiang, H.; Zhao, H.; Chen, X.; Tong, L.; Sun, X. Protective effects of taurine against endotoxin-induced acute liver injury after hepatic ischemia reperfusion. Amino Acids 2010, 38, 237–245. [Google Scholar] [CrossRef] [PubMed]
- Chan, C.C.; Cheng, L.Y.; Lu, J.; Huang, Y.H.; Chiou, S.H.; Tsai, P.H.; Huo, T.I.; Lin, H.C.; Lee, F.Y. The role of interferon-γ inducible protein-10 in a mouse model of acute liver injury post induced pluripotent stem cells transplantation. PLoS ONE 2012, 7, e50577. [Google Scholar] [CrossRef] [PubMed] [PubMed Central]
- Singer, G.A.; Zielsdorf, S.; Fleetwood, V.A.; Alvey, N.; Cohen, E.; Eswaran, S.; Shah, N.; Chan, E.Y.; Hertl, M.; Fayek, S.A. Limited hepatitis B immunoglobulin with potent nucleos(t)ide analogue is a cost effective prophylaxis against hepatitis B virus after liver transplantation. Transpl. Proc. 2015, 47, 478–484. [Google Scholar] [CrossRef] [PubMed]
- Duan, Y.; Duan, J.; Feng, Y.; Huang, X.; Fan, W.; Wang, K.; Ouyang, P.; Deng, Y.; Du, Z.; Chen, D. Hepatoprotective Activity of Vitamin E and Metallothionein in Cadmium-Induced Liver Injury in Ctenopharyngodon idellus. Oxid Med Cell Longev. 2018, 2018, 9506543. [Google Scholar] [CrossRef]
- Liu, Z.; Wang, M.; Wang, X.; Bu, Q.; Wang, Q.; Su, W.; Li, L.; Zhou, H.; Lu, L. XBP1 deficiency promotes hepatocyte pyroptosis by impairing mitophagy to activate mtDNA-cGAS-STING signaling in macrophages during acute liver injury. Redox Biol. 2022, 52, 102305. [Google Scholar] [CrossRef] [PubMed] [PubMed Central]
- Elnfarawy, A.A.; Nashy, A.E.; Abozaid, A.M.; Komber, I.F.; Elweshahy, R.H.; Abdelrahman, R.S. Vinpocetine attenuates thioacetamide-induced liver fibrosis in rats. Hum. Exp. Toxicol. 2021, 40, 355–368. [Google Scholar] [CrossRef] [PubMed]
- Enciso, N.; Amiel, J.; Fabián-Domínguez, F.; Pando, J.; Rojas, N.; Cisneros-Huamaní, C.; Nava, E.; Enciso, J. Model of Liver Fibrosis Induction by Thioacetamide in Rats for Regenerative Therapy Studies. Anal. Cell Pathol. 2022, 2022, 2841894. [Google Scholar] [CrossRef] [PubMed] [PubMed Central]
- Nishi, K.; Yagi, H.; Ohtomo, M.; Nagata, S.; Udagawa, D.; Tsuchida, T.; Morisaku, T.; Kitagawa, Y. A thioacetamide-induced liver fibrosis model for pre-clinical studies in microminipig. Sci. Rep. 2023, 13, 14996. [Google Scholar] [CrossRef] [PubMed] [PubMed Central]
- Ezhilarasan, D. Molecular mechanisms in thioacetamide-induced acute and chronic liver injury models. Env. Toxicol. Pharmacol. 2023, 99, 104093. [Google Scholar] [CrossRef] [PubMed]
- Ta, N.; Erdunduleng, E.; Qi, R.; Mu, X.; Feng, L.; Ba, G.; Li, Y.; Zhang, J.; Bai, L.; Fu, M. Metabolomics analysis reveals amelioration effects of yellowhorn tea extract on hyperlipidemia, inflammation, and oxidative stress in high-fat diet-fed mice. Front. Nutr. 2023, 10, 1087256. [Google Scholar] [CrossRef]
- Xiao, G.; Xu, A.; Jiang, J.; Chen, Z.; Li, Y.; Li, S.; Chen, W.; Zhang, J.; Jia, C.; Zeng, Z.; et al. Metabolomics analysis delineates the therapeutic effects of Yinlan Tiaozhi capsule on triton WR-1339 -induced hyperlipidemia in mice. Front. Pharmacol. 2023, 14, 1252146. [Google Scholar] [CrossRef]
- Luo, D.; Chen, K.; Li, J.; Fang, Z.; Pang, H.; Yin, Y.; Rong, X.; Guo, J. Gut microbiota combined with metabolomics reveals the metabolic profile of the normal aging process and the anti-aging effect of FuFang Zhenshu TiaoZhi(FTZ) in mice. Biomed. Pharmacother. 2020, 121, 109550. [Google Scholar] [CrossRef] [PubMed]
- Shin, M.R.; Lee, J.A.; Kim, M.; Lee, S.; Oh, M.; Moon, J.; Nam, J.W.; Choi, H.; Mun, Y.J.; Roh, S.S. Gardeniae Fructus Attenuates Thioacetamide-Induced Liver Fibrosis in Mice via Both AMPK/SIRT1/NF-κB Pathway and Nrf2 Signaling. Antioxidants 2021, 10, 1837. [Google Scholar] [CrossRef] [PubMed] [PubMed Central]
- da Silva, B.S.; Paulino, A.M.B.; Taffarel, M.; Borba, I.G.; Telles, L.O.; Lima, V.V.; Aguiar, D.H.; Dias, M.C.; Nascimento, A.F.; Sinhorin, V.D.G.; et al. High sucrose diet attenuates oxidative stress, inflammation and liver injury in thioacetamide-induced liver cirrhosis. Life Sci. 2021, 267, 118944. [Google Scholar] [CrossRef] [PubMed]
- Radhakrishnan, A.; Tudawe, D.; Chakravarthi, S.; Chiew, G.S.; Haleagrahara, N. Effect of γ-tocotrienol in counteracting oxidative stress and joint damage in collagen-induced arthritis in rats. Exp. Ther. Med. 2014, 7, 1408–1414. [Google Scholar] [CrossRef] [PubMed] [PubMed Central]
- Sies, H. Oxidative stress: Oxidants and antioxidants. Exp. Physiol. 1997, 82, 291–295. [Google Scholar] [CrossRef] [PubMed]
- Qu, Y.; Liu, Z.; Chen, S. Study on Antioxidant Activity of Octopamine and Its Derivatives. Nat. Prod. Res. Dev. 2015, 27, 255–258. [Google Scholar]
- Chniguir, A.; Saguem, M.H.; Dang, P.M.; El-Benna, J.; Bachoual, R. Eugenol Inhibits Neutrophils Myeloperoxidase In Vitro and Attenuates LPS-Induced Lung Inflammation in Mice. Pharmaceuticals 2024, 17, 504. [Google Scholar] [CrossRef] [PubMed] [PubMed Central]
- Bezerra, D.P.; Militão, G.C.G.; de Morais, M.C.; de Sousa, D.P. The Dual Antioxidant/Prooxidant Effect of Eugenol and Its Action in Cancer Development and Treatment. Nutrients 2017, 9, 1367. [Google Scholar] [CrossRef] [PubMed] [PubMed Central]
- Guo, H.; Wang, G.; Huang, W.; Li, L.; Bai, Y.; Wang, H.; Gao, L. The Mechanism of Hepatic Encephalopathy Induced by Thioacetamide Based on Metabolomics and Proteomics: A Preliminary Study. Int. J. Mol. Sci. 2023, 25, 284. [Google Scholar] [CrossRef] [PubMed] [PubMed Central]


| No. | Name | p Value | VIP | Trend | KEGG_Pathway_Annotation |
|---|---|---|---|---|---|
| 1 | 4-Hydroxy-l-threonine | 0.046 | 1.366 | up | Vitamin B6 metabolism (ko00750) |
| 2 | l-Isoleucine | 0.013 | 1.605 | down | Valine, leucine, and isoleucine degradation (ko00280); Valine, leucine, and isoleucine biosynthesis (ko00290) |
| 3 | Vitamin K1 | 0.002 | 1.931 | up | Vitamin digestion and absorption (ko04977) |
| 4 | 2-Phytyl-1,4-naphthoquinone | 0.005 | 1.993 | up | Ubiquinone and other terpenoid-quinone biosynthesis (ko00130); Biosynthesis of cofactors (ko01240) |
| 5 | alpha-Tocotrienol | 0.039 | 1.548 | down | Ubiquinone and other terpenoid-quinone biosynthesis (ko00130) |
| 6 | 4-Amino-5-hydroxymethyl-2-methylpyrimidine | 0.000 | 2.085 | down | Thiamine metabolism (ko00730) |
| 7 | Isopentenyl phosphate | 0.001 | 1.956 | down | Terpenoid backbone biosynthesis (ko00900) |
| 8 | 7alpha-Hydroxydehydroepiandrosterone | 0.030 | 1.581 | up | Steroid hormone biosynthesis (ko00140) |
| 9 | Cortolone | 0.012 | 1.766 | up | Steroid hormone biosynthesis (ko00140) |
| 10 | Retinol | 0.018 | 1.748 | down | Retinol metabolism (ko00830); Vitamin digestion and absorption (ko04977) |
| 11 | (R)-3-Amino-2-methylpropanoate | 0.029 | 1.550 | up | Pyrimidine metabolism (ko00240); Valine, leucine, and isoleucine degradation (ko00280) |
| 12 | GTP | 0.033 | 1.472 | down | Purine metabolism (ko00230); Riboflavin metabolism (ko00740) |
| 13 | Deoxyadenosine monophosphate | 0.044 | 1.398 | up | Purine metabolism (ko00230); Nucleotide metabolism (ko01232) |
| 14 | 1-(5-Phospho-d-ribosyl)-5-amino-4-imidazolecarboxylate | 0.027 | 1.473 | up | Purine metabolism (ko00230) |
| 15 | 3alpha,7alpha,12alpha,26-Tetrahydroxy-5beta-cholestane | 0.007 | 1.881 | up | Primary bile acid biosynthesis (ko00120) |
| 16 | 3alpha,7alpha,12alpha-Trihydroxy-5beta-cholestane | 0.034 | 1.477 | up | Primary bile acid biosynthesis (ko00120) |
| 17 | 3alpha,7alpha-Dihydroxy-5-cholestenoate | 0.037 | 1.414 | up | Primary bile acid biosynthesis (ko00120) |
| 18 | 7alpha-Hydroxy-3-oxo-4-cholestenoate | 0.000 | 2.275 | up | Primary bile acid biosynthesis (ko00120) |
| 19 | Biliverdin | 0.036 | 1.570 | down | Porphyrin metabolism (ko00860); Metabolic pathways (ko01100) |
| 20 | Oxidized glutathione | 0.044 | 1.490 | up | Glutathione metabolism (ko00480); Metabolic pathways (ko01100) |
| 21 | Trypanothione | 0.013 | 1.641 | down | Glutathione metabolism (ko00480); Metabolic pathways (ko01100) |
| 22 | Stachyose | 0.046 | 1.589 | down | Galactose metabolism (ko00052); Metabolic pathways (ko01100) |
| 23 | l-Rhamnulose | 0.016 | 1.711 | down | Fructose and mannose metabolism (ko00051); Metabolic pathways (ko01100) |
| 24 | Sepiapterin | 0.010 | 1.803 | up | Folate biosynthesis (ko00790); Metabolic pathways (ko01100) |
| 25 | 1-Octadecanoyl-2-(7Z,10Z,13Z,16Z-docosatetraenoyl)-sn-glycero-3-phosphoethanolamine | 0.039 | 1.476 | up | Ferroptosis (ko04216) |
| 26 | 1-Octadecanoyl-sn-glycero-3-phosphoethanolamine | 0.021 | 1.555 | up | Ferroptosis (ko04216) |
| 27 | 2-trans-Dodecenoyl-CoA | 0.025 | 1.561 | down | Fatty acid elongation (ko00062); Fatty acid degradation (ko00071); Metabolic pathways (ko01100); Fatty acid metabolism (ko01212) |
| 28 | trans,cis-Lauro-2,6-dienoyl-CoA | 0.006 | 1.750 | up | Fatty acid degradation (ko00071) |
| 29 | Decanoic acid | 0.028 | 1.615 | up | Fatty acid biosynthesis (ko00061); Metabolic pathways (ko01100) |
| 30 | O-Succinyl-l-homoserine | 0.005 | 1.942 | up | Cysteine and methionine metabolism (ko00270); Sulfur metabolism (ko00920); Metabolic pathways (ko01100); Biosynthesis of amino acids (ko01230) |
| 31 | S-Adenosylhomocysteine | 0.047 | 1.540 | down | Cysteine and methionine metabolism (ko00270) |
| 32 | Cyclic ADP-ribose | 0.024 | 1.531 | up | Calcium signaling pathway (ko04020) |
| 33 | Adrenic acid | 0.011 | 1.779 | up | Biosynthesis of unsaturated fatty acids (ko01040); Ferroptosis (ko04216) |
| 34 | Docosenoyl-CoA | 0.040 | 1.587 | down | Biosynthesis of unsaturated fatty acids (ko01040); Fatty acid metabolism (ko01212) |
| 35 | Montanoyl-CoA | 0.021 | 1.777 | down | Biosynthesis of unsaturated fatty acids (ko01040); Fatty acid metabolism (ko01212) |
| 36 | Threonate | 0.017 | 1.783 | up | Ascorbate and aldarate metabolism (ko00053); Metabolic pathways (ko01100) |
| 37 | Ascorbic acid | 0.039 | 1.410 | down | Ascorbate and aldarate metabolism (ko00053); Glutathione metabolism (ko00480); HIF-1 signaling pathway (ko04066); Vitamin digestion and absorption (ko04977) |
| 38 | d-Octopine | 0.005 | 1.781 | down | Arginine and proline metabolism (ko00330) |
| 39 | l-4-Hydroxyglutamate semialdehyde | 0.027 | 1.490 | up | Arginine and proline metabolism (ko00330); Metabolic pathways (ko01100) |
| 40 | 20-HETE | 0.022 | 1.751 | down | Arachidonic acid metabolism (ko00590) |
| 41 | Prostaglandin D2 | 0.000 | 2.315 | up | Arachidonic acid metabolism (ko00590) |
| 42 | (15S)-15-Hydroxy-5,8,11-cis-13-trans-eicosatetraenoate | 0.031 | 1.529 | up | Arachidonic acid metabolism (ko00590) |
| 43 | 20-COOH-Leukotriene B4 | 0.040 | 1.527 | up | Arachidonic acid metabolism (ko00590) |
| 44 | 12-Keto-leukotriene B4 | 0.002 | 2.055 | up | Arachidonic acid metabolism (ko00590) |
| 45 | CMP-pseudaminic acid | 0.049 | 1.573 | down | Amino sugar and nucleotide sugar metabolism (ko00520); Metabolic pathways (ko01100); Biosynthesis of nucleotide sugars (ko01250) |
| 46 | N-Acetylneuraminate | 0.041 | 1.475 | up | Amino sugar and nucleotide sugar metabolism (ko00520); Metabolic pathways (ko01100); Biosynthesis of nucleotide sugars (ko01250) |
| 47 | Pseudaminic acid | 0.032 | 1.650 | down | Amino sugar and nucleotide sugar metabolism (ko00520); Metabolic pathways (ko01100); Biosynthesis of nucleotide sugars (ko01250) |
| 48 | Methyl jasmonate | 0.000 | 2.206 | up | alpha-Linolenic acid metabolism (ko00592) |
| 49 | 20-COOH-Leukotriene B4 | 0.040 | 1.527 | up | Arachidonic acid metabolism (ko00590) |
| No | Name | p Value | VIP | Trend | KEGG_Pathway_Annotation |
|---|---|---|---|---|---|
| 1 | Vitamin K1 | 0.002 | 1.484 | down | Vitamin digestion and absorption (ko04977); Ubiquinone and other terpenoid-quinone biosynthesis (ko00130) |
| 2 | Retinol | 0.023 | 1.270 | up | Vitamin digestion and absorption (ko04977); Retinol metabolism (ko00830) |
| 3 | 20-HETE | 0.004 | 1.539 | up | Vascular smooth muscle contraction (ko04270); Arachidonic acid metabolism (ko00590) |
| 4 | (R)-3-Amino-2-methylpropanoate | 0.032 | 1.205 | down | Valine, leucine, and isoleucine degradation (ko00280); Pyrimidine metabolism (ko00240) |
| 5 | 2-Phytyl-1,4-naphthoquinone | 0.006 | 1.502 | down | Ubiquinone and other terpenoid-quinone biosynthesis (ko00130) |
| 6 | alpha-Tocotrienol | 0.018 | 1.206 | up | Ubiquinone and other terpenoid-quinone biosynthesis (ko00130) |
| 7 | Isopentenyl phosphate | 0.033 | 1.135 | up | Terpenoid backbone biosynthesis (ko00900) |
| 8 | O-Succinyl-l-homoserine | 0.005 | 1.481 | down | Sulfur metabolism (ko00920); Cysteine and methionine metabolism (ko00270) |
| 9 | 7alpha-Hydroxydehydroepiandrosterone | 0.035 | 1.127 | down | Steroid hormone biosynthesis (ko00140) |
| 10 | Cortolone | 0.014 | 1.390 | down | Steroid hormone biosynthesis (ko00140) |
| 11 | GTP | 0.031 | 1.122 | up | Rap1 signaling pathway (ko04015); Sulfur relay system (ko04122); Endocytosis (ko04144); Riboflavin metabolism (ko00740); Folate biosynthesis (ko00790); Purine metabolism (ko00230); Autophagy—animal (ko04140); Ras signaling pathway (ko04014) |
| 12 | Deoxyadenosine monophosphate | 0.007 | 1.447 | down | Purine metabolism (ko00230) |
| 13 | 1-(5-Phospho-d-ribosyl)-5-amino-4-imidazolecarboxylate | 0.000 | 1.708 | down | Purine metabolism (ko00230) |
| 14 | 3alpha,7alpha,12alpha,26-Tetrahydroxy-5beta-cholestane | 0.002 | 1.467 | down | Primary bile acid biosynthesis (ko00120) |
| 15 | 7alpha-Hydroxy-3-oxo-4-cholestenoate | 0.000 | 1.757 | down | Primary bile acid biosynthesis (ko00120) |
| 16 | 3alpha,7alpha-Dihydroxy-5beta-cholestanate | 0.013 | 1.381 | down | Primary bile acid biosynthesis (ko00120) |
| 17 | 3alpha,7alpha,12alpha-Trihydroxy-5beta-cholestane | 0.009 | 1.362 | down | Primary bile acid biosynthesis (ko00120) |
| 18 | Biliverdin | 0.020 | 1.246 | up | Porphyrin metabolism (ko00860) |
| 19 | Cyclic ADP-ribose | 0.037 | 1.112 | down | Pancreatic secretion (ko04972); Calcium signaling pathway (ko04020); Oxytocin signaling pathway (ko04921); Salivary secretion (ko04970) |
| 20 | Trypanothione disulfide | 0.013 | 1.291 | up | Glutathione metabolism (ko00480) |
| 21 | Stachyose | 0.024 | 1.256 | up | Galactose metabolism (ko00052) |
| 22 | d-Fucose 6-phosphate | 0.003 | 1.573 | up | Fructose and mannose metabolism (ko00051); Amino sugar and nucleotide sugar metabolism (ko00520) |
| 23 | l-Rhamnulose | 0.001 | 1.554 | up | Fructose and mannose metabolism (ko00051) |
| 24 | Sepiapterin | 0.002 | 1.550 | down | Folate biosynthesis (ko00790) |
| 25 | 1-Octadecanoyl-2-(7Z,10Z,13Z,16Z-docosatetraenoyl)-sn-glycero-3-phosphoethanolamine | 0.027 | 1.271 | down | Ferroptosis (ko04216) |
| 26 | 1-Octadecanoyl-sn-glycero-3-phosphoethanolamine | 0.022 | 1.203 | down | Ferroptosis (ko04216) |
| 27 | trans-Tetradec-2-enoyl-CoA | 0.007 | 1.424 | up | Fatty acid elongation (ko00062); Fatty acid degradation (ko00071) |
| 28 | trans,cis-Lauro-2,6-dienoyl-CoA | 0.000 | 1.640 | down | Fatty acid degradation (ko00071) |
| 29 | Decanoic acid | 0.029 | 1.147 | down | Fatty acid biosynthesis (ko00061) |
| 30 | S-Adenosylhomocysteine | 0.024 | 1.254 | up | Cysteine and methionine metabolism (ko00270); Chemical carcinogenesis—reactive oxygen species (ko05208) |
| 31 | Oxidized glutathione | 0.026 | 1.252 | down | Chemical carcinogenesis—reactive oxygen species (ko05208); Glutathione metabolism (ko00480); Ferroptosis (ko04216); Thyroid hormone synthesis (ko04918); Diabetic cardiomyopathy (ko05415) |
| 32 | Adrenic acid | 0.017 | 1.301 | down | Biosynthesis of unsaturated fatty acids (ko01040); Ferroptosis (ko04216) |
| 33 | Docosenoyl-CoA | 0.020 | 1.333 | up | Biosynthesis of unsaturated fatty acids (ko01040) |
| 34 | Montanoyl-CoA | 0.025 | 1.309 | up | Biosynthesis of unsaturated fatty acids (ko01040) |
| 35 | Docosanoyl-CoA | 0.024 | 1.300 | up | Biosynthesis of unsaturated fatty acids (ko01040) |
| 36 | Prostaglandin D2 | 0.000 | 1.746 | down | Asthma (ko05310); Fc epsilon RI signaling pathway (ko04664); Neuroactive ligand–receptor interaction (ko04080); Serotonergic synapse (ko04726); Arachidonic acid metabolism (ko00590); African trypanosomiasis (ko05143) |
| 37 | l-Ascorbic acid | 0.036 | 1.099 | up | Ascorbate and aldarate metabolism (ko00053); Glutathione metabolism (ko00480); Vitamin digestion and absorption (ko04977); HIF-1 signaling pathway (ko04066) |
| 38 | Threonate | 0.012 | 1.444 | down | Ascorbate and aldarate metabolism (ko00053) |
| 39 | d-Octopine | 0.004 | 1.405 | up | Arginine and proline metabolism (ko00330); ABC transporters (ko02010) |
| 40 | l-4-Hydroxyglutamate semialdehyde | 0.003 | 1.414 | down | Arginine and proline metabolism (ko00330) |
| 41 | (15S)-15-Hydroxy-5,8,11-cis-13-trans-eicosatetraenoate | 0.041 | 1.118 | down | Arachidonic acid metabolism (ko00590); Inflammatory mediator regulation of TRP channels (ko04750) |
| 42 | 20-COOH-Leukotriene B4 | 0.046 | 1.150 | down | Arachidonic acid metabolism (ko00590) |
| 43 | 12-Keto-leukotriene B4 | 0.003 | 1.472 | down | Arachidonic acid metabolism (ko00590) |
| 44 | CMP-pseudaminic acid | 0.030 | 1.212 | up | Amino sugar and nucleotide sugar metabolism (ko00520) |
| 45 | N-Acetylneuraminate | 0.022 | 1.282 | down | Amino sugar and nucleotide sugar metabolism (ko00520) |
| 46 | Pseudaminic acid | 0.032 | 1.261 | up | Amino sugar and nucleotide sugar metabolism (ko00520) |
| 47 | Methyl jasmonate | 0.000 | 1.637 | down | alpha-Linolenic acid metabolism (ko00592) |
| 48 | l-Isoleucine | 0.002 | 1.461 | up | Valine, leucine, and isoleucine biosynthesis (ko00290) |
| 49 | 4-Amino-5-hydroxymethyl-2-methylpyrimidine | 0.038 | 1.109 | up | Thiamine metabolism (ko00730) |
| No. | Name | Between the TAA Group and Control Group | Between the Eugenol Treatment Group and TAA Group | KEGG_Pathway_Annotation | ||||
|---|---|---|---|---|---|---|---|---|
| p Value | VIP | Trend | Trend | p Value | VIP | |||
| 1 | 4-Hydroxy-l-threonine | 0.046 | 1.366 | up | down | 0.001 | 1.582 | Vitamin B6 metabolism (ko00750) |
| 2 | l-Isoleucine | 0.013 | 1.605 | down | up | 0.008 | 1.35 | Valine, leucine, and isoleucine degradation (ko00280); Valine, leucine, and isoleucine biosynthesis (ko00290); Aminoacyl-tRNA biosynthesis (ko00970); Metabolic pathways (ko01100); 2-Oxocarboxylic acid metabolism (ko01210); Biosynthesis of amino acids (ko01230); ABC transporters (ko02010); Protein digestion and absorption (ko04974); Mineral absorption (ko04978); Shigellosis (ko05131); Central carbon metabolism in cancer (ko05230) |
| 3 | Vitamin K1 | 0.002 | 1.931 | up | down | 1.484 | 0.002 | Ubiquinone and other terpenoid-quinone biosynthesis (ko00130); Metabolic pathways (ko01100); Biosynthesis of cofactors (ko01240); Vitamin digestion and absorption (ko04977) |
| 4 | 2-Phytyl-1,4-naphthoquinone | 0.005 | 1.993 | up | down | 0.006 | 1.502 | Ubiquinone and other terpenoid-quinone biosynthesis (ko00130); Metabolic pathways (ko01100); Biosynthesis of cofactors (ko01240) |
| 5 | alpha-Tocotrienol | 0.039 | 1.548 | down | up | 0.018 | 1.206 | Ubiquinone and other terpenoid-quinone biosynthesis (ko00130); Metabolic pathways (ko01100) |
| 6 | 4-Amino-5-hydroxymethyl-2-methylpyrimidine | 0 | 2.085 | down | up | 0.002 | 1.461 | Thiamine metabolism (ko00730); Metabolic pathways (ko01100); Biosynthesis of cofactors (ko01240); ABC transporters (ko02010) |
| 7 | Isopentenyl phosphate | 0.001 | 1.956 | down | up | 0.002 | 1.463 | Terpenoid backbone biosynthesis (ko00900); Metabolic pathways (ko01100) |
| 8 | 7alpha-Hydroxydehydroepiandrosterone | 0.03 | 1.581 | up | down | 0.005 | 1.481 | Steroid hormone biosynthesis (ko00140) |
| 9 | Cortolone | 0.012 | 1.766 | up | down | 0.041 | 1.196 | Steroid hormone biosynthesis (ko00140) |
| 10 | Retinol | 0.018 | 1.748 | down | up | 1.27 | 0.023 | Retinol metabolism (ko00830); Metabolic pathways (ko01100); Biosynthesis of cofactors (ko01240); Vitamin digestion and absorption (ko04977) |
| 11 | GTP | 0.033 | 1.472 | down | up | 0.021 | 1.265 | Purine metabolism (ko00230); Riboflavin metabolism (ko00740); Folate biosynthesis (ko00790); Metabolic pathways (ko01100); Nucleotide metabolism (ko01232); Biosynthesis of cofactors (ko01240); Ras signaling pathway (ko04014); Rap1 signaling pathway (ko04015); Sulfur relay system (ko04122); Autophagy—animal (ko04140); Endocytosis (ko04144) |
| 12 | Deoxyadenosine monophosphate | 0.044 | 1.398 | up | down | 0.002 | 1.51 | Purine metabolism (ko00230); Metabolic pathways (ko01100); Nucleotide metabolism (ko01232) |
| 13 | 1-(5-Phospho-d-ribosyl)-5-amino-4-imidazolecarboxylate | 0.027 | 1.473 | up | down | 0.007 | 1.447 | Purine metabolism (ko00230); Metabolic pathways (ko01100) |
| 14 | 3alpha,7alpha,12alpha,26-Tetrahydroxy-5beta-cholestane | 0.007 | 1.881 | up | down | 0.005 | 1.444 | Primary bile acid biosynthesis (ko00120); Metabolic pathways (ko01100) |
| 15 | 3alpha,7alpha,12alpha-Trihydroxy-5beta-cholestane | 0.034 | 1.477 | up | down | 0.013 | 1.381 | Primary bile acid biosynthesis (ko00120); Metabolic pathways (ko01100) |
| 16 | 3alpha,7alpha-Dihydroxy-5-cholestenoate | 0.037 | 1.414 | up | down | 0.009 | 1.362 | Primary bile acid biosynthesis (ko00120) |
| 17 | 7alpha-Hydroxy-3-oxo-4-cholestenoate | 0 | 2.275 | up | down | 0.034 | 1.156 | Primary bile acid biosynthesis (ko00120) |
| 18 | Oxidized glutathione | 0.044 | 1.49 | up | down | 0.013 | 1.262 | Glutathione metabolism (ko00480); Metabolic pathways (ko01100); Biosynthesis of cofactors (ko01240); Ferroptosis (ko04216); Thyroid hormone synthesis (ko04918); Chemical carcinogenesis—reactive oxygen species (ko05208); Diabetic cardiomyopathy (ko05415) |
| 19 | Stachyose | 0.046 | 1.589 | down | up | 0.012 | 1.436 | Galactose metabolism (ko00052); Metabolic pathways (ko01100) |
| 20 | l-Rhamnulose | 0.016 | 1.711 | down | up | 0.003 | 1.573 | Fructose and mannose metabolism (ko00051); Metabolic pathways (ko01100) |
| 21 | Sepiapterin | 0.01 | 1.803 | up | down | 0.001 | 1.576 | Folate biosynthesis (ko00790); Metabolic pathways (ko01100) |
| 22 | Adrenic acid | 0.011 | 1.779 | up | down | 0.004 | 1.441 | Biosynthesis of unsaturated fatty acids (ko01040); Ferroptosis (ko04216) |
| 23 | 1-Octadecanoyl-2-(7Z,10Z,13Z,16Z-docosatetraenoyl)-sn-glycero-3-phosphoethanolamine | 0.039 | 1.476 | up | down | 0.034 | 1.177 | Ferroptosis (ko04216) |
| 24 | 1-Octadecanoyl-sn-glycero-3-phosphoethanolamine | 0.021 | 1.555 | up | down | 0.027 | 1.271 | Ferroptosis (ko04216) |
| 25 | 2-trans-Dodecenoyl-CoA | 0.025 | 1.561 | down | up | 0.022 | 1.203 | Fatty acid elongation (ko00062); Fatty acid degradation (ko00071); Metabolic pathways (ko01100); Fatty acid metabolism (ko01212) |
| 26 | trans,cis-Lauro-2,6-dienoyl-CoA | 0.006 | 1.75 | up | down | 0.019 | 1.186 | Fatty acid degradation (ko00071) |
| 27 | Decanoic acid | 0.028 | 1.615 | up | down | 0 | 1.64 | Fatty acid biosynthesis (ko00061); Metabolic pathways (ko01100) |
| 28 | O-Succinyl-l-homoserine | 0.005 | 1.942 | up | down | 0.032 | 1.181 | Cysteine and methionine metabolism (ko00270); Sulfur metabolism (ko00920); Metabolic pathways (ko01100); Biosynthesis of amino acids (ko01230) |
| 29 | S-Adenosylhomocysteine | 0.047 | 1.54 | down | up | 0.002 | 1.471 | Cysteine and methionine metabolism (ko00270); Metabolic pathways (ko01100); Biosynthesis of amino acids (ko01230); Biosynthesis of cofactors (ko01240); Chemical carcinogenesis—reactive oxygen species (ko05208) |
| 30 | Cyclic ADP-ribose | 0.024 | 1.531 | up | down | 0.008 | 1.33 | Calcium signaling pathway (ko04020); Oxytocin signaling pathway (ko04921); Salivary secretion (ko04970); Pancreatic secretion (ko04972) |
| 31 | Docosenoyl-CoA | 0.04 | 1.587 | down | up | 0.013 | 1.266 | Biosynthesis of unsaturated fatty acids (ko01040); Fatty acid metabolism (ko01212) |
| 32 | Montanoyl-CoA | 0.021 | 1.777 | down | up | 0.02 | 1.333 | Biosynthesis of unsaturated fatty acids (ko01040); Fatty acid metabolism (ko01212) |
| 33 | Ascorbic acid | 0.039 | 1.41 | down | up | 0 | 1.746 | Ascorbate and aldarate metabolism (ko00053); Glutathione metabolism (ko00480); Metabolic pathways (ko01100); Biosynthesis of cofactors (ko01240); HIF-1 signaling pathway (ko04066); Vitamin digestion and absorption (ko04977) |
| 34 | d-Octopine | 0.005 | 1.781 | down | up | 0.012 | 1.444 | Arginine and proline metabolism (ko00330); Metabolic pathways (ko01100); ABC transporters (ko02010) |
| 35 | l-4-Hydroxyglutamate semialdehyde | 0.027 | 1.49 | up | down | 0.007 | 1.327 | Arginine and proline metabolism (ko00330); Metabolic pathways (ko01100) |
| 36 | 20-HETE | 0.022 | 1.751 | down | up | 1.539 | 0.004 | Arachidonic acid metabolism (ko00590); Metabolic pathways (ko01100); Vascular smooth muscle contraction (ko04270) |
| 37 | Prostaglandin D2 | 0 | 2.315 | up | down | 0.01 | 1.28 | Arachidonic acid metabolism (ko00590); Metabolic pathways (ko01100); Neuroactive ligand–receptor interaction (ko04080); Fc epsilon RI signaling pathway (ko04664); Serotonergic synapse (ko04726); African trypanosomiasis (ko05143); Asthma (ko05310) |
| 38 | (15S)-15-Hydroxy-5,8,11-cis-13-trans-eicosatetraenoate | 0.031 | 1.529 | up | down | 0.008 | 1.378 | Arachidonic acid metabolism (ko00590); Metabolic pathways (ko01100); Inflammatory mediator regulation of TRP channels (ko04750) |
| 39 | 20-COOH-Leukotriene B4 | 0.04 | 1.527 | up | down | 0.041 | 1.118 | Arachidonic acid metabolism (ko00590) |
| 40 | 12-Keto-leukotriene B4 | 0.002 | 2.055 | up | down | 0.009 | 1.319 | Arachidonic acid metabolism (ko00590) |
Disclaimer/Publisher’s Note: The statements, opinions and data contained in all publications are solely those of the individual author(s) and contributor(s) and not of MDPI and/or the editor(s). MDPI and/or the editor(s) disclaim responsibility for any injury to people or property resulting from any ideas, methods, instructions or products referred to in the content. |
© 2024 by the authors. Licensee MDPI, Basel, Switzerland. This article is an open access article distributed under the terms and conditions of the Creative Commons Attribution (CC BY) license (https://creativecommons.org/licenses/by/4.0/).
Share and Cite
Chen, H.; Li, M.; Yan, H.; Yan, J.; Wang, G.; Gao, L. Preliminary Exploration of the Protective Mechanism of Eugenol Against Acute Liver Injury Induced by Thioacetamide Based on Metabolomics. Molecules 2024, 29, 5288. https://doi.org/10.3390/molecules29225288
Chen H, Li M, Yan H, Yan J, Wang G, Gao L. Preliminary Exploration of the Protective Mechanism of Eugenol Against Acute Liver Injury Induced by Thioacetamide Based on Metabolomics. Molecules. 2024; 29(22):5288. https://doi.org/10.3390/molecules29225288
Chicago/Turabian StyleChen, Huanghan, Mengting Li, Hongmu Yan, Jingyu Yan, Guang Wang, and Lina Gao. 2024. "Preliminary Exploration of the Protective Mechanism of Eugenol Against Acute Liver Injury Induced by Thioacetamide Based on Metabolomics" Molecules 29, no. 22: 5288. https://doi.org/10.3390/molecules29225288
APA StyleChen, H., Li, M., Yan, H., Yan, J., Wang, G., & Gao, L. (2024). Preliminary Exploration of the Protective Mechanism of Eugenol Against Acute Liver Injury Induced by Thioacetamide Based on Metabolomics. Molecules, 29(22), 5288. https://doi.org/10.3390/molecules29225288