Article

Comparative Interaction Studies of Quercetin with 2-Hydroxyl-propyl-β-cyclodextrin and 2,6-Methylated-β-cyclodextrin

1
Organic Chemistry Laboratory, Department of Chemistry, National and Kapodistrian University of Athens, Panepistimiopollis Zografou, 11571 Athens, Greece
2
Biomedical Research Foundation Academy of Athens, 4 Soranou Ephessiou, 11527 Athens, Greece
3
Department of Chemistry, Section of Organic Chemistry and Biochemistry, University of Ioannina, 45110 Ioannina, Greece
4
Slovenian NMR Centre, National Institute of Chemistry, SI-1001 Ljubljana, Slovenia
5
Department of Pharmacy, School of Health Sciences, National and Kapodistrian University of Athens, 15784 Athens, Greece
6
Institute of Materials Science and Computing, University Research Center of Ioannina (URCI), 45110 Ioannina, Greece
7
Laboratory of Physical Chemistry, Department of Chemistry, National and Kapodistrian University of Athens, Panepistimioupolis Zografou, 11571 Athens, Greece
8
Theoretical and Physical Chemistry Institute, National Hellenic Research Foundation, 11635 Athens, Greece
*
Authors to whom correspondence should be addressed.
Molecules 2022, 27(17), 5490; https://doi.org/10.3390/molecules27175490
Submission received: 6 July 2022 / Revised: 6 August 2022 / Accepted: 19 August 2022 / Published: 26 August 2022

Abstract

:
Quercetin (QUE) is a well-known natural product that can exert beneficial properties on human health. However, due to its low solubility its bioavailability is limited. In the present study, we examine whether its formulation with two cyclodextrins (CDs) may enhance its pharmacological profile. Comparative interaction studies of quercetin with 2-hydroxyl-propyl-β-cyclodextrin (2HP-β-CD) and 2,6-methylated cyclodextrin (2,6Me-β-CD) were performed using NMR spectroscopy, DFT calculations, and in silico molecular dynamics (MD) simulations. Using T1 relaxation experiments and 2D DOSY it was illustrated that both cyclodextrin vehicles can host quercetin. Quantum mechanical calculations showed the formation of hydrogen bonds between QUE with 2HP-β-CD and 2,6Μe-β-CD. Six hydrogen bonds are formed ranging between 2 to 2.8 Å with 2HP-β-CD and four hydrogen bonds within 2.8 Å with 2,6Μe-β-CD. Calculations of absolute binding free energies show that quercetin binds favorably to both 2,6Me-β-CD and 2HP-β-CD. MM/GBSA results show equally favorable binding of quercetin in the two CDs. Fluorescence spectroscopy shows moderate binding of quercetin in 2HP-β-CD (520 M−1) and 2,6Me-β-CD (770 M−1). Thus, we propose that both formulations (2HP-β-CD:quercetin, 2,6Me-β-CD:quercetin) could be further explored and exploited as small molecule carriers in biological studies.

1. Introduction

Quercetin (QUE) (Figure 1) has shown potential health benefits in humans, and it can be used as a nutritional supplement in the pharmaceutical and food industries [1,2,3]. Like many flavonoids, QUE is best known for its antioxidant activity [4,5,6], suggesting that it could be used in preserving food quality by preventing the oxidative deterioration of lipids. Reported health benefits of QUE include cardiovascular protection, anti-ulcer effects, anti-allergic, antiviral, anti-inflammatory and antitumor activities [7,8,9,10]. Moreover, several studies report that QUE destabilizes and increases the clearance of abnormal proteins, which are key pathological marks of Alzheimer’s disease [11]. Therefore, QUE has emerged as a major bioactive ingredient with potential applications in many functional foods and pharmaceutical products. However, the poor water solubility of this phytochemical, limits significantly its bioavailability and absorption after oral administration. To overcome this problem, QUE has been formulated into novel lipid-based systems to improve its bioactivity and a therapeutic profile and nanotechnology approaches such as microparticles, nanostructured lipid carriers, nanoparticles, nanoemulsions, microemulsions, liposomes, phytosomes, niosomes and transferosomes have been applied [11,12,13,14,15,16,17]. Recent studies show that cellular penetration of QUE was enhanced by sterol containing solid lipid nanoparticles for targeting hepatocellular carcinoma cells [18]. It has also been reported that QUE-nanostructured lipid carriers (NLC) formulations can be a potential breakthrough for the treatment of breast cancer with minimal side-effects [19]. Laser diffraction size analysis of the aerosol and its excellent distribution and penetration capacity generated from QUE nanoemulsions shows its suitability for efficient pulmonary delivery for lung cancer treatment [20]. QUE lipid based formulations were explored for their anti-inflammatory activity, and it was concluded that these novel formulations exhibited better anti-inflammatory activity [21].
Cyclodextrins (CDs) are a group of cyclic oligosaccharides consisting of sugar monomers [α-D-glycopyranose], which are linked by α-[1,4]-glycosidic bonds. The natural CDs α, β and γ consist of 6, 7 and 8 glucose units, respectively. Apart from these naturally occurring CDs, many derivatives have been synthesized such as randomly methylated derivatives of β-CD [RM-β-CD], 2-hydroxypropylated β- and γ-CDs [HP-β-CD, HP-γ-CD], sulfobutylated-β-CDs [SBE-β-CD], branched CDs [glucosyl- and maltosyl-β-CDs], acetylated β- and γ-CDs and sulfated CDs. Their structures consist of a hydrophilic outer surface and a hydrophobic inner cavity [22,23]. The lipophilic cavity of CDs enables entrapment of hydrophobic molecules and the formation of host–guest complexes. Thus, CDs have been utilized in the food and pharmaceutical industries and have also been used for analytical purposes [24,25,26]. In the pharmaceutical industry, CDs have mainly been used as complexing agents to increase the aqueous solubility of active substances poorly soluble in water [27,28,29,30]. Various drugs have already been commercialized as complexes with CDs, including hydrocortisone, prostaglandin, nitroglycerin, itraconazol, and chloramphenicol [28]. CD complexes can be used to release biologically active compounds under specific conditions [31,32,33]. A recent study showed that the complexation with β-CD enhanced the therapeutic efficiency of praziquantel from 59% (for the plain drug) to 99% (for the β-CD complex) [34]. Moreover, studies with the essential oil of ocimum plant showed a low absorption giving a maximum % inhibition of edema equal to of 16%, while after its complexation with SBE-β-CD/HP-β-CD a higher absorption was observed achieving more than 50% inhibition of edema [35]. The curcumin-β-CD complex enhanced curcumin delivery and improved therapeutic efficacy compared to the free curcumin [36]. Furthermore, the encapsulation of phenoxodiol in β-CD revealed increased antiproliferative activity against cancer cells [37].
Numerous cases of natural product–CD complexes have been reported, such as for silibinin [38] and quercetin [39]. CDs and especially hydroxypropyl-CD have been widely used to protect drugs against conjugation and metabolic inactivation [40] as well as to enhance the aqueous solubility and the oral bioavailability of sparingly soluble drug molecules [41,42]. Encapsulation of natural product polyphenols into CDs has been performed to hinder the non-enzymatic and enzymatic dioxygen oxidation and to extend their stability over time [43]. The complexation of caffeic and rosmarinic acid with CDs could eliminate the aforementioned obstacles and additionally provide a shelter for the two molecules [44]. HP-β-CD is an isomer mixture with a different degree of hydroxyl-propylation [45]. HP-β-CD’s degree of substitution (DS) has a significant impact on the solubility and aggregation of the CD itself. Particularly, HP-β-CD reaches maximum solubility [46] while one or two DS results in the hindrance of the solubility potential [47]. The aggregation tends to decrease as the DS increases, while generally the solubility augments.
As a continuation of our previous studies, in order to analyze in depth both the 3D architecture as well as the thermodynamic properties and the interacting forces governing the formation of such host-guest systems, we synthesized two different encapsulation complexes of QUE with 2HP-β-CD and 2,6Me-β-CD (Figure 1). We also utilized an array of analytical and computational techniques including high resolution 1H NMR spectroscopy, T1 measurements, fluorescence spectroscopy, DFT calculations, molecular dynamics (MD) simulations and absolute binding free energy calculations to study QUE-CD interactions. High resolution 1H NMR spectroscopy utilizes the differences in chemical shifts between protons of QUE complexed with HP-β-CD and Me-β-CD and free forms. T1 measurements provide information for the components alone or in a complexed form. In the present work, we studied the QUE-CD interactions with two different types of computational methodologies, i.e., QM(DFT) and MD, adding physical insight on the interactions, and this approach makes the study “novel sufficient”. MD simulations, MM/GBSA calculations and rigorous alchemical non-equilibrium free energy calculations were performed to complement experimental results and provide the binding affinity of QUE upon complexing with the two CD systems.

2. Results and Discussion

NMR analysis (carbon and proton NMR spectroscopy) is a powerful tool for the determination of the inclusion of a guest molecule inside CDs through the identification and comparison of the chemical shifts of the free guest molecule and CD with those of its complex. 1H-NMR analyses have been performed in the literature for the determination of structural changes during complexation of host-guest systems [48,49,50].
The 1H NMR spectra of the 2,6Me-β-CD and the lyophilized complex are shown in Figure 2. The chemical shifts of the peaks are shown in Table 1. Differences in chemical shifts between the two spectra are observed (Table 1) signifying the complexation between 2,6-Me-β-CD and QUE.
Chemical shifts were also calculated using the Self-Consistent Field Gauge-Independent Atomic Orbital (SCF GIAO) method and compared with the experimental results as shown in Table 2. The full spectra as calculated with the SCF GIAO method is shown in Supplementary Figure S1. As it can be observed, experimental and theoretical calculations match closely.
Regarding the 2D NOESY NMR spectrum of the complex (full spectrum covering all regions is shown in Supplementary Figure S2) depicts critical NOEs between the aromatic H2′*, H3′*, H6′* of QUE and the H2, H5 and H6 of 2,6Μe-β-CD. These results suggest that QUE enters entirely into the hydrophobic core of the 2,6Me-β-CD cavity.
The 1H NMR spectra of 2HP-β-CD and the lyophilized complex, in D2O at 25 °C are shown in Figure 3. The chemical shifts of the peaks are shown in Table 3. Chemical shifts were also calculated using the SCF GIAO method and compared with the experimental results as shown in Table 4, showing that experimental and theoretical calculations match closely. The full spectra as calculated with the SCF GIAO method is shown in Supplementary Figure S3.
The 2D NOESY spectra of 2HP-β-CD-QUE (full spectrum shown in Supplementary Figure S4) shows that the critical NOEs are between the aromatic H2′*, H3′*, H6′* of QUE and the H2″, H5″ and H6″ of 2HP-β-CD. The H8′, and H6′ of QUE present weaker NOEs compared to the respective protons of 2,6Me-β-CD. These results suggest that QUE enters entirely into the hydrophobic cavity of the 2HP-β-CD.
The experimental and theoretical values of QUE in the two complexes are shown in Table 5. Non-significant differences are observed in these values, although in some peaks the deviation is higher compared to the ones shown for the two CDs. This observation signifies that the theoretical calculation cannot simulate accurately the environment of all the protons emerged in the cyclodextrins core.
The complexation of QUE with CD induces upfield changes in the chemical shifts of the 1H-NMR spectra. In particular, H2′*, H3′* and H6′* show the highest chemical shift deviations suggesting intermolecular interactions between QUE and the two CDs.
The following tables (Table 6 and Table 7) and Figures S5–S8 of the Supplementary Material include the relaxation times for the two complexes before and after the complexation.
The incorporation of quercetin in both CDs results in the decrease of T1 values implying strong host-guest interactions. The percentage of chemical shift changes indicates that QUE complexes stronger with 2,6Μe-β-CD compared to 2HP-β-CD.

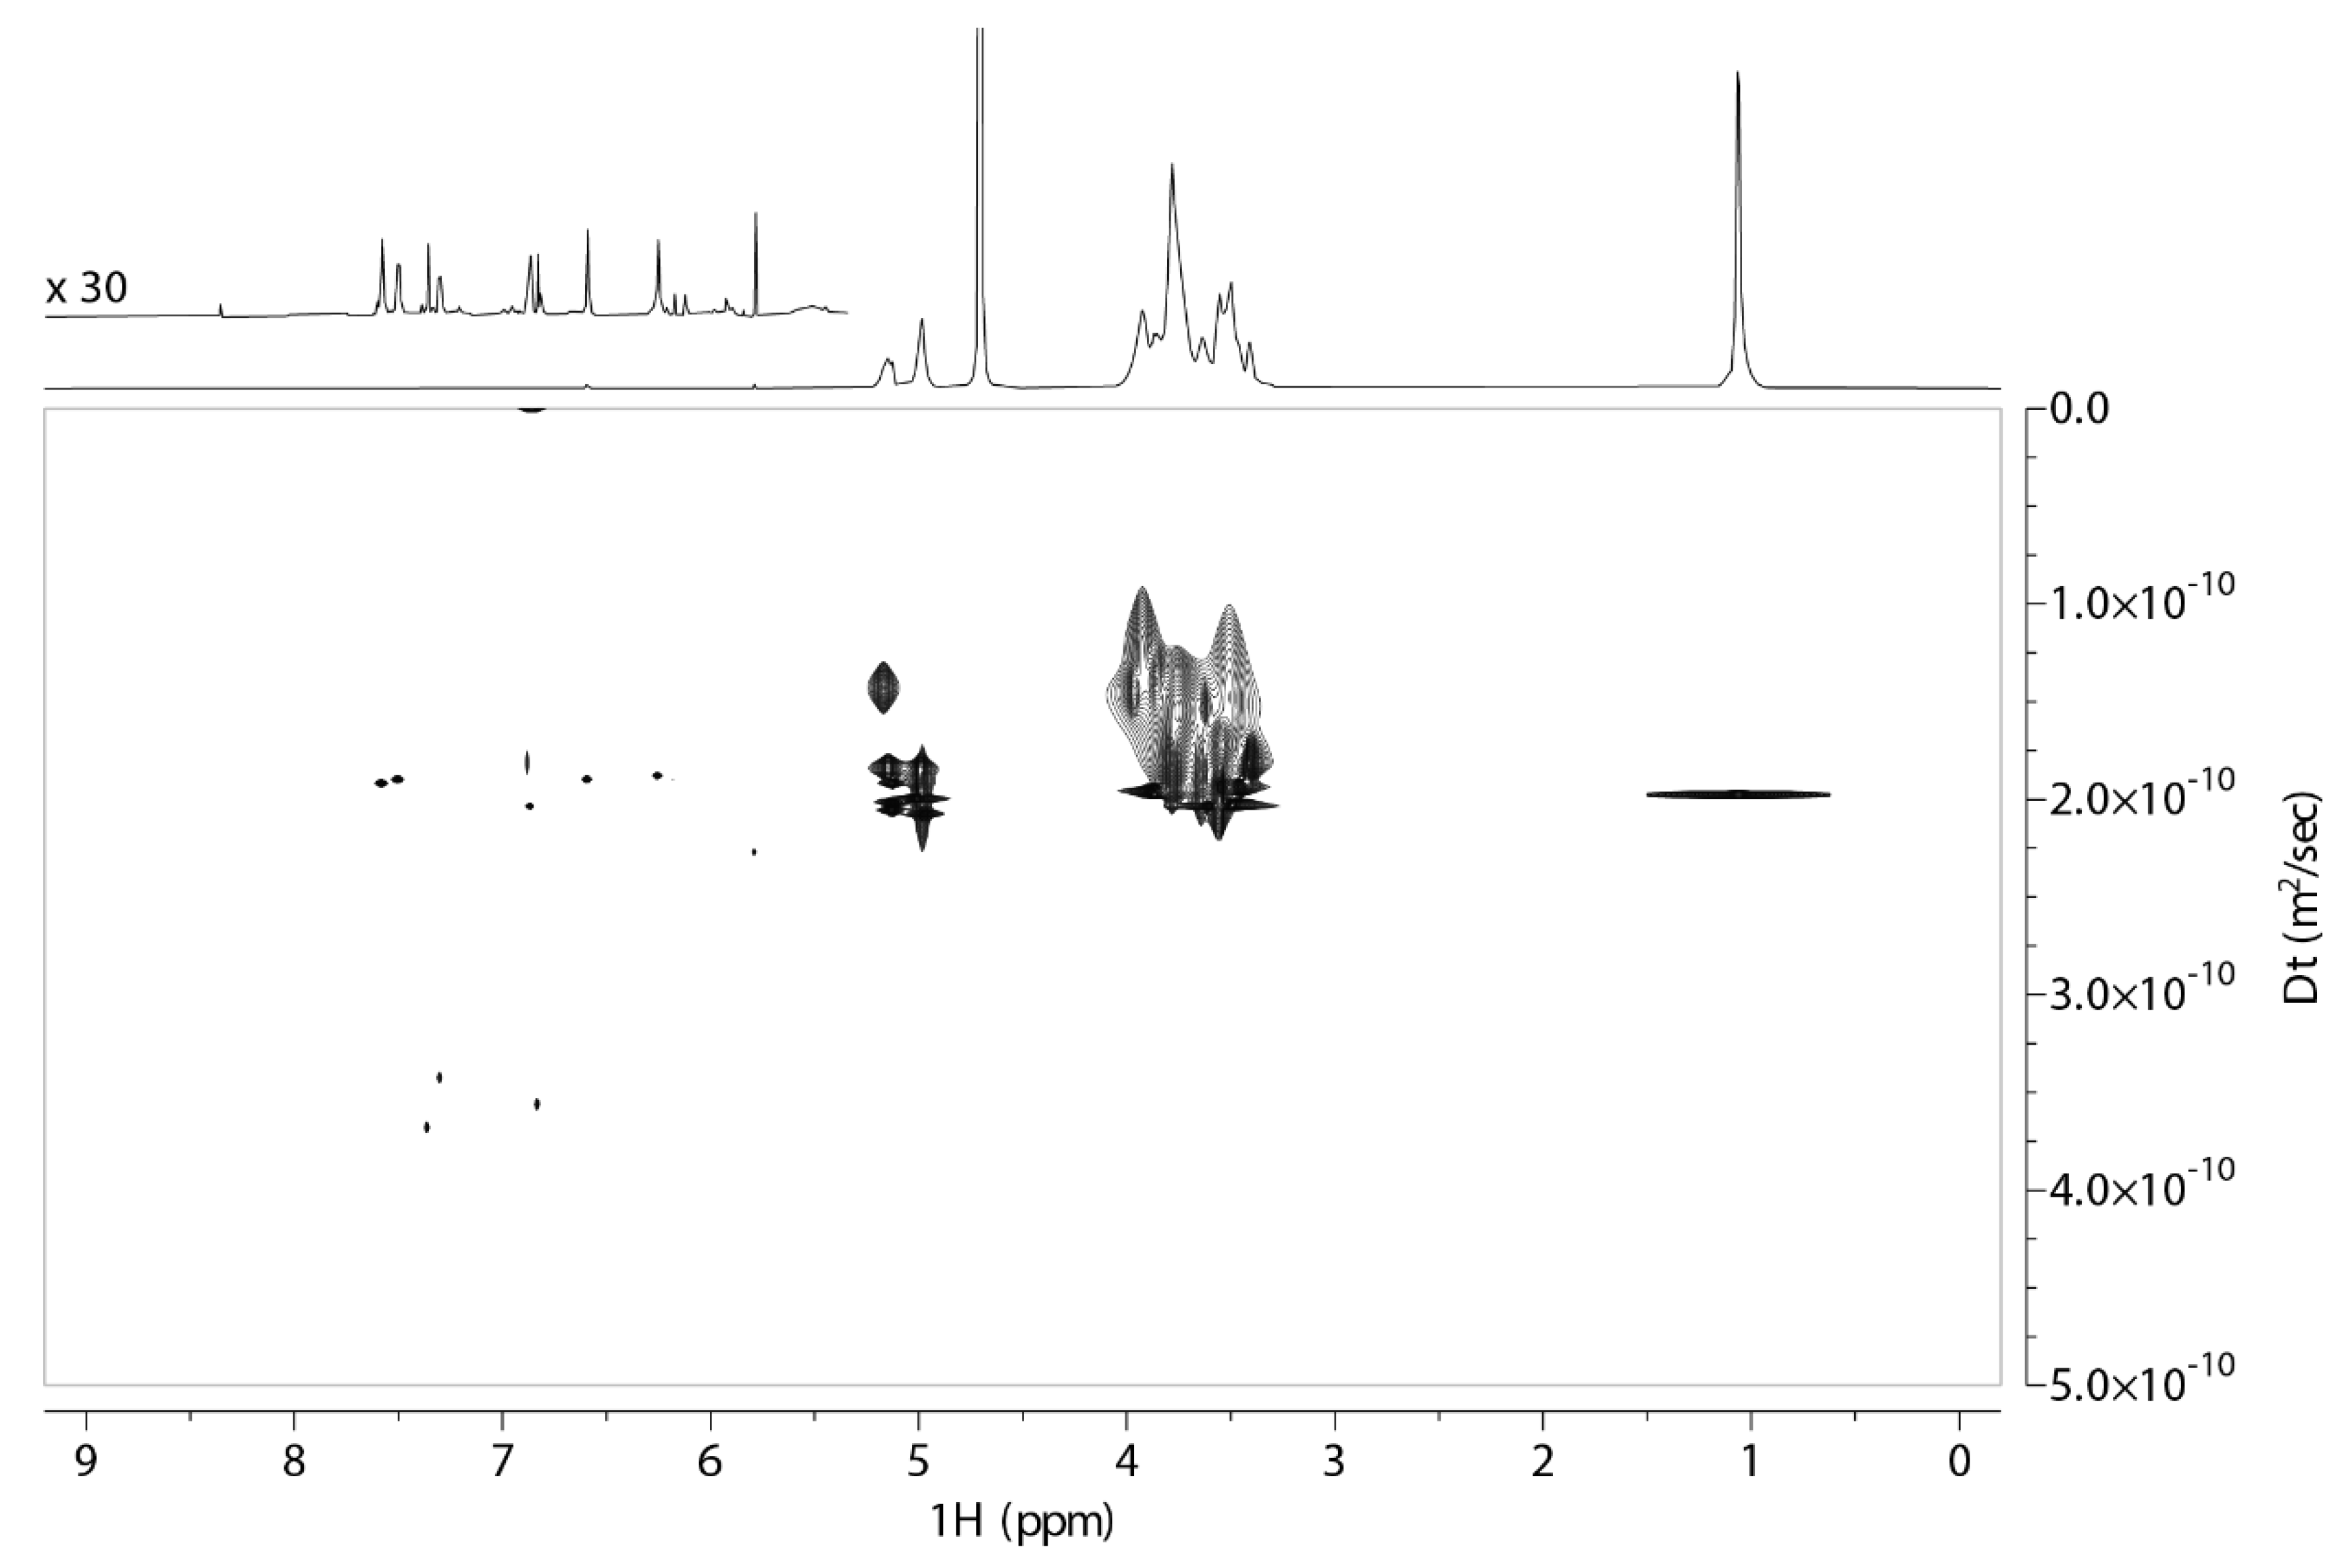
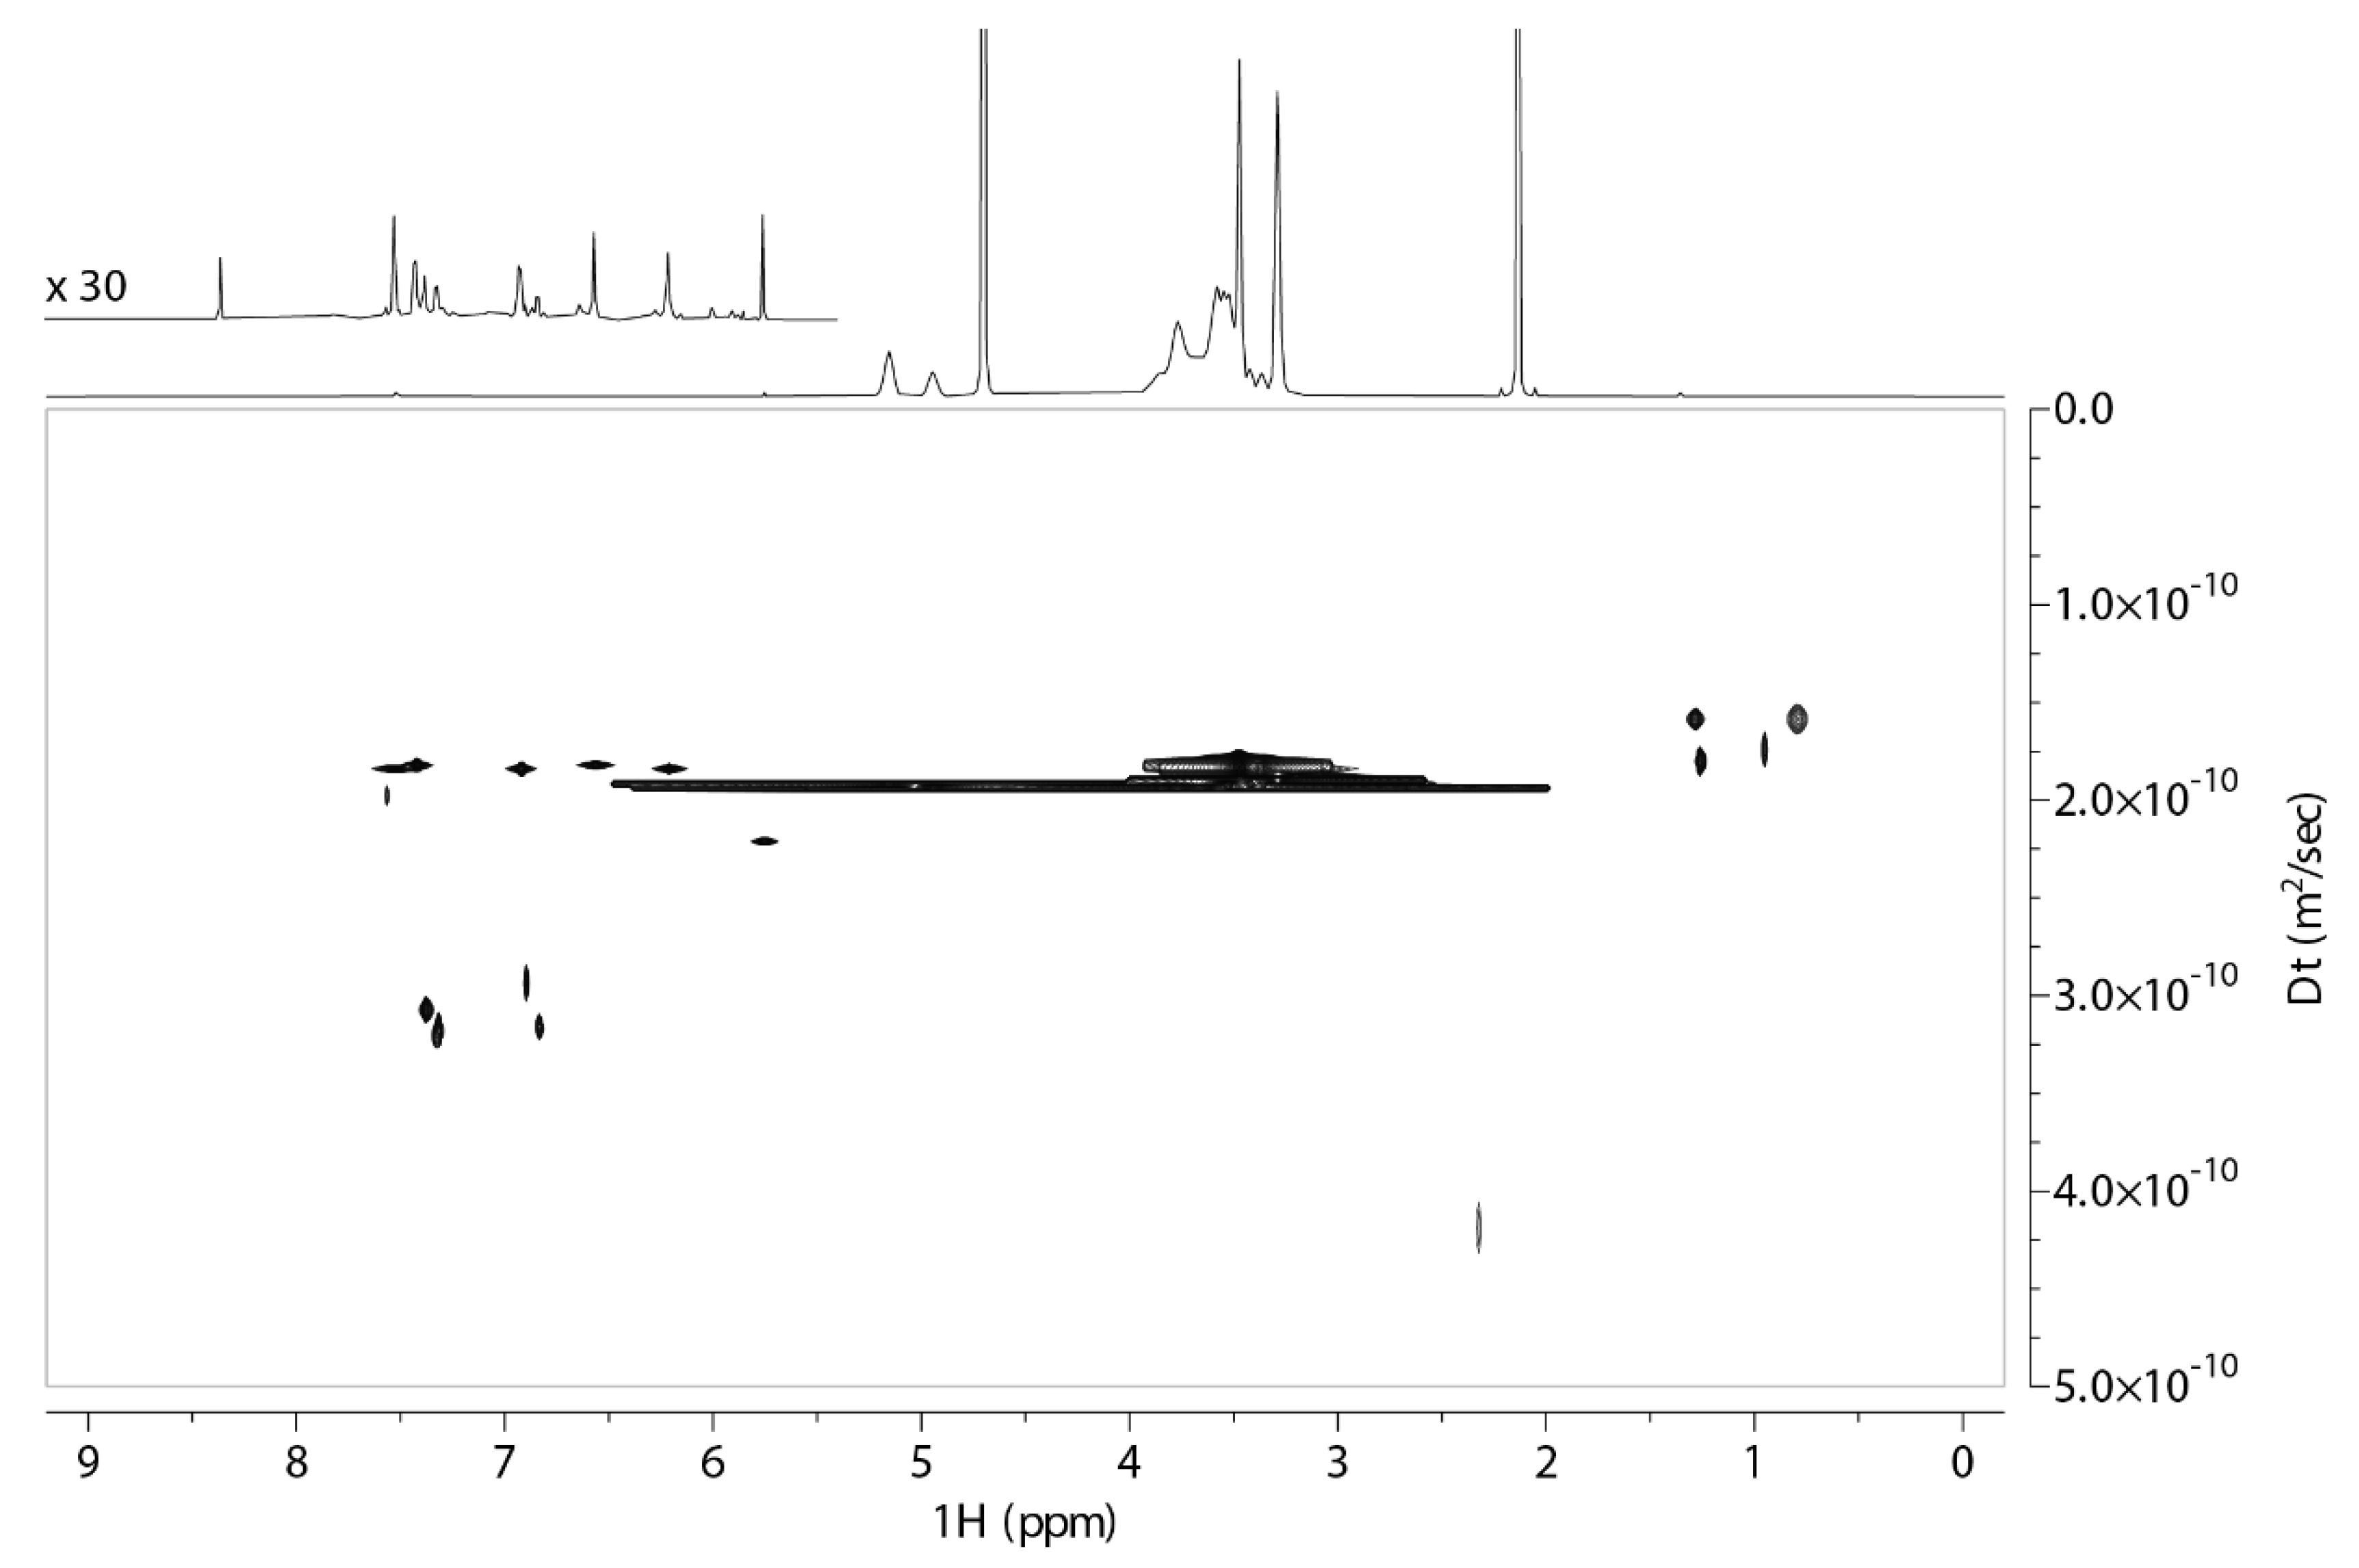
2.1. 2D DOSY Experiment

Complex formation between QUE and both forms of cyclodextrin is evident from DOSY spectra, where the two components of the complex have the same apparent translational diffusion coefficient, Dt, equal to 1.9 × 10⁻¹⁰ m2 s−1 for both QUE:2,6Me-β-CD and QUE:2HP-β-CD 1:1 formulations. In DOSY spectra of both formulations, smaller signals are presented in the aromatic region of the 1H NMR spectrum, which have larger Dt values (around 3 × 10⁻¹⁰ m2 s−1). These findings indicate that a fraction of the QUE in both samples is unbound, and it is in a slow exchange equilibrium with the bound form (Figure 4 and Figure 5).

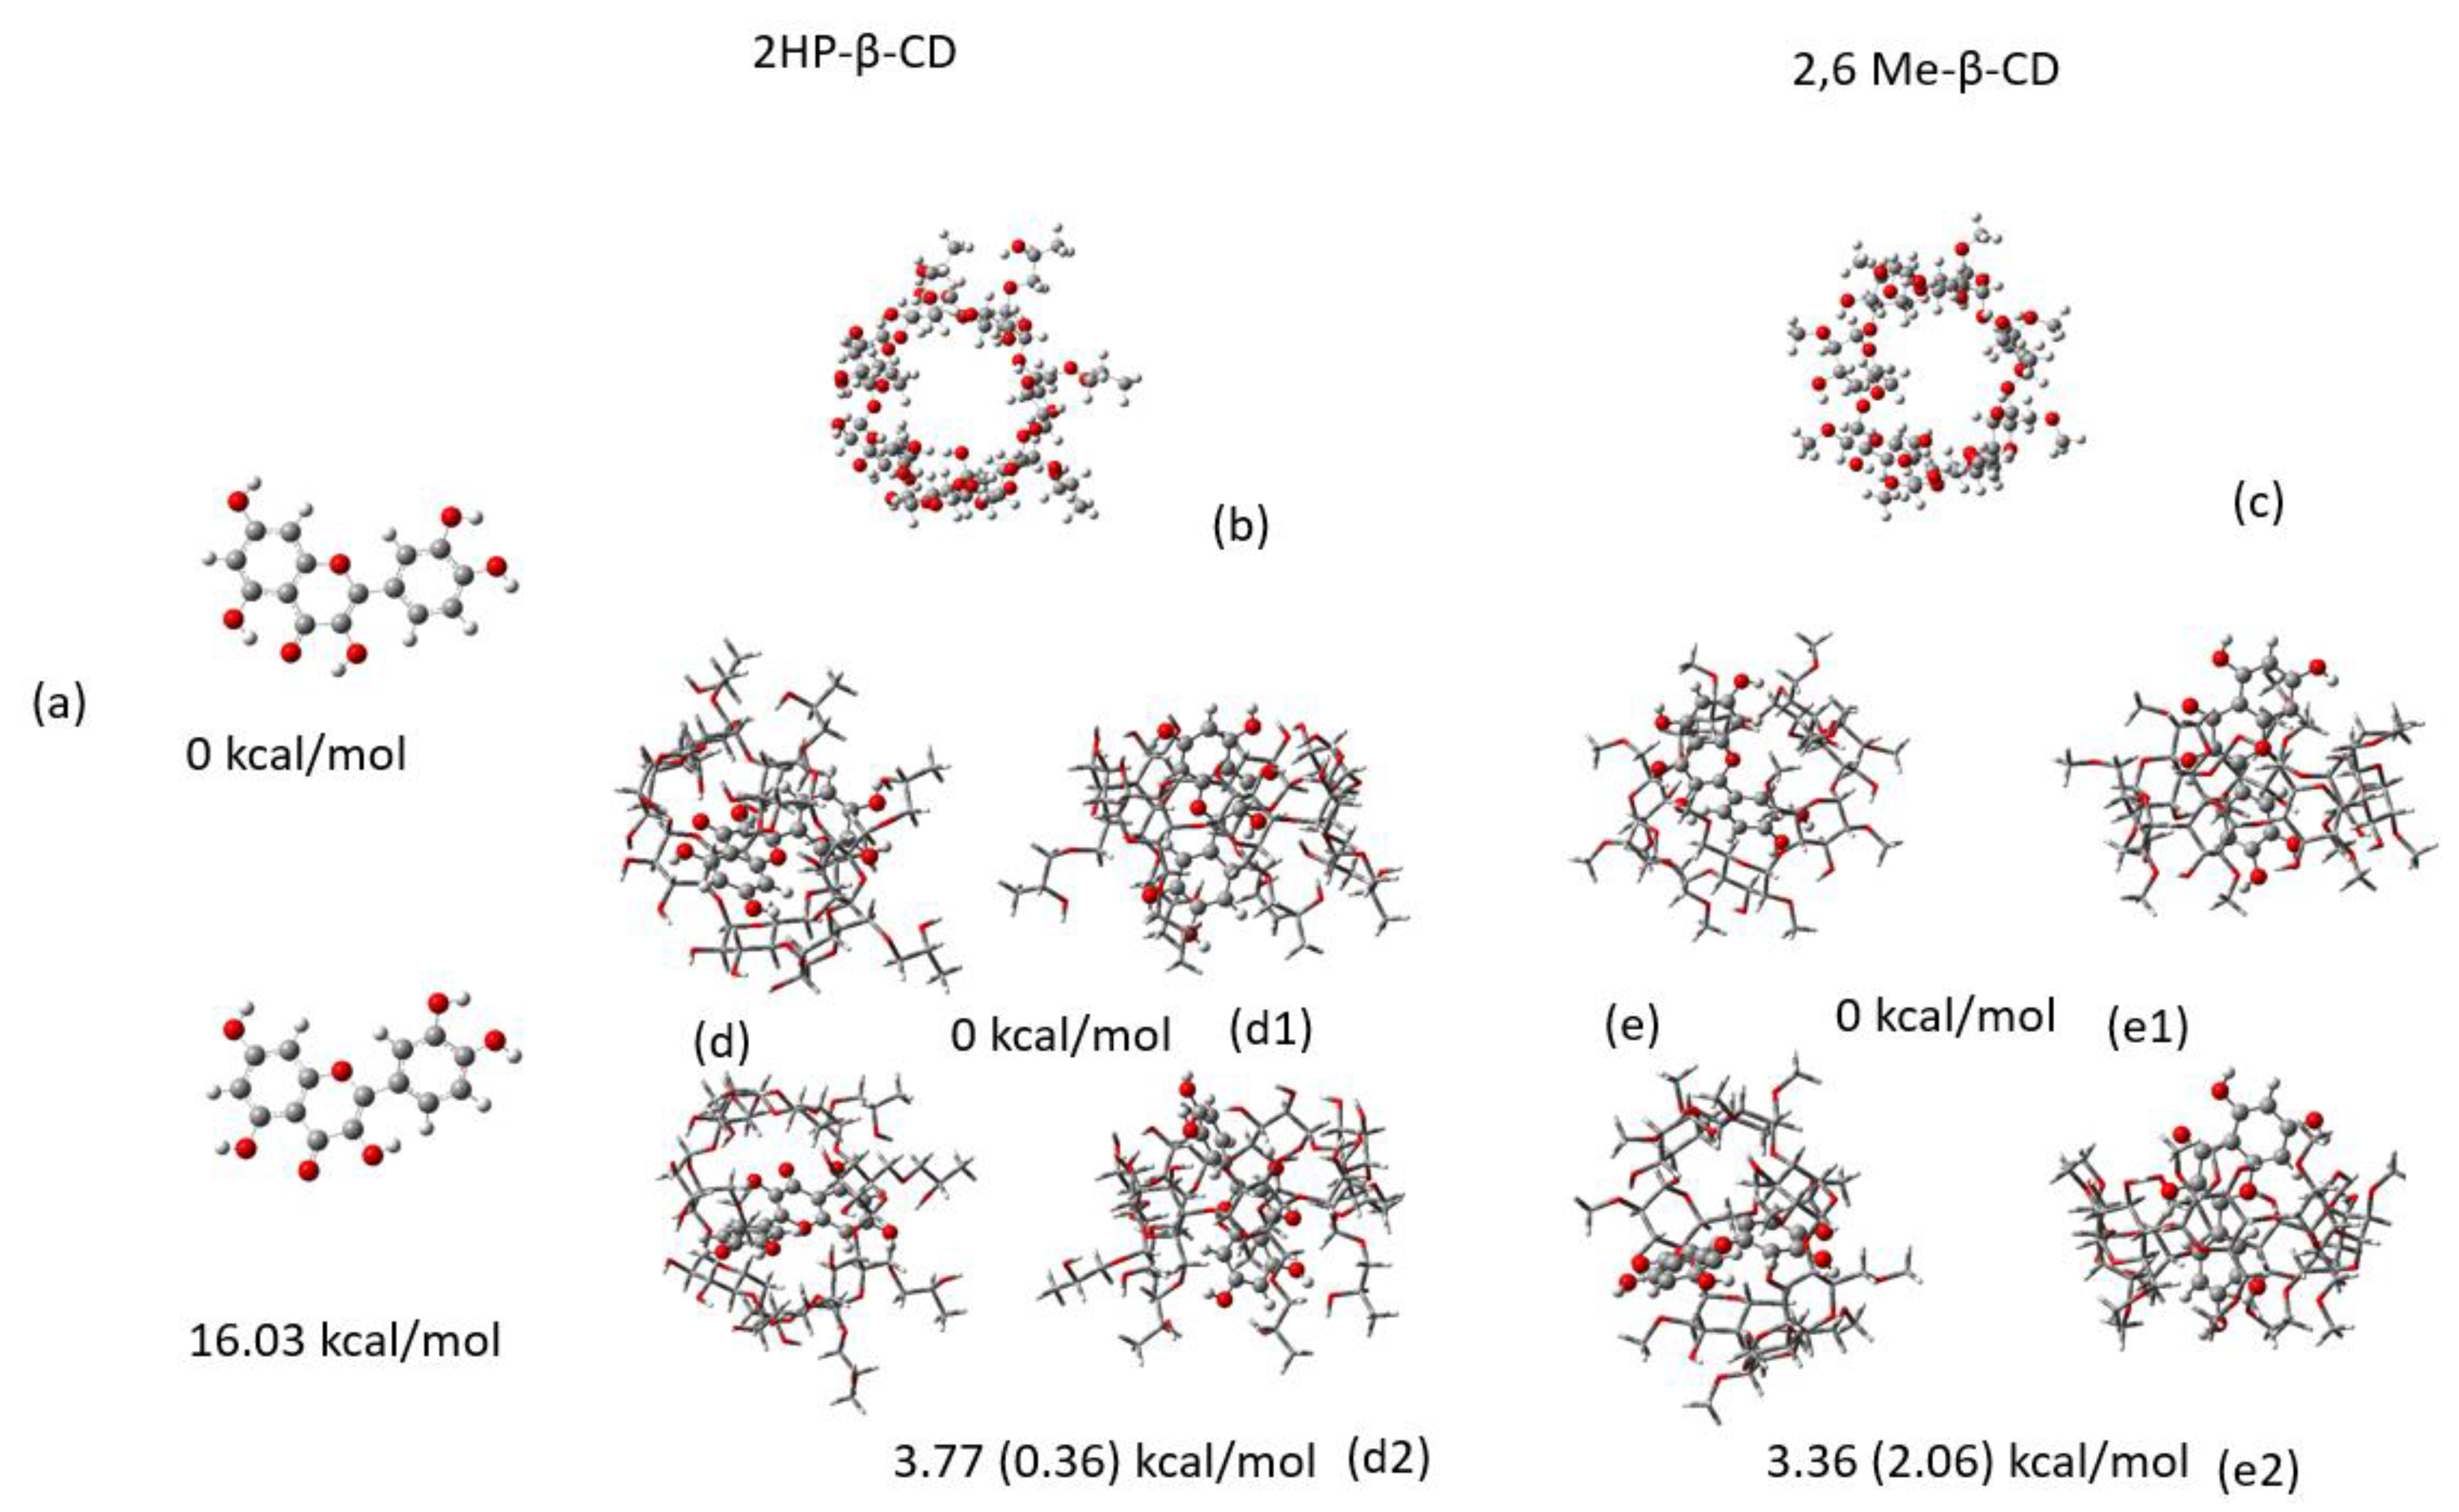
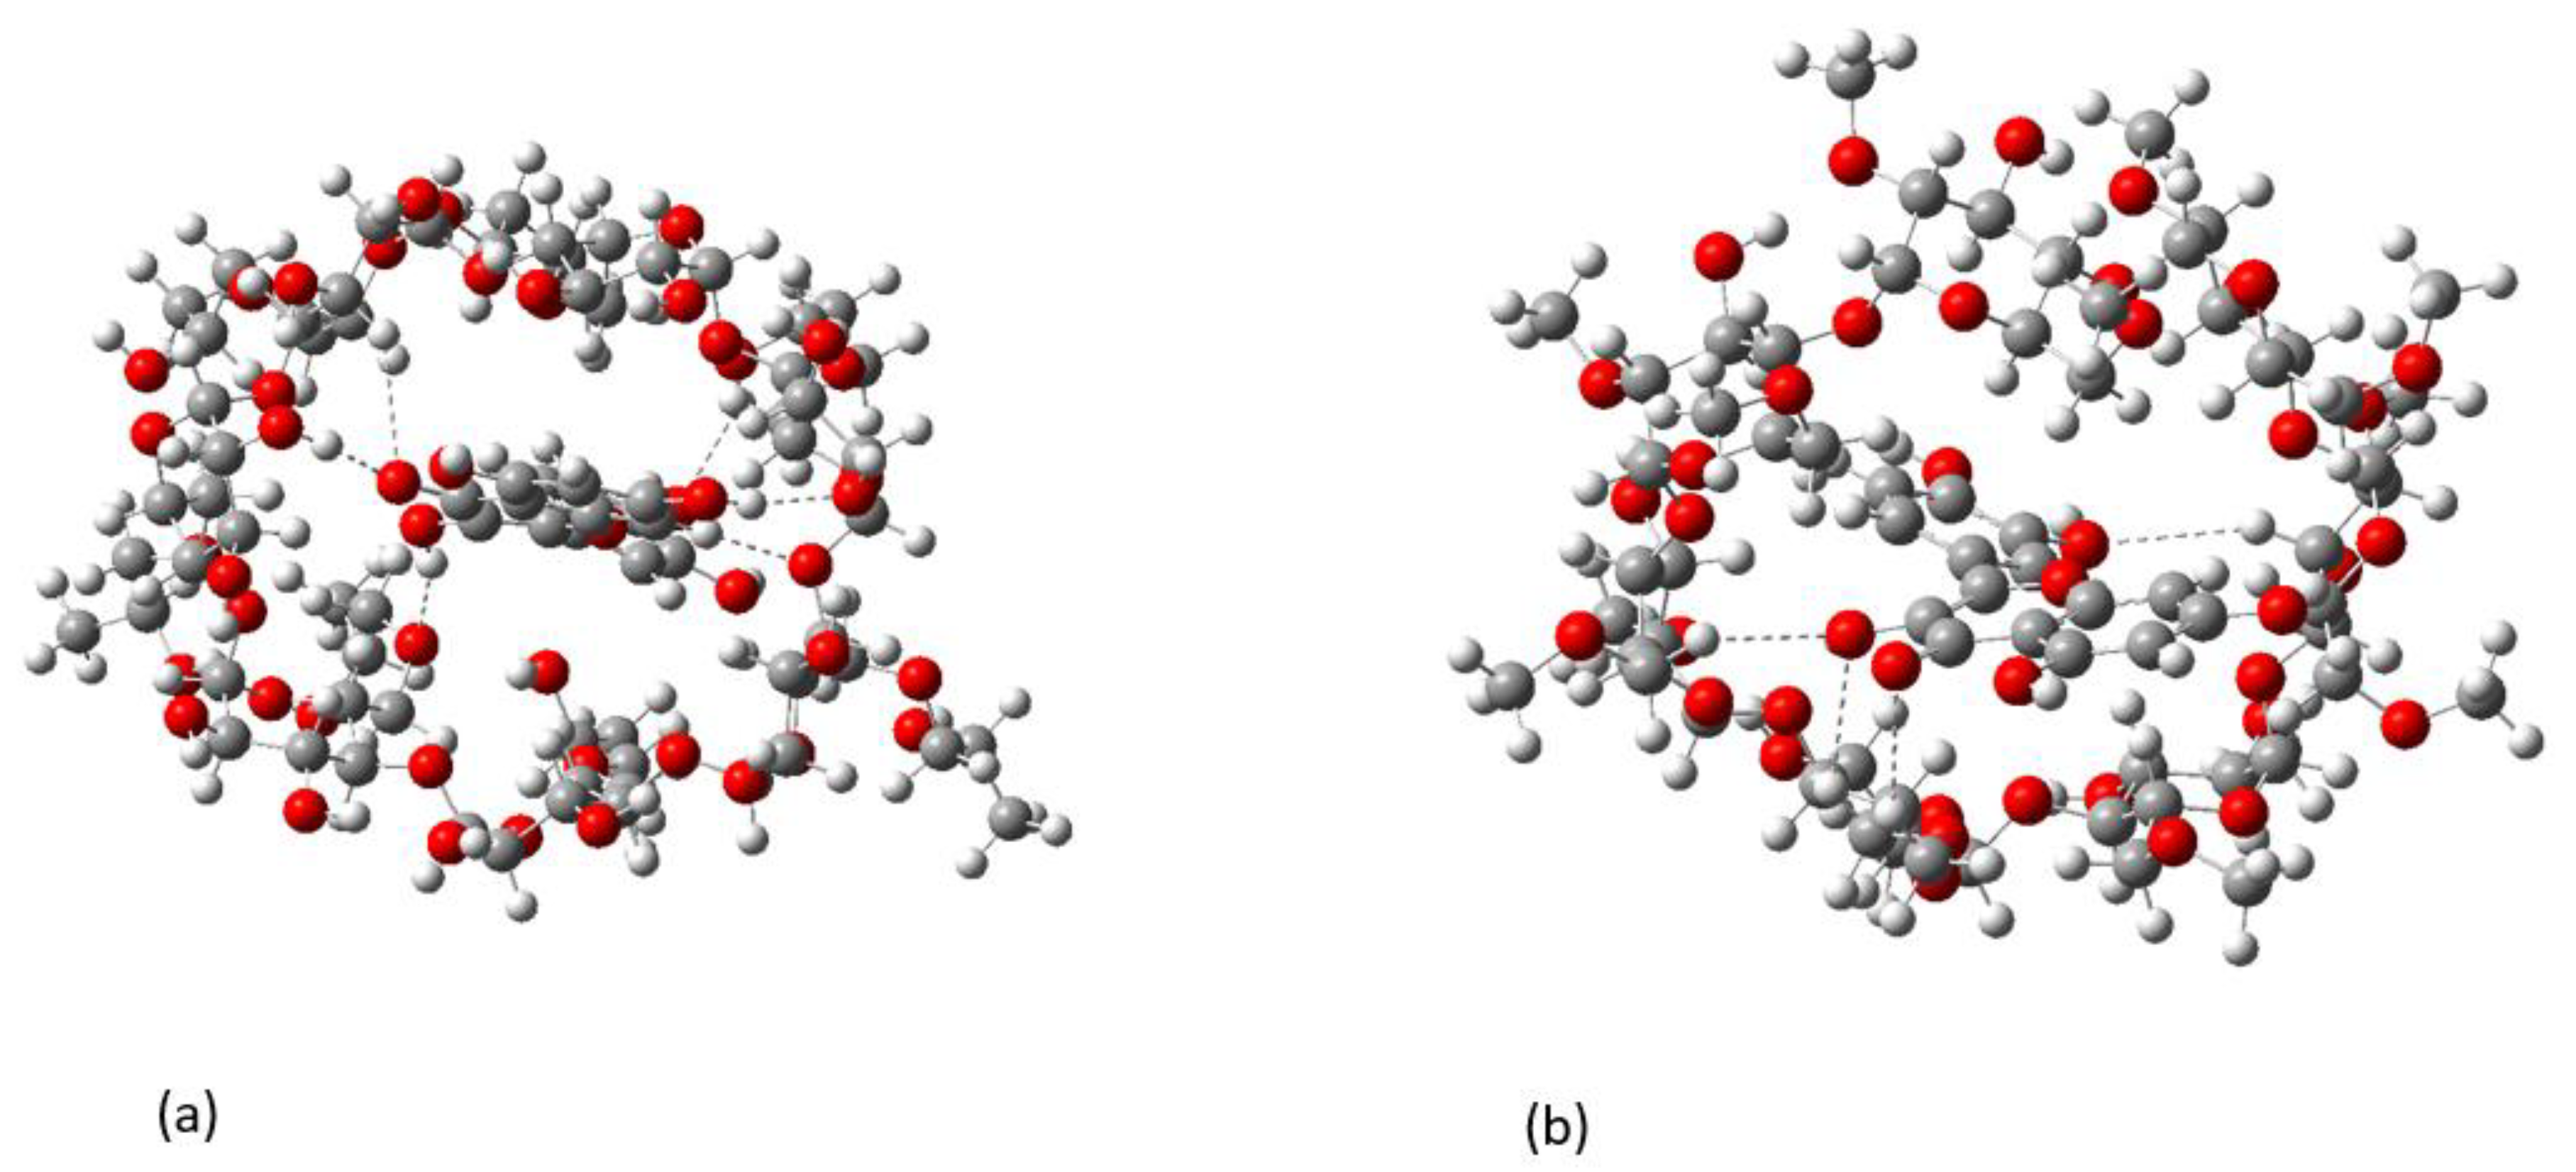
2.2. Conformational Analysis

The minimum energy conformations of QUE, 2HP-β-CD, 2,6Me-β-CD and the corresponding QUE-CD complexes have been calculated using DFT(B3LYP/6-31G(d,p) in water and are shown in Figure 6. QUE inserted into the cavity of CD, and its hydroxyl groups interact with the hydroxypropyl groups of 2HP-β-CD. 2,6Μe-β-CD encapsulates QUE in a similar fashion. It should be noted that to perform these calculations two initial starting configurations of QUE in CD were employed: (a) the resorcinol group interacting with the -OH rim of the CD and (b) the catechol group interacting with the -OH rim. Interestingly, the lowest energy encapsulation complex has the QUE molecule inserted in a different direction in the two CD molecules. The lowest energy structure is obtained when resorcinol group interacts with the -OH rim of the 2HP-β-CD and in the case of 2,6Μe-β-CD the lowest energy structure is obtained when the QUE catechol group interacts with the -OH and methoxy rim of 2,6Μe-β-CD. The remaining conformers, where the catechol of QUE interacts with the -OH rim (2HP-β-CD) and resorcinol of QUE interacts with the -OH and methoxy rim (2,6Μe-β-CD) are local energy minima lying energetically 3.77 kcal/mol and 3.36 kcal/mol above the global encapsulated minima for the two complexes, at the B3LYP/6-31g(d,p) level of theory (Figure 6). It should be noted that the less accurate semiempirical PM6 method (compared to the DFT methodology) also predicts the same encapsulation complexes as DFT does, but their energy differences are smaller, see Figure 6.
The lowest energy structure for QUE forms two intramolecular hydrogen bonds, O…HO. However, when QUE is encapsulated in both CD molecules, these two intramolecular bonds break, and new intermolecular hydrogen bonds are formed between the OH of QUE and O and HO atoms of the CD molecules. Thus, the encapsulated conformer of QUE has not adopted the lowest energy structure but one which is 16.0 kcal/mol higher in energy. This conformer does not have any intramolecular bonds and the catechol group is twisted by 37.5 degrees with respect to the pyran group due to H … H repulsion. The hydrogen bonds between QUE with 2HP-β-CD (a) and 2,6Μe-β-CD (b) are shown in Figure 7. Six hydrogen bonds are formed that range from 2 to 2.8 Å in the case of 2HP-β-CD and four hydrogen bonds are formed with 2,6Μe-β-CD within 2.8 Å. It is important to note that binging energies of H...O interactions longer than 2.8 Å are almost zero [51]. The complexation energies and the deformation energies of the involved CD and QUE molecules are shown in Table 8.
All calculations were corrected via basis set superposition error (BSSE) [52]. We found that deformation energies, such as the energy difference between the structures of QUE and CDs within the complexes and the corresponding free conformer, are 3.89 and 20.15 kcal/mol for 2HP-β-CD (d1 of Figure 6) and 7.31 and 20.75 kcal/mol for 2,6Μe-β-CD (d2 of Fig11), respectively. These values show that the compounds are deformed to increase their interactions. The corrected BSSE binding energy is about 11 kcal/mol for 2HP-β-CD and e1 structure of 2,6Μe-β-CD, while it is 11.7 and 20.0 kcal/mol for the e1 and e2 structures, respectively. As a result, QUE can enter and exit reversibly from both CDs. However, the binding energy BEr with respect to the deformed structures of the molecules of the complex is large enough, namely, −33.0 kcal/mol and −11.5 (−24.2) kcal/mol, showing that the complexes can be isolated and as a result, they can be prepared for NMR experiments. This energy characterizes the structural changes of the complex with respect to the isolated molecules.

2.3. MM/GBSA Estimates of the Free Energy of Binding Using MD Simulations

The binding free energy of QUE inside 2HP-β-CD and 2,6Me-β-CD for the first five representative structures of each system calculated from the all-atom MD simulations was assessed using the MM/GBSA method (Table 9). The first cluster representative structures for QUE/2HP-β-CD and QUE/2,6Me-β-CD complexes are depicted in Figure 8. The total binding free energy of QUE/2HP-β-CD is predicted to be −31.73 ± 3.21 kcal/mol, while the binding free energy of QUE/2,6Me-β-CD is −26.77 ± 2.37 kcal/mol. The energy decomposition into individual contributions shows that binding is driven mainly by significant van der Waals interactions that are similar for both complexes, while hydrophobic surface interactions also have a favorable contribution (−12.70 ± 1.81 and −6.26 ± 1.54 kcal/mol for 2HP-β-CD and 2,6Me-β-CD, respectively). Coulombic interactions between QUE and the two CD complexes contribute favorably to binding; however, the total electrostatic contribution is unfavorable due to solvent effects. The total binding free energy of both complexes, as calculated from MM/GBSA, suggests that QUE has favorable binding affinity for both CDs and thus CDs may be considered as effective carriers of QUE. However, a clear distinction of the binding preference of QUE cannot be made due to the error of the MM/GBSA method, which is on the order of several kcal/mol. Concluding, MM/GBSA predicts that both the 2HP-β-CD and 2,6Me-β-CD have a favorable binding affinity for QUE of similar magnitude, in agreement with the NMR experiments.
Comparing the BE of the DFT calculations with those of the MM/GBSA both methodologies are in very good agreement, i.e., −33.0 kcal/mol (DFT) and −31.73 ± 3.21 kcal/mol (MM/GBSA) for QUE/2HP-β-CD. In the case of the QUE/2,6Me-β-CD, the MM/GBSA calculated value of −26.77 ± 2.37 kcal/mol, see below, is in very good agreement with the second DFT calculated conformer of the encapsulated structures, i.e., −24.2 kcal/mol.

2.4. Absolute Binding Free Energy Calculations

To further study the capability of CDs to act as potential carriers of QUE, we calculated the binding free energy of QUE inside 2HP-β-CD and 2,6Me-β-CD using MD simulations coupled with absolute free energy calculations and a non-equilibrium setup for faster convergence [53,54]. The work values obtained from the non-equilibrium TI simulations and the corresponding work distributions for both QUE/CD systems are depicted in Supplementary Figures S9 and S10. Figures S9 and S10 depict overlapping work distributions for the QUE solvation leg of the thermodynamic cycle for both systems, which is helpful to assess the sampling and convergence of the simulations using the overlap of forward and reverse work distributions.
The calculated binding free energies (Table 10) show that both 2,6Me-β-CD (−5.09 ± 0.76 kcal/mol) and 2HP-β-CD (−1.40 ± 0.76 kcal/mol) have a favorable binding affinity for QUE with a ca. 3.5 kcal/mol preference for binding to 2,6Me-β-CD compared to 2HP-β-CD, indicating that both the 2HP-β-CD and 2,6Me-β-CD systems should be further studied as complexing agents to increase the aqueous solubility of QUE. These binding affinities are in agreement with the NMR results (Table 5) that showed that the percentage of chemical shift changes is more significant in the case of 2,6Μe-β-CD compared to 2HP-β-CD.

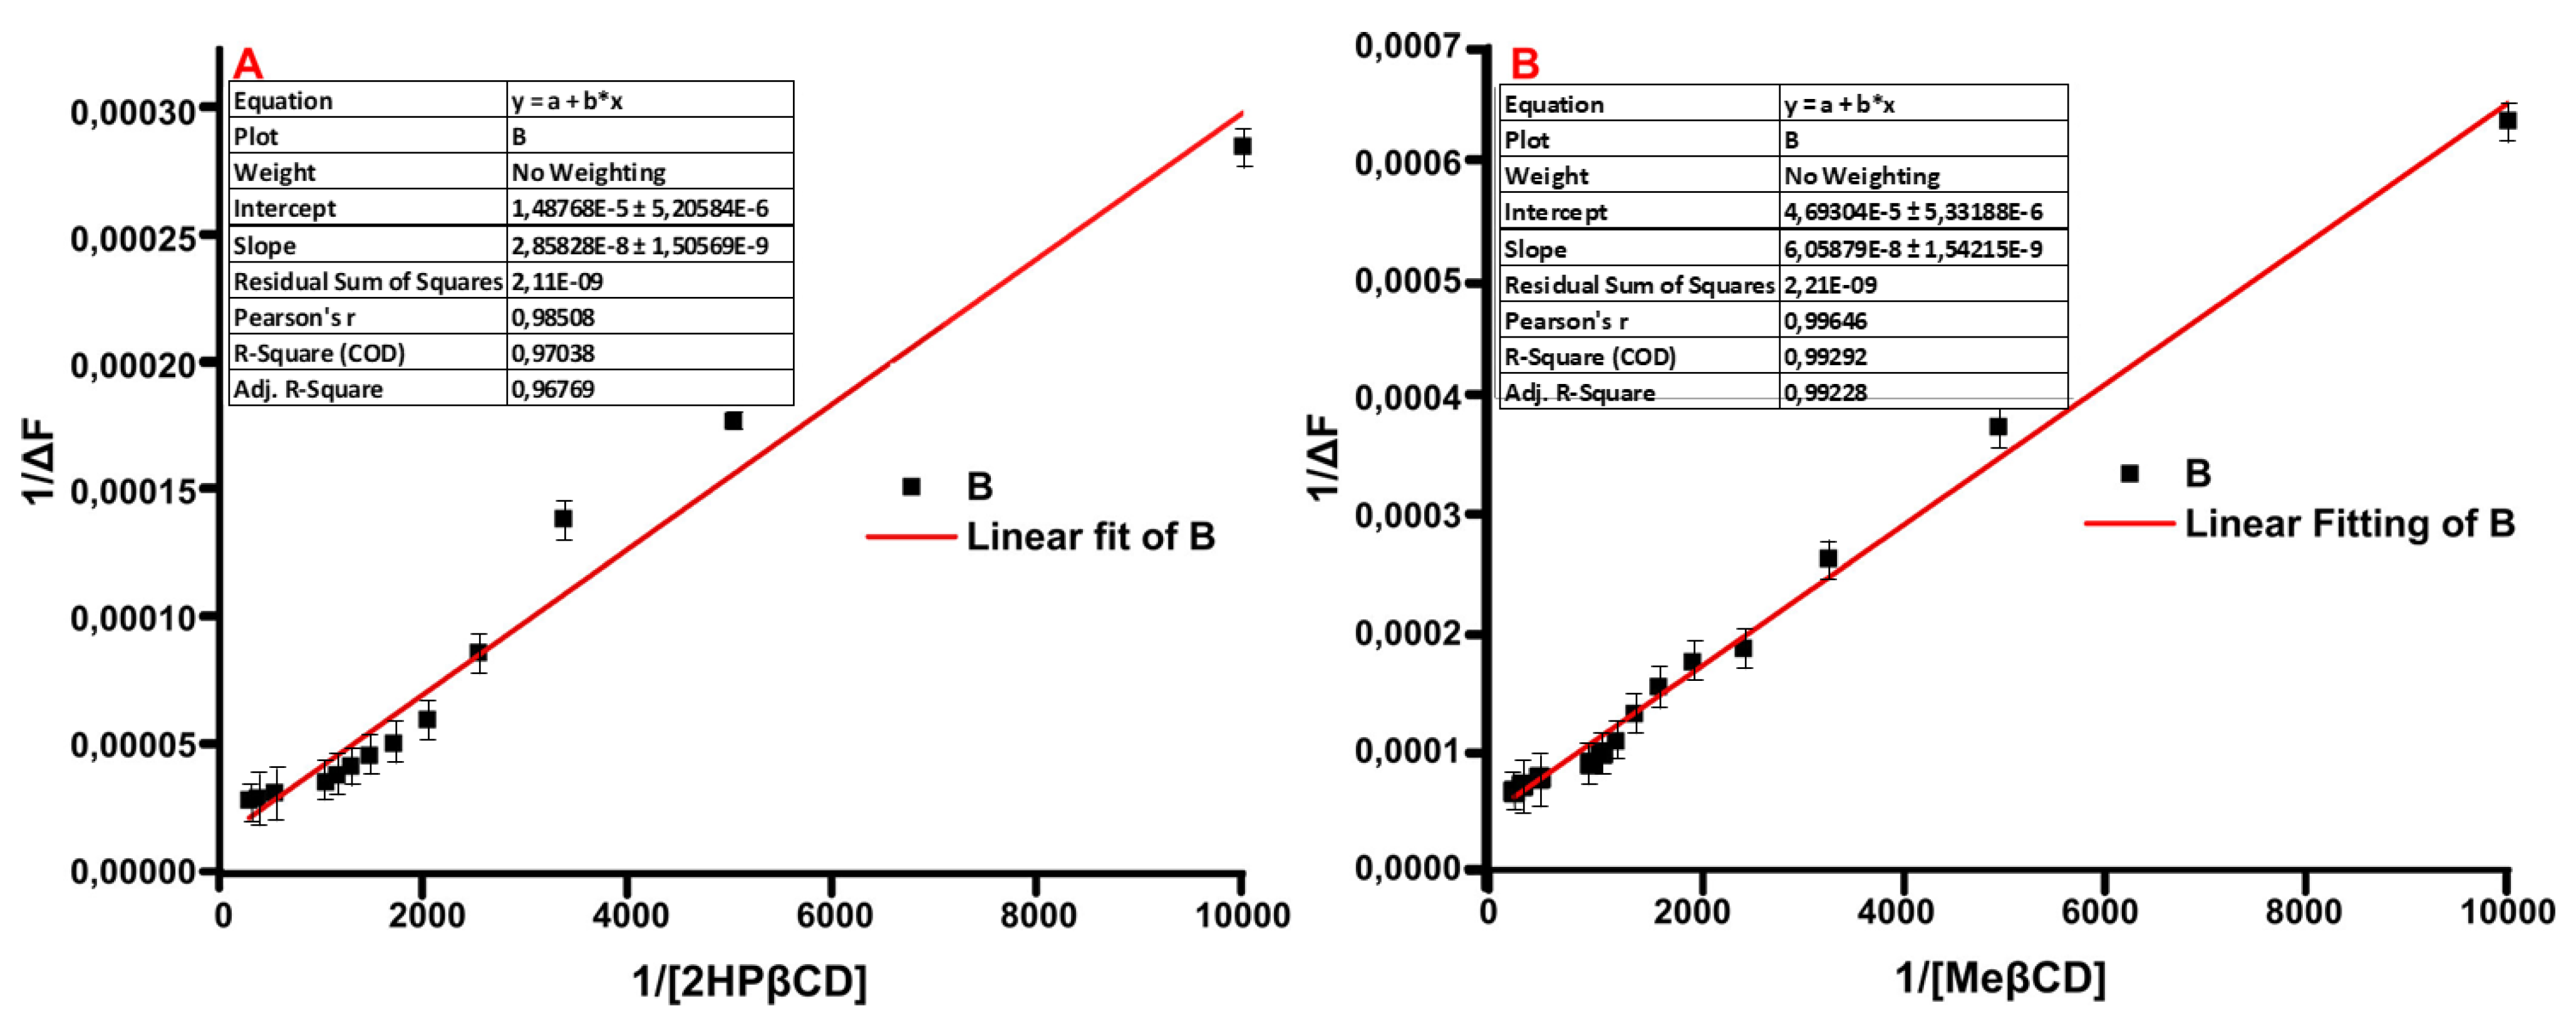
2.5. Fluorescence Spectroscopy

To determine the interaction between QUE and CDs, fluorescence spectroscopy was performed. The fluorescence intensity of a small ligand can be altered upon the encapsulation in the cavity of a supramolecule such as CD [55,56] The spectroscopic behavior of the ligand was explored by adding increasing concentrations of either 2HP-β-CD or 2,6Me-β-CD into a specific concentration of QUE. Upon the gradual addition of the 2HP-β-CD, the fluorescent intensity of the formed physical mixture was enhanced by 1.84-fold while a 1.32-fold enhancement was recorded in the case of 2,6Me-β-CD (Figure 9). This particular enhancement of the fluorescence signal is usually observed, once a small molecule interacts with CD due to the changes occurring in the microenvironment of the small molecule upon encapsulation [57]. The binding constants of the complexes were derived from the Benesi−Hildebrand equation:
1 Δ F = 1 Δ F C + 1 K C Δ F C   [ C D ] 0
The straight line of the double reciprocal plot confirms the 1:1 stoichiometry of QUE with CDs and the binding constants were calculated equal to 520 ± 32 M−1 and 771 ± 51 M−1 for 2HP-β-CD and 2,6Me-β-CD, respectively, indicating a moderate affinity between the two molecules (Figure 10).

3. Materials and Methods

3.1. Chemicals

QUE (MW: 302.24 g/mol), 2,6Me-β-CD (MW: 1310 g/mol) and 2HP-β-CD (MW: 1460 g/mol) were purchased from Sigma-Aldrich (St. Louis, MO, USA), Fluka Chemika (Mexico City, Mexico US & Canada) and Ashland (Covington, KY, USA), respectively.

3.2. Preparation of the Complex

Lyophilized inclusion complex of QUE-Me-β-CD and QUE-HP-β-CD were prepared by freeze-drying aqueous solution of QUE-Me-β-CD and QUE-HP-β-CD, in molar ratio of 1:2, using the neutralization method, as described previously by Manta et al. [58]. Briefly, 2170 mg of 2,6Me-β-CD or 4800 mg of 2HP-β-CD were accurately weighed and transferred into a 600 mL glass vessel and suspended with 500 mL of purified water under magnetic stirring until complete dissolution of the cyclodextrin. Then, 500 mg of accurately weighed QUE were added and dissolved under continuous stirring and light protection (due to the photosensitivity of QUE), by adjusting the pH at approximately 9.0–9.5 with ammonium hydroxide solution 6% v/v. The volume of the obtained clear and colorless solution was fixed at 600 mL with purified water and was immediately frozen at −73 °C, and freeze-dried using Vacuum Freeze-Dryer, BK-FD10T, Biobase biodustry (Jinan, China) Co., Ltd.

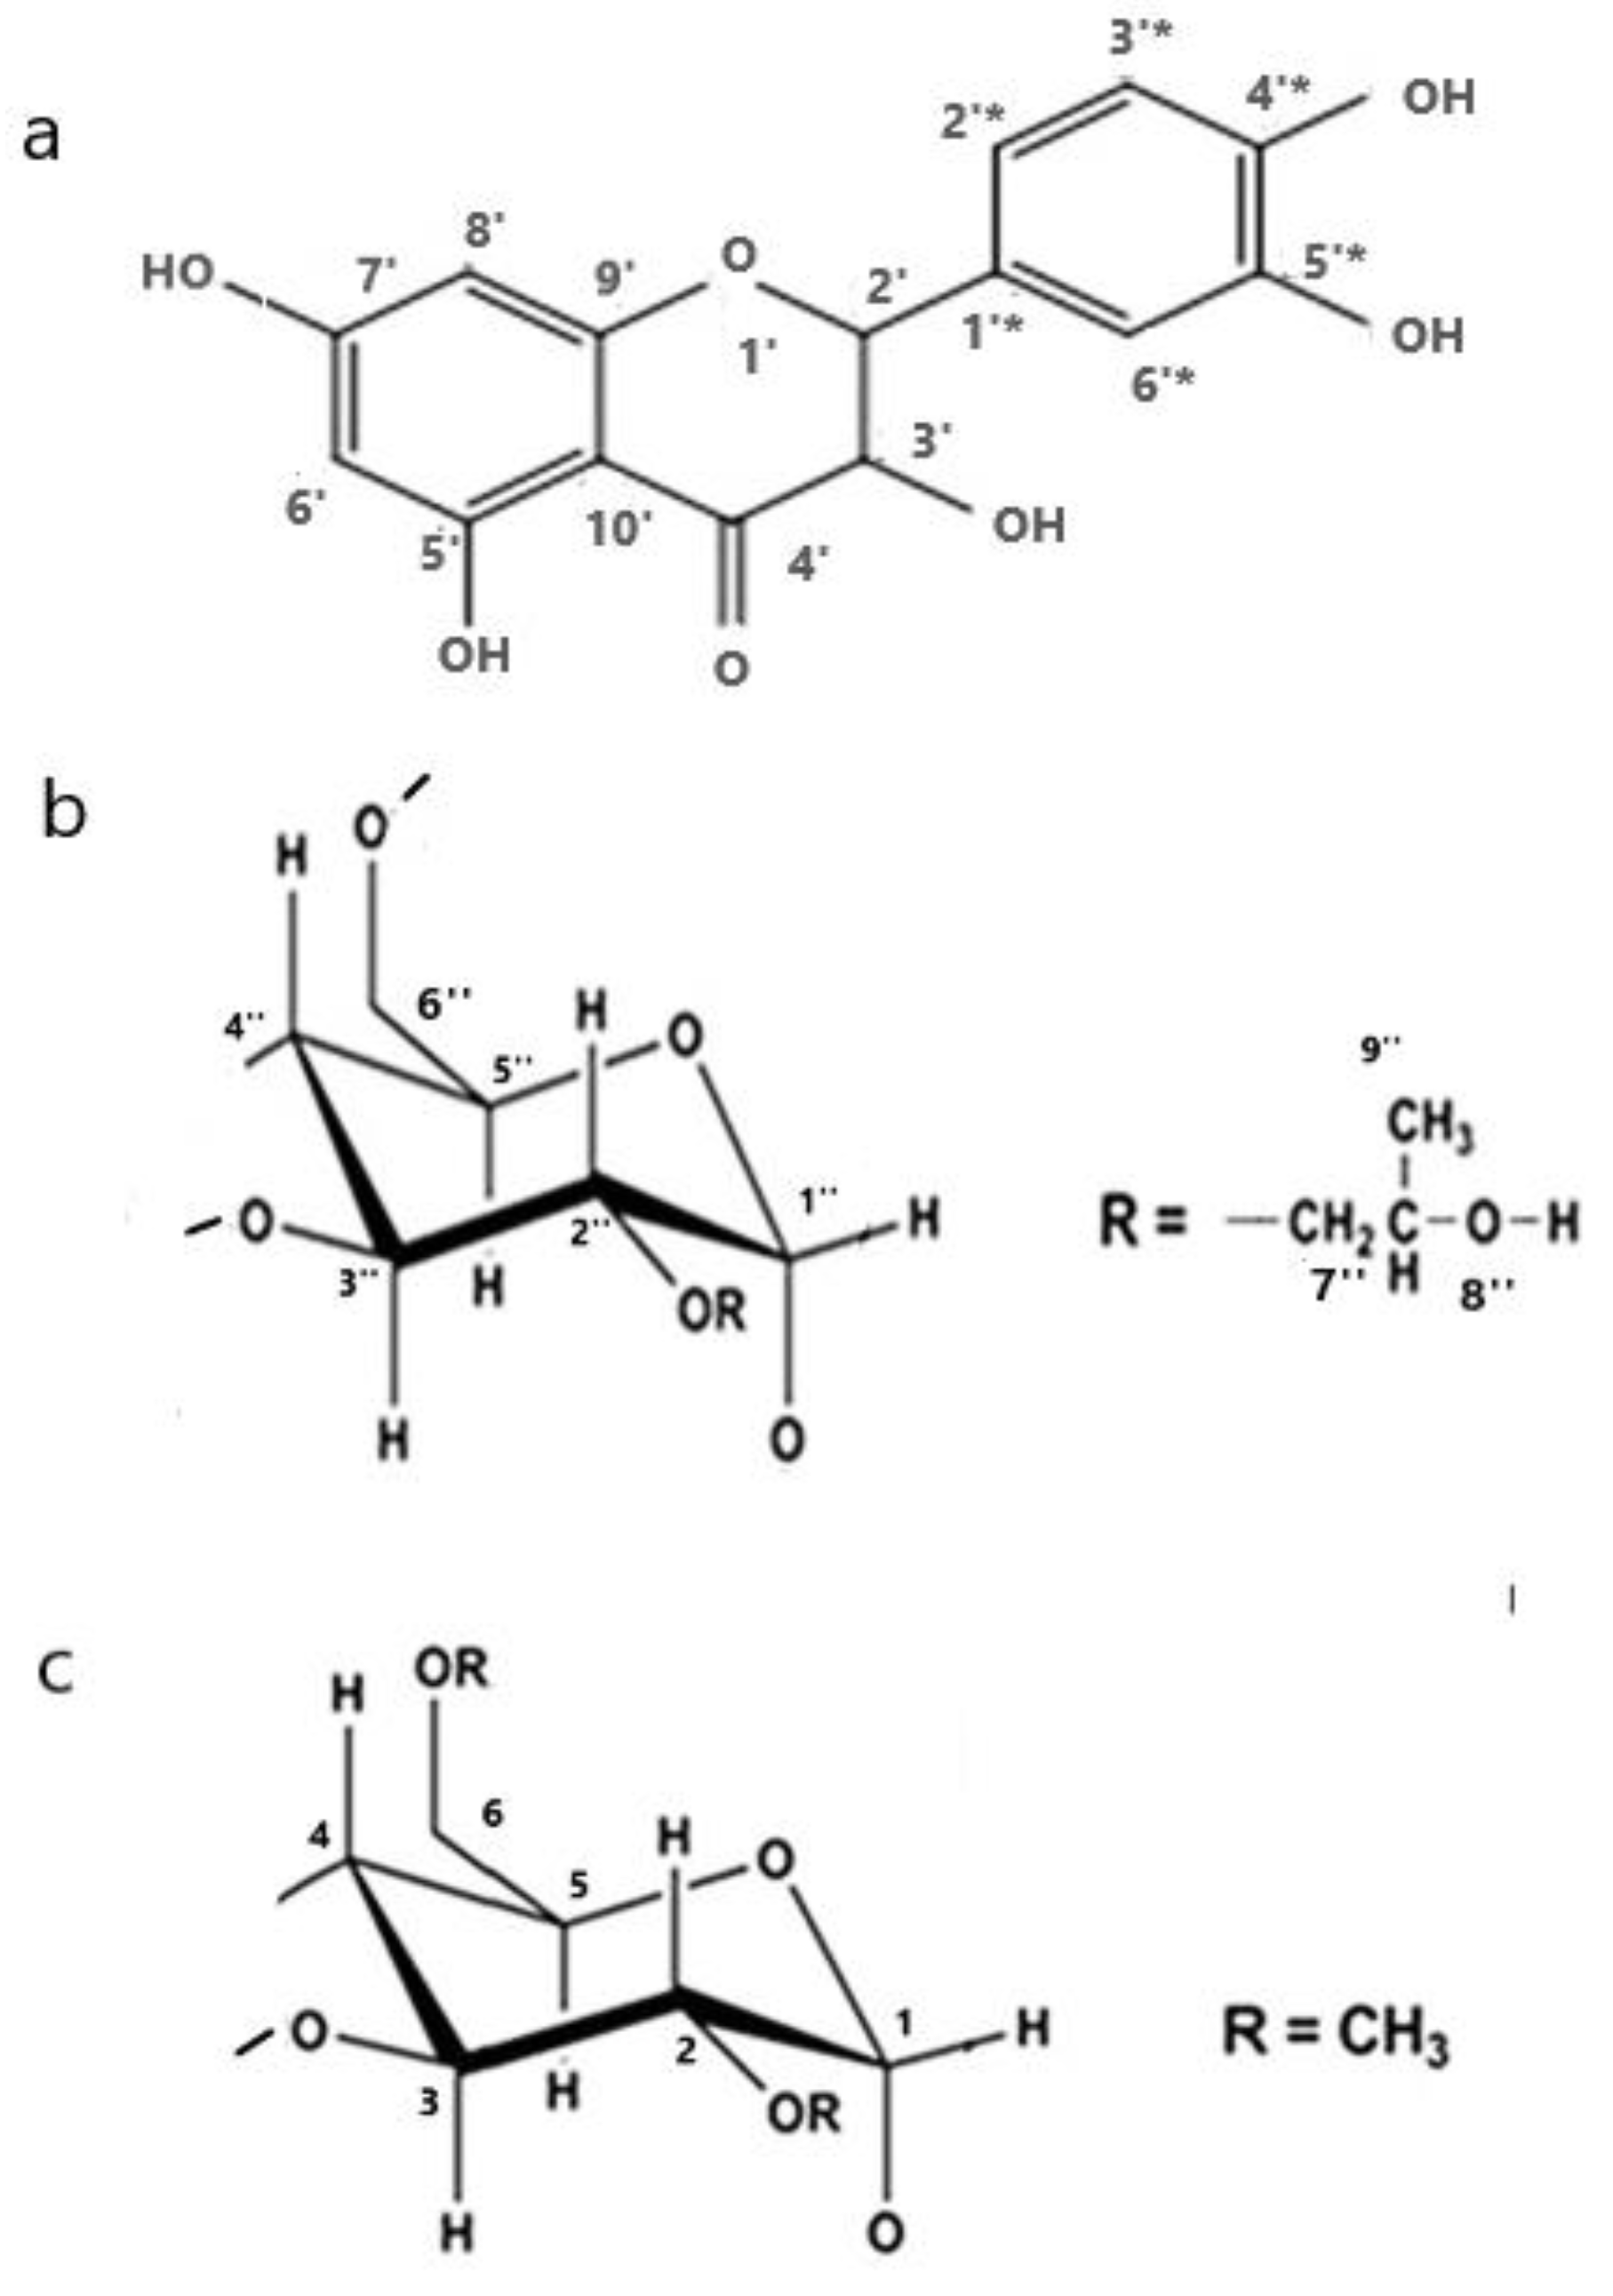
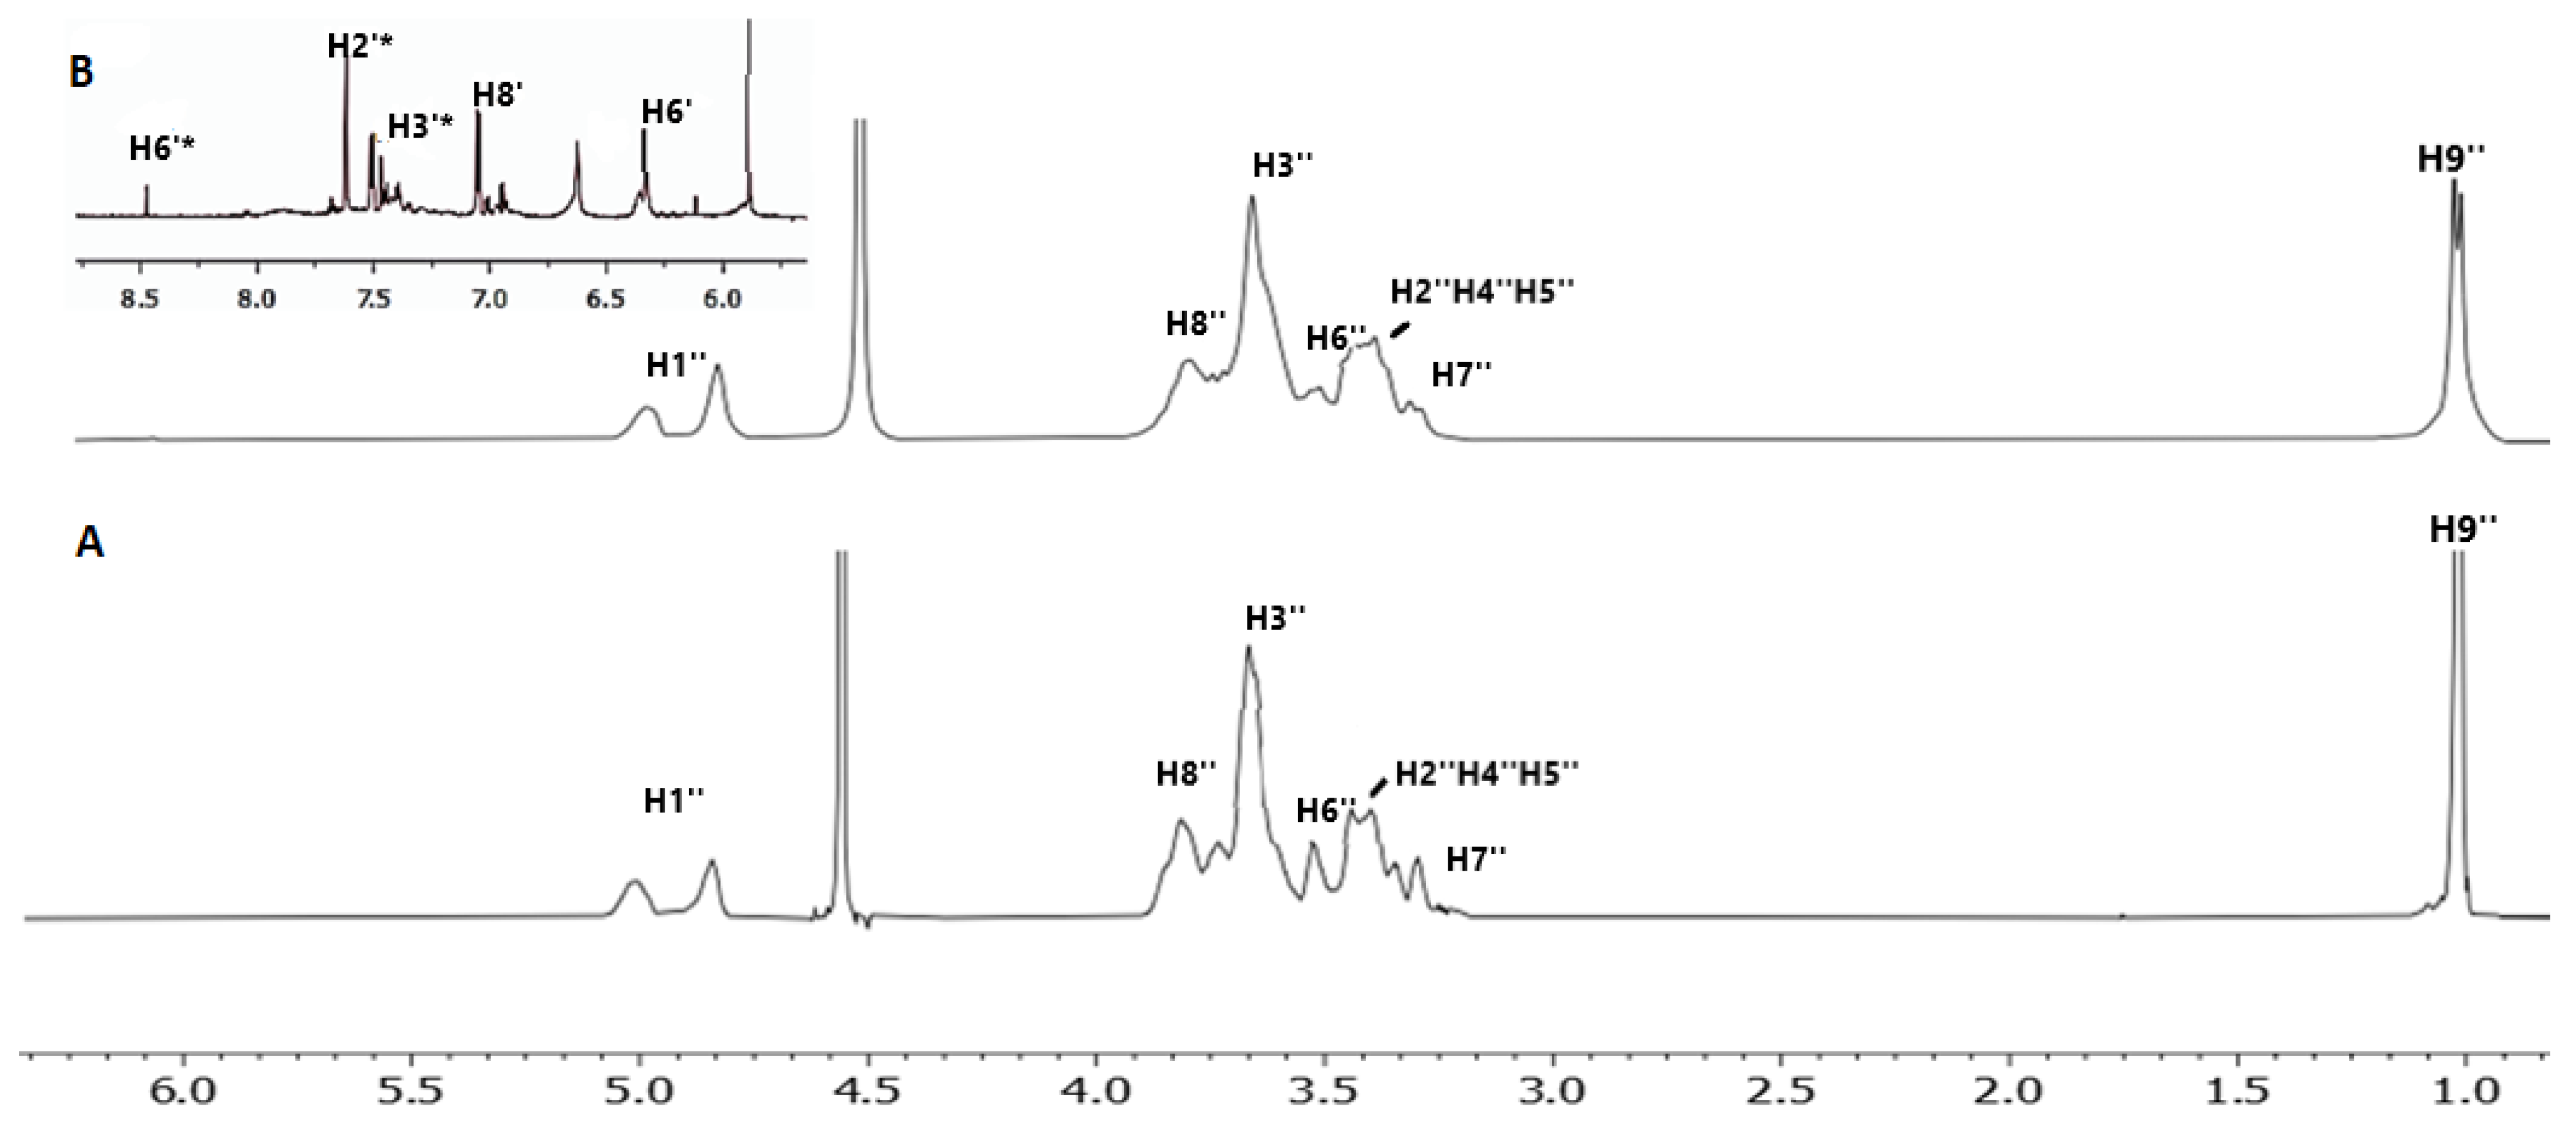
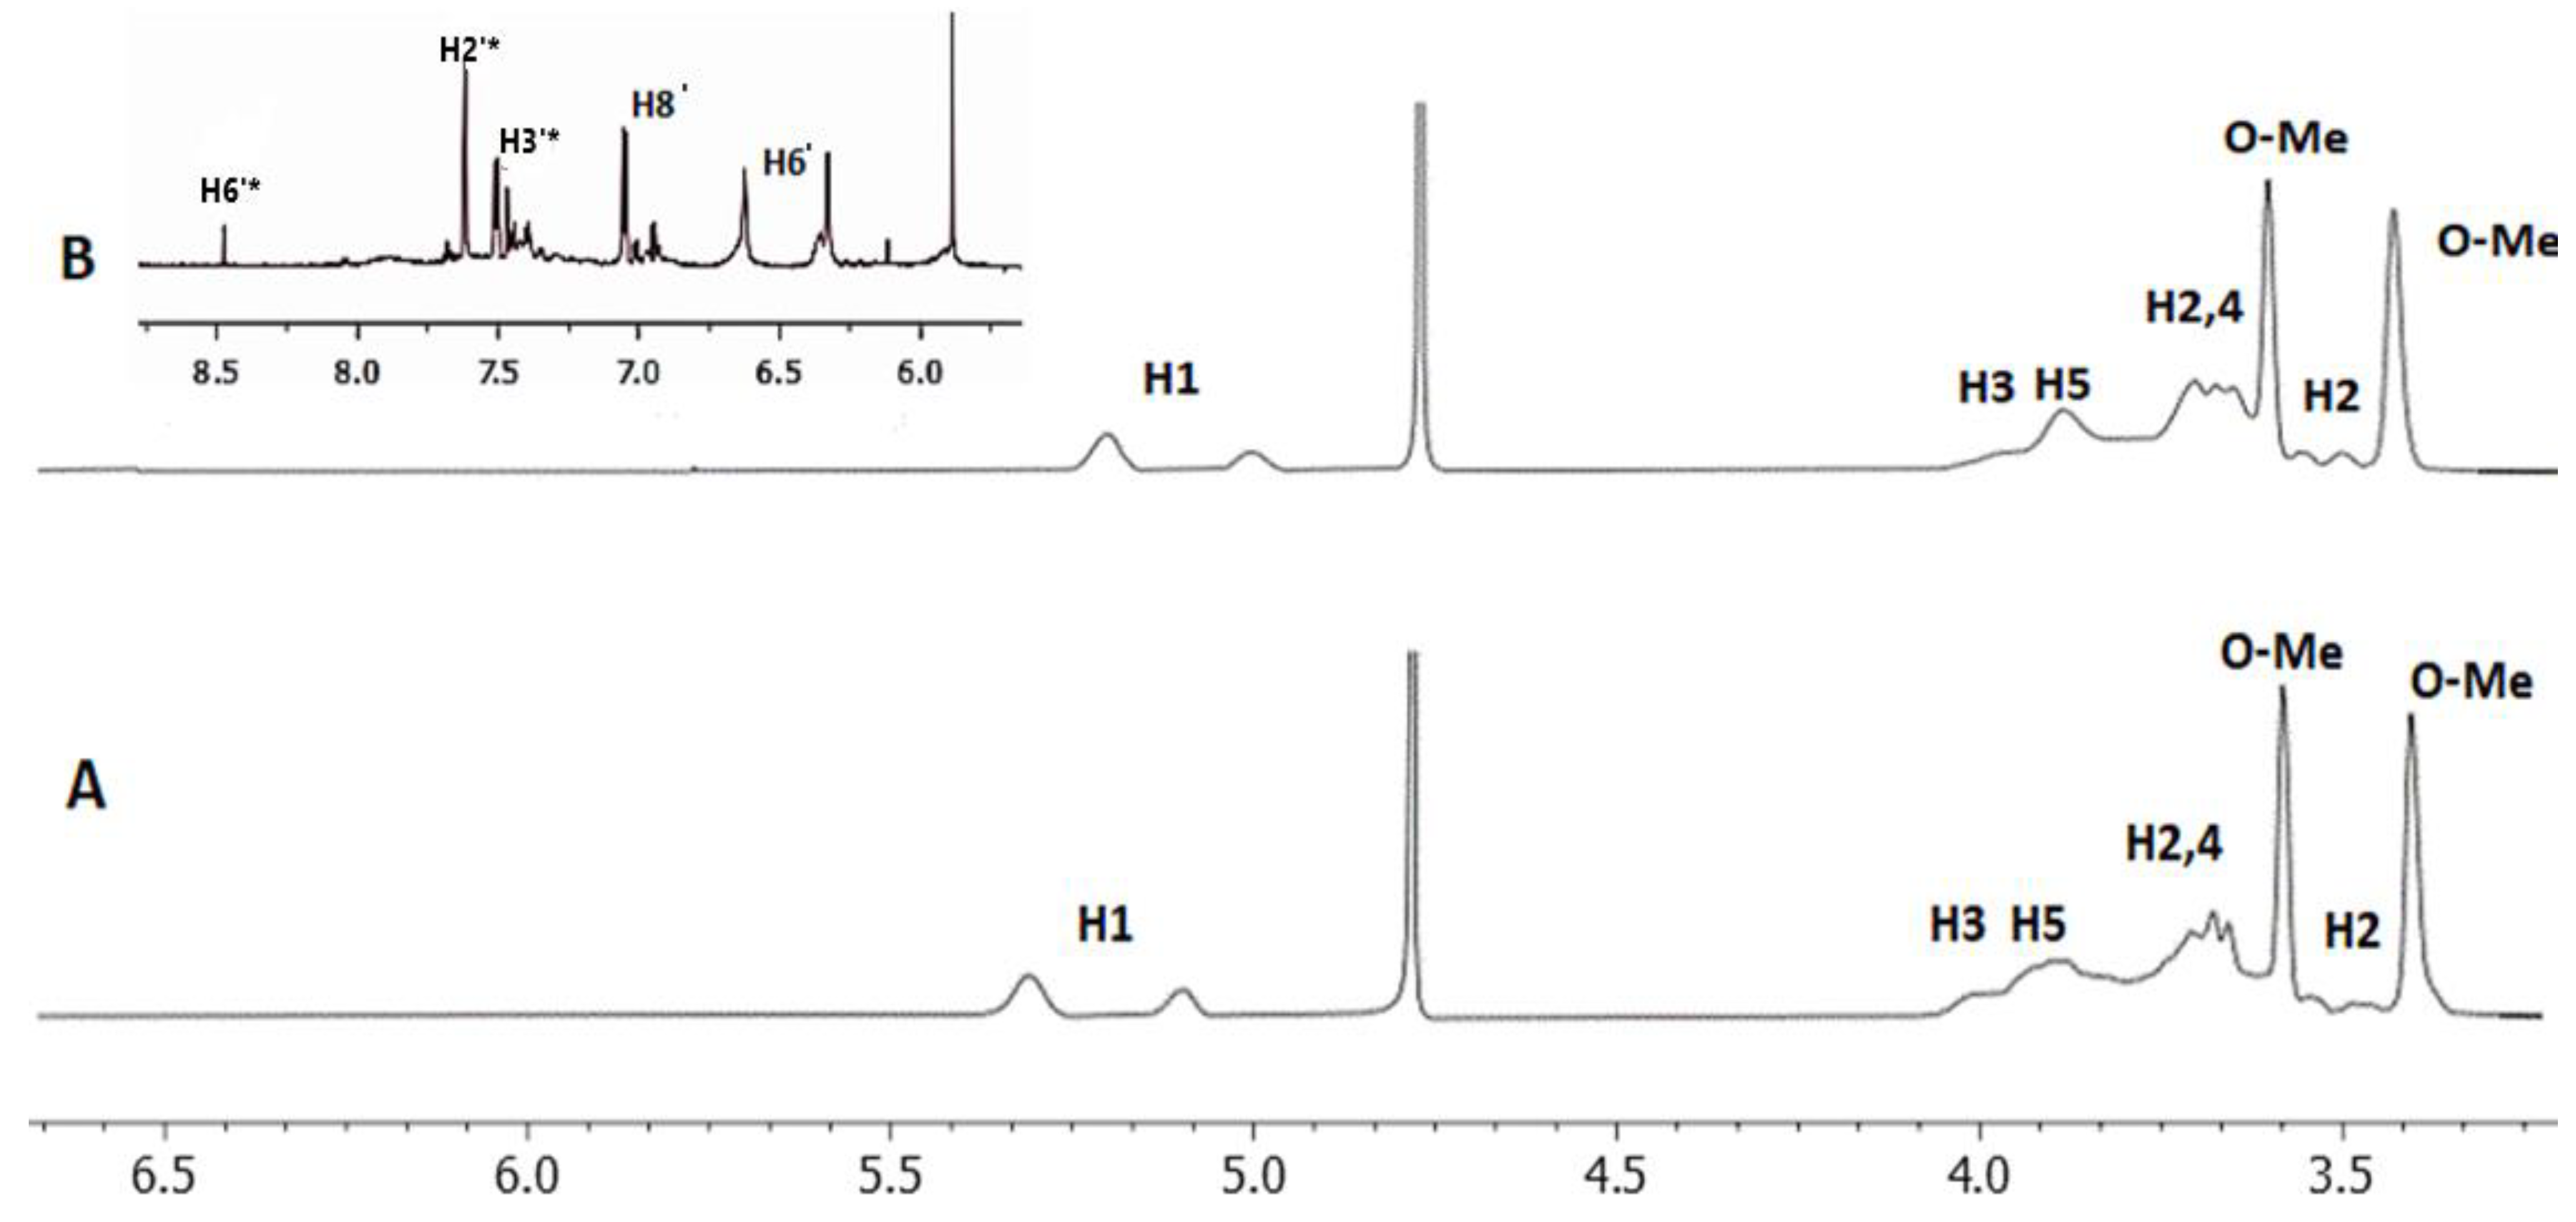
3.3. High Resolution 1H NMR Spectroscopy

Samples were dissolved in 0.6 mL of D2O at a concentration of 10mM and transferred to 5 mm NMR tubes.
DOSY spectra of QUE complexes were recorded on an Agilent Technologies VNMRS 8600 MHz NMR spectrometer with a 5 mm HCN cold probe. The DgcsteSL_cc sequence was used to record DOSY spectra with 65,536 points, 1 s relaxation delay, and 16 repetitions. Thirty-two gradient strengths between zero and 60 gauss/cm were used. All spectra were recorded at 25 °C. Chemical shifts are referenced with respect to the lock frequency and reported relative to TMS.
1H, NOESY and Τ1 experiments were performed on 400 MHz Bruker Avance using the spin-echo pulse sequence installed in the library of the NMR spectrometer. The variable delay list for T1 measurements contained 10 different values for τ that were applied between 90° and 180°. The calculation of T1 for each proton was done using the MestReNova program. The equation of three parameters used was:
Β + F × exp(−x*G)
where Β = magnetic induction field and F = spectral width and G = 1/T.

3.4. Conformational Analysis (Quantum Mechanics Calculations)

Additionally, the interactions between the 2HP-β-CD and 2,6Μe-β-CD with QUE were calculated via DFT. At first, QUE was optimized using the B3LYP [59,60]/6-31g(d,p) [61] to find the lowest energy structure. Additionally, conformational analysis [52] was carried out for the 2HP-β-CD and 2,6Μe-β-CD to find the lowest energy structure using the B3LYP/6-31g(d,p). Subsequently, complexes with CD and QUE were optimized to find the lowest minima. All calculations were performed in water solvent employing the polarizable continuum model (PCM) [62]. Finally, the interaction energy between these two molecules was calculated and the binding energy was corrected using BSSE [63]. All the calculations and the visualization of the results were carried out via Gaussian 16 [64].

3.5. MD Simulations

The crystal structure of β-CD was retrieved from the Cambridge Structural Database (CSD reference code: BUVSEQ02) [65] and was modified to 2-HP-β-CD and 2,6Me-β-CD using Schrodinger 2021.2. QUE was docked into the interior of both CDs using the GlideXP algorithm of the Schrodinger suite [66,67,68].
To model the systems the CHARMM General Force Field (CGenFF) was used to model QUE [69], and 2HP-β-CD and 2,6Me-β-CD were parameterized using the ADD force-field [70]. Each QUE/CD complex was solvated using the TIP3P water model [71] in a cubic box ensuring a minimum distance of 15 Å between each complex atom and the edge of the periodic box. The QUE/CD complexes were initially minimized for 50,000 steps using conjugate gradient. The resulting QUE/CD complexes were subjected to all-atom MD simulations using NAMD2.14 [72] with the following protocol. First the system was gradually heated to 300 K (NVT ensemble). Then, an equilibration protocol for 10 ns was run at 1.01325 bar and 300 K in the NPT ensemble. Finally, equilibrium MD simulations of each complex were conducted for 500 ns. Temperature control was maintained by a Langevin thermostat [73] (300 K) and pressure by a Nosé-Hoover Langevin barostat [74,75]. Particle-mesh Ewald method [76] was employed for long-range electrostatics interactions with a maximum grid spacing of 1 Å. Non-bonded interactions were calculated with a cutoff of 12 Å and a switching distance of 10 Å. A 2 fs time step was used and the SHAKE [77] algorithm was employed to constrain hydrogen atoms.
To obtain the five most representative structures of the CD complexes, we clustered the conformations of each complex during the last 400 ns of each simulation using the gromos [78] algorithm of the gmx_cluster routine (GROMACS 2020.6) [79]. Root mean square deviation (RMSD) on the non-hydrogen atoms of each CD was used as the clustering criterion and a cutoff value of 1.5 Å was chosen in order to obtain balanced cluster sizes. The central structures of the first five more populated clusters were picked in order to acquire the five most representative structures of each system.
MM/GBSA analysis was performed with Prime (Schrodinger Suite) [80,81] for the first five representative structures of each system. To calculate the binding free energy of QUE to both CDs the following equation was used:
Δ G b i n d = G c o m p l e x G C D G Q U E
where Gcomplex, GCD and GQUE are the free energies for the complex, the receptor (2HP-β-CD and 2,6Me-β-CD in this case) and the ligand (QUE), respectively. ΔGbind is a sum of coulombic interactions (ΔGCoulomb), van der Waals (ΔGvdW), generalised Born electrostatic solvation energy (ΔGSolvGB), hydrophobic surfaces interactions (ΔGLipo), covalent energy (ΔGCovalent) and hydrogen-bonding corrections (ΔGHbond). These parameters are calculated using the variable dielectric solvent model (VSGB2.0) [82] with the OPLS4 [83] force field as implemented in Prime (Schrodinger, Inc., New York, NY, USA).
The reported binding free energies reflect the mean of the calculations performed for the first five representative structures. Statistical uncertainties are provided as the standard deviation of these calculations.

3.6. Absolute Binding Free Energy Calculations

A well-established non-equilibrium free energy workflow [53,54] was used to calculate the absolute binding free energy of QUE with 2HP-β-CD and 2,6Me-β-CD. In this method, a double decoupling scheme [84,85] is employed to trace the alchemical path from QUE in solution to a fully interacting QUE/CD system as depicted in Figure 11.
First, QUE, in its physical unbound state (state I), is decoupled from the surrounding environment by annihilating its partial charges and its van der Waals parameters (state II) in order to calculate Δ G s o l v e l e c + v d w . To keep the position and orientation of QUE close to that of a bound pose (state III), restraints, as defined by Boresch et al. [86], are introduced. The contribution of the added restraints   Δ G s o l v r e s t r is computed analytically with the protocol described by Boresch et al. [86]. By applying these restraints, state III can be assumed to be equivalent with a non-interacting molecule inside the CD cavity (state IV) since there are no interactions between QUE and CD. Finally, QUE interactions with the environment are turned back on (state V), providing the term Δ G p r o t e l e c + v d w , and the restraints are removed (state VI) to obtain Δ G p r o t r e s t r . The free energies of QUE solvation ( Δ G s o l v e l e c + v d w ) and CD/QUE coupling ( Δ G p r o t e l e c + v d w + Δ G p r o t r e s t r ) are calculated separately by performing multiple non-equilibrium transitions between the QUE coupling and decoupling directions. For every transition, the Hamiltonian is linearly interpolated between the two end states using a λ increment of 4.5 × 10⁻⁶ per time step. The derivatives of the Hamiltonian with respect to λ are recorded to obtain the non-equilibrium work distributions. Finally, the maximum likelihood estimator [87] based on the Crooks fluctuation theorem [88] is used to relate the equilibrium free energy differences between the two end states with the resulting non-equilibrium work distributions.
Therefore, to calculate the absolute binding free energy of QUE to both CDs Equation (3) [89] can be used:
Δ G b i n d = Δ G s o l v e l e c + v d w + Δ G s o l v r e s t r Δ G p r o t e l e c + v d w Δ G p r o t r e s t r
The MD/TI simulations were carried out using GROMACS 2021.4. [90] Force-field parameters for QUE, 2HP-β-CD and 2,6Me-β-CD were identical to those used in the Section 3.5. The systems were solvated using TIP3P water in a cubic box with 15 Å of padding between solute and box edges.
Initially, each system was minimized for 10,000 steps, followed by 1 ns of NVT and NPT equilibration. Then, a further 20 ns NPT simulation was performed to derive the orientational Boresch restraints. The restraints for each QUE/CD complex were defined by applying the MDRestraintsGenerator algorithm [91] on the final 20 ns NPT simulation. Briefly, this algorithm works as follows: Firstly, the most stable atoms of QUE are chosen as anchor points for the restraints. Then, all available CD heavy atoms within an 8 Å cutoff of the QUE anchor atoms over the 20 ns simulation are selected, and a list of potential Boresch restraints is generated. The bond, angle and dihedral values throughout the NPT simulation for all identified restraints are recorded and the set of restraints with the lowest standard deviation across all values is chosen as the orientational restraint of choice. The frame closest to the mean bond, angle, and dihedral values of this set of restraints for each QUE/CD complex over the 20 ns simulation is then used as a starting point for the non-equilibrium thermodynamic integration (TI) simulations.
To equilibrate the systems, 1 ns NPT equilibration was performed using the Berendsen thermostat [92] with a time constant of 1 ps to maintain the pressure to 1 atm. Then, 20 ns NPT of equilibration followed, the pressure was kept at 1 atm using the Parrinello-Rahman barostat [93] with a time constant of 2 ps and a compressibility of 4.5 × 10⁻⁵ bar−1 and the temperature was maintained at 298 K through Langevin dynamics with a collision frequency of 2 ps−1. The particle-mesh Ewald method [79] was employed for long-range electrostatics interactions with a maximum grid spacing of 1 Å. Short range electrostatic and van der Waals interactions were calculated with a cutoff of 12 Å and a switching distance of 10 Å. A 2 fs time step was used and hydrogen atoms were constrained using the LINCS [94] algorithm.
To perform the non-equilibrium TI simulations, a short equilibration procedure similar in protocol to the aforementioned equilibration cycle was performed for both QUE solvation (state I state II) and CD/QUE coupling (state V state VI). This was followed by a 10 ns NPT production using the Parrinello-Rahman barostat [93] with a time constant of 2 ps and a compressibility of 4.5 × 10⁻⁵ bar−1. Then, 95 equidistant snapshots were extracted from each of the resulting trajectories after discarding the first 0.4 ns for equilibration. Finally, for every snapshot, 500 ps non-equilibrium transitions were performed in both coupling and decoupling directions.
Pmx [95] was used to compute the free energy estimates from the resulting work distributions in both directions using a maximum likelihood estimator [87] based on the Crooks fluctuation theorem [88]. Uncertainties were estimated via bootstrap. For each QUE/CD complex, the non-equilibrium workflow was repeated 4 times and the reported binding free energies ( Δ G b i n d   a v e r a g e ) are the mean of the 4 replicates. Statistical uncertainties are provided by propagating the errors of the 4 replicates.
During the non-equilibrium TI simulations using GROMACS 2021.4, a non-bonded exclusion bug appeared as described in [96] and caused our simulations to stop. To solve this issue, we used the “couple-intramol = yes” flag, which causes the intra-molecular van der Waals and electrostatic interactions of QUE to be turned on and off during the simulations as suggested in [97] and [98]. The input files for these simulations are provided as SI information.

3.7. Fluorescence Spectroscopy Studies

Fluorescence spectroscopy experiments were conducted to determine the binding constant of QUE with 2HP-β-CD and 2,6Me-β-CD. The experiments were performed in an Edinburg FS5 spectrofluorometer (Edinburgh Instruments Ltd., Livingston, UK). The excitation and emission slits were set at 5 nm and the emission spectra were recorded using a quartz (1 cm cuvette), at room temperature. A stock solution of QUE was prepared in DMSO/PBS buffer (10 mM, pH 7.4) [50:50 v/v%] at a concentration of 100 μΜ and kept in dark. The CD stock solutions were prepared in dH2O at a concentration of 6 mM. The final concentration of QUE in the cuvette was 25 μΜ for each measurement. Various volumes from the CDs stock solution were added each time (0, 0.1, 0.2, 0.3, 0.4, 0.5, 0.6, 0.7, 0.8, 0.9, 1.0, 2.0, 3.0 and 4.0 mM). The final volume of each sample was 3 mL, adjusted each time with the proper amount of dH2O. The samples were kept stirred and protected from light for 30 min, before measurement. The excitation wavelength of QUE was set at 375 nm.
The binding constant between QUE and each CD was calculated based on the observed emission changes of the fluorescence spectrum upon the addition of different concentrations of 2HP-β-CD/2,6Me-β-CD. A titration curve at I550 was plotted by applying linear fitting. The binding constants were derived from the Benesi−Hildebrand equation:
1 Δ F = 1 Δ F C + 1 K C Δ F C   [ C D ] 0
where ΔF is the difference between the fluorescence intensities in the absence and presence of 2HP-β-CD/2,6MeβCD, Kc is the binding constant, ΔFC is the difference on intensity between free and complexed QUE at 1:1 molar ratio and [CD]0 is the concentration of 2HP-β-CD/2,6Me-β-CD.

4. Discussion and Conclusions

This study is a continuation of our previous study [57], where the interactions of 2,6-Me-CD with QUE were investigated and comparative studies were performed using only differential scanning calorimetry and solubility experiments. This additional study provides details on the molecular interactions between QUE and the two CDs through a variety of experimental and computational techniques. Using 2D NOESY experiments, the aromatic rings of QUE are clearly shown to be engulfed in the hydrophobic cavities of the two CDs. This finding was confirmed by MD simulations and DFT calculations. T1 relaxation experiments were very informative depicting the mobility of the protons in the free QUE and complexing form. The degree of their mobility reflects the interactions during the complexing in accordance with the 2D NOESY results.
MD simulations were employed to investigate the binding and thermodynamic stability of the two CD/QUE encapsulation complexes. As the candidate drug can adopt various conformations inside the cavity, long equilibrium MD simulations were performed to obtain the five most representative structures of QUE inside the two CDs. These structures were then subjected to MM/GBSA analysis to estimate the binding free energy of QUE inside 2HP-β-CD and 2,6Me-β-CD. MM/GBSA is an approximate method to compute absolute binding affinities with small computational effort, which has been successfully used in previous studies to reproduce and analyze the experimental findings of inclusion CD complexes [99,100]. The MM/GBSA results show favorable binding of QUE to both CDs with −31.73 ± 3.21 kcal/mol for 2HP-β-CD and −26.77 ± 2.37 kcal/mol for 2,6Me-β-CD). However, this method involves several approximations including the lack of conformational entropy and the effect of water molecules, which limits its accuracy [101]. For this reason, rigorous absolute free energy calculations [102,103,104,105] using MD as the sampling technique were also performed here to evaluate the absolute binding affinities of the CD/QUE complexes. Free energy perturbation (FEP) calculations, derived from statistical mechanics, can accurately compute free energy differences associated with the binding of a small molecule to a host, albeit being computationally intensive. The robustness of absolute FEP calculations is evidenced from the number of prospective and retrospective applications [53,54,106,107,108,109,110,111], including the robust calculation of binding free energies of inclusion cyclodextrin complexes in the context of the Statistical Assessment of the Modeling of Proteins and Ligands (SAMPL7) challenge [112]. Here, our absolute binding free energy calculations confirmed favorable binding of QUE on CD with −1.40 ± 0.76 kcal/mol for 2HP-β-CD and −5.09 ± 0.76 kcal/mol for 2,6Me-β-CD. NMR spectroscopy results (Table 5) also indicate that QUE complexes stronger with 2,6Me-β-CD than 2HP-β-CD based on the percentage of chemical shift changes. However, FEP/MD calculations also come with limitations such as the type of restraints used to prevent the ligand drifting away from the host cavity [113]. In addition, the degree of overlap between forward and reverse work distributions, which is associated with the degree of sampling of the phase space along the followed alchemical pathway, could also be a limiting factor regarding the accuracy of the method [114]. This factor became evident also in our calculations as denoted by the non-overlapping work distributions for the QUE coupling leg of the thermodynamic cycle for both systems (Figures S9 and S10). The poor overlap of the distributions suggests inadequate sampling of the configurational sampling and could be tackled by increasing the number of transitions employed for the non-equilibrium protocol as well as increasing the simulation length of each transition. Certainly, despite the high computational cost and the current technical challenges, absolute FEP calculations is a promising strategy to computationally assess binding affinities of CD/QUE complexes.
Quantum mechanical calculations that were also employed herein showed the formation of hydrogen bonds between QUE with 2HP-β-CD and 2,6Μe-β-CD. In particular, six hydrogen bonds are formed that range between 2 to 2.8 Å in the case of 2HP-β-CD and four hydrogen bonds within 2.8 Å with 2,6Μe-β-CD. Moderate binding was revealed using fluorescence spectroscopy (520 M−1 for 2HP-β-CD and 770 M−1 for 2,6Me-β-CD).
The 2D DOSY experiment provided unequivocal evidence of the complexation of the quercetin with two CDs with the same apparent translational diffusion coefficient equal to 1.9 × 10⁻¹⁰ m2 s−1. In the DOSY spectra of both formulations, smaller signals are presented in the aromatic region of the 1H NMR spectrum, which appear with larger Dt values (around 3 × 10⁻¹⁰ m2 s−1). This result signifies that a fraction of the quercetin in both samples is unbound and is in a slow exchange equilibrium with the bound form. These studies explain at the molecular level our previous finding that the water-solubility of lyophilized QUE-Me-β-CD and QUE-HP-β-CD products were approximately 7–40-fold and 14–50-fold higher than pure QUE at pH 1.2–6. These results are encouraging for further ex vivo and in vivo evaluation for the nasal administration and nose-to brain delivery of QUE.

Supplementary Materials

The following supporting information can be downloaded at: https://www.mdpi.com/article/10.3390/molecules27175490/s1, Figure S1: 1H NMR chemical shifts for the 2,6Me-β-CD-QUE complex, with SCF GIAO method; Figure S2: 2D NOESY spectrum obtained in a 400 MHz Bruker spectrometer of 2,6Me-β-CD-QUE at 25 °C in D2O; Figure S3: 1H NMR chemical shifts for the 2HP-β-CD-QUE complex, with SCF GIAO method; Figure S4: 2D NOESY spectrum obtained in a 400 MHz Bruker spectrometer of 2HP-β-CD-QUE at 25 °C in D2O; Figure S5: T1 1H-NMR series of experiments for the 2,6Me-β-CD. The times between the two pulses (t) from bottom to top expressed in seconds are: 0.01 s, 0.05 s, 0.10 s, 0.25 s, 0.50 s, 1.00 s, 2.00 s, 4.00 s, 8.00 s, 15.00 s; Figure S6: T1 1H-NMR series of experiments for the 2, Me-β-CD-QUE complex. The times between the two pulses (t) from bottom to top expressed in seconds are: 0.01 s, 0.05 s, 0.10 s, 0.25 s, 0.50 s, 1.00 s, 2.00 s, 4.00 s, 8.00 s, 15.00 s; Figure S7: T1 1H-NMR series of experiments for the 2HP-β-CD. The times between the two pulses (t) from bottom to top expressed in seconds are: 0.01 s, 0.05 s, 0.10 s, 0.25 s, 0.50 s, 1.00 s, 2.00 s, 4.00 s, 8.00 s, 15.00 s; Figure S8: T1 1H-NMR series of experiments for the 2HP-β-CD-QUE complex. The times between the two pulses (t) from bottom to top expressed in seconds are: 0.01 s, 0.05 s, 0.10 s, 0.25 s, 0.50 s, 1.00 s, 2.00 s, 4.00 s, 8.00 s, 15.00 s; Figure S9: Work values and the distribution of the work values from the QUE solvation leg of the thermodynamic cycle (on the left) and for the QUE-2HP-β-CD complex, and the QUE-2HP-β-CD coupling leg of the thermodynamic cycle (on the right) forward (green) and reverse (blue) directions. The transition length for each transition was 500 ps, and the work values depicted here are measured for each transition; Figure S10: Work values and the distribution of the work values from the QUE solvation leg of the thermodynamic cycle (on the left) and for the QUE-2HP-β-CD complex, and the QUE-2,6Me-β-CD coupling leg of the thermodynamic cycle (on the right) forward (green) and reverse (blue) directions. The transition length for each transition was 500 ps, and the work values depicted here are measured for each transition. Input files for MD simulations and absolute free energy calculations using GROMACS 2021.4 are deposited in this link: https://doi.org/10.5281/zenodo.6967423.

Author Contributions

V.V., M.P., N.Z., N.G., D.A.D., U.J. and P.P., Formal analysis, investigation, writing—original draft; N.G. and D.T., methodology; G.V., J.P., resources, supervision, writing—review and editing; A.G.T., D.T., Z.C. and T.M., conceptualization, resources, supervision, writing—original draft—review and editing. All authors have read and agreed to the published version of the manuscript.

Funding

Z.C. and M.P. acknowledge computational time granted from the Greek Research & Technology Network (GRNET) in the National HPC facility ARIS under project IDs pa211102/CD-FEP. Z.C. and M.P. thank Vytautas Gapsys for useful discussions; U.J. and J.P. acknowledge financial support of the Slovenian Research Agency [Grants Nos. P1-0242 and J1-1704]. The authors acknowledge the CERIC-ERIC consortium for the access to experimental facilities and financial support; M.P. acknowledges the Bodossaki Foundation Scholarships program for financially supporting his research. A.G.T acknowledges financial support of this research work by the Hellenic Foundation for Research and Innovation (H.F.R.I.) under the “First Call for H.F.R.I. Research Projects to support Faculty members and Researchers and the procurement of high-cost research equipment grant” (Project Number: 991, acronym PROTECT). Z.C. acknowledges funding by the European Union’s Horizon 2020 research and innovation programme under the grant agreement No. 857645 (project NI4OS-Europe).

Institutional Review Board Statement

Not applicable.

Informed Consent Statement

Not applicable.

Data Availability Statement

Input files for MD simulations andabsolute free energy calculations using GROMACS 2021.4 are deposited in this link: https://doi.org/10.5281/zenodo.6967423 (accessed on 9 June 2022).

Conflicts of Interest

The authors declare no conflict of interest.

Sample Availability

Samples of the compounds are available from the authors.

References

  1. Ilyich, T.V.; Kovalenia, T.A.; Lapshina, E.A.; Stępniak, A.; Palecz, B.; Zavodnik, I.B. Thermodynamic parameters and mitochondrial effects of supramolecular complexes of quercetin with β-cyclodextrins. J. Mol. Liq. 2021, 325, 115184. [Google Scholar] [CrossRef]
  2. Havsteen, B.H. The biochemistry and medical significance of the flavonoids. Pharmacol. Ther. 2002, 96, 67–202. [Google Scholar] [CrossRef]
  3. Andersen, Ø.M.; Markham, K.R. (Eds.) Flavonoids: Chemistry, Biochemistry, and Applications; CRC, Taylor & Francis: Boca Raton, FL, USA, 2006. [Google Scholar]
  4. Wang, W.; Sun, C.; Mao, L.; Ma, P.; Liu, F.; Yang, J.; Gao, Y. The biological activities, chemical stability, metabolism and delivery systems of quercetin: A review. Trends Food Sci. Technol. 2016, 56, 21–38. [Google Scholar] [CrossRef]
  5. Mallya, R.; Patil, K.; Patil, K.; Patil, K. Recent Developments in Formulation Design of a Multifunctional Phytochemical Quercetin: A Review. Pharmacogn. Rev. 2021, 15, 32–46. [Google Scholar] [CrossRef]
  6. Dueñas, M.; González-Manzano, S.; González-Paramás, A.; Santos-Buelga, C. Antioxidant evaluation of O-methylated metabolites of catechin, epicatechin and quercetin. J. Pharm. Biomed. Anal. 2010, 51, 443–449. [Google Scholar] [CrossRef]
  7. Ji, L.; Ma, Y.; Wang, Z.; Cai, Z.; Pang, C.; Wang, Z. Quercetin Prevents Pyrrolizidine Alkaloid Clivorine-Induced Liver Injury in Mice by Elevating Body Defense Capacity. PLoS ONE 2014, 9, e98970. [Google Scholar] [CrossRef]
  8. Suganthy, N.; Devi, K.P.; Nabavi, S.F.; Braidy, N.; Nabavi, S.M. Bioactive effects of quercetin in the central nervous system: Focusing on the mechanisms of actions. Biomed. Pharmacother. 2016, 84, 892–908. [Google Scholar] [CrossRef]
  9. Kumari, A.; Yadav, S.K.; Pakade, Y.B.; Singh, B.; Yadav, S.C. Development of biodegradable nanoparticles for delivery of quercetin. Colloids Surf. B Biointerfaces 2010, 80, 184–192. [Google Scholar] [CrossRef]
  10. Kleemann, R.; Verschuren, L.; Morrison, M.; Zadelaar, S.; van Erk, M.J.; Wielinga, P.Y.; Kooistra, T. Anti-inflammatory, anti-proliferative and anti-atherosclerotic effects of quercetin in human in vitro and in vivo models. Atherosclerosis 2011, 218, 44–52. [Google Scholar] [CrossRef]
  11. Phachonpai, W.; Wattanathorn, J.; Muchimapura, S.; Tong-Un, T.; Preechagoon, D. Neuroprotective Effect of Quercetin Encapsulated Liposomes: A Novel Therapeutic Strategy against Alzheimer’s Disease. Am. J. Appl. Sci. 2010, 7, 480–485. [Google Scholar] [CrossRef] [Green Version]
  12. Liu, L.; Tang, Y.; Gao, C.; Li, Y.; Chen, S.; Xiong, T.; Li, J.; Du, M.; Gong, Z.; Chen, H.; et al. Characterization and biodistribution in vivo of quercetin-loaded cationic nanostructured lipid carriers. Colloids Surf. B Biointerfaces 2014, 115, 125–131. [Google Scholar] [CrossRef] [PubMed]
  13. Gang, W.; Jie, W.J.; Ping, Z.L.; Ming, D.S.; Ying, L.J.; Lei, W.; Fang, Y. Liposomal quercetin: Evaluating drug delivery in vitro and biodistribution in vivo. Expert Opin. Drug Deliv. 2012, 9, 599–613. [Google Scholar] [CrossRef] [PubMed]
  14. Vicentini, F.T.M.C.; Vaz, M.M.O.L.L.; Fonseca, Y.M.; Bentley, M.V.L.B.; Fonseca, M.J.V. Characterization and stability study of a water-in-oil microemulsion incorporating quercetin. Drug Dev. Ind. Pharm. 2011, 37, 47–55. [Google Scholar] [CrossRef] [PubMed]
  15. Singh, D.; Rawat, M.S.M.; Semalty, A.; Semalty, M. Quercetin-Phospholipid Complex: An Amorphous Pharmaceutical System in Herbal Drug Delivery. Curr. Drug Discov. Technol. 2012, 9, 17–24. [Google Scholar] [CrossRef] [PubMed]
  16. Landi-Librandi, A.P.; Chrysostomo, T.N.; Azzolini, A.E.C.S.; Marzocchi-Machado, C.M.; de Oliveira, C.A.; Lucisano-Valim, Y.M. Study of quercetin-loaded liposomes as potential drug carriers: In vitro evaluation of human complement activation. J. Liposome Res. 2012, 22, 89–99. [Google Scholar] [CrossRef]
  17. Dhawan, S.; Kapil, R.; Singh, B. Formulation development and systematic optimization of solid lipid nanoparticles of quercetin for improved brain delivery. J. Pharm. Pharmacol. 2011, 63, 342–351. [Google Scholar] [CrossRef]
  18. Varshosaz, J.; Jafarian, A.; Salehi, G.; Zolfaghari, B. Comparing different sterol containing solid lipid nanoparticles for targeted delivery of quercetin in hepatocellular carcinoma. J. Liposome Res. 2014, 24, 191–203. [Google Scholar] [CrossRef]
  19. Sun, M.; Nie, S.; Pan, X.; Zhang, R.; Fan, Z.; Wang, S. Quercetin-nanostructured lipid carriers: Characteristics and anti-breast cancer activities in vitro. Colloids Surf. B Biointerfaces 2014, 113, 15–24. [Google Scholar] [CrossRef]
  20. Arbain, N.H.A.N.H.; Ngan, C.L.; Salim, N.; Wui, W.T.; Rahman, M.B.A. Aerosolized nanoemulsion system encapsulating quercertin for lung cancer treatment. eProc. Chem. 2017, 3, 1. Available online: http://161.139.21.153/index.php/FYP/article/view/192 (accessed on 27 December 2021).
  21. Priprem, A.; Sutthiparinyanont, S.; Na, H.-K.; Surh, Y.-J.; Chulasiri, M. Effect of Formulations of Nanosized Quercetin Liposomes on COX-2 and NF-kB in MCF-10A Cells. Pharm. Nanotechnol. 2013, 1, 26–34. [Google Scholar] [CrossRef]
  22. Tablet, C.; Hillebrand, M. Theoretical and experimental study of the inclusion complexes of the 3-carboxy-5,6-benzocoumarinic acid with cyclodextrins. Spectrochim. Acta Part A Mol. Biomol. Spectrosc. 2008, 70, 740–748. [Google Scholar] [CrossRef]
  23. Yousuf, S.; Radhika, D.; Enoch, I.V.M.V.; Easwaran, M. The influence of β-cyclodextrin encapsulation on the binding of 2′-hydroxyflavanone with calf thymus DNA. Spectrochim. Acta Part A Mol. Biomol. Spectrosc. 2012, 98, 405–412. [Google Scholar] [CrossRef] [PubMed]
  24. Abdel-Shafi, A.A.; Al-Shihry, S.S. Fluorescence enhancement of 1-napthol-5-sulfonate by forming inclusion complex with β-cyclodextrin in aqueous solution. Spectrochim. Acta Part A Mol. Biomol. Spectrosc. 2009, 72, 533–537. [Google Scholar] [CrossRef]
  25. Kosar, B.; Albayrak, C. Spectroscopic investigations and quantum chemical computational study of (E)-4-methoxy-2- [(p-tolylimino)methyl]phenol. Spectrochim. Acta Part A Mol. Biomol. Spectrosc. 2011, 78, 160–167. [Google Scholar] [CrossRef]
  26. Abdel-Shafi, A.A. Inclusion complex of 2-naphthylamine-6-sulfonate with β-cyclodextrin: Intramolecular charge transfer versus hydrogen bonding effects. Spectrochim. Acta Part A Mol. Biomol. Spectrosc. 2007, 66, 1228–1236. [Google Scholar] [CrossRef]
  27. Bilensoy, E. Cyclodextrins in Pharmaceutics, Cosmetics, and Biomedicine: Current and Future Industrial Applications; Wiley: Hoboken, NJ, USA, 2011. [Google Scholar]
  28. Carneiro, S.B.; Costa Duarte, F.Í.; Heimfarth, L.; Siqueira Quintans, J.D.S.; Quintans-Júnior, L.J.; Veiga Júnior, V.F.D.; De Lima, A.N. Cyclodextrin–Drug Inclusion Complexes: In Vivo and In Vitro Approaches. Int. J. Mol. Sci. 2019, 20, 642. [Google Scholar] [CrossRef]
  29. Kalepu, S.; Nekkanti, V. Insoluble drug delivery strategies: Review of recent advances and business prospects. Acta Pharm. Sin. B 2015, 5, 442–453. [Google Scholar] [CrossRef]
  30. Topuz, F.; Uyar, T. Antioxidant, antibacterial and antifungal electrospun nanofibers for food packaging applications. Food Res. Int. 2020, 130, 108927. [Google Scholar] [CrossRef]
  31. Loftsson, T.; Brewster, M.E. Pharmaceutical Applications of Cyclodextrins. 1. Drug Solubilization and Stabilization. J. Pharm. Sci. 1996, 85, 1017–1025. [Google Scholar] [CrossRef]
  32. Roux, M.; Perly, B.; Djedaini-Pilard, F. Self-assemblies of amphiphilic cyclodextrins. Eur. Biophys. J. 2007, 36, 861–867. [Google Scholar] [CrossRef]
  33. Marques, H.M.C. A review on cyclodextrin encapsulation of essential oils and volatiles. Flavour Fragr. J. 2010, 25, 313–326. [Google Scholar] [CrossRef]
  34. Špehar, T.K.; Pocrnić, M.; Klarić, D.; Bertoša, B.; Čikoš, A.; Jug, M.; Padovan, J.; Dragojević, S.; Galić, N. Investigation of Praziquantel/Cyclodextrin Inclusion Complexation by NMR and LC-HRMS/MS: Mechanism, Solubility, Chemical Stability, and Degradation Products. Mol. Pharm. 2021, 18, 4210–4223. [Google Scholar] [CrossRef]
  35. Rajendrakumar, K.; Madhusudan, S.; Pralhad, T. Cyclodextrin complexes of valdecoxib: Properties and anti-inflammatory activity in rat. Eur. J. Pharm. Biopharm. 2005, 60, 39–46. [Google Scholar] [CrossRef]
  36. Zhang, L.; Man, S.; Qiu, H.; Liu, Z.; Zhang, M.; Ma, L.; Gao, W. Curcumin-cyclodextrin complexes enhanced the anti-cancer effects of curcumin. Environ. Toxicol. Pharmacol. 2016, 48, 31–38. [Google Scholar] [CrossRef]
  37. Yee, E.M.; Hook, J.M.; Bhadbhade, M.M.; Vittorio, O.; Kuchel, R.P.; Brandl, M.B.; Tilley, R.D.; Black, D.S.; Kumar, N. Preparation, characterization and in vitro biological evaluation of (1:2) phenoxodiol-β-cyclodextrin complex. Carbohydr. Polym. 2017, 165, 444–454. [Google Scholar] [CrossRef]
  38. Kellici, T.F.; Ntountaniotis, D.; Leonis, G.; Chatziathanasiadou, M.; Chatzikonstantinou, A.V.; Becker-Baldus, J.; Glaubitz, C.; Tzakos, A.G.; Viras, K.; Chatzigeorgiou, P.; et al. Investigation of the Interactions of Silibinin with 2-Hydroxypropyl-β-cyclodextrin through Biophysical Techniques and Computational Methods. Mol. Pharm. 2015, 12, 954–965. [Google Scholar] [CrossRef]
  39. Kellici, T.; Chatziathanasiadou, M.V.; Diamantis, D.; Chatzikonstantinou, A.V.; Andreadelis, I.; Christodoulou, E.; Valsami, G.; Mavromoustakos, T.; Tzakos, A.G. Mapping the interactions and bioactivity of quercetin (2-hydroxypropyl)-β-cyclodextrin complex. Int. J. Pharm. 2016, 511, 303–311. [Google Scholar] [CrossRef]
  40. Sfihi, H.; Legrand, A.; Doussot, J.; Guy, A. Solid-state 13C NMR study of β-cyclodextrin/substituted aromatic ketone complexes: Evidence for two kinds of complexation of the guest molecules. Colloids Surf. A Physicochem. Eng. Asp. 1996, 115, 115–126. [Google Scholar] [CrossRef]
  41. Figueiras, A.; Carvalho, R.A.; Ribeiro, L.; Torres-Labandeira, J.J.; Veiga, F.J.B. Solid-state characterization and dissolution profiles of the inclusion complexes of omeprazole with native and chemically modified β-cyclodextrin. Eur. J. Pharm. Biopharm. 2007, 67, 531–539. [Google Scholar] [CrossRef]
  42. Mendes, C.; Buttchevitz, A.; Kruger, J.H.; Bernardi, L.S.; Oliveira, P.R.; Silva, M.A.S. Quantitative Analysis of Norfloxacin in β-Cyclodextrin Inclusion Complexes—Development and Validation of a Stability-indicating HPLC Method. Anal. Sci. 2015, 31, 1083–10895. [Google Scholar] [CrossRef]
  43. Cravotto, G.; Binello, A.; Baranelli, E.; Carraro, P.; Trotta, F. Cyclodextrins as Food Additives and in Food Processing. Curr. Nutr. Food Sci. 2006, 2, 343–350. [Google Scholar] [CrossRef]
  44. Chattah, A.K.; Mroue, K.H.; Pfund, L.Y.; Ramamoorthy, A.; Longhi, M.R.; Garnero, C. Insights into Novel Supramolecular Complexes of Two Solid Forms of Norfloxacin and β-Cyclodextrin. J. Pharm. Sci. 2013, 102, 3717–3724. [Google Scholar] [CrossRef]
  45. Malanga, M.; Szemán, J.; Fenyvesi, E.; Puskás, I.; Csabai, K.; Gyémánt, G.; Fenyvesi, F.; Szente, L. “Back to the Future”: A New Look at Hydroxypropyl Beta-Cyclodextrins. J. Pharm. Sci. 2016, 105, 2921–2931. [Google Scholar] [CrossRef]
  46. Pitha, J.; Milecki, J.; Fales, H.; Pannell, L.; Uekama, K. Hydroxypropyl-β-cyclodextrin: Preparation and characterization; effects on solubility of drugs. Int. J. Pharm. 1986, 29, 73–82. [Google Scholar] [CrossRef]
  47. Trinadha, C.; Pitha, J.; Lindberg, B.; Lindberg, J. Distribution of substituents in O-(2-hydroxypropyl) derivatives of cyclomalto-oligosaccharides (cyclodextrins: Influence of increasing substitution of the base used in the preparation, and of macrocyclic size. Carbohydr. Res. 1992, 223, 99–107. [Google Scholar] [CrossRef]
  48. Laquintana, V.; Asim, M.H.; Lopedota, A.; Cutrignelli, A.; Lopalco, A.; Franco, M.; Bernkop-Schnürch, A.; Denora, N. Thiolated hydroxypropyl-β-cyclodextrin as mucoadhesive excipient for oral delivery of budesonide in liquid paediatric formulation. Int. J. Pharm. 2019, 572, 118820. [Google Scholar] [CrossRef]
  49. Nicoletti, C.D.; Queiroz, M.d.H.; Lima, C.G.d.; da Silva, F.d.; Futuro, D.O.; Ferreira, V.F. An improved method for the preparation of β-lapachone:2-hydroxypropyl-β-cyclodextrin inclusion complexes. J. Drug Deliv. Sci. Technol. 2020, 58, 101777. [Google Scholar] [CrossRef]
  50. Başaran, E.; Öztürk, A.A.; Şenel, B.; Demïrel, M.; Sarica, Ş. Quercetin, Rutin and Quercetin-Rutin Incorporated Hydroxypropyl β-Cyclodextrin Inclusion Complexes. Eur. J. Pharm. Sci. 2022, 172, 106153. [Google Scholar] [CrossRef]
  51. Tzeli, D.; Petsalakis, I.D.; Theodorakopoulos, G. Compression in encapsulated carboxylic acid homodimers. Chem. Phys. Lett. 2013, 573, 48–55. [Google Scholar] [CrossRef]
  52. Tzeli, D.; Tsoungas, P.G.; Petsalakis, I.D.; Kozielewicz, P.; Zloh, M. Intramolecular cyclization of β-nitroso-o-quinone methides. A theoretical endoscopy of a potentially useful innate “reclusive” reaction. Tetrahedron 2015, 71, 359–369. [Google Scholar] [CrossRef]
  53. Gapsys, V.; Yildirim, A.; Aldeghi, M.; Khalak, Y.; van der Spoel, D.; de Groot, B.L. Accurate absolute free energies for ligand–protein binding based on non-equilibrium approaches. Commun. Chem. 2021, 4, 1. [Google Scholar] [CrossRef]
  54. Khalak, Y.; Tresadern, G.; Aldeghi, M.; Baumann, H.M.; Mobley, D.L.; de Groot, B.L.; Gapsys, V. Alchemical absolute protein–ligand binding free energies for drug design. Chem. Sci. 2021, 12, 13958–13971. [Google Scholar] [CrossRef] [PubMed]
  55. Alexandrino, G.L.; Calderini, A.; Morgon, N.H.; Pessine, F.B.T. Spectroscopic (fluorescence, 1D-ROESY) and theoretical studies of the thiabendazole and β-cyclodextrin inclusion complex. J. Incl. Phenom. Macrocycl. Chem. 2013, 75, 93–99. [Google Scholar] [CrossRef]
  56. Mercader-Ros, M.T.; Lucas-Abellán, C.; Gabaldón, J.A.; Fortea, M.I.; Martínez-Cachá, A.; Núñez-Delicado, E. Kaempferol Complexation in Cyclodextrins at Basic pH. J. Agric. Food Chem. 2010, 58, 4675–4680. [Google Scholar] [CrossRef] [PubMed]
  57. Ramakrishna, G.; Ghosh, H.N. Efficient Electron Injection from Twisted Intramolecular Charge Transfer (TICT) State of 7-Diethyl amino coumarin 3-carboxylic Acid (D-1421) Dye to TiO2 Nanoparticle. J. Phys. Chem. A 2002, 106, 2545–2553. [Google Scholar] [CrossRef]
  58. Manta, K.; Papakyriakopoulou, P.; Chountoulesi, M.; Diamantis, D.A.; Spaneas, D.; Vakali, V.; Naziris, N.; Chatziathanasiadou, M.V.; Andreadelis, I.; Moschovou, K.; et al. Preparation and Biophysical Characterization of Quercetin Inclusion Complexes with β-Cyclodextrin Derivatives to be Formulated as Possible Nose-to-Brain Quercetin Delivery Systems. Mol. Pharm. 2020, 17, 4241–4255. [Google Scholar] [CrossRef]
  59. Becke, A.D. A new mixing of Hartree–Fock and local density-functional theories. J. Chem. Phys. 1993, 98, 1372–1377. [Google Scholar] [CrossRef]
  60. Lee, C.; Yang, W.; Parr, R.G. Development of the Colle-Salvetti correlation-energy formula into a functional of the electron density. Phys. Rev. B 1988, 37, 785–789. [Google Scholar] [CrossRef]
  61. Blaudeau, J.-P.; McGrath, M.P.; Curtiss, L.A.; Radom, L. Extension of Gaussian-2 (G2) theory to molecules containing third-row atoms K and Ca. J. Chem. Phys. 1997, 107, 5016–5021. [Google Scholar] [CrossRef]
  62. Cossi, M.; Scalmani, G.; Rega, N.; Barone, V. New developments in the polarizable continuum model for quantum mechanical and classical calculations on molecules in solution. J. Chem. Phys. 2002, 117, 43–54. [Google Scholar] [CrossRef]
  63. Tzeli, D.; Mavridis, A.; Xantheas, S.S. First Principles Examination of the Acetylene−Water Clusters, HCCH−(H2O)x, x = 2, 3, and 4. J. Phys. Chem. A 2002, 106, 11327–11337. [Google Scholar] [CrossRef]
  64. Frisch, M.J.; Trucks, G.W.; Schlegel, H.B.; Scuseria, G.E.; Robb, M.A.; Cheeseman, J.R.; Scalmani, G.; Barone, V.; Petersson, G.A.; Nakatsuji, H.; et al. Gaussian 16, Revision C.01; Gaussian, Inc.: Wallingford, CT, USA, 2016. [Google Scholar]
  65. Betzel, C.; Saenger, W.; Hingerty, B.E.; Brown, G.M. Topography of cyclodextrin inclusion complexes, part 20. Circular and flip-flop hydrogen bonding in. beta.-cyclodextrin undecahydrate: A neutron diffraction study. J. Am. Chem. Soc. 1984, 106, 7545–7557. [Google Scholar] [CrossRef]
  66. Friesner, R.A.; Banks, J.L.; Murphy, R.B.; Halgren, T.A.; Klicic, J.J.; Mainz, D.T.; Repasky, M.P.; Knoll, E.H.; Shelley, M.; Perry, J.K.; et al. Glide: A New Approach for Rapid, Accurate Docking and Scoring. 1. Method and Assessment of Docking Accuracy. J. Med. Chem. 2004, 47, 1739–1749. [Google Scholar] [CrossRef] [PubMed]
  67. Halgren, T.A.; Murphy, R.B.; Friesner, R.A.; Beard, H.S.; Frye, L.L.; Pollard, W.T.; Banks, J.L. Glide: A New Approach for Rapid, Accurate Docking and Scoring. 2. Enrichment Factors in Database Screening. J. Med. Chem. 2004, 47, 1750–1759. [Google Scholar] [CrossRef]
  68. Friesner, R.A.; Murphy, R.B.; Repasky, M.P.; Frye, L.L.; Greenwood, J.R.; Halgren, T.A.; Sanschagrin, P.C.; Mainz, D.T. Extra Precision Glide: Docking and Scoring Incorporating a Model of Hydrophobic Enclosure for Protein−Ligand Complexes. J. Med. Chem. 2006, 49, 6177–6196. [Google Scholar] [CrossRef]
  69. Vanommeslaeghe, K.; Hatcher, E.; Acharya, C.; Kundu, S.; Zhong, S.; Shim, J.; Darian, E.; Guvench, O.; Lopes, P.; Vorobyov, I.; et al. CHARMM General Force Field: A Force Field for Drug-Like Molecules Compatible with the CHARMM All-Atom Additive Biological Force Fields. J. Comput. Chem. 2010, 31, 671–690. [Google Scholar] [CrossRef]
  70. Arsiccio, A.; Rospiccio, M.; Shea, J.-E.; Pisano, R. Force Field Parameterization for the Description of the Interactions between Hydroxypropyl-β-Cyclodextrin and Proteins. J. Phys. Chem. B 2021, 125, 7397–7405. [Google Scholar] [CrossRef]
  71. Jorgensen, W.L.; Chandrasekhar, J.; Madura, J.D.; Impey, R.W.; Klein, M.L. Comparison of simple potential functions for simulating liquid water. J. Chem. Phys. 1983, 79, 926–935. [Google Scholar] [CrossRef]
  72. Phillips, J.C.; Hardy, D.J.; Maia, J.D.C.; Stone, J.E.; Ribeiro, J.V.; Bernardi, R.C.; Buch, R.; Fiorin, G.; Hénin, J.; Jiang, W.; et al. Scalable molecular dynamics on CPU and GPU architectures with NAMD. J. Chem. Phys. 2020, 153, 044130. [Google Scholar] [CrossRef]
  73. Ermak, D.L.; McCammon, J.A. Brownian dynamics with hydrodynamic interactions. J. Chem. Phys. 1978, 69, 1352–1360. [Google Scholar] [CrossRef]
  74. Martyna, G.J.; Tobias, D.J.; Klein, M.L. Constant pressure molecular dynamics algorithms. J. Chem. Phys. 1994, 101, 4177–4189. [Google Scholar] [CrossRef]
  75. Feller, S.E.; Zhang, Y.; Pastor, R.W.; Brooks, B.R. Constant pressure molecular dynamics simulation: The Langevin piston method. J. Chem. Phys. 1995, 103, 4613–4621. [Google Scholar] [CrossRef]
  76. Darden, T.; York, D.; Pedersen, L. Particle mesh Ewald: An N⋅log(N) method for Ewald sums in large systems. J. Chem. Phys. 1993, 98, 10089–10092. [Google Scholar] [CrossRef]
  77. Ryckaert, J.-P.; Ciccotti, G.; Berendsen, H.J.C. Numerical integration of the cartesian equations of motion of a system with constraints: Molecular dynamics of n-alkanes. J. Comput. Phys. 1977, 23, 327–341. [Google Scholar] [CrossRef]
  78. Daura, X.; Gademann, K.; Jaun, B.; Seebach, D.; van Gunsteren, W.F.; Mark, A.E. Peptide Folding: When Simulation Meets Experiment. Angew. Chem. Int. Ed. 1999, 38, 236–240. [Google Scholar] [CrossRef]
  79. Abraham, M.J.; Murtola, T.; Schulz, R.; Páll, S.; Smith, J.C.; Hess, B.; Lindahl, E. GROMACS: High performance molecular simulations through multi-level parallelism from laptops to supercomputers. SoftwareX 2015, 1–2, 19–25. [Google Scholar] [CrossRef]
  80. Jacobson, M.P.; Pincus, D.L.; Rapp, C.S.; Day, T.J.F.; Honig, B.; Shaw, D.E.; Friesner, R.A. A hierarchical approach to all-atom protein loop prediction. Proteins Struct. Funct. Bioinform. 2004, 55, 351–367. [Google Scholar] [CrossRef]
  81. Jacobson, M.P.; Friesner, R.A.; Xiang, Z.; Honig, B. On the Role of the Crystal Environment in Determining Protein Side-chain Conformations. J. Mol. Biol. 2002, 320, 597–608. [Google Scholar] [CrossRef]
  82. Li, J.; Abel, R.; Zhu, K.; Cao, Y.; Zhao, S.; Friesner, R.A. The VSGB 2.0 model: A next generation energy model for high resolution protein structure modeling. Proteins Struct. Funct. Bioinform. 2011, 79, 2794–2812. [Google Scholar] [CrossRef]
  83. Lu, C.; Wu, C.; Ghoreishi, D.; Chen, W.; Wang, L.; Damm, W.; Ross, G.A.; Dahlgren, M.K.; Russell, E.; Von Bargen, C.D.; et al. OPLS4: Improving Force Field Accuracy on Challenging Regimes of Chemical Space. J. Chem. Theory Comput. 2021, 17, 4291–4300. [Google Scholar] [CrossRef]
  84. Jorgensen, W.L.; Buckner, J.K.; Boudon, S.; Tirado-Rives, J. Efficient computation of absolute free energies of binding by computer simulations. Application to the methane dimer in water. J. Chem. Phys. 1988, 89, 3742–3746. [Google Scholar] [CrossRef]
  85. Gilson, M.K.; Given, J.A.; Bush, B.L.; McCammon, J.A. The statistical-thermodynamic basis for computation of binding affinities: A critical review. Biophys. J. 1997, 72, 1047–1069. [Google Scholar] [CrossRef]
  86. Boresch, S.; Tettinger, F.; Leitgeb, M.; Karplus, M. Absolute Binding Free Energies:  A Quantitative Approach for Their Calculation. J. Phys. Chem. B 2003, 107, 9535–9551. [Google Scholar] [CrossRef]
  87. Shirts, M.R.; Bair, E.; Hooker, G.; Pande, V.S. Equilibrium free energies from nonequilibrium measurements using maximum-likelihood methods. Phys. Rev. Lett. 2003, 91, 140601. [Google Scholar] [CrossRef]
  88. Crooks, G.E. Entropy production fluctuation theorem and the nonequilibrium work relation for free energy differences. Phys. Rev. E Stat. Phys. Plasmas Fluids Relat. Interdiscip. Topics 1999, 60, 2721–2726. [Google Scholar] [CrossRef]
  89. Aldeghi, M.; Heifetz, A.; Bodkin, M.J.; Knapp, S.; Biggin, P.C. Accurate calculation of the absolute free energy of binding for drug molecules. Chem. Sci. 2015, 7, 207–218. [Google Scholar] [CrossRef]
  90. Lindahl, E.; Abraham, M.J.; Hess, B.; van der Spoel, D. GROMACS 2021.4 Manual; GROMACS Development Team: Stockholm, Sweden, 2021. [Google Scholar] [CrossRef]
  91. Alibay, I.; Magarkar, A.; Seeliger, D.; Biggin, P.C. Evaluating the use of Absolute Binding Free Energy in the Fragment Optimization Process. p. 23. Available online: https://chemrxiv.org/engage/chemrxiv/article-details/61f802834b9500e1881041b5 (accessed on 9 June 2022).
  92. Berendsen, H.J.C.; Postma, J.P.M.; van Gunsteren, W.F.; DiNola, A.; Haak, J.R. Molecular dynamics with coupling to an external bath. J. Chem. Phys. 1984, 81, 3684–3690. [Google Scholar] [CrossRef]
  93. Parrinello, M.; Rahman, A. Polymorphic transitions in single crystals: A new molecular dynamics method. J. Appl. Phys. 1981, 52, 7182–7190. [Google Scholar] [CrossRef]
  94. Hess, B.; Bekker, H.; Berendsen, H.J.C.; Fraaije, J.G.E.M. LINCS: A linear constraint solver for molecular simulations. J. Comput. Chem. 1997, 18, 1463–1472. [Google Scholar] [CrossRef]
  95. Gapsys, V.; Michielssens, S.; Seeliger, D.; de Groot, B.L. pmx: Automated protein structure and topology generation for alchemical perturbations. J. Comput. Chem. 2015, 36, 348–354. [Google Scholar] [CrossRef] [Green Version]
  96. GitLab. Solvation Free Energy with Couple-Intramol Set to No. Available online: https://gitlab.com/gromacs/gromacs/-/issues/3403 (accessed on 9 June 2022).
  97. GitLab. Remove False Positives from FE Excluded Pair Check. Available online: https://gitlab.com/gromacs/gromacs/-/merge_requests/2626 (accessed on 9 June 2022).
  98. GitLab. Add Fep Exclusion Check at Pairlist Generation. Available online: https://gitlab.com/gromacs/gromacs/-/merge_requests/2639 (accessed on 9 June 2022).
  99. Zhang, H.; Yin, C.; Yan, H.; van der Spoel, D. Evaluation of generalized born models for large scale affinity prediction of cyclodextrin host–guest complexes. J. Chem. Inf. Model. 2016, 56, 2080–2092. [Google Scholar] [CrossRef] [PubMed]
  100. Di, P.; Chen, J.; Liu, L.; Li, W.; Tang, Y.; Liu, G. In silico prediction of binding capacity and interaction forces of organic compounds with α- and β-cyclodextrins. J. Mol. Liquids 2020, 302, 112585. [Google Scholar] [CrossRef]
  101. Genheden, S.; Ryde, U. The MM/PBSA and MM/GBSA methods to estimate ligand-binding affinities. Expert Opin. Drug Discov. 2015, 10, 449–461. [Google Scholar] [CrossRef] [PubMed]
  102. Cournia, Z.; Allen, B.K.; Beuming, T.; Pearlman, D.A.; Radak, B.K.; Sherman, W. Rigorous Free Energy Simulations in Virtual Screening. J. Chem. Inf. Model. 2020, 60, 4153–4169. [Google Scholar] [CrossRef] [PubMed]
  103. Rizzi, A.; Jensen, T.; Slochower, D.R.; Aldeghi, M.; Gapsys, V.; Ntekoumes, D.; Bosisio, S.; Papadourakis, M.; Henriksen, N.M.; de Groot, B.L.; et al. The SAMPL6 SAMPLing challenge: Assessing the reliability and efficiency of binding free energy calculations. J. Comput. Aided Mol. Des. 2020, 34, 601–633. [Google Scholar] [CrossRef] [PubMed]
  104. Cournia, Z.; Allen, B.; Sherman, W. Relative Binding Free Energy Calculations in Drug Discovery: Recent Advances and Practical Considerations. J. Chem. Inf. Model. 2017, 57, 2911–2937. [Google Scholar] [CrossRef]
  105. Armacost, K.A.; Riniker, S.; Cournia, Z. Novel Directions in Free Energy Methods and Applications. J. Chem. Inf. Model. 2020, 60, 1–5. [Google Scholar] [CrossRef]
  106. Singh, N.; Li, W. Absolute Binding Free Energy Calculations for Highly Flexible Protein MDM2 and Its Inhibitors. Int. J. Mol. Sci. 2020, 21, 4765. [Google Scholar] [CrossRef]
  107. Berishvili, V.P.; Kuimov, A.N.; Voronkov, A.E.; Radchenko, E.V.; Kumar, P.; Choonara, Y.E.; Pillay, V.; Kamal, A.; Palyulin, V.A. Discovery of Novel Tankyrase Inhibitors through Molecular Docking-Based Virtual Screening and Molecular Dynamics Simulation Studies. Molecules 2020, 25, 3171. [Google Scholar] [CrossRef]
  108. Mendoza-Martinez, C.; Papadourakis, M.; Llabrés, S.; Gupta, A.A.; Barlow, P.N.; Michel, J. Energetics of a protein disorder–order transition in small molecule recognition. Chem. Sci. 2022, 13, 5220–5229. [Google Scholar] [CrossRef]
  109. Li, Z.; Huang, Y.Y.; Wu, Y.N.; Chen, J.Y.; Wu, D.Y.; Zhan, C.G.; Luo, H.B. Absolute Binding Free Energy Calculation and Design of a Subnanomolar Inhibitor of Phosphodiesterase-10. J. Med. Chem. 2019, 62, 2099–2111. [Google Scholar] [CrossRef] [PubMed]
  110. Gkeka, P.; Eleftheratos, S.; Kolocouris, A.; Cournia, Z. Free Energy Calculations Reveal the Origin of Binding Preference for Aminoadamantane Blockers of Influenza A/M2TM Pore. J. Chem. Theory Comput. 2013, 9, 1272–1281. [Google Scholar] [CrossRef] [PubMed]
  111. Ioannidis, H.; Drakopoulos, A.; Tzitzoglaki, C.; Homeyer, N.; Kolarov, F.; Gkeka, P.; Freudenberger, K.; Liolios, C.; Gauglitz, G.; Cournia, Z.; et al. Alchemical Free Energy Calculations and Isothermal Titration Calorimetry Measurements of Aminoadamantanes Bound to the Closed State of Influenza A/M2TM. J. Chem. Inf. Model. 2016, 56, 862–876. [Google Scholar] [CrossRef] [PubMed]
  112. Amezcua, M.; El Khoury, L.; Mobley, D.L. SAMPL7 Host–Guest Challenge Overview: Assessing the reliability of polarizable and non-polarizable methods for binding free energy calculations. J. Comput. Aided Mol. Des. 2021, 35, 1–35. [Google Scholar] [CrossRef] [PubMed]
  113. Cournia, Z.; Chipot, C.; Roux, B.; York, D.M.; Sherman, W. Free Energy Methods in Drug Discovery—Introduction. In Free Energy Methods in Drug Discovery: Current State and Future Directions; American Chemical Society: Washington, DC, USA, 2021; pp. 1–38. [Google Scholar] [CrossRef]
  114. Baumann, H.M.; Gapsys, V.; de Groot, B.L.; Mobley, D.L. Challenges Encountered Applying Equilibrium and Nonequilibrium Binding Free Energy Calculations. J. Phys. Chem. B 2021, 125, 4241–4261. [Google Scholar] [CrossRef] [PubMed]
Figure 1. Chemical structure of (a) quercetin, (b) 2,6Μe-β-CD and (c) 2HP-β-CD.
Molecules 27 05490 g001
Figure 2. The 1H NMR of (A) 2,6Me-β-CD (B) complex of QUE with 2,6Me-β-CD. The spectra were obtained at 25 °C in D2O.
Molecules 27 05490 g002
Figure 3. The 1H NMR of (A) 2HP-β-CD (B) complex of QUE with 2HP-β-CD. The spectra were obtained at 25 °C in D2O.
Molecules 27 05490 g003
Figure 4. DOSY spectrum obtained of 2,6Me-β-CD-QUE (1:1) at 25 °C in D2O recorded on an 800 MHz NMR spectrometer. The corresponding 1H NMR spectrum is shown above, with an expansion of the aromatic region at 30-fold increased intensity. The recorded 2D DOSY experiment of the complex of QUE with 2,6Me-β-CD formation 1:1. The spectrum was obtained at 25 °C in D2O.
Molecules 27 05490 g004
Figure 5. DOSY spectrum obtained of 2HP-β-CD-QUE (1:1) at 25 °C in D2O recorded on an 800 MHz NMR spectrometer. The corresponding 1H NMR spectrum is shown above, with an expansion of the aromatic region at 30-fold increased intensity.
Molecules 27 05490 g005
Figure 6. Calculated minimum energy structures: (a) QUE (above) and a local minimum of QUE (bottom), (b) 2HP-β-CD, (c) 2,6Μe-β-CD, (d) complex of QUE with 2HP-β-CD (d1) and complex of reversed QUE with 2HP-β-CD (d2) from two different points of view, and (e) complex of QUE with 2,6Μe-β-CD (e1) and complex of reversed QUE with 2,6Μe-β-CD (e2) from two different points of view. All calculations were performed in water solvent using B3LYP/6-31G(d,p). The energy differences between the conformations in complexes are shown for the B3LYP level of theory; energy differences calculated using PM6 are shown in parentheses.
Molecules 27 05490 g006
Figure 7. Conformations of the QUE complexed with 2HP-β-CD (a) and 2,6Μe-β-CD (b). Hydrogen bonds are shown with dashed lines.
Molecules 27 05490 g007
Figure 8. Molecular models of QUE (represented as orange sticks) inside the two cyclodextrin systems calculated as the first cluster representatives from MD simulations. (A) 2,6Me-β-CD (green sticks) and (B) 2HP-β-CD (blue sticks). Oxygen atoms are represented in red.
Molecules 27 05490 g008
Figure 9. Fluorescence spectra of QUE (25 μM) at pH 7.4 (DMSO/PBS buffer, 10 mM) after titrating with various concentrations of CDs (0, 0.1, 0.2, 0.3, 0.4, 0.5, 0.6, 0.7, 0.8, 0.9, 1.0, 2.0, 3.0 and 4.0) (A) 2HP-β-CD and (B) 2,6-Me-β-CD.
Molecules 27 05490 g009
Figure 10. Double-reciprocal plots of the QUE titration with various concentrations of CDs (0, 0.1, 0.2, 0.3, 0.4, 0.5, 0.6, 0.7, 0.8, 0.9, 1.0, 2.0, 3.0 and 4.0) (A) 2HP-β-CD and (B) 2,6Me-β-CD.
Molecules 27 05490 g010
Figure 11. Thermodynamic cycle for absolute binding free energy calculations. QUE in solution (state I) is depicted as orange sticks and CD as green sticks. The presence of restraints is indicated with a paperclip. QUE depicted with white sticks means that the molecule is decoupled from the solvent.
Molecules 27 05490 g011
Table 1. 1H NMR chemical shifts for 2,6Me-β-CD and the lyophilized complex, in D2O at 25 °C.
Protons of 2.6 Μe-β-CDChemical ShiftsChemical Shifts of ComplexΔδ (ppm)Multiplicity
H15.35−5.095.29−5.030.02singlet
H34.014.000.01singlet
H53.943.900.04doublet
H63.913.880.03singlet
H23.723.680.04singlet
H43.683.670.01doublet
H6-O-Me3.593.590singlet
H23.493.440.05singlet
H2-O-Me3.413.420.01singlet
Table 2. 1H NMR chemical shifts using the SCF GIAO method and experimental results for the 2,6Me-β-CD in the complex.
Protons of 2,6Μe-β-CDChemical Shifts of Complex
Experimental Results
Chemical Shifts of Complex
SCF GIAO Method
H15.29−5.035.30−5.07
H34.004.01
H53.903.90
H63.883.89
H23.683.68
H43.673.67
H6-O-Me3.593.55
23.443.43
H2-O-Me3.423.40
Table 3. 1H NMR chemical shifts for 2HP-β-CD and the lyophilized complex, in D2O at 25 °C.
Protons of 2HP-β-CDChemical ShiftsΔδ (ppm)Multiplicity
H1″5.03−4.920.01singlet
H8″3.870singlet
H3″3.750singlet
H6″3.580.04singlet
H2″-H4″-H5″3.470.04multiple peaks
H7″3.370.01singlet
H9″1.010singlet
Table 4. 1H NMR chemical shifts using the SCF GIAO method and experimental results for the HP-β-CD in the complex.
Protons of 2HP-β-CDChemical Shifts of Complex
Experimental Results
Chemical Shifts of Complex
SCF GIAO Method
H1″5.03−4.925.08−4.90
H8″3.873.84
H3″3.753.75
H6″3.543.57
H2″-H4″-H5″3.433.40
H7″3.363.36
H9″1.011.00
Table 5. 1H NMR chemical shifts for QUE and its complexes with 2,6 Me-β-CD and 2HP-β-CD in D2O at 25° and chemical shifts obtained using the SCF GIAO method.
Protons of QUEChemical ShiftsComplex with 2,6 Me-β-CD
Experimental
Complex with Me-β-CD
Using SCF GIAO Method
Complex with 2HΡ-β-CD
Experimental
Complex with
2HΡ-β-CD
Using SCF GIAO Method
Multiplicity
H6′7.877.657.737.707.70singlet
H2′*7.657.577.507.607.30singlet
H3′*7.157.057.357.027.00doublet
H8′6.656.596.276.696.44doublet
H6′*5.90–5.936.06–6.095.99–6.015.86–5.895.80–5.90broad singlet
Table 6. T1 measurement for 2HΡ-CD before and after complexation.
Peak NameΤ1 2HΡ-β-CDT1 2HP-β-CD with QUEPercentage Change
H1″1.40 s−1.54 s1.39 s−1.52 s2%
H8″1.72 s1.73 s1%
H3″1.23 s1.23 s0%
H6″1.44 s1.28 s16%
H2″-H4″-H5″1.42 s1.20 s22%
H7″1.55 s1.55 s0%
H9″1.19 s1.20 s1%
Table 7. T1 measurement for 2,6Μe-β-CD before and after complexation.
Peak NameΤ1 2,6Μe-β-CDΤ1 2,6Μe-β-CD with QUEPercentage Change
H11.36 s−1.4 s1.35 s−1.4 s1%
H31.49 s1.51 s2%
H51.41 s1.18 s23%
H61.34 s1.12 s22%
H21.36 s 1.12 s24%
H41.35 s1.28 s7%
H6-O-Me1.76 s1.79 s3%
H21.51 s1.39 s12%
H2-O-Me1.64 s1.62 s2%
Table 8. Binding energies, BE, corrected values for BSSE, BEBSSE, and binding energies with respect to the deformed structures of the molecules of the complex, BEr (kcal/mol), deformation energies of the QUE and cyclodextrin, DefL and DefCD., at B3LYP/6-31G(d,p). All energies are expressed in kcal/mol.
2HP-β-CD (d1) a2HP-β-CD (d2) a2,6Μe-β-CD (e1) a2,6Μe-β-CD (e2) a
Deformation_QUE3.89 (19.91) b3.42 (19.44) b0.59 (16.62) b7.31 (23.34) b
Def_CD20.1518.9911.7520.75
BE−8.91 (7.12) b−10.56 (5.46) b0.83 (16.85) b3.85 (19.87) b
BE(BSSE)10.73 (26.76) b10.90 (26.93) b11.68 (27.71) b20.03 (36.06) b
BE_raw−32.95−32.97−11.52−24.21
BE(BSSE)_fcp−13.31−11.50−0.66−8.03
a See Figure 1; b with respect to the global minimum conformer of QUE.
Table 9. Binding free energy analysis for the QUE/2HP-β-CD and QUE/2,6Me-β-CD complexes as obtained by the MM/GBSA calculations.
Energy Component (kcal/mol)2HP-β-CD2,6Me-β-CD
MM/GBSA ΔGvdW−27.35 ± 1.10−27.90 ± 0.92
MM/GBSA ΔGCoulomb−2.08 ± 1.36−5.37 ± 1.90
MM/GBSA ΔGSolvGB+9.13 ± 0.85+9.99 ± 1.65
MM/GBSA ΔGLipo−12.70 ± 1.81−6.26 ± 1.54
MM/GBSA ΔGHbond−0.48 ± 0.16−0.54 ± 0.13
MM/GBSA ΔGCovalent+1.69 ± 0.79+1.63 ± 0.73
MM/GBSA ΔGbind−31.73 ± 3.21−26.77 ± 2.37
Table 10. Absolute free energies of binding (kcal/mol) for the QUE/2HP-β-CD and QUE/2,6Me-β-CD complexes calculated by non-equilibrium TI simulations for four different simulation replicas.
Systems under StudyReplica1Replica2Replica3Replica4 Δ G b i n d   a v e r a g e
2HP-β-CD−1.45 ± 0.46−1.39 ± 0.28−1.55 ± 0.40−1.21 ± 0.36−1.40 ± 0.76
2,6Me-β-CD−5.21 ± 0.37−5.14 ± 0.28−4.53 ± 0.45−5.47 ± 0.39−5.09 ± 0.76
Publisher’s Note: MDPI stays neutral with regard to jurisdictional claims in published maps and institutional affiliations.

