
Biocomposites of Bio-Polyethylene Reinforced with a Hydrothermal-Alkaline Sugarcane Bagasse Pulp and Coupled with a Bio-Based Compatibilizer


Abstract
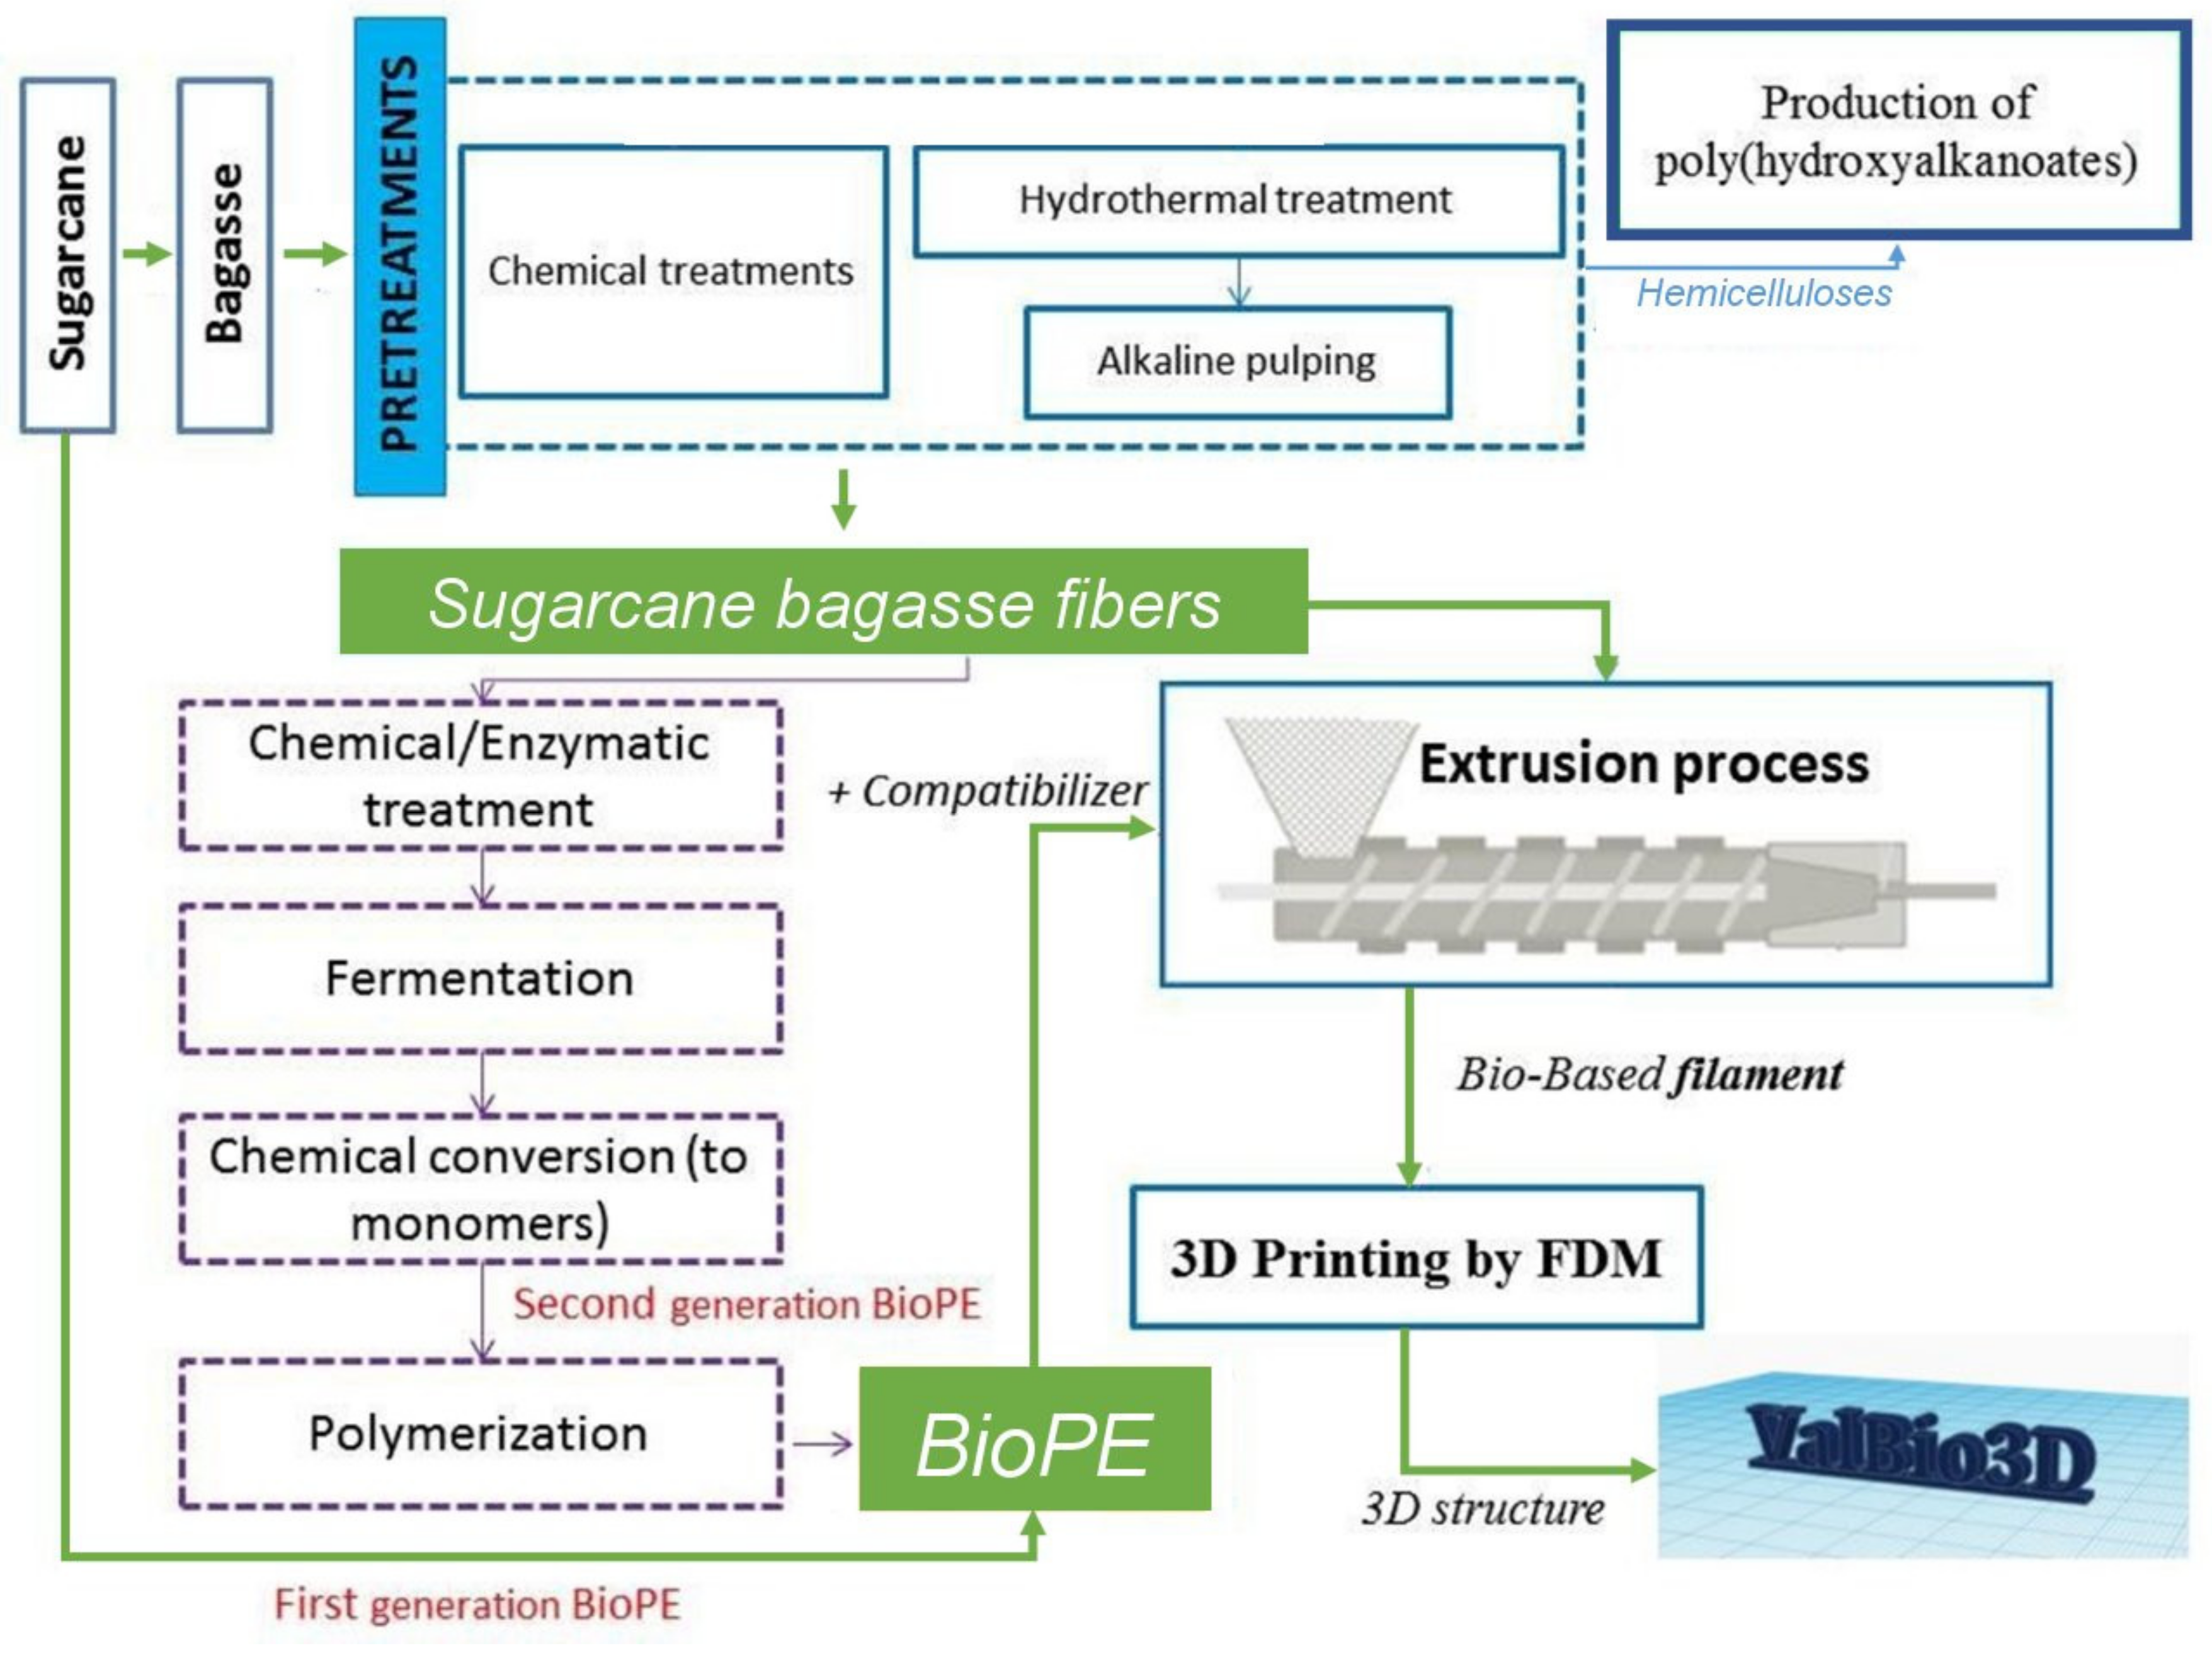
1. Introduction
2. Results
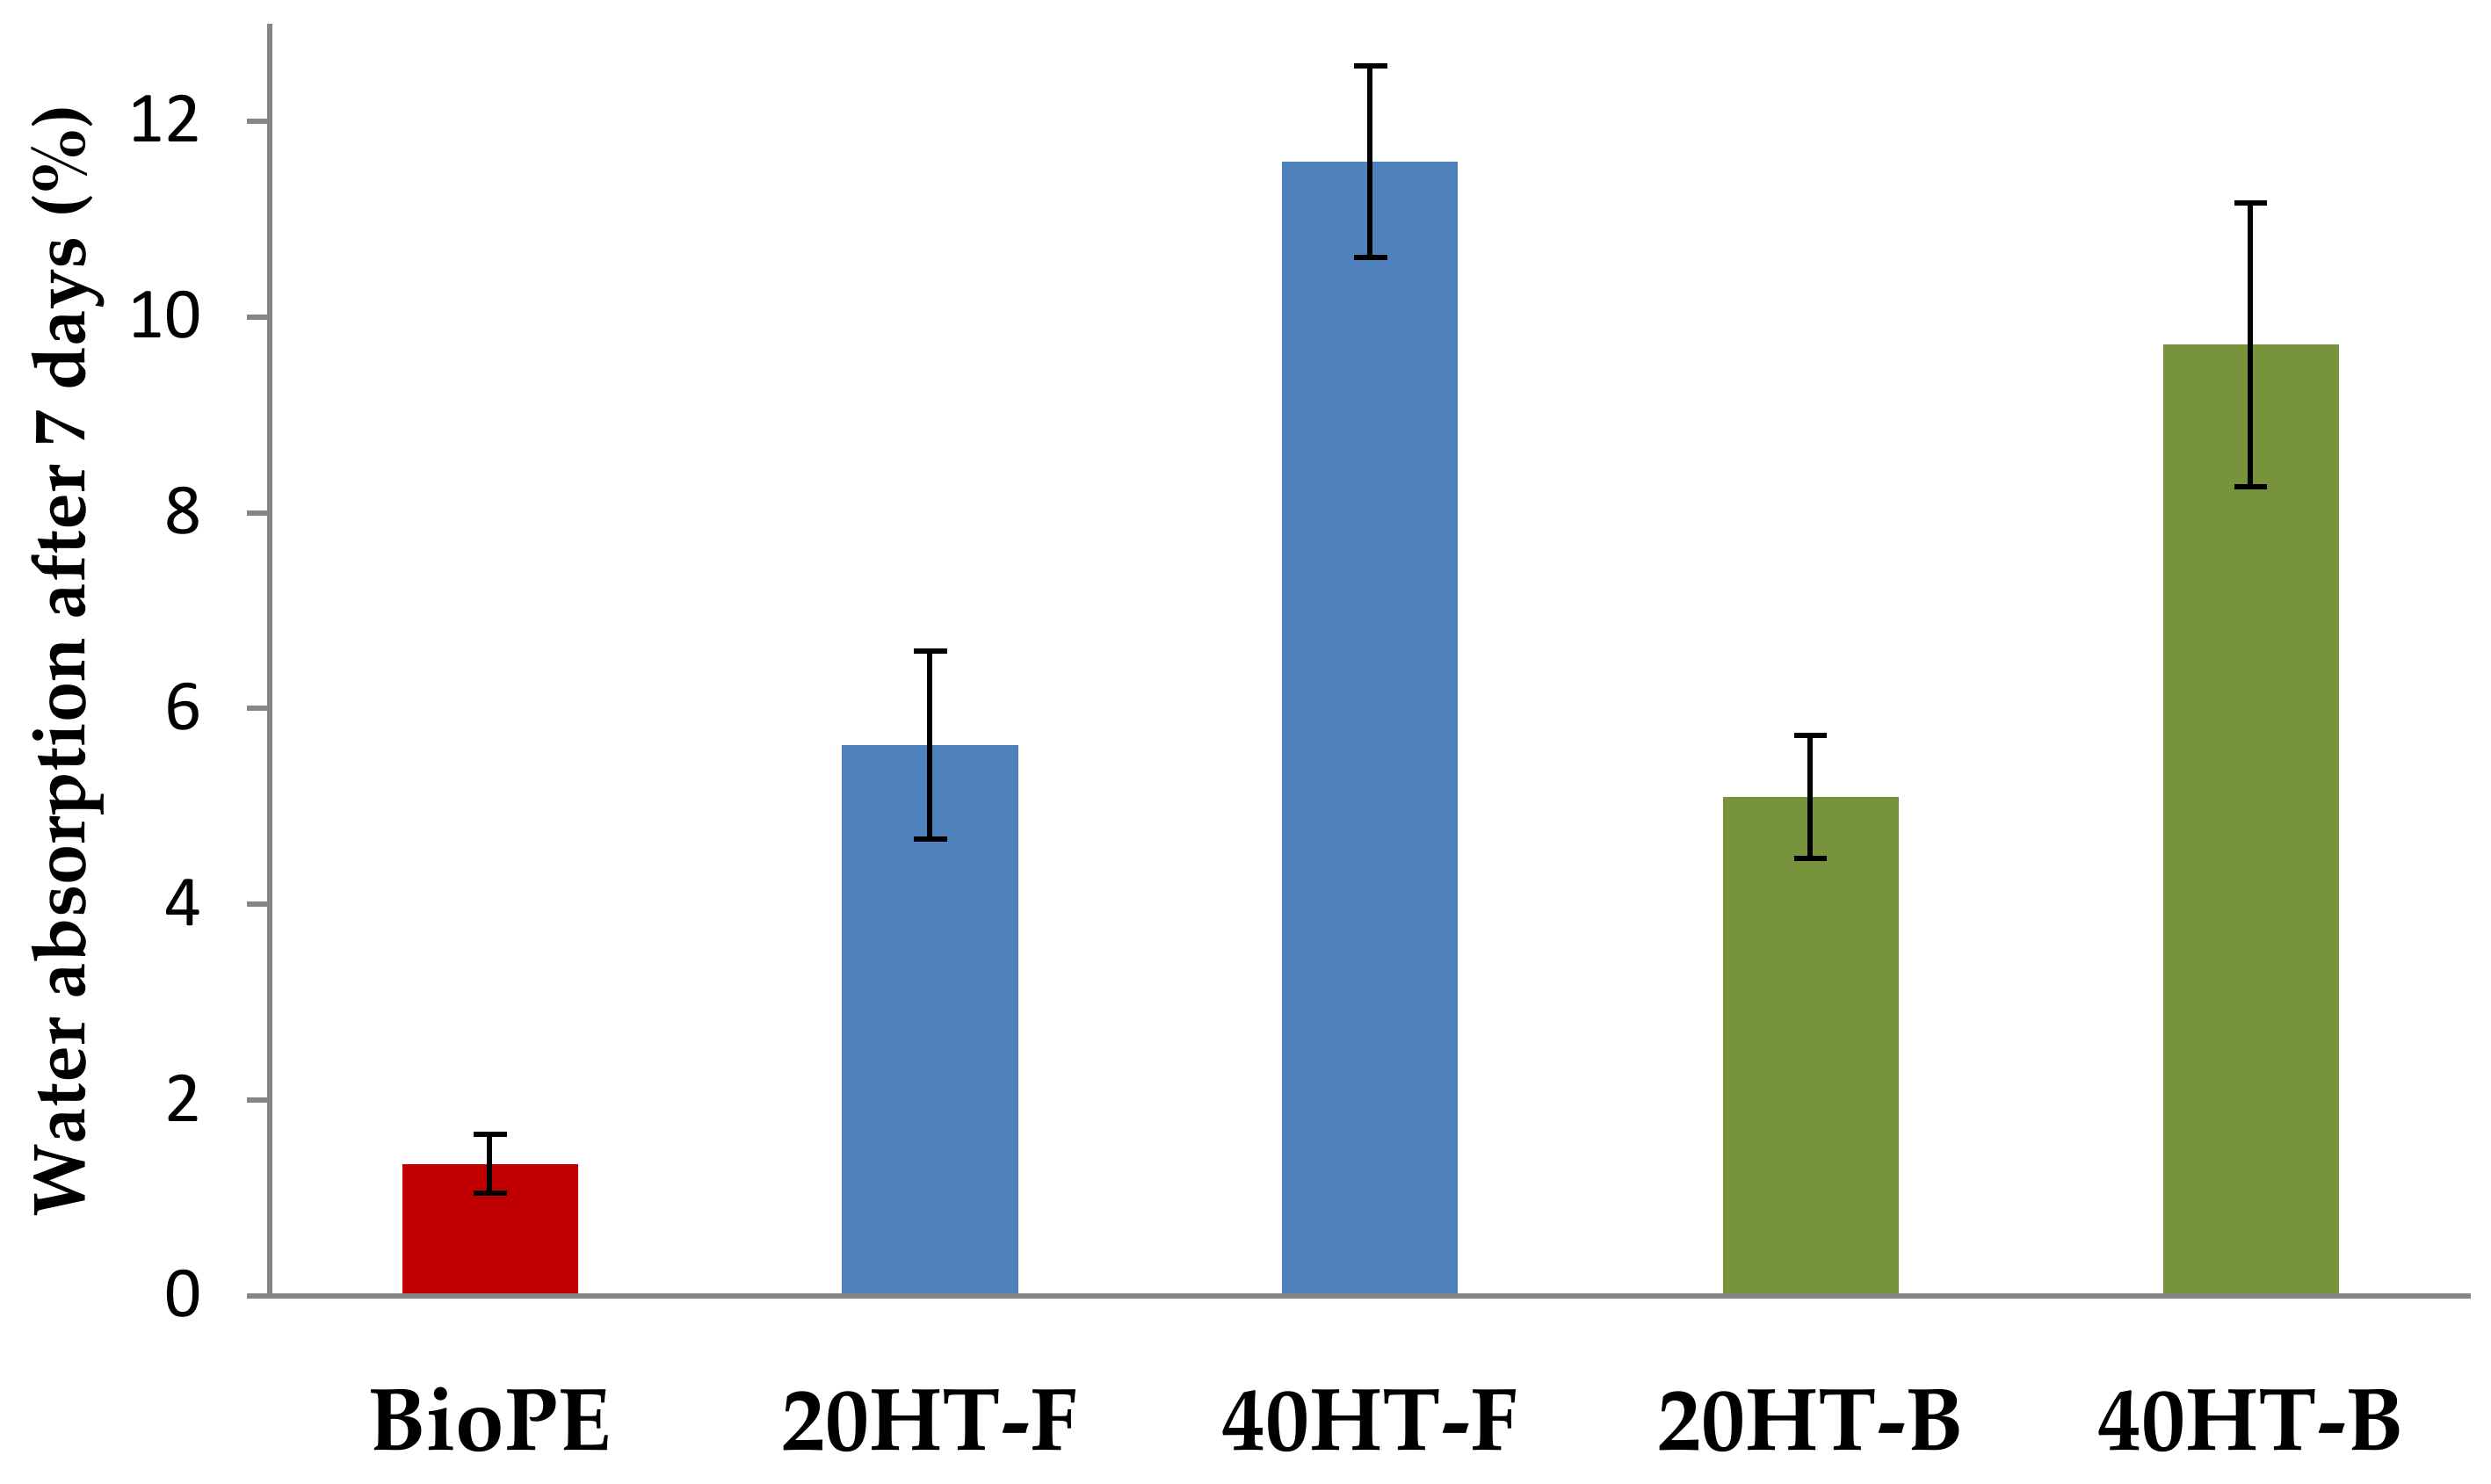
2.1. Water Absorption Behavior
2.2. Mechanical Properties
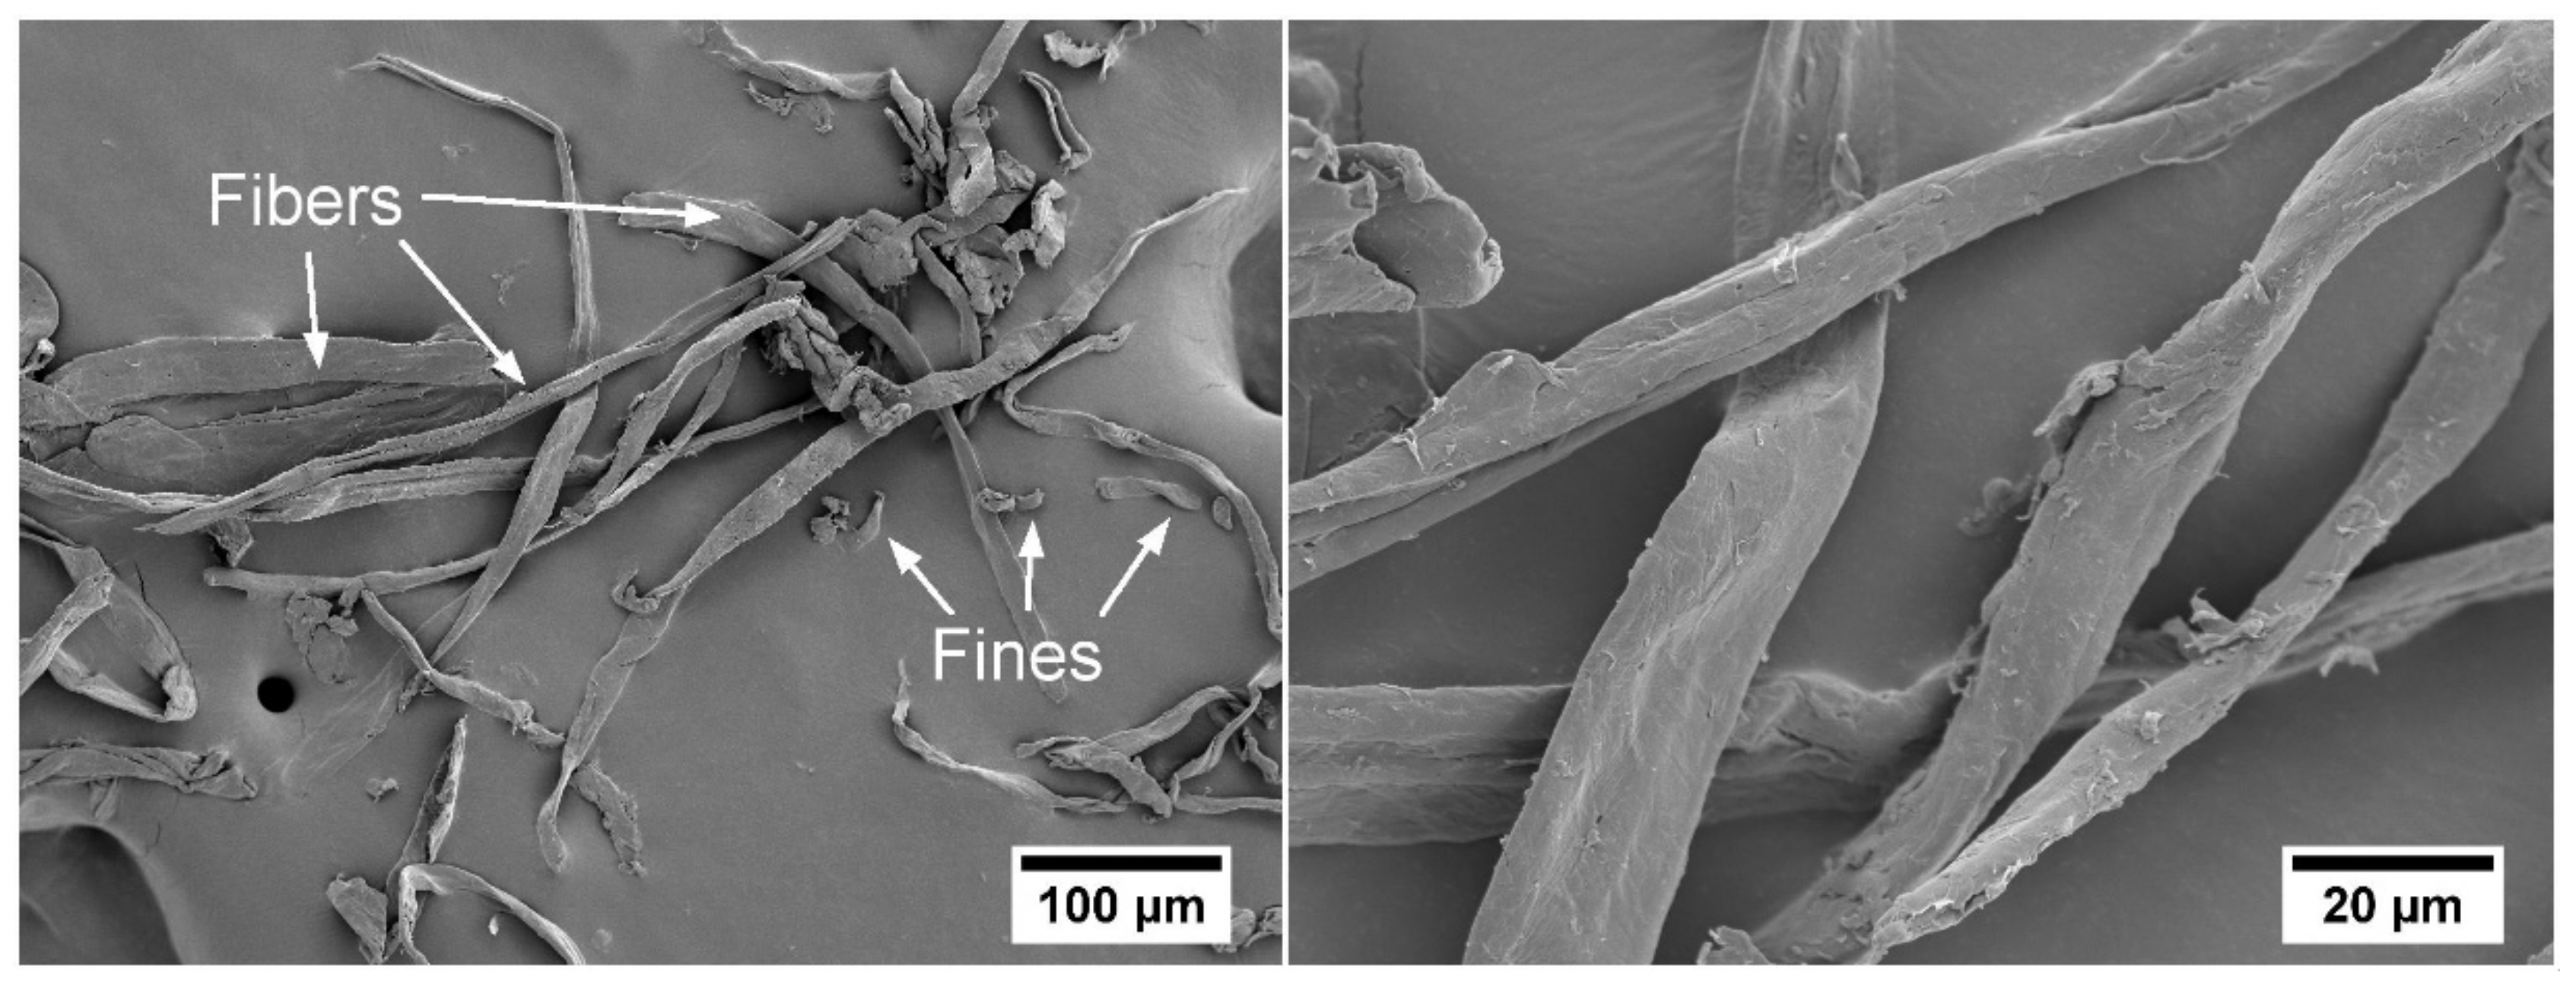
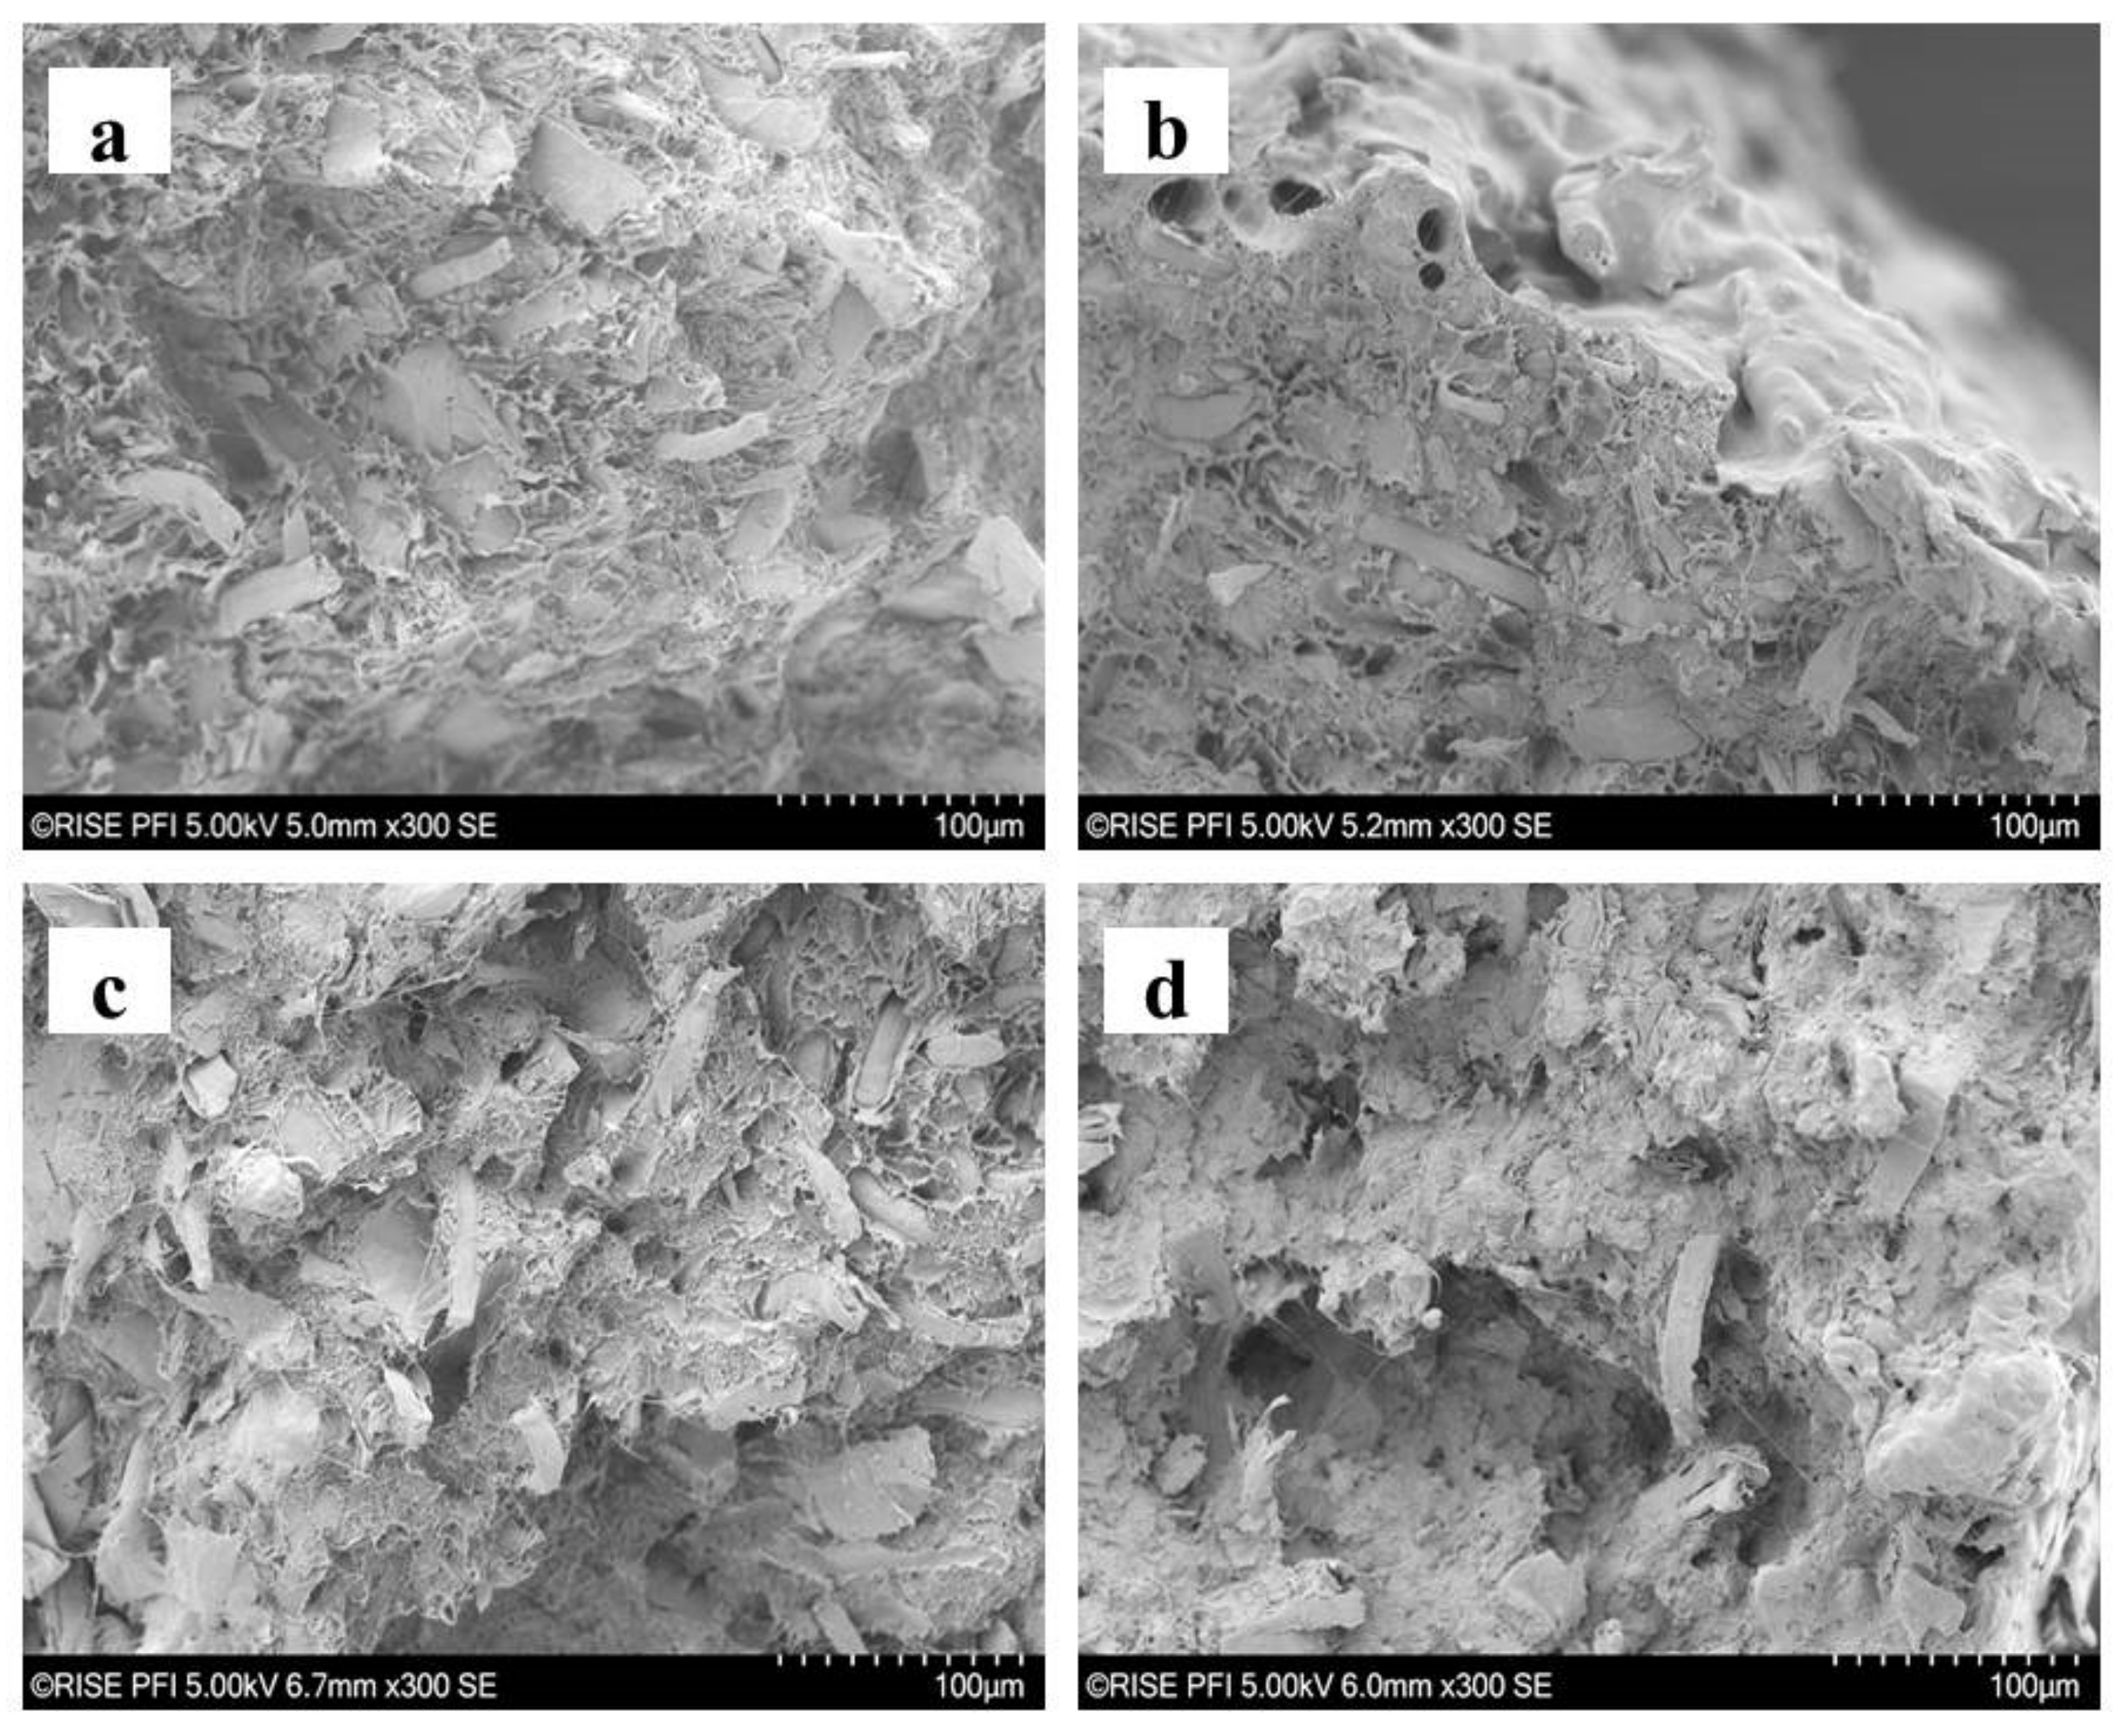
2.3. SEM Assessment
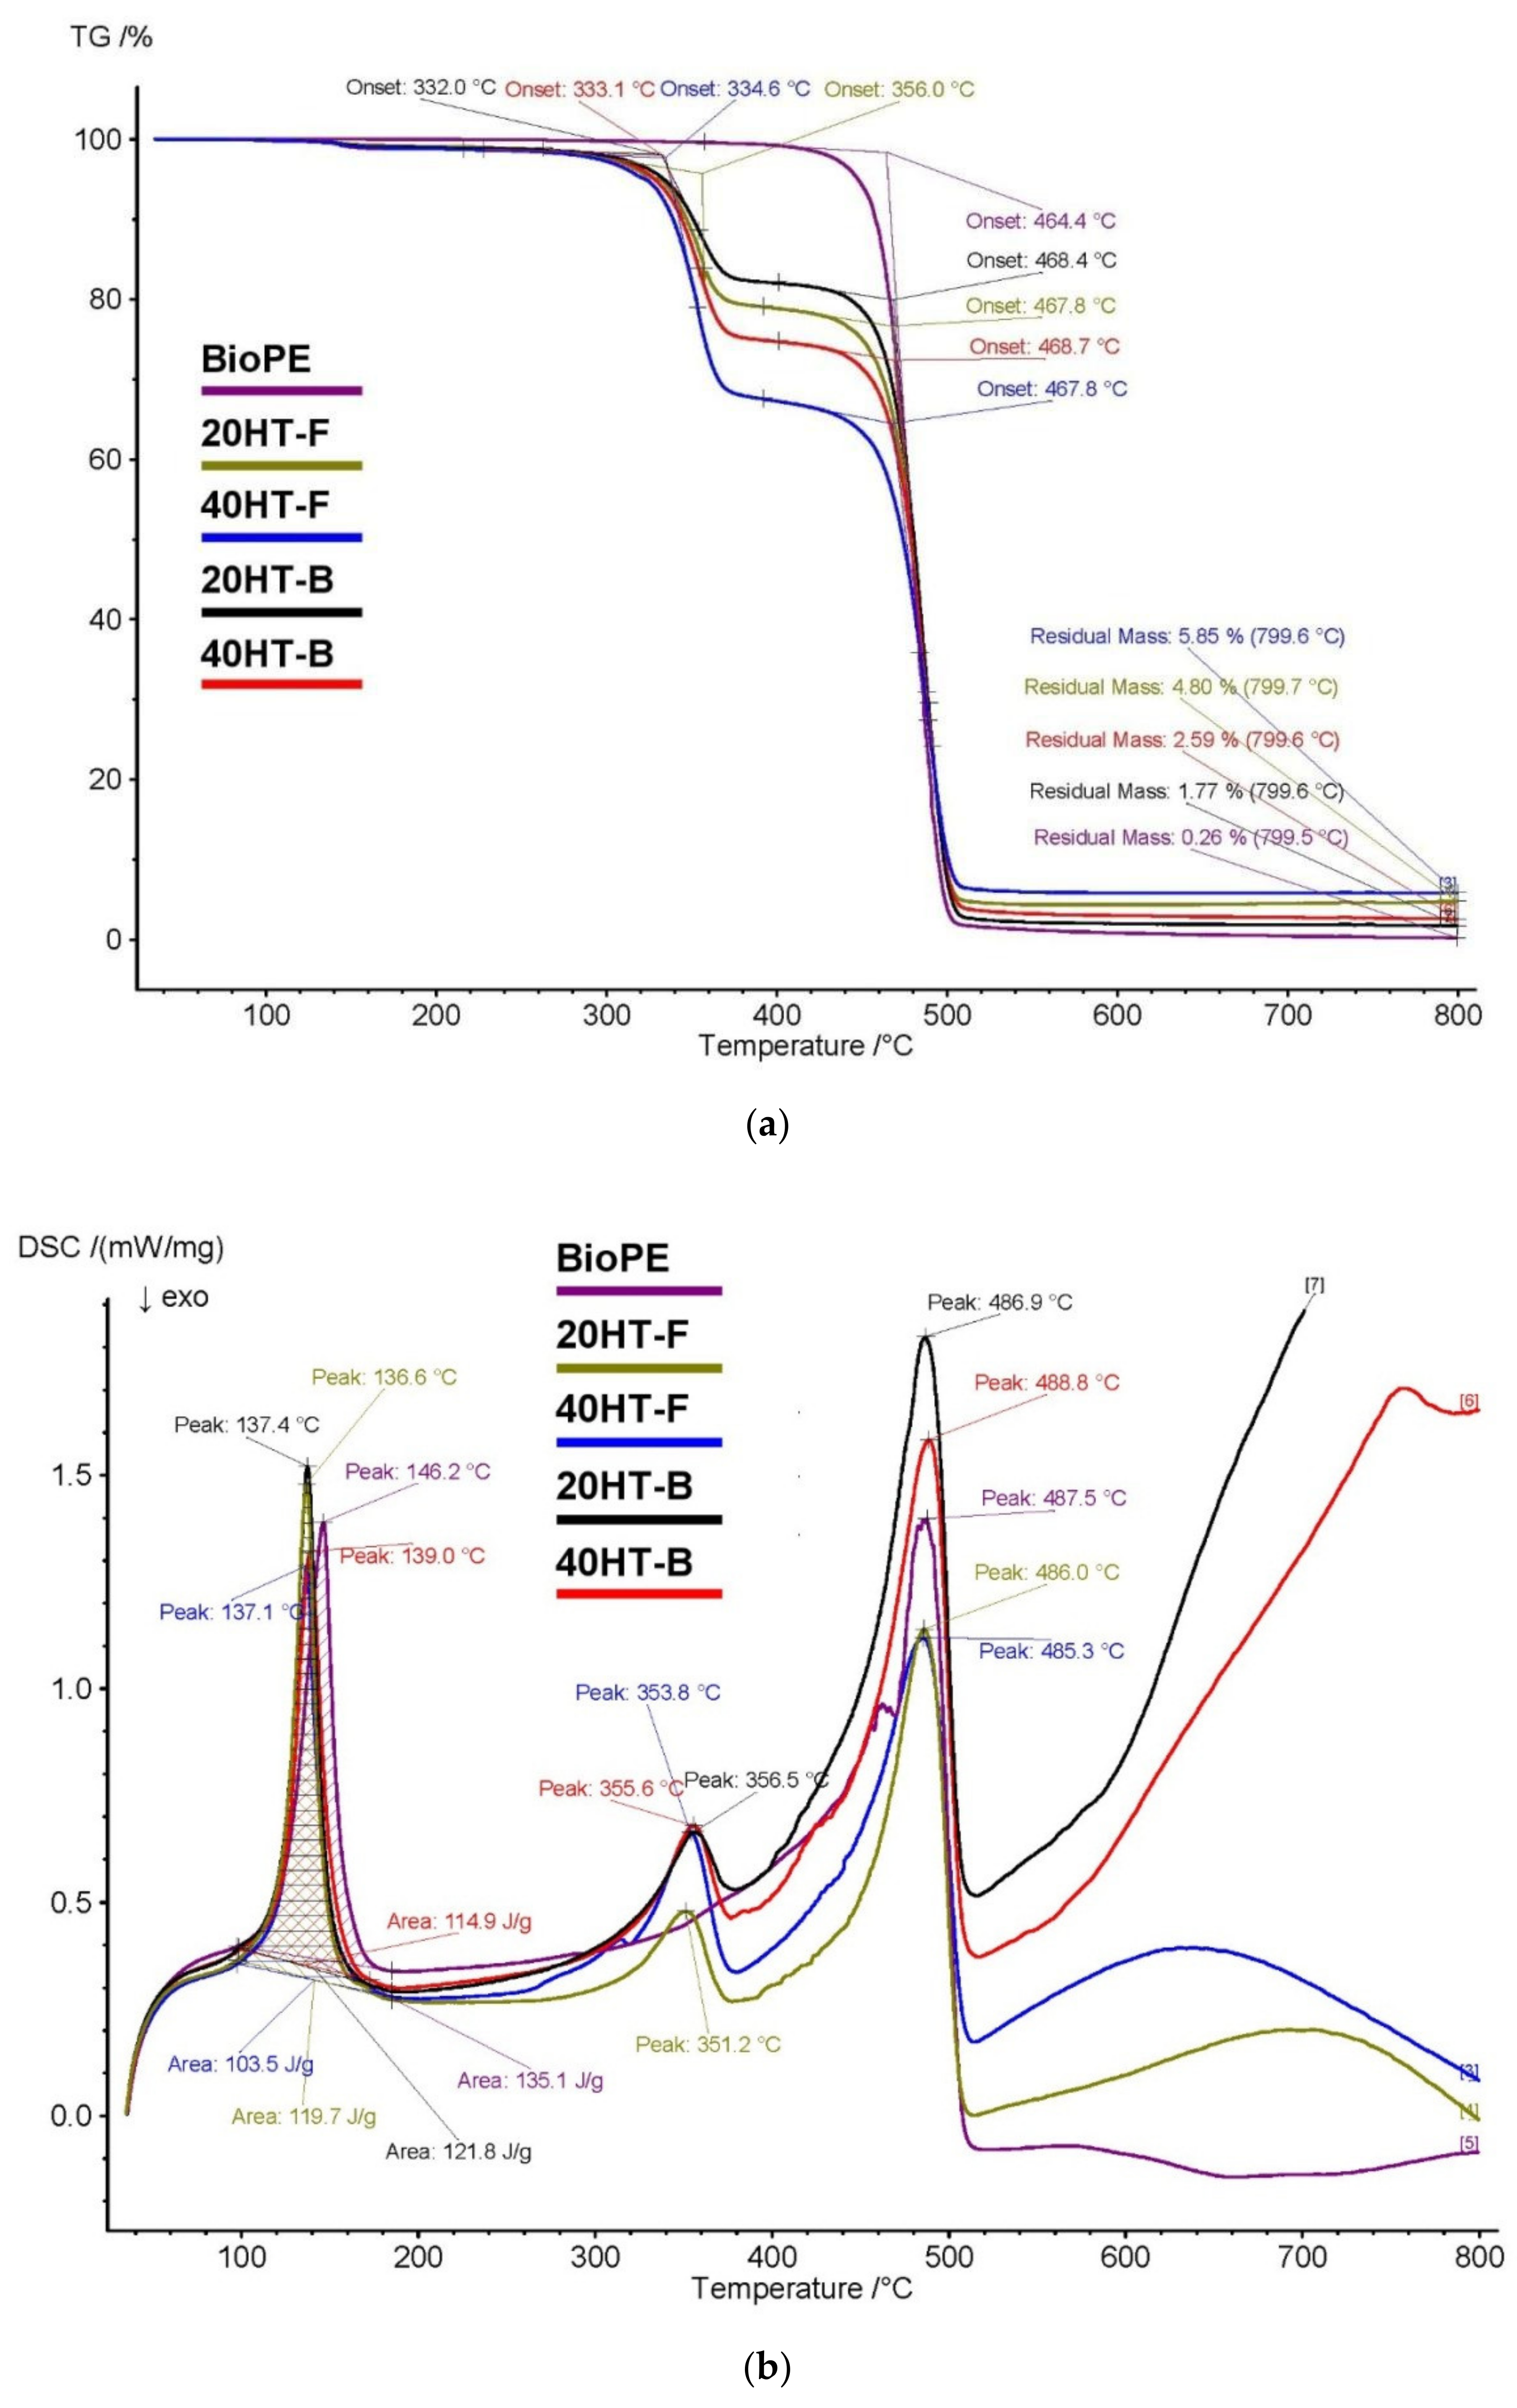
2.4. TGA and DSC
2.5. Printability of the Filaments
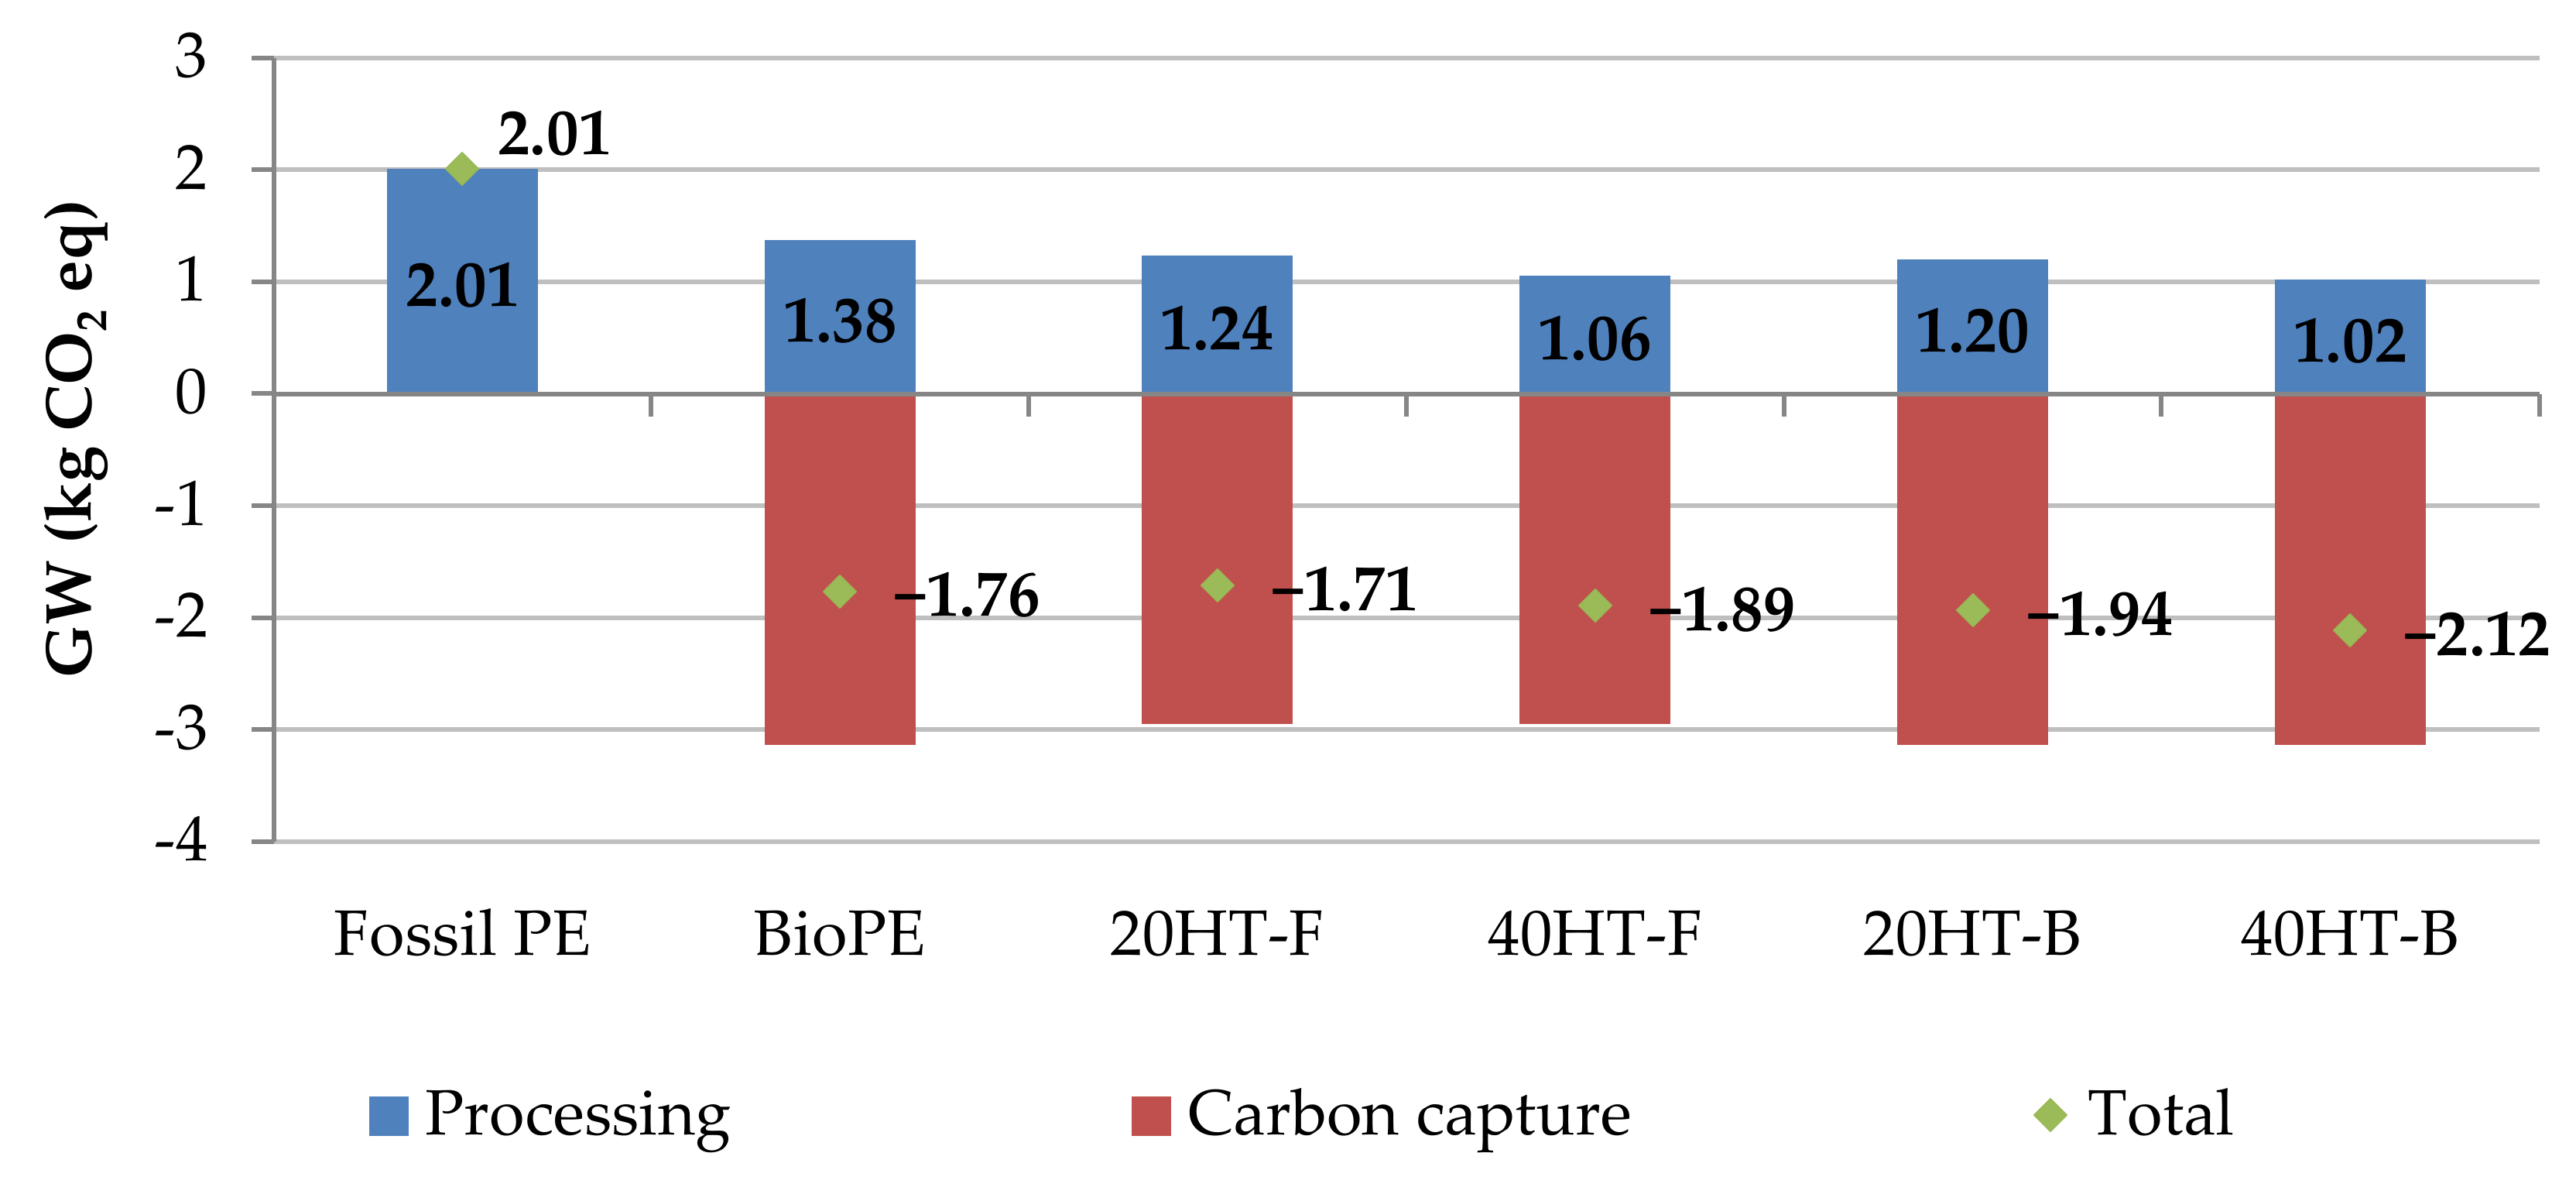
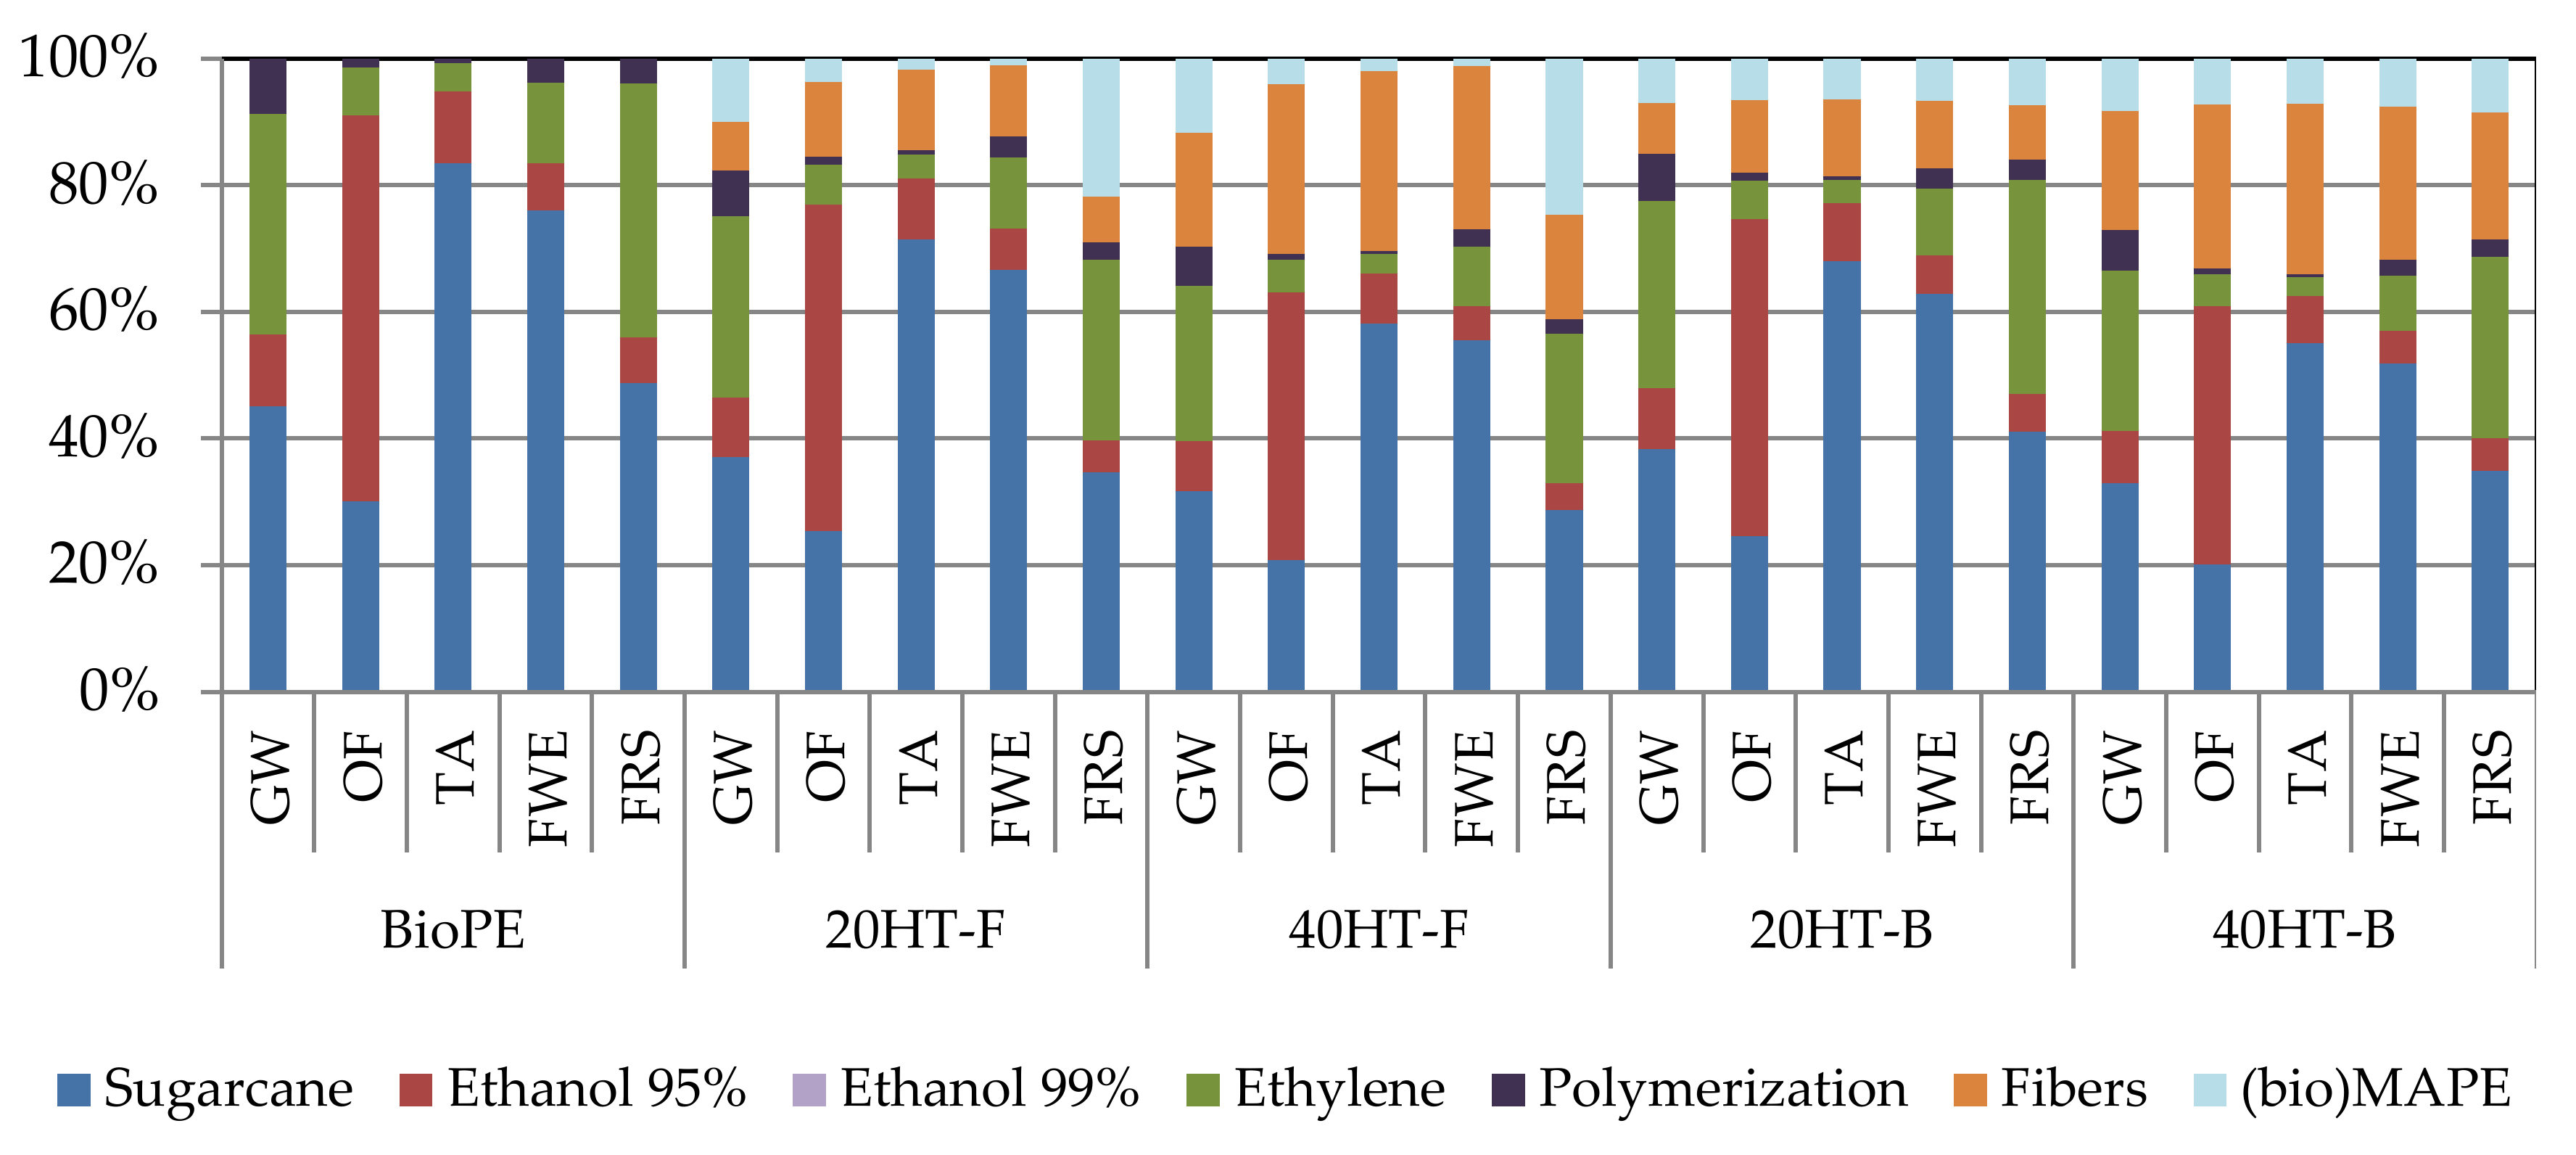
2.6. Environmental Aspects of Bagasse Fiber-Reinforced Biocomposites
3. Materials and Methods
3.1. Materials
3.2. Filaments Elaboration
3.3. Mechanical Characterization of Filaments
3.4. Water Absorption Experiments
3.5. SEM Observations
3.6. Thermo-Gravimetric Analysis (TGA) and Differential Scanning Calorimetry (DSC)
3.7. 3D Printing
3.8. Statistical Analysis
3.9. Impact Assessment
4. Conclusions
Supplementary Materials
Author Contributions
Funding
Acknowledgments
Conflicts of Interest
References
- Compton, B.; Lewis, J. 3D-printing of lightweight cellular composites. Adv. Mater. 2014, 26, 5930–5935. [Google Scholar] [CrossRef]
- Dai, L.; Cheng, T.; Duan, C.; Zhao, W.; Zhang, W.; Zou, X.; Aspler, J.; Ni, Y. 3D printing using plant-derived cellulose and its derivatives: A review. Carbohydr. Polym. 2019, 203, 71–86. [Google Scholar] [CrossRef]
- Ladd, C.; So, J.; Muth, J.; Dickey, M. Microstructures:3D printing of free standing liquid metal microstructures. Adv. Mater. 2013, 25, 5081–5085. [Google Scholar] [CrossRef] [PubMed]
- Jakus, A.E.; Taylor, S.L.; Geisendorfer, N.R.; Dunand, D.C. Metallic architectures from 3D-printed powder-based liquid inks. Adv. Funct. Mater. 2015, 1–11. [Google Scholar] [CrossRef]
- Curodeau, A.; Sachs, E.; Caldarise, S. Design and fabrication of cast orthopedic implants with freeform surface textures from 3-D printed ceramic shell. J. Biomed. Mater. Res. 2000, 53, 525–535. [Google Scholar] [CrossRef]
- Filgueira, D.; Holmen, S.; Melbø, J.K.; Moldes, D.; Echtermeyer, A.T.; Chinga-Carrasco, G. Enzymatic-assisted modification of TMP fibres for improving the interfacial adhesion with PLA for 3D printing. ACS Sustain. Chem. Eng. 2017, 5, 9338–9346. [Google Scholar] [CrossRef]
- Chinthapalli, R.; Skoczinski, P.; Carus, M.; Baltus, W.; De Guzman, D.; Käb, H.; Raschka, A.; Ravenstijn, J. Biobased Building Blocks and Polymers—Global Capacities, Production and Trends, 2018–2023; Nova Institute for Ecology and Innovation: Hürt, Germany, 2020. [Google Scholar]
- Mendieta, C.M.; Vallejos, M.E.; Felissia, F.E.; Chinga-Carrasco, G.; Area, M.C. Review: Bio-polyethylene from wood wastes. J. Polym. Environ. 2020, 28. [Google Scholar] [CrossRef]
- Kakroodi, A.; Kazemi, Y.; Cloutier, A.; Rodrigue, D. Mechanical performance of polyethylene (PE)-based biocomposites. In Biocomposites: Design and Mechanical Performance; Elsevier Ltd.: Cambridge, UK, 2015; pp. 237–256. [Google Scholar]
- Abdelmouleh, M.; Boufi, S.; Belgacem, M.; Dufresne, A. Short natural-fibre reinforced polyethylene and natural rubber composites: Effect of silane coupling agents and fibres loading. Compos. Sci. Technol. 2007, 67, 1627–1639. [Google Scholar] [CrossRef]
- Mengeloğlu, F.; Karakuş, K. Some properties of Eucalyptus wood flour filled recycled high density polyethylene polymer-composites. Turk. J. Agric. 2008, 32, 537–546. [Google Scholar]
- Suhaily, S.S.; Khalil, H.P.S.A.; Nadirah, W.O.W.; Jawaid, M. Bamboo based biocomposites material, design and applications. In Materials Science-Advanced Topics; Mastai, Y., Ed.; Intech: Rijeka, Croatia, 2013; pp. 489–517. [Google Scholar]
- Kakroodi, A.R.; Bainier, J.; Rodrigue, D. Mechanical and morphological properties of flax fiber reinforced high density Polyethylene/recycled rubber composites. Int. Polym. Proc. 2012, 27, 196–204. [Google Scholar] [CrossRef]
- Tajeddin, B.; Abdulah, L.C. Thermal properties of high density polyethylene-kenaf cellulose composites. Polym. Polym. Compos. 2010, 18, 257–261. [Google Scholar] [CrossRef]
- Clauser, N.; Felissia, F.E.; Vallejos, M.E. Small-sized biorefineries as strategy to add value to sugarcane bagasse. Chem. Eng. Res. Des. 2015, 107, 137–146. [Google Scholar] [CrossRef]
- Ramsay, J.A.; Hassan, M.A.; Ramsay, B.A. Hemicellulose as a potential substrate for production of poly(β-hydroxyalkanoates). J. Microbiol. 1995, 41, 262–266. [Google Scholar] [CrossRef]
- Brodin, M.; Vallejos, M.; Tanase, M.; Area, M.C.; Chinga-carrasco, G. Lignocellulosics as sustainable resources for production of bioplastics A review. J. Clean. Prod. 2017, 162, 646–664. [Google Scholar] [CrossRef]
- Filgueira, D.; Holmen, S.; Melbo, J.; Moldes, D.; Echtermeyer, A.; Chinga-Carrasco, G. 3D printable filaments made of biobased polyethylene biocomposites. Polymers 2018, 10, 1–15. [Google Scholar] [CrossRef]
- Pickering, K.L.; Efendy, M.G.A.; Le, T.M. A review of recent developments in natural fibre composites and their mechanical performance. Compos. Part. A 2016, 83, 98–112. [Google Scholar] [CrossRef]
- Lu, J.Z.; Negulescu, I.I.; Wu, Q. Maleated wood-fiber/high-density-polyethylene composites: Coupling mechanisms and interfacial characterization. Compos. Interfaces 2005, 12, 125–140. [Google Scholar] [CrossRef]
- Aggarwal, P.K.; Chauhan, S.; Raghu, N.; Karmarkar, S.; Shashidhar, G.M. Mechanical properties of bio-fibers-reinforced high-density polyethylene composites: Effect of coupling agents and bio-fillers. J. Reinf. Plast. Compos. 2013, 32, 1722–1732. [Google Scholar] [CrossRef]
- Yuan, Q.; Wu, D.; Gotama, J.; Bateman, S. Wood fiber reinforced polyethylene and polypropylene composites with high modulus and impact strength. J. Thermoplast. Compos. Mater. 2008, 21, 195–208. [Google Scholar] [CrossRef]
- Tarrés, Q.; Melbø, J.; Delgado-Aguilar, M.; Espinach, F.X.; Mutjé, P.; Chinga-Carrasco, G. Bio-polyethylene reinforced with thermomechanical pulp fibers: Mechanical and micromechanical characterization and its application in 3D-printing by fused deposition modelling. Compos. Part B Eng. 2018, 153, 70–77. [Google Scholar] [CrossRef]
- Méndez, J.; Vilaseca, F.; Pélach, M.Á.; López, J.; Barberá, L.; Turon, X.; Gironés, J.; Mutjé, P. Evaluation of the reinforcing effect of ground wood pulp in the preparation of polypropylene-based composites coupled with Maleic Anhydride grafted Polypropylene. J. Appl. Polym. Sci. 2007, 105, 3588–3596. [Google Scholar] [CrossRef]
- Ehman, N.; Rodriguez Rivero, G.; Area, M.C.; Felissia, F. Dissolving pulps by oxidation of the Cellulosic fraction of lignocellulosic waste. Cellul. Chem. Technol. 2017, 51. [Google Scholar]
- Kargarzadeh, H.; Ahmad, I.; Thomas, S.; Dufresne, A. Handbook of Nanocellulose and Cellulose Nanocomposites; Wiley-VCH: Weinheim, Germany, 2012. [Google Scholar]
- Shahzad, A. Effects of water absorption on mechanical properties of hemp fiber composites. Polym. Compos. 2011, 33, 120–128. [Google Scholar] [CrossRef]
- Cheng, H.; Zhan, H.; Fu, S.; Lucia, L. Alkali extraction of hemicellulose from depithed corn stover and effects on Soda-AQ pulping. Bioresources 2010, 11, 196–206. [Google Scholar]
- Tajvidi, M.; Ebrahimi, G. Water uptake and mechanical characteristics of natural filler-polypropylene composites. J. Appl. Polym. Sci. 2003, 88, 941–946. [Google Scholar] [CrossRef]
- Zhang, Y.; Hosseinaei, O.; Wang, S. Influence of hemicellulose extraction on water uptake behaviour of wood strands. Wood Fiber Sci. 2011, 43, 244–250. [Google Scholar]
- Chinga-Carrasco, G.; Johnsen, P.O.; Øyaas, K. Structural quantification of wood fibre surfaces—Morphological effects of pulping and enzymatic treatment. Micron 2010, 41, 648–659. [Google Scholar] [CrossRef]
- Cordin, M.; Bechtold, T.; Pham, T. Effect of fibre orientation on the mechanical properties of polypropylene–lyocell composites. Cellulose 2018, 25, 7197–7210. [Google Scholar] [CrossRef]
- Joffre, T.; Miettinen, A.; Berthold, F.; Gamstedt, E.K. X-ray micro-computed tomography investigation of fibre length degradation during the processing steps of short-fibre composites. Compos. Sci. Technol. 2014, 105, 127–133. [Google Scholar] [CrossRef]
- Lomakin, S.M.; Rogovina, S.Z.; Grachev, A.V.; Prut, E.V.; Alexanyan, C. V Thermal degradation of biodegradable blends of polyethylene with cellulose and ethylcellulose. Thermochim. Acta 2011, 521, 66–73. [Google Scholar] [CrossRef]
- Banat, R.; Fares, M.M. Thermo-gravimetric stability of high density polyethylene composite filled with olive shell flour. Am. J. Polym. Sci. 2015, 5, 65–74. [Google Scholar]
- Wojcieszak, R.; Santarelli, F.; Paul, S.; Dumeignil, F.; Cavani, F.; Gonçalves, R. V Recent developments in maleic acid synthesis from bio-based chemicals. Sustain. Chem. Process. 2015, 3, 1–11. [Google Scholar] [CrossRef]
- Ita-Nagy, D.; Vázquez-Rowe, I.; Kahhat, R.; Quispe, I.; Chinga-Carrasco, G.; Clauser, N.M.; Area, M.C. Life cycle assessment of bagasse fiber reinforced biocomposites. Sci. Total Environ. 2020, 720, 137586. [Google Scholar] [CrossRef] [PubMed]
- Sluiter, A.; Hames, B.; Ruiz, R.; Scarlata, C. Determination of Structural Carbohydrates and Lignin in Biomass Determination of Structural Carbohydrates and Lignin in Biomass; National Renewable Energy Laboratory USA: Golden, CO, USA, 2012; pp. 1–15. [Google Scholar]
- Stocker, T.F.; Qin, D.; Plattner, G.K.; Tignor, M.M.B.; Allen, S.K.; Boschung, J.; Nauels, A.; Xia, Y.; Bex, V.; Midgley, P.M. Climate Change 2013 the Physical Science Basis: Working Group I Contribution to the Fifth Assessment Report of the Intergovernmental Panel on Climate Change, 1st ed.; Cambridge University Press: Cambridge, UK; New York, NY, USA, 2013; pp. 1–1535. [Google Scholar]
- Hauschild, M.Z.; Goedkoop, M.; Guinée, J.; Heijungs, R.; Huijbregts, M.; Jolliet, O.; Margni, M.; De Schryver, A.; Humbert, S.; Laurent, A.; et al. Identifying best existing practice for characterization modeling in life cycle impact assessment. Int. J. Life Cycle Assess. 2013, 18, 683–697. [Google Scholar] [CrossRef]
- Jolliet, O.; Antón, A.; Boulay, A.M.; Cherubini, F.; Fantke, P.; Levasseur, A.; McKone, T.E.; Michelsen, O.; Milà i Canals, L.; Motoshita, M.; et al. Global guidance on environmental life cycle impact assessment indicators: Impacts of climate change, fine particulate matter formation, water consumption and land use. Int. J. Life Cycle Assess. 2018, 23, 2189–2207. [Google Scholar] [CrossRef]
- Guinée, J.B.; Heijungs, R. Life Cycle Assessment. In Kirk-Othmer Encyclopedia of Chemical Technology; John Wiley & Sons, Inc.: Hoboken, NJ, USA, 2005. [Google Scholar]
- Curran, M.A. Strengths and Limitations of Life Cycle Assessment. In Background and Future Prospects in Life Cycle Assessment. LCA Compendium-The Complete World of Life Cycle Assessment; Klöpffer, W., Ed.; Springer: Dordrecht, The Netherlands, 2014; pp. 189–206. [Google Scholar]
- International Standardization Organization ISO Technical Committee ISO/TC 207. ISO 14040:2006 Environmental Management—Life Cycle Assessment–Principles and Framework, 2nd ed.; International Organization for Standardization: Geneva, Switzerland, 2006. [Google Scholar]
- International Standardization Organization ISO Technical Committee ISO/TC 207. 14044. Environmental Management—Life Cycle Assessment–Requirements and Guidelines, 1st ed.; International Organization for Standardization: Geneva, Switzerland, 2006. [Google Scholar]
- Guinée, J.; Gorrée, M.; Heijungs, R.; Huppers, G.; Kleijn, R.; De Koning, A.; Van Oers, L.; Weegener Sleeswijk, A.; Suh, S.; De Haes, H.A.U.; et al. Handbook on Life Cycle Assessment: Operational Guide to the ISO Standards; Kluwer Academic Publishers: Dordrecht, The Netherlands, 2002; Volume 7. [Google Scholar]
- European Commission—Joint Research Centre (EC-JRC). General Guide for Life Cycle Assessment—Detailed Guidance, 1st ed.; Publications Office of the European Union: Luxembourg, 2010. [Google Scholar]
- Ecoinvent Ecoinvent v3.4 Database. Ecoinvent Centre. Available online: http://www.ecoinvent.org/ (accessed on 20 May 2019).
- Product Ecology Consultants. PRé-Product Ecology Consultants SimaPro; Product Ecology Consultants: Amersfoort, The Netherlands, 2018. [Google Scholar]
Sample Availability: Not available. |


| Chemical Composition (% od) | Sugarcane Bagasse | HT/Soda Pulp |
|---|---|---|
| Glucans | 40.4 ± 0.04 | 90.8 ± 0.18 |
| Hemicelluloses | 35.0 | 5.1 |
| Xylans | 26.7 ± 0.32 | 5.1 ± 0.07 |
| Arabinans | 5.3 ± 0.28 | - |
| Acetyl Groups | 3.0 ± 0.02 | - |
| Lignin | 20.6 ± 0.12 | 2.1 ± 0.08 |
| Extractives | 3.2 ± 0.01 | - |
| Code | σ (MPa) | E (MPa) | εmáx (%) |
|---|---|---|---|
| BioPE | 20.4 ± 3.1 | 800 ± 40 | 23.9 ± 2.1 |
| 20HT-F | 24.8 ± 1.8 | 970 ± 100 | 18.2 ± 2.1 |
| 40HT-F | 33.0 ± 2.4 | 1480 ± 200 | 21.4 ± 2.9 |
| 20HT-B | 23.8 ± 3.9 | 1020 ± 60 | 19.1 ± 1.8 |
| 40HT-B | 32.3 ± 2.0 | 1280 ± 130 | 19.9 ± 1.8 |
| TGA Analysis | ||||
|---|---|---|---|---|
| Code | T-Onset 1 (°C) | T-Onset 2 (°C) | Residue (%) | |
| BioPE | - | 464 | 0.26 | |
| 20HT-F | 356 | 468 | 4.80 | |
| 40HT-F | 335 | 468 | 5.85 | |
| 20HT-B | 332 | 468 | 1.77 | |
| 40HT-B | 333 | 469 | 2.59 | |
| DSC Analysis | ||||
| Code | Tm (°C) | ΔHm (J/g) | Tpeak 1 (°C) | Tpeak 2 (°C) |
| BioPE | 146 | 135 | - | 487 |
| 20HT-F | 137 | 120 | 351 | 486 |
| 40HT-F | 137 | 103 | 354 | 485 |
| 20HT-B | 137 | 122 | 356 | 487 |
| 40HT-B | 139 | 115 | 356 | 489 |
| Impact Category | Unit | Fossil PE | BioPE | 20HT-F | 40HT-F | 20HT-B | 40HT-B |
|---|---|---|---|---|---|---|---|
| Global warming without CO2 capture | kg CO2 eq | 2.01 | 1.38 | 1.24 | 1.06 | 1.20 | 1.02 |
| Global warming with CO2 capture | kg CO2 eq | 2.01 | −1.76 | −1.71 | −1.89 | −1.94 | −2.12 |
| Ozone formation, Terrestrial ecosystems | kg NOx eq | 4.52 × 10⁻³ | 8.40 × 10⁻³ | 7.36 × 10⁻³ | 6.56 × 10⁻³ | 7.59 × 10⁻³ | 6.78 × 10⁻³ |
| Terrestrial acidification | kg SO2 eq | 5.27 × 10⁻³ | 2.17 × 10⁻² | 1.88 × 10⁻² | 1.69 × 10⁻² | 1.98 × 10⁻² | 1.78 × 10⁻² |
| Freshwater eutrophication | kg P eq | 2.79 × 10⁻⁵ | 4.80 × 10⁻⁴ | 4.05 × 10⁻⁴ | 3.55 × 10⁻⁴ | 4.30 × 10⁻⁴ | 3.80 × 10⁻⁴ |
| Fossil resource scarcity | kg oil eq | 1.57 | 0.41 | 0.43 | 0.38 | 0.36 | 0.31 |
| Code | BioPE (wt%) | Fibers (wt%) | Compatibilizer (wt%) | Compatibilizer Type |
|---|---|---|---|---|
| BioPE | 100 | 0 | 0 | - |
| 20HT-F | 74 | 20 | 6 | fMAPE |
| 40HT-F | 54 | 40 | 6 | fMAPE |
| 20HT-B | 74 | 20 | 6 | bMAPE |
| 40HT-B | 54 | 40 | 6 | bMAPE |
| Methodology | Impact Category | Unit |
|---|---|---|
| IPCC 2013 | Global warming 100 year (GW) | kg CO2 eq |
| ReCiPe 2016 | Ozone formation, terrestrial ecosystems (OF) | kg NOx eq |
| Terrestrial acidification (TA) | kg SO2 eq | |
| Freshwater eutrophication (FWE) | kg P eq | |
| Fossil resource scarcity (FRS) | kg oil eq |
© 2020 by the authors. Licensee MDPI, Basel, Switzerland. This article is an open access article distributed under the terms and conditions of the Creative Commons Attribution (CC BY) license (http://creativecommons.org/licenses/by/4.0/).
Share and Cite
Ehman, N.V.; Ita-Nagy, D.; Felissia, F.E.; Vallejos, M.E.; Quispe, I.; Area, M.C.; Chinga-Carrasco, G. Biocomposites of Bio-Polyethylene Reinforced with a Hydrothermal-Alkaline Sugarcane Bagasse Pulp and Coupled with a Bio-Based Compatibilizer. Molecules 2020, 25, 2158. https://doi.org/10.3390/molecules25092158
Ehman NV, Ita-Nagy D, Felissia FE, Vallejos ME, Quispe I, Area MC, Chinga-Carrasco G. Biocomposites of Bio-Polyethylene Reinforced with a Hydrothermal-Alkaline Sugarcane Bagasse Pulp and Coupled with a Bio-Based Compatibilizer. Molecules. 2020; 25(9):2158. https://doi.org/10.3390/molecules25092158
Chicago/Turabian StyleEhman, Nanci Vanesa, Diana Ita-Nagy, Fernando Esteban Felissia, María Evangelina Vallejos, Isabel Quispe, María Cristina Area, and Gary Chinga-Carrasco. 2020. "Biocomposites of Bio-Polyethylene Reinforced with a Hydrothermal-Alkaline Sugarcane Bagasse Pulp and Coupled with a Bio-Based Compatibilizer" Molecules 25, no. 9: 2158. https://doi.org/10.3390/molecules25092158
APA StyleEhman, N. V., Ita-Nagy, D., Felissia, F. E., Vallejos, M. E., Quispe, I., Area, M. C., & Chinga-Carrasco, G. (2020). Biocomposites of Bio-Polyethylene Reinforced with a Hydrothermal-Alkaline Sugarcane Bagasse Pulp and Coupled with a Bio-Based Compatibilizer. Molecules, 25(9), 2158. https://doi.org/10.3390/molecules25092158