Extraction and Determination of Polar Bioactive Compounds from Alfalfa (Medicago sativa L.) Using Supercritical Techniques

 ,
, 
Abstract
:1. Introduction
2. Materials and Methods
2.1. Chemicals and Reagents
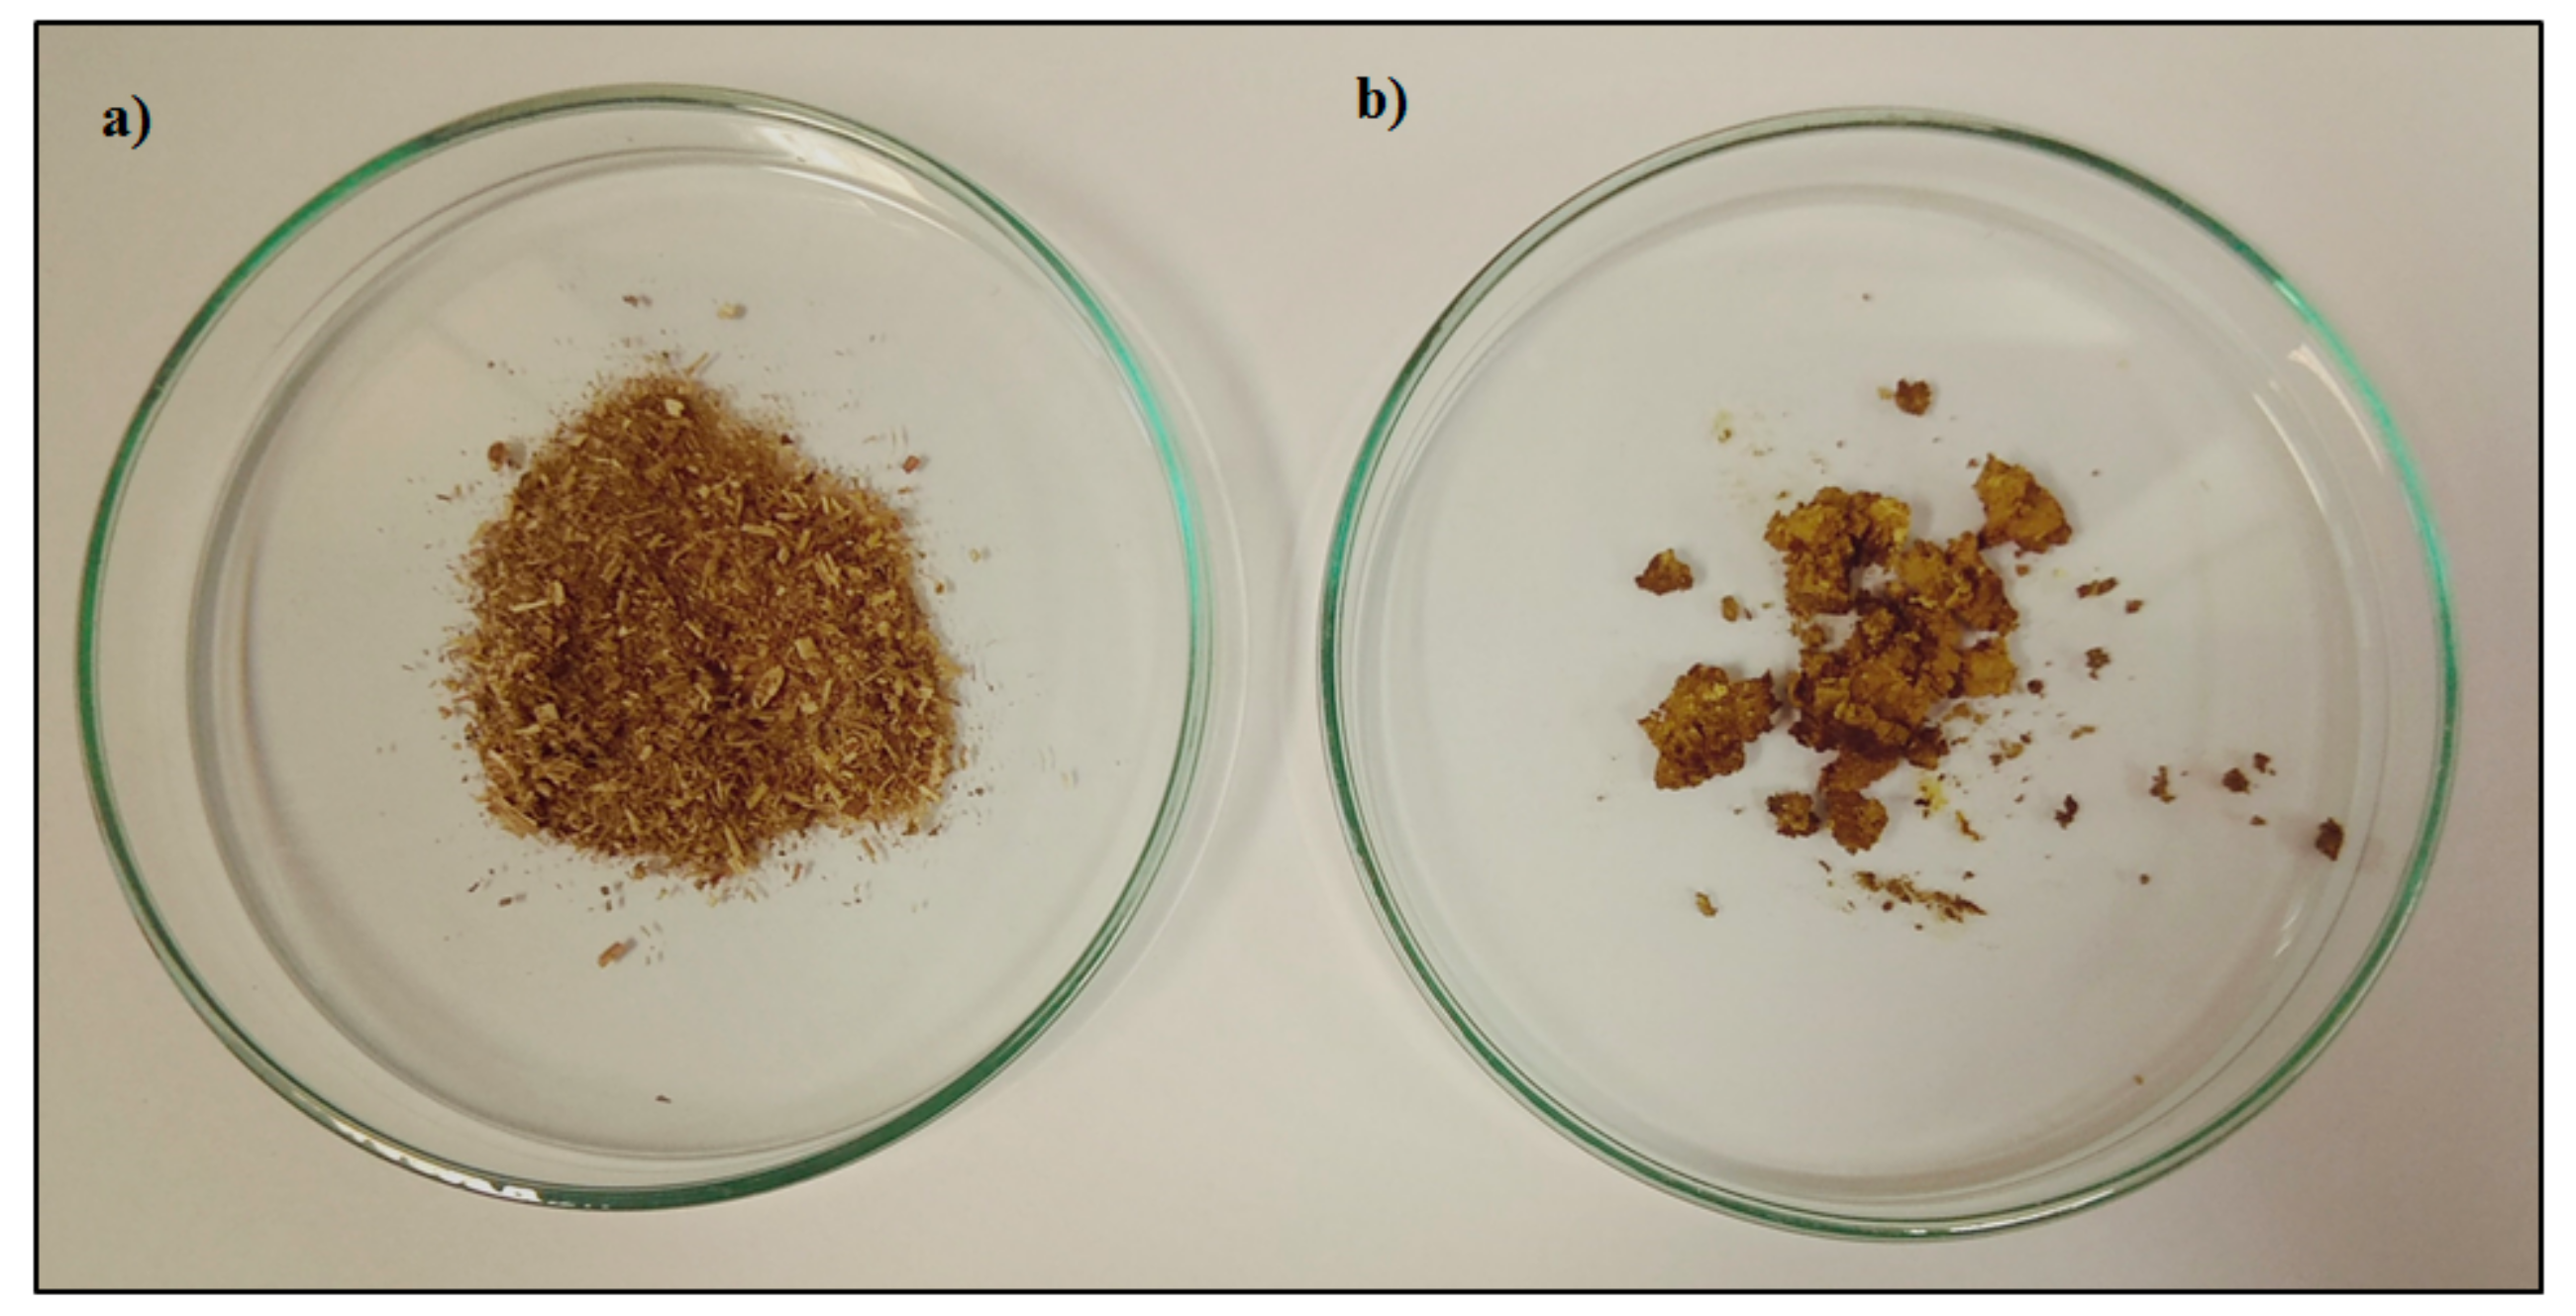
2.2. Plant Material
2.3. Extractions Plan According to Box-Behnken Design (BBD)
2.4. Supercritical Fluid Extraction of M. sativa at Quarter-Technical Plant
2.5. Maceration
2.6. Total Phenolics Content (TPC)
2.7. Total Flavonoids Content (TFC)
2.8. Supercritical Fluid Chromatography
2.9. Preparation of Standards and Samples Solutions for SFC Determination
3. Results and Discussion
3.1. SFE-scCO2–Result of the Optimization
- for yield–temperature and solvent flow rate,
- for TPC–temperature, pressure, solvent flow rate, linear correlation between pressure and flow rate,
- for TFC–pressure, solvent flow rate, linear correlation between temperature and pressure and squared pressure. It can be noticed that pressure has a crucial impact on the TFC content.
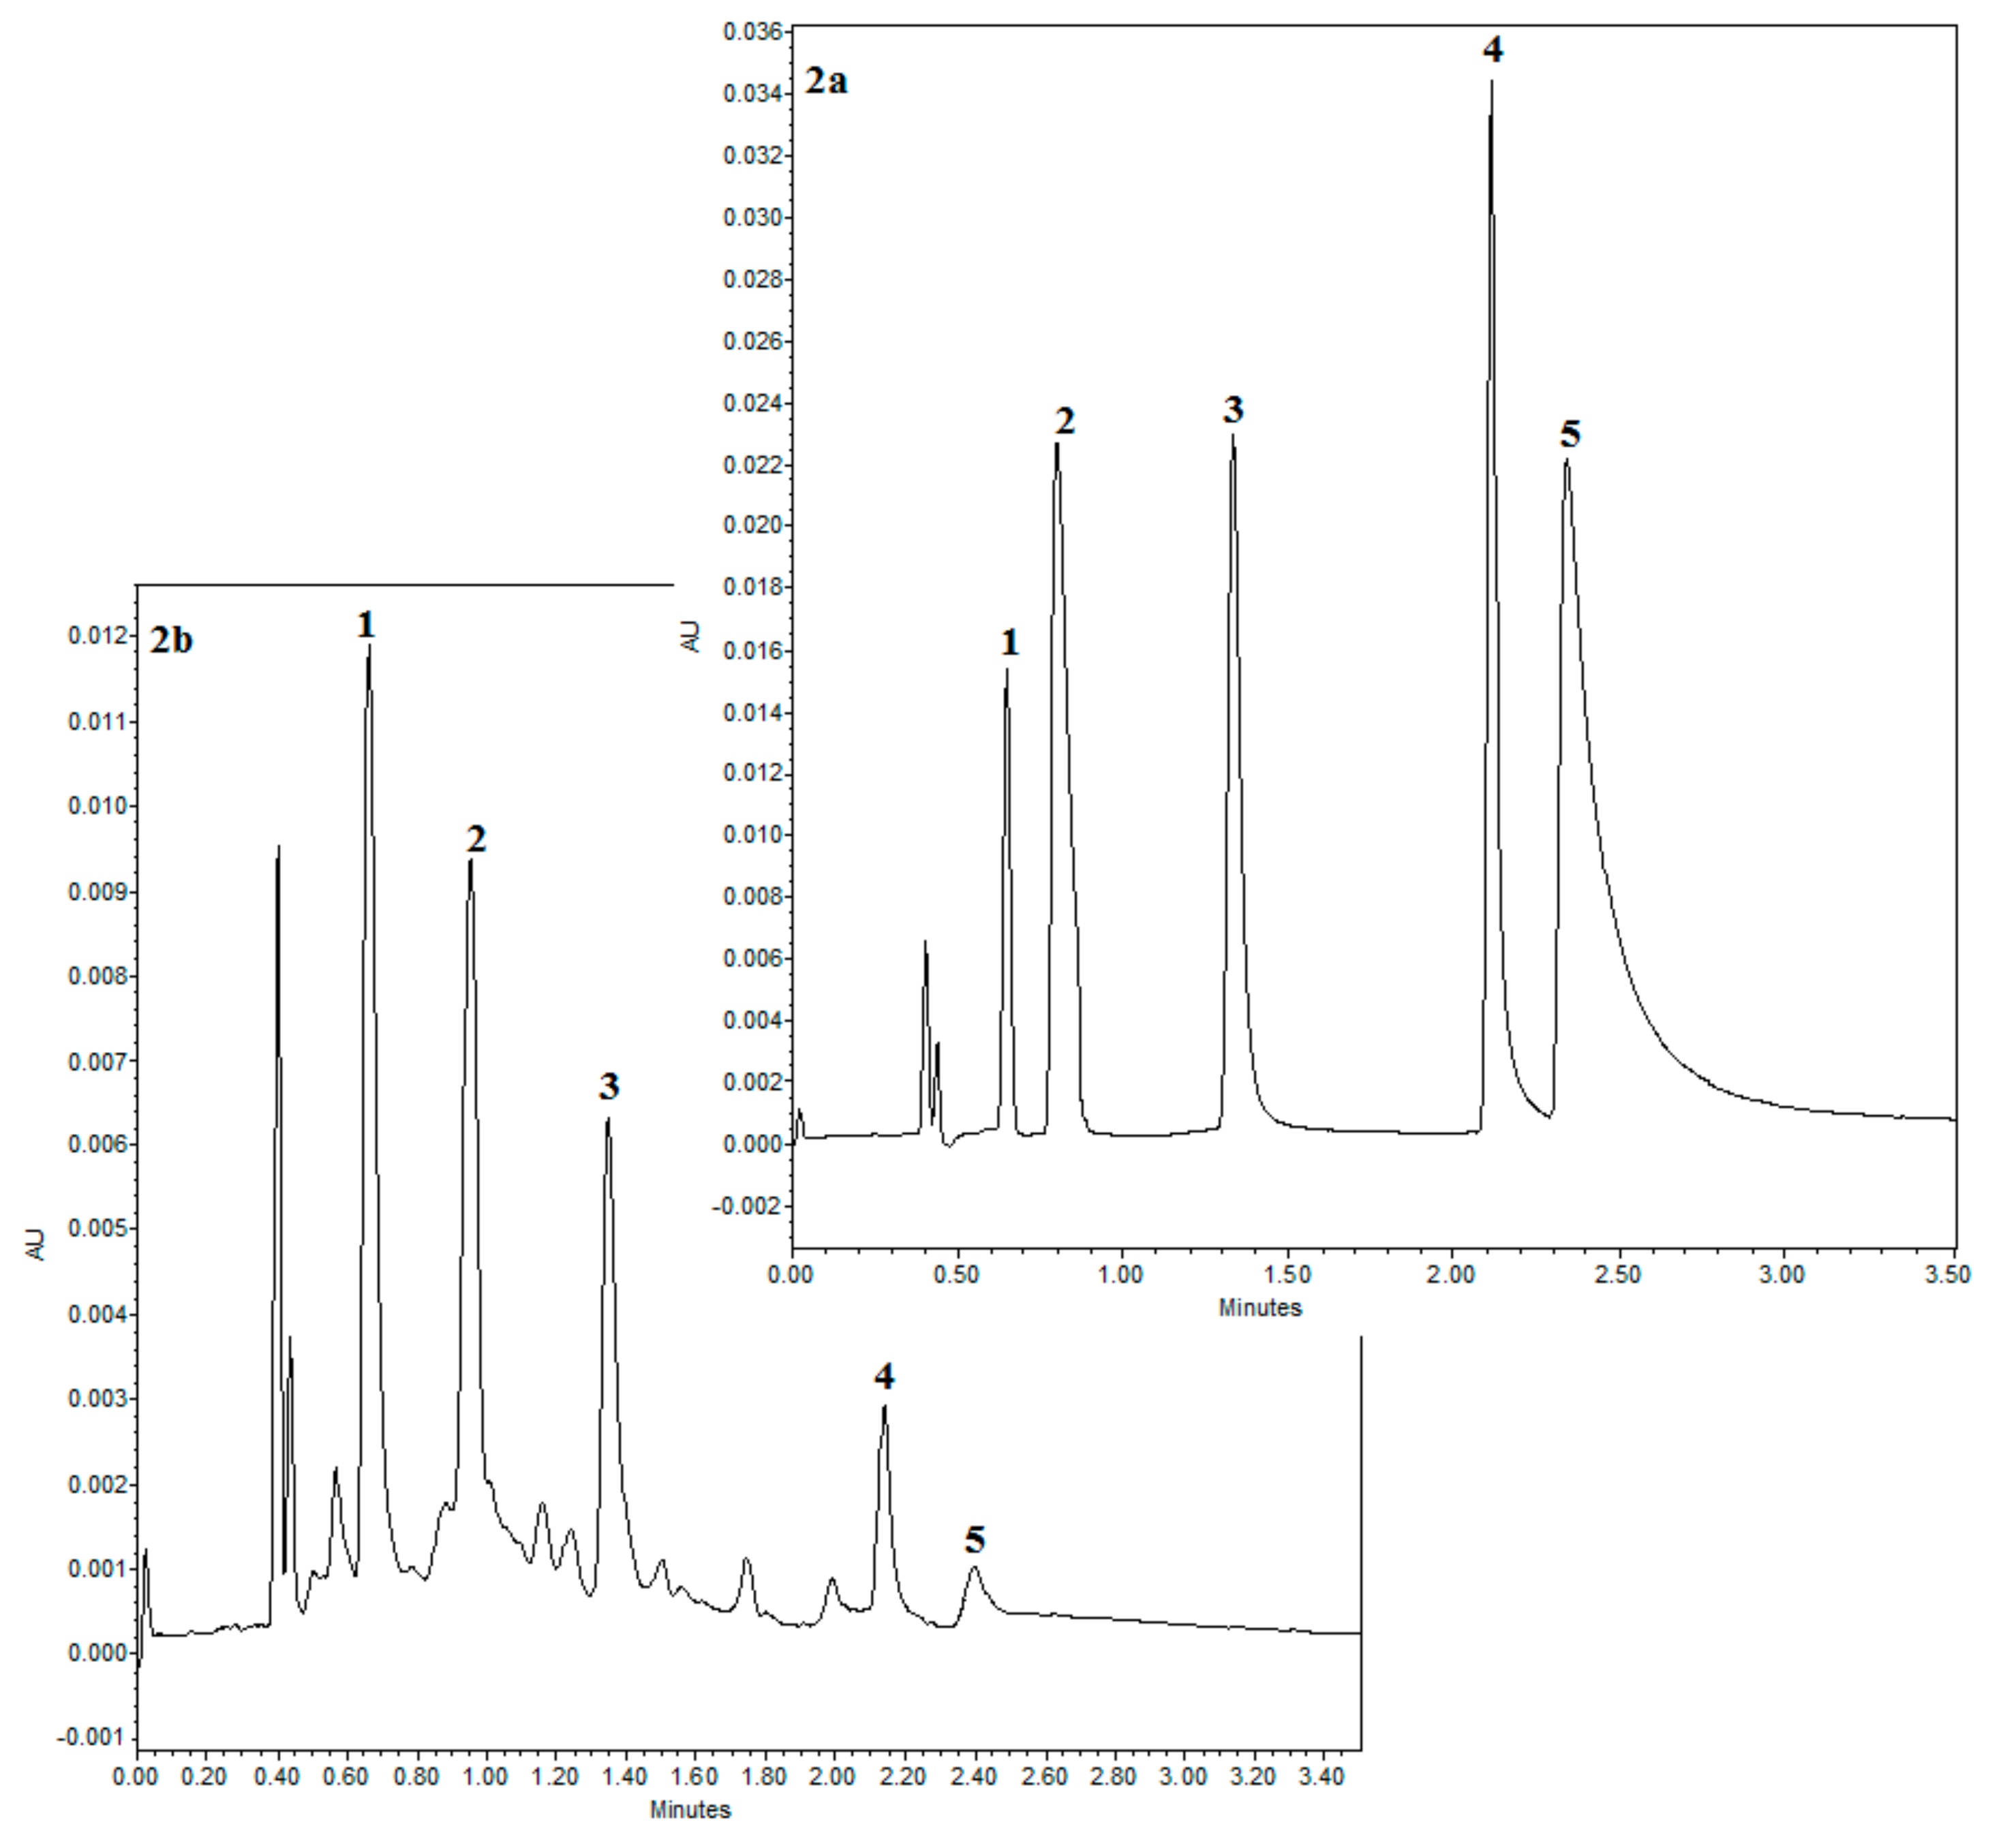
3.2. Result of SFC Analysis
4. Conclusions
Author Contributions
Acknowledgments
Conflicts of Interest
Abbreviations
| ANOVA | analysis of variance |
| ASE | accelerated solvent extraction |
| BBD | Box-Behnken design |
| DM | dry mass/dry matter |
| F (kg/h−1) | solvent flow rate |
| GAE | gallic acid equivalent |
| LOF | lack of fit |
| m (g) | mass of the extract |
| M (kg) | mass of the feedstock |
| MAE | microwave solvent extraction |
| MSPD | matrix solid phase dispersion |
| P (MPa) | pressure |
| R2 | coefficient of determination |
| RU | rutin equivalent |
| RSM | response surface methodology |
| scCO2 | supercritical carbon dioxide |
| SE | Soxhlet extraction |
| SFC | supercritical fluid chromatography |
| SFE | supercritical fluid extraction |
| SF | supercritical fluid |
| SFE-scCO2 | supercritical fluid extraction - supercritical carbon dioxide |
| SPE | solid phase extraction |
| T (K) | temperature |
| TPC | total phenolics content |
| USAE | ultrasound assisted extraction |
References
- Rafińska, K.; Pomastowski, P.; Wrona, O.; Górecki, R.; Buszewski, B. Medicago sativa as a source of secondary metabolites for agriculture andpharmaceutical industry. Phytochem. Let. 2017, 20, 520–539. [Google Scholar] [CrossRef]
- Gatouillat, G.; Alabdul, M.A.; Bertinc, E.; Okiemy-Akeliad, M.G.; Morjaniae, H.; Lavaudf, K.; Madoulet, K. Cytotoxicity and apoptosis induced by alfalfa (Medicago sativa) leaf extracts in sensitive and multidrug-resistant tumor cells. Nutr. Cancer 2014, 66, 483–491. [Google Scholar] [CrossRef] [PubMed]
- Goławska, S.; Kapusta, I.; Janda, B.; Leszczyński, B. Bioactive Plant Compounds—Structural and Applicative Aspects. Session 2. In Analysis of Phytochemicals in Different Matrix; Acta Biochimica Polonica: Warsaw, Poland, 2009. [Google Scholar]
- Stochmal, A.; Oleszek, W. Seasonal and structural changes of flavones in alfalfa (Medicago sativa) aerial parts. J. Food Agric. Environ. 2007, 5, 170–174. [Google Scholar]
- Goławska, S.; Sprawka, I.; Łukasik, I. Effect of saponins and apigenin mixtures on feeding behavior of the pea aphid, Acyrthosiphonpisum Harris. Biochem. Syst. Ecol. 2014, 55, 137–144. [Google Scholar] [CrossRef]
- Jasiński, M.; Kachlicki, P.; Rodziewicz, P.; Figlerowicz, M.; Stobiecki, M. Changes in the profile of flavonoid accumulation in Medicagotruncatula leaves during infection with fungal pathogen Phomamedicaginis. Plant Physiol. Biochem. 2009, 47, 847–853. [Google Scholar] [CrossRef]
- Oniuszuk, A.; Podgórski, R. Influence of different extraction methods on the quantification of selected flavonoids and phenolic acids from Tiliacordata inflorescence. Ind. Crop. Prod. 2015, 76, 509–514. [Google Scholar] [CrossRef]
- Wrona, O.; Rafińska, K.; Możeński, C.; Buszewski, B. Supercritical fluid extraction as a technique for isolation of biologically active compounds from plant material of industrial importance. Przem. Chem. 2018, 97, 1246–1252. [Google Scholar]
- Fu, B.; Ji, X.; Zhao, M.; He, F.; Wang, X.; Wang, Y.; Liu, P.; Niu, L. The influence of light quality on the accumulation of flavonoids in tobacco (Nicotianatabacum L.) leaves. J. Photochem. Photobiol. B Biol. 2016, 162, 544–549. [Google Scholar] [CrossRef]
- Biesaga, M. Influence of extraction methods on stability of flavonoids. J. Chromatogr. A 2011, 1218, 2505–2512. [Google Scholar] [CrossRef]
- Herrera-Ruiz, M.; Ramos, R.R.; Zamil, A.; Tortorielloa, J.; Jiménez-Ferrer, J.E. Flavonoids from Tiliaamericana with anxiolytic activity in plus-maze test. J. Ethnopharmacol. 2008, 118, 312–317. [Google Scholar] [CrossRef]
- Noguerón-Merino, M.C.; Jiménez-Ferrer, E.; Román-Ramos, R.; Zamilpa, A.; Tortoriello, J.; Herrera-Ruiz, M. Interactions of a standardized flavonoids fraction from Tiliaamericana with Serotoninergic drugs in elevated plus maze. J. Ethnopharmacol. 2015, 164, 319–327. [Google Scholar] [CrossRef] [PubMed]
- Kim, K.H.; Moon, E.; Kim, S.Y.; Choi, S.U.; Lee, K.R. Lignan constituents of Tiliaamurensis and their biological evaluation on antitumor and anti-inflammatory activities. Food Chem. Toxicol. 2012, 50, 3680–3686. [Google Scholar] [CrossRef] [PubMed]
- Oniszczuk, A.; Podgórski, R.; Oniszczuk, T.; Zukiewicz-Sobczak, W.; Nowak, R.; Waksmundzka-Hajnos, M. Extraction methods for the determination of phenolic compounds from Equisetum arvense L. herb. Ind. Crop. Prod. 2014, 61, 377–381. [Google Scholar] [CrossRef]
- Yedhu Krishnan, R.; Neelesh Chandran, M.; Vellingiri, V.; Rajan, K.S. Insights on the influence of microwave irradiation on the extraction of flavonoids from Terminalia chebula. Sep. Purif. Technol. 2016, 170, 224–233. [Google Scholar] [CrossRef]
- Kryževičiūtė, N.; Kraujalis, P.; Venskutonis, P.R. Optimization of high pressure extraction processes for the separation of raspberry pomace into lipophilic and hydrophilic fractions. J. Supercrit. Fluids 2016, 108, 61–68. [Google Scholar] [CrossRef]
- Wrona, O.; Rafińska, K.; Możeński, C.; Buszewski, B. Supercritical fluid extraction of bioactive compounds from plant materials. J. AOAC Int. 2017, 100, 1624–1635. [Google Scholar] [CrossRef]
- Mukhopadhyay, M. Natural Extract Using Supercritical Carbon Dioxide; Department of Chemical Engineering, Indian Institute of Technology, Bombay: Powai, Mubai, India; CRC Press: Boca Raton, FL, USA, 2000. [Google Scholar]
- Baldino, L.; Reverchon, E. Challenges in the production of pharmaceutical and food related compounds by SC-CO2 processing of vegetable matter. J. Supercrit. Fluids 2018, 134, 269–273. [Google Scholar] [CrossRef]
- Reverchon, E.; De Marco, I. Supercritical fluid extraction and fractionation of natural matter. J. Supercrit. Fluids 2006, 38, 146–166. [Google Scholar] [CrossRef]
- Maran, J.P.; Manikandan, S.; Priya, B.; Gurumoorthi, P. Box-Behnken design based multi-response analysis and optimization of supercritical carbon dioxide extraction of bioactive flavonoid compounds from tea (Camellia sinensis L.) leaves. J. Food Sci. Technol. 2015, 52, 92–104. [Google Scholar] [CrossRef]
- Martínez, J.; Rosa, P.T.V.; Meireles, M.A.A. Extraction of Clove and Vetiver Oils with Supercritical Carbon Dioxide: Modeling and Simulation. Open Chem. Eng. J. 2007, 1, 1–7. [Google Scholar] [CrossRef]
- Liu, J.; Ji, F.; Chen, F.; Guo, W.; Yang, M.; Huang, S.; Zhang, F.; Liu, Y. Determination of garlic phenolic compounds using supercritical fluid extraction coupled to supercritical fluid chromatography/tandem mass spectrometry. J. Pharm. Biomed. Anal. 2018, 159, 513–523. [Google Scholar] [CrossRef] [PubMed]
- Ghasemi, E.; Raofie, F.; Najafi, N.M. Application of response surface methodology and central composite design for the optimisation of supercritical fluid extraction of essential oils from Myrtuscommunis L. leaves. Food Chem. 2011, 126, 1449–1453. [Google Scholar] [CrossRef]
- Yang, Y.; Liang, Y.; Yang, J.; Ye, F.; Zhou, T.; Gongke, L. Advances of supercritical fluid chromatography in lipid profiling. J. Pharm. Anal. 2019, 9, 1–8. [Google Scholar] [CrossRef] [PubMed]
- Wrona, O.; Rafińska, K.; Możeński, C.; Buszewski, B. Supercritical carbon dioxide extraction of Solidago gigantean Ait.: Optimization at quarter-technical scale and scale up the process to half-technical plant. Ind. Crop. Prod. 2019, 130, 316–324. [Google Scholar] [CrossRef]
- Hadidi, M.; Ibarz, A.; Conde, J.; Pagan, J. Optimisation of steam blanching on enzymatic activity, color and protein degradation of alfalfa (Medicago sativa) to improve some quality characteristics of its edible protein. Food Chem. 2019, 276, 591–598. [Google Scholar] [CrossRef]
- Rafińska, K.; Pomastowski, P.; Rudnicka, J.; Krakowska, A.; Maruška, A.; Narkute, M.; Buszewski, B. Effect of solvent and extraction technique on composition and biological activity of Lepidium sativum extracts. Food Chem. 2019, 289, 16–25. [Google Scholar] [CrossRef]
- Wang, L.; Yang, B.; Du, X.; Yi, C. Optimisation of supercritical fluid extraction of flavonoids from Pueraria lobata. Food Chem. 2008, 108, 737–741. [Google Scholar] [CrossRef]
- West, C.; Leselier, E. A unified classification of stationary phases for packed column supercritical fluid chromatography. J. Chromatogr. A 2008, 1191, 21–39. [Google Scholar] [CrossRef]
- Žuvela, P.; Skoczylas, M.; Jay Liu, J.; Bączek, T.; Kaliszan, R.; Wong, M.W.; Buszewski, B. Column characterization and selection systems in reversed-phase high-performance liquid chromatography. Crit. Rev. 2019, 119, 3674–3729. [Google Scholar] [CrossRef]


| Box-Behnken Design | Results | |||||
|---|---|---|---|---|---|---|
| T, K | P, MPa | F, kg h−1 | Y, % DM | TPC, mg GAE/g DM | TFC, mg RU/g DM | |
| E1 | 333.15 (0) | 80.00 (1) | 7.00 (1) | 4.53 | 6.32 | 13.16 |
| E2 | 353.15 (1) | 80.00 (1) | 5.00 (0) | 5.76 | 11.86 | 11.42 |
| E3 | 353.15 (1) | 20.00 (−1) | 5.00 (0) | 3.47 | 5.38 | 0.00 |
| E4 | 313.15 (−1) | 50.00 (0) | 3.00 (−1) | 1.27 | 26.19 | 2.11 |
| E5 | 333.15 (0) | 50.00 (0) | 5.00 (0) | 4.19 | 9.65 | 8.96 |
| E6 | 353.15 (1) | 50.00 (0) | 3.00 (−1) | 4.58 | 17.00 | 7.13 |
| E7 | 333.15 (0) | 50.00 (0) | 5.00 (0) | 3.50 | 11.58 | 8.37 |
| E8 | 333.15 (0) | 50.00 (0) | 5.00 (0) | 3.67 | 14.42 | 11.19 |
| E9 | 313.15 (−1) | 80.00 (1) | 5.00 (0) | 2.03 | 18.97 | 0.32 |
| E10 | 333.15 (0) | 20.00 (−1) | 3.00 (−1) | 3.39 | 7.83 | 0.36 |
| E11 | 313.15 (−1) | 20.00 (−1) | 5.00 (0) | 1.47 | 19.01 | 8.96 |
| E12 | 313.15 (−1) | 50.00 (0) | 7.00 (1) | 2.72 | 17.59 | 12.15 |
| E13 | 333.15 (0) | 80.00 (1) | 3.00 (−1) | 1.89 | 28.08 | 3.41 |
| E14 | 333.15 (0) | 20.00 (−1) | 7.00 (1) | 3.31 | 9.01 | 0.36 |
| E15 | 353.15 (1) | 50.00 (0) | 7.00 (1) | 6.72 | 7.87 | 10.86 |
| T, K | TPC, mg GAE/mL | TFC, mg RU/mL | ΣTPC + TFC, mg/mL |
|---|---|---|---|
| 313.15 | 8.51 | 8.49 | 17.00 |
| 333.15 | 10.98 | 10.34 | 21.32 |
| 353.15 | 28.16 | 3.26 | 31.42 |
| Output Variables | Regression Equations (Significant Model Terms Are Colored) | Coefficient of Determination, R2 | Model F-Value | Lack of Fit F-Value, LOF | p Value of the Model | |
|---|---|---|---|---|---|---|
| Y, % DM | coded | Y = 3.7744 + 1.6305A + 0.3180 B + 0.7674 C + 0.4325 AB + 0.1725 AC + 0.68 BC − 0.0308 A2 − 0.5733 B2 + 0.0647 C2 | 0.94 | 8.87 | 4.31 | 0.0135 |
| uncoded | Y = −13.5295 + 0.0753 T − 0.2224 P − 1.7857 F + 0.00072 TP + 0.0043 TS + 0.0113 PF–0.000077 T2 − 0.0006 P2 + 0.017 F2 | |||||
| TPC, mg GAE/g DM | coded | TPC = 11.8833 − 4.9563 A + 3 B − 4.7887 C + 1.63 AB − 0.1325 AC − 5.735 BC + 3.1371 A2 − 1.2154 B2 + 2.1421 C2 | 0.96 | 12.78 | 0.98 | 0.0059 |
| uncoded | TPC = 997.7188 − 5.5927 T − 0.1921 P − 1.8669 F + 0.0027 TP − 0.0033 TS − 0.09558 PF + 0.0078 T2 − 0.00135 P2 + 0.5355 F2 | |||||
| TFC, mg RU/g DM | coded | TFC = 9.51 + 0.7337 A + 2.33 B + 2.94 C + 5.02 AB–1.58 AC + 2.44 BC–0.2958 A2–4.04 B2–1.15 C2 | 0.92 | 6.20 | 3.57 | 0.0293 |
| uncoded | TFC = −30.68185+0.308521 T–2.46040P + 15.44277F + 0.008358 TP − 0.039437 TF + 0.040625 PF–0.0000740T2 − 0.004484 P2 − 0.287083F2 |
| Response Surface Methodology–Graphical Results | |||
|---|---|---|---|
| Response Surface Plot as a Function of: Pressure (P) and Temperature (T) | Response Surface Plot as a Function of: Solvent Flow Rate (F) and Temperature (T) | Response Surface Plot as a Function of: Pressure (P) and Solvent Flow Rate (F) | |
| Y, % DM | 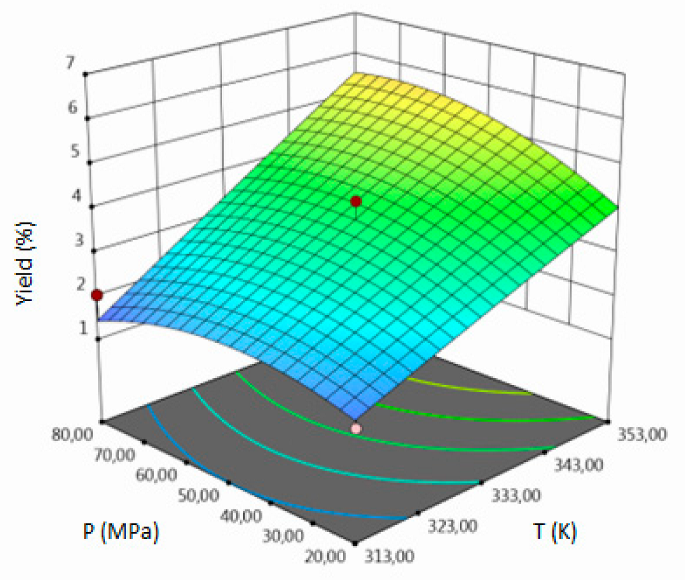 | 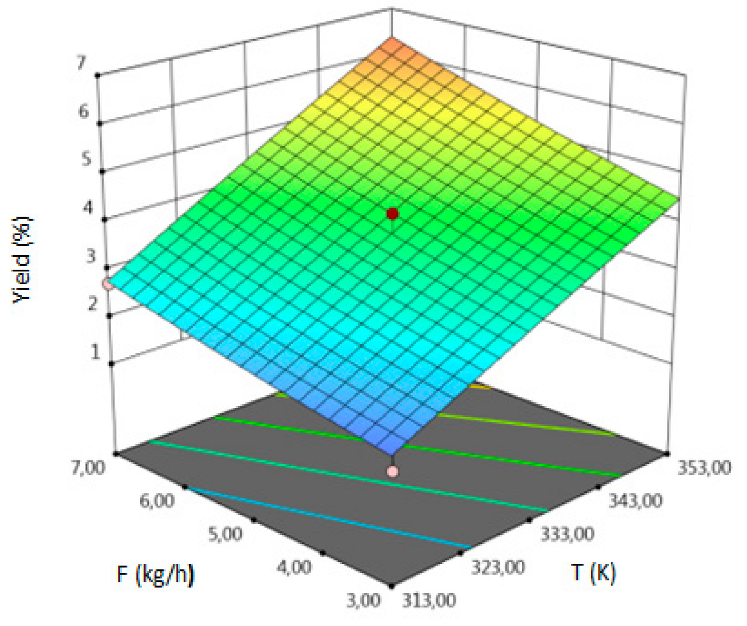 | 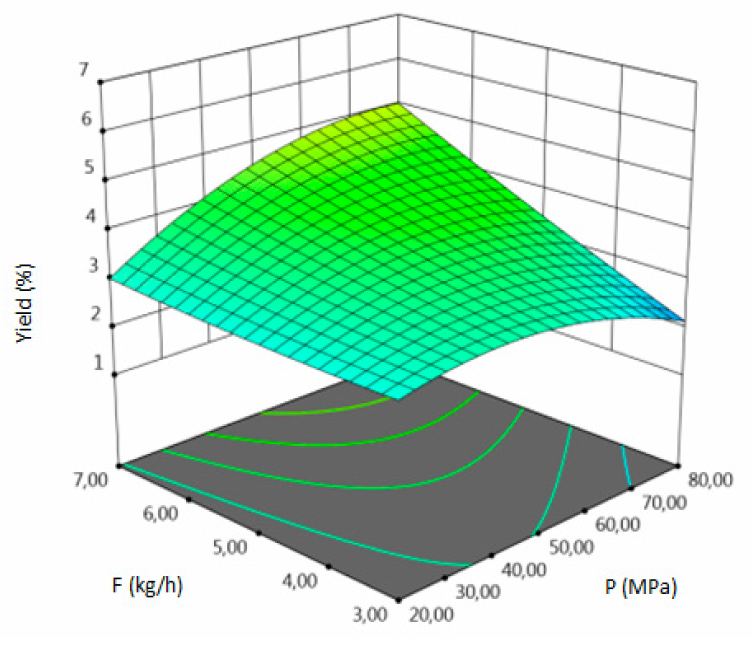 |
| TPC, mg GAE/g DM | 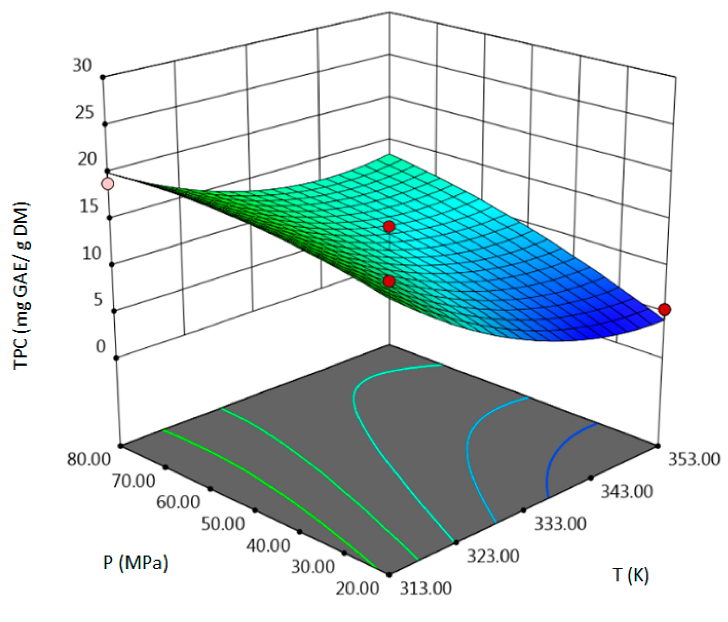 | 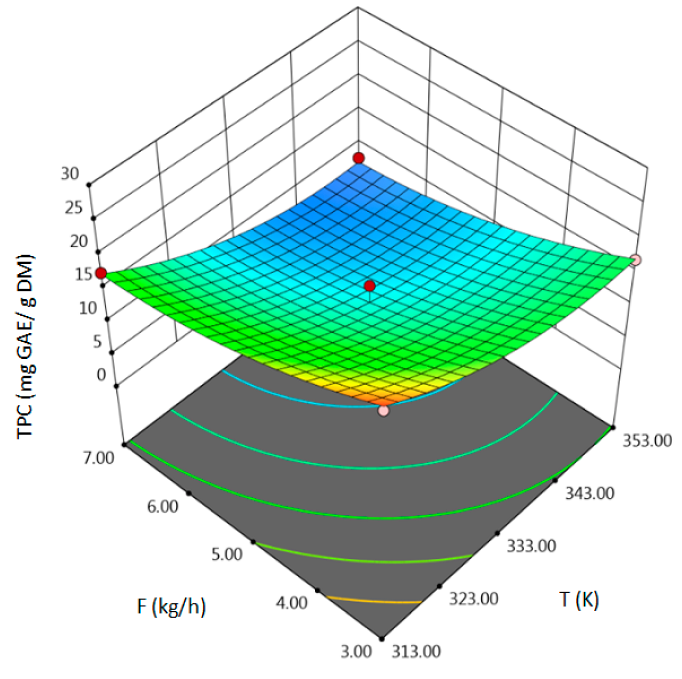 | 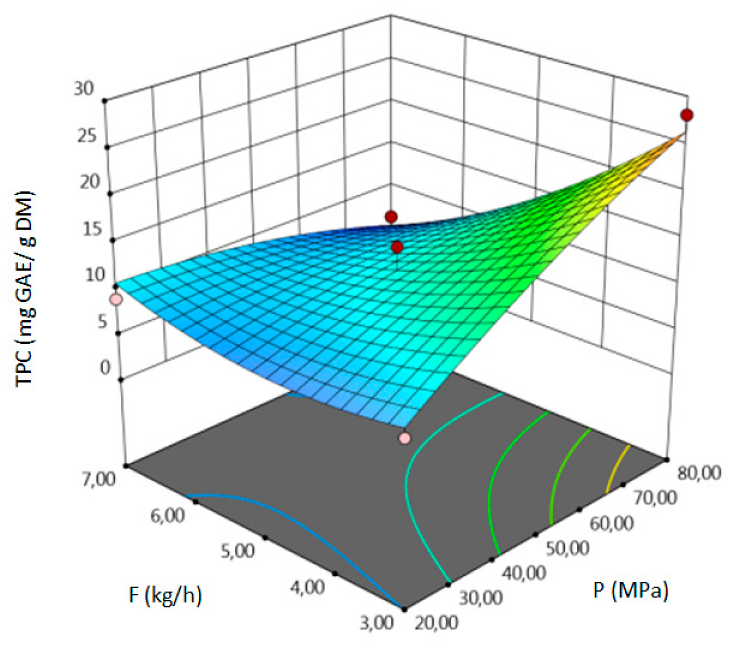 |
| TFC, mg RU/g DM | 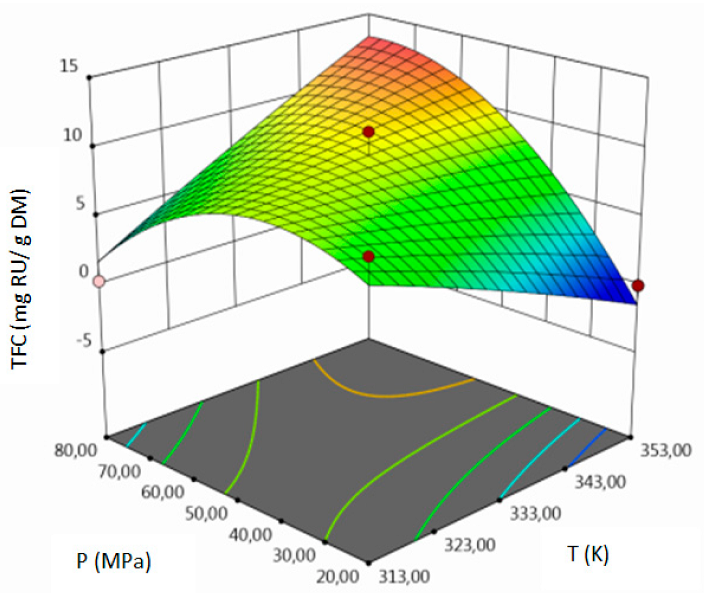 | 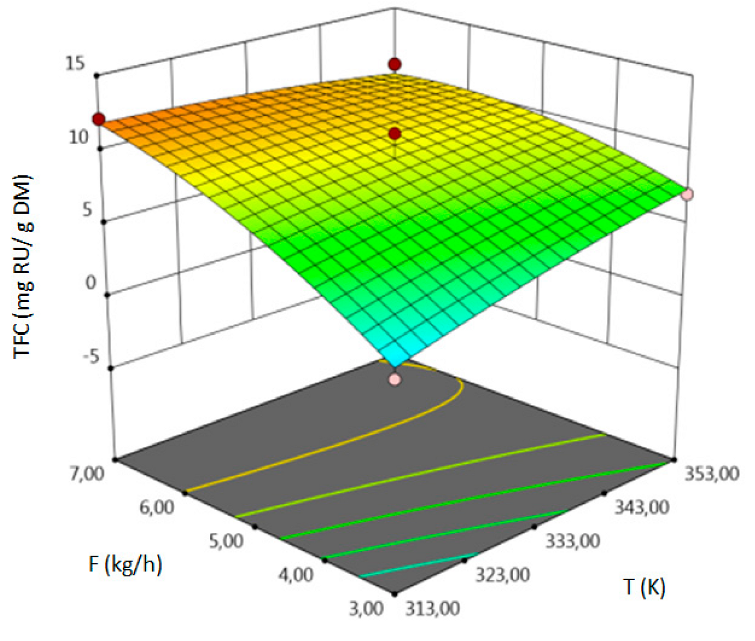 | 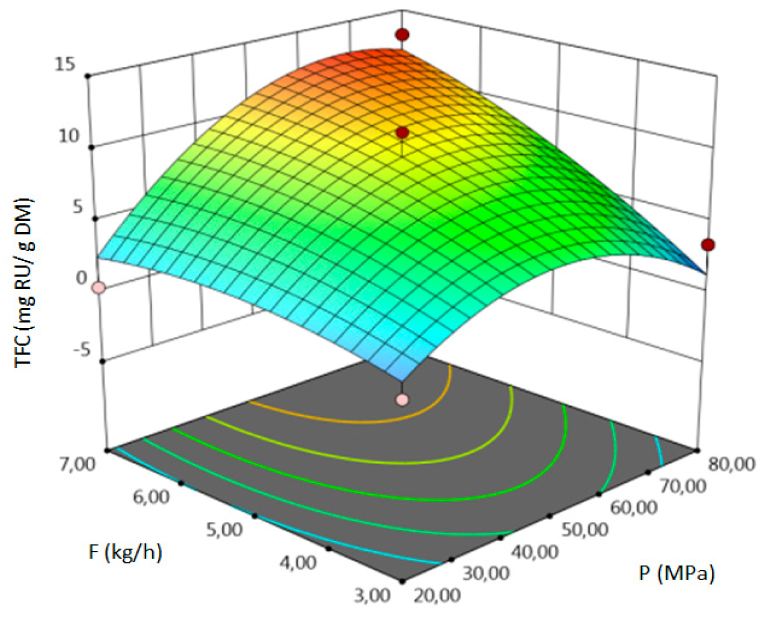 |
| Output Variables | Optimal Conditions | Predicted Value | Actual Value | Confidence Interval | |||
|---|---|---|---|---|---|---|---|
| T, K (°C) | P, MPa | F, kg h−1 | |||||
| Desirability-1.0 | −95% | 95% | |||||
| Yield, % DM | 352.99 (79.80) | 78.55 | 6.83 | 7.08 | 7.39 | 6.72 | 7.42 |
| TPC, mg GAE/g DM | 353.15 (80) | 71.74 | 3.32 | 21.92 | 20.20 | 20.82 | 23.02 |
| TFC, mg RU/g DM | 351.51 (78.40) | 78.29 | 6.72 | 15.32 | 14.89 | 14.55 | 16.09 |
| Analytes | Range [mg/mL] | Regression Curve | r2 | LOD [µg/g] | LOQ [µg/g] |
|---|---|---|---|---|---|
| Flavon | 0.001–1 | y = 1334023x − 3680 | 0.9998 | 1 | 3.3 |
| Salicylic acid | 0.05–1 | y = 32304x − 1279 | 0.9992 | 20 | 66 |
| Ferulic acid | 0.02–1 | y = 308257x + 1274 | 0.9990 | 10 | 33 |
| Naringenin | 0.02–1 | y = 181025x − 4073 | 0.9990 | 10 | 33 |
| Apigenin | 0.02–1 | y = 505689x − 5334 | 0.9985 | 10 | 33 |
| Samples | Flavonoids Content μg/g DM (n = 3) | Phenolic Acids Content μg/g DM (n = 3) | |||
|---|---|---|---|---|---|
| Flavon | Naringenin | Apigenin | Salicylic Acid | Ferulic Acid | |
| Yield | 1.64 | 35.9 | 12.3 | 49.5 | 1.2 |
| TPC | 16.9 | 37.8 | 15.0 | 53.4 | 4.9 |
| TFC | 22.0 | 41.4 | 17.9 | 49.9 | 4.2 |
© 2019 by the authors. Licensee MDPI, Basel, Switzerland. This article is an open access article distributed under the terms and conditions of the Creative Commons Attribution (CC BY) license (http://creativecommons.org/licenses/by/4.0/).
Share and Cite
Wrona, O.; Rafińska, K.; Walczak-Skierska, J.; Możeński, C.; Buszewski, B. Extraction and Determination of Polar Bioactive Compounds from Alfalfa (Medicago sativa L.) Using Supercritical Techniques. Molecules 2019, 24, 4608. https://doi.org/10.3390/molecules24244608
Wrona O, Rafińska K, Walczak-Skierska J, Możeński C, Buszewski B. Extraction and Determination of Polar Bioactive Compounds from Alfalfa (Medicago sativa L.) Using Supercritical Techniques. Molecules. 2019; 24(24):4608. https://doi.org/10.3390/molecules24244608
Chicago/Turabian StyleWrona, Olga, Katarzyna Rafińska, Justyna Walczak-Skierska, Cezary Możeński, and Bogusław Buszewski. 2019. "Extraction and Determination of Polar Bioactive Compounds from Alfalfa (Medicago sativa L.) Using Supercritical Techniques" Molecules 24, no. 24: 4608. https://doi.org/10.3390/molecules24244608
APA StyleWrona, O., Rafińska, K., Walczak-Skierska, J., Możeński, C., & Buszewski, B. (2019). Extraction and Determination of Polar Bioactive Compounds from Alfalfa (Medicago sativa L.) Using Supercritical Techniques. Molecules, 24(24), 4608. https://doi.org/10.3390/molecules24244608