Article

Rapid Determination of the Oil and Moisture Contents in Camellia gauchowensis Chang and Camellia semiserrata Chi Seeds Kernels by Near-infrared Reflectance Spectroscopy

1
Guangdong Provincial Key Laboratory of Silviculture, Protection and Utilization, Guangdong Academy of Forestry, Guangzhou 510520, China
2
Institute of Bioresource and Bioenergy, Hunan Academy of Forestry, Changsha 410004, China
3
Department of Science and Technology, Gaozhou Institute of Forestry, Maoming 525200, China
4
Department of Science and Technology, Guangning Institute of Forestry, Zhaoqing 526300, China
5
Department of Science and Technology, Guangdong Province Forestry Science and Technology Extension Station, Guangzhou 510173, China
*
Author to whom correspondence should be addressed.
These authors contributed equally to this work.
Molecules 2018, 23(9), 2332; https://doi.org/10.3390/molecules23092332
Submission received: 20 July 2018 / Revised: 3 September 2018 / Accepted: 4 September 2018 / Published: 12 September 2018
(This article belongs to the Section Analytical Chemistry)

Abstract

:
A fast and effective determination method of different species of vegetable seeds oil is vital in the plant oil industry. The near-infrared reflectance spectroscopy (NIRS) method was developed in this study to analyze the oil and moisture contents of Camellia gauchowensis Chang and C. semiserrata Chi seeds kernels. Calibration and validation models were established using principal component analysis (PCA) and partial least squares (PLS) regression methods. In the prediction models of NIRS, the levels of accuracy obtained were sufficient for C. gauchowensis Chang and C. semiserrata Chi, the correlation coefficients of which for oil were 0.98 and 0.95, respectively, and those for moisture were 0.92 and 0.89, respectively. The near infrared spectrum of crush seeds kernels was more precise compared to intact kernels. Based on the calibration models of the two Camellia species, the NIRS predictive oil contents of C. gauchowensis Chang and C. semiserrata Chi seeds kernels were 48.71 ± 8.94% and 58.37 ± 7.39%, and the NIRS predictive moisture contents were 4.39 ± 1.08% and 3.49 ± 0.71%, respectively. The NIRS technique could determine successfully the oil and moisture contents of C. gauchowensis Chang and C. semiserrata Chi seeds kernels.

1. Instruction

Camellia, native to China, one of the most important sources of high-quality edible plant oil, has been consumed for more than 1000 years in southern China [1] and is widely distributed with more than 12 million acres in production [2]. Camellia gauchowensis H.T. Chang and Camellia semiserrata C.W. Chi [3], two common woody species of Camellia indigenous to China, are mainly cultivated in mountain area. As cooking oil that has high nutritional value for human health, the annual Camellia oil production exceeds 150 million kilograms [4,5]. It has 85–92% unsaturated fatty acids [5] including 75–85% oleic acid that plays important roles in reducing cholesterol and triglycerides in the blood [6,7], and a variety of other functional components such as vitamin E, phytosterols, squalene, and flavonoids [8].
For the proper utilization of Camellia oils in food and other industries, the quality characteristics of Camellia seeds, such as the contents of oil, moisture and protein, and the composition of fatty acids, should be evaluated quickly and reliably by analytical tools at harvest, and during marketing and processing. Conventional analysis for oil and moisture are time-consuming, laborious, and require the use of toxic chemicals and expensive equipment [9]. The development of fast and effective determination methods is necessary, especially when the application needs are considered.
In recent years, there is a growing interest in fast, reliable and environmentally friendly technologies in both food production and food research [10]. Near-infrared reflectance spectroscopy (NIRS) technology is a simple and non-destructive method that can measure the quality and compositional attributes of many substances [11,12]. NIRS has some important advantages, such as short analysis time, minimal sampling process, and non-destructiveness, with a performance comparable to chemistry analytical methods [13,14]. NIRS is a spectroscopy method that uses the near-infrared region (400–2500 nm) of the electromagnetic spectrum [15] that can quantify organic compounds by the absorption of near-infrared light with the chemical bonds. Reflectance signatures are collected from sample materials with known nutrient concentrations, and then mathematical models are developed to estimate nutrient constituents of materials with unknown levels [16]. Automatic data collection by NIRS allows the assessment of multiple traits in large sets of samples [14] with short duration and with minimal error [16].
Based on the resolution of the analytical and quality factors from food samples with correlation of electromagnetic absorption at aforementioned wavelength, NIRS is used routinely in sensory, physical and chemical analysis of food and agricultural products [17,18,19]. As reported, it has been widely used in different crops, such as sesame [20], maize [21], rice [22], soybean [23] and sunflower [24], to predict oil, moisture, protein, fatty acids, phenols or crude fiber. However, the ability of NIRS for prediction of Camellia oil and moisture content, especially C. gauchowensis Chang and C. semiserrata chi, has not been reported.
It is necessary to rapidly determine oil and moisture contents in Camellia seeds, which play a key role in national production, importation as well as in food processing and breeding programs. Since analyses based on NIRS do not require labor intensive sample pre-treatment and processing, samples are measured with simple grinding or as a whole. In this study, we established and calibrated the quantitative NIRS models by principal component analysis (PCA) and partial least squares (PLS) for C. gauchowensis Chang and C. semiserrata Chi seeds kernels to quickly determine oil and moisture contents.

2. Materials and Methods

2.1. Materials

Each of 110 samples (200 g per sample) of Camellia gauchowensis Chang and Camellia semiserrata Chi seeds was obtained from the seed resource bank of Guangdong Academy of Forestry (Guangzhou, China). To guarantee the reliability and applicability of the models, samples were selected from different regions in Guangdong province such as Gaozhou, Huizhou, Yangjiang, Lianping, and Zhaoqing to ensure a wide range of reference values. When Camellia ripened from green to dark brown with the full maturity of peel split and seeds exposed, the seeds were collected and naturally air-dried. The inner shells of seeds were peeled off by tool knocking and manual peeling to get the Camellia kernels. The intact Camellia kernels were selected and preserved in a ventilated and dry place at room temperature. The period from the beginning of seed collection to the end of measurement was six months.

2.2. Soxhlet Extraction and Oven Drying

Traditional chemical measurements for oil and moisture were Soxhlet extraction [7] and oven drying [25], respectively. All kernels were powdered by a laboratory grinder and screened by 40-mesh. In the oil determination, samples were weighed as W0 (g), and then extracted at 80 °C for 6 h by Soxhlet extractor with 180 mL petroleum ether. The residues were dried at 60 °C in a vacuum oven to the constant weight as W1 (g). The oil content was calculated as C1 = W1/W0 × 100%. In the moisture measurement, the samples were weighted as M0 (g), and then dried at 105 °C in vacuum oven over 24 h until the weight was constant as M1. The moisture content was expressed as C2 = M1/M0 × 100%.

2.3. Sample Pretreatment

The Camellia seeds kernels were openly placed in an air-conditioned thermostat room at 20 ± 2 °C for two weeks to keep their moisture content under 10%. The kernels were loaded into a small round plastic cup (75 mm diameter and 100 mm height). It was ensured that all tested samples were representative and filled the sample tray uniformly. One batch of specimen was directly used for spectroscopic analysis and one batch of comminution was used for spectral decomposition.

2.4. Spectra Measurements

2.4.1. Near Infrared Spectroscopy

A DA7200 NIRS analyzer (Perten Instruments AB, Huddinge, Sweden) equipped with simultaneous detection of two beams of halogen and mercury lamp was used for spectral measurement. Fixed holographic grating partial light and indium arsenic diode array detection technology with electric refrigeration constant temperature, full spectrum was simultaneously scanned. Spectral data were acquired in the 950–1650 nm range with 5 nm resolution at the collection data of 100 times per second. Simplicity software was integrated as a device manager.

2.4.2. Spectral Feature Data Acquisition

The NIRS instrument was turned on to preheat for 1 h. Before the spectrum collection, RE-SULT-Integration software was used to compile spectrum acquisition program. The working parameters of the instrument were set as the measuring wavelength range from 950 to 1650 nm at 30 subsequent scanning times. The sampling mode was transmittance and the data acquisition was absorbance.
After writing the collection program, the processed samples were placed on the spectrometer sample tray in turn to be scanned. The near infrared spectra of samples were collected by the cup light probe. To reduce the error caused by inhomogeneous loading, each tested sample was loaded in duplicate and scanned in triplicate for each loading to obtain the spectrum from different angles, and average data were taken. All spectral characteristics were collected and recorded.

2.4.3. Calibration and Validation Model Construction

The average spectra of each sample were collected for smoothing pretreatment by Unscrambler classifier chemometrics software package (CAMO, Trondheim, Norway). After correlating the reference analytical methods, the best calibration model was gained from several mathematical models. In this study, principal component analysis (PCA) [26] and partial least squares (PLS) [27] methods were finally used to construct calibration and validation models. The correlation coefficient of calibration (Rc), the standard error of calibration (SEC), standard error of prediction (SEP), offset, bias, slop, and the residual predictive value (RPD) were used to test the accuracy of the calibration models. Rc was gained from the calibration process that can be modeled linearly [7,28]. SEC and SEP were to evaluate the predictive ability of the calibration model [7,28,29]. Offset, bias, slop, and RPD were used to determine precision of the calibration [10,28]. The ratio of standard deviation (SD) and SEP was named RPD [30].

3. Results and Discussion

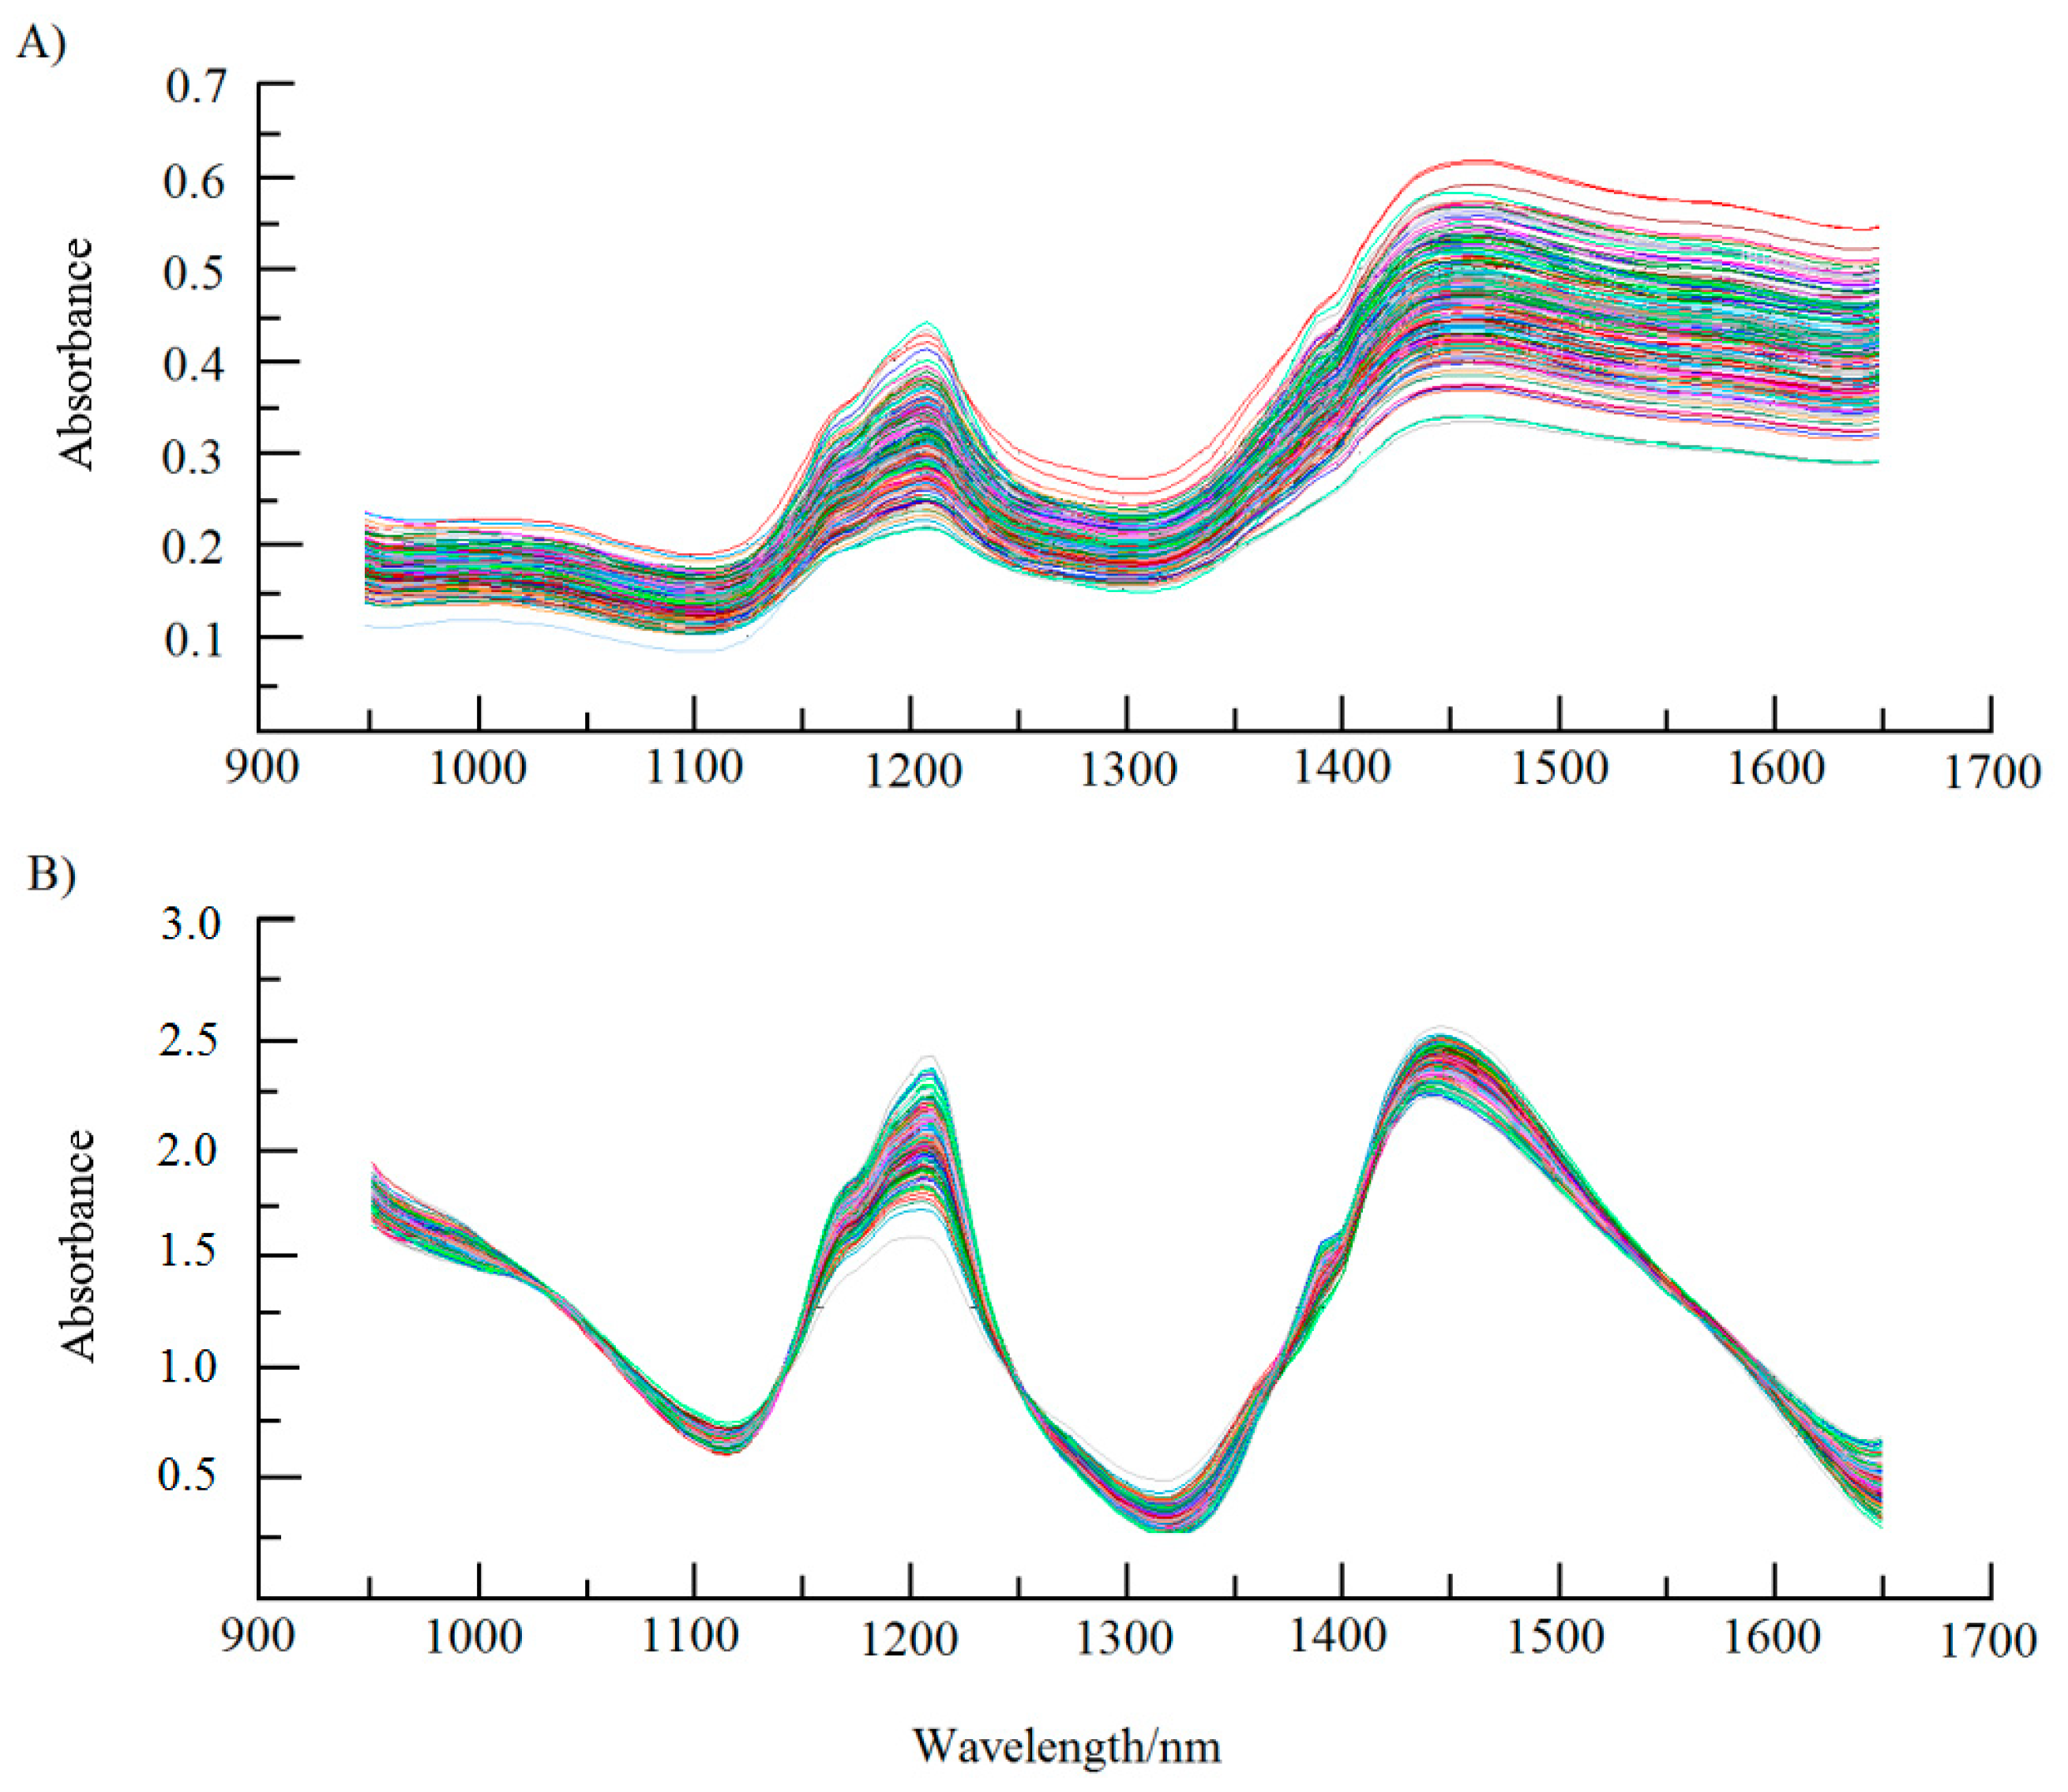
3.1. Comparison of Camellia Seeds Spectrograms between Non-Destruction and Comminution

NIRS is one kind of electromagnetic waves between visible and infrared light region, and its wavelength range is 400–2500 nm [15]. Different substances have different absorption and strength of electromagnetic waves [7]. The overall spectra of Camellia seeds kernels in different treatment showed strong absorption bands related with oil and water content. The absorption at around 1200 nm (C–H) is related with oil [26] and at 1450 nm (O–H) with moisture [31]. The raw NIR spectra of non-destruction and comminution of Camellia samples are shown in Figure 1. Compared with Figure 1A, the crushed kernels showed relatively wide range of absorbance over the entire NIR spectra in Figure 1B with a sharper upward and downward slopes in absorbance around 1200 and 1450 nm, respectively. The near-infrared reflectance spectrogram (NIRS) of Camellia seeds kernels could be used for the quantitative analysis and the selection of suitable sample types. In addition, the NIRS accuracy was higher when the Camellia seeds kernels were comminuted. As a result, crushed samples would be used for further analysis of oil and moisture content of Camellia gauchowensis Chang and C. semiserrata Chi seeds kernels, respectively.

3.2. NIRS Analysis of Camellia Seeds Kernels

The light absorption causes vibration and oscillation between atoms to make the change of light energy [30]. Therefore, the diverse spectrums in NIRS area indicated the differences in the moisture content, and the oil chemical composition and content for both Camellia gauchowensis Chang and C. semiserrata Chi seeds kernels.

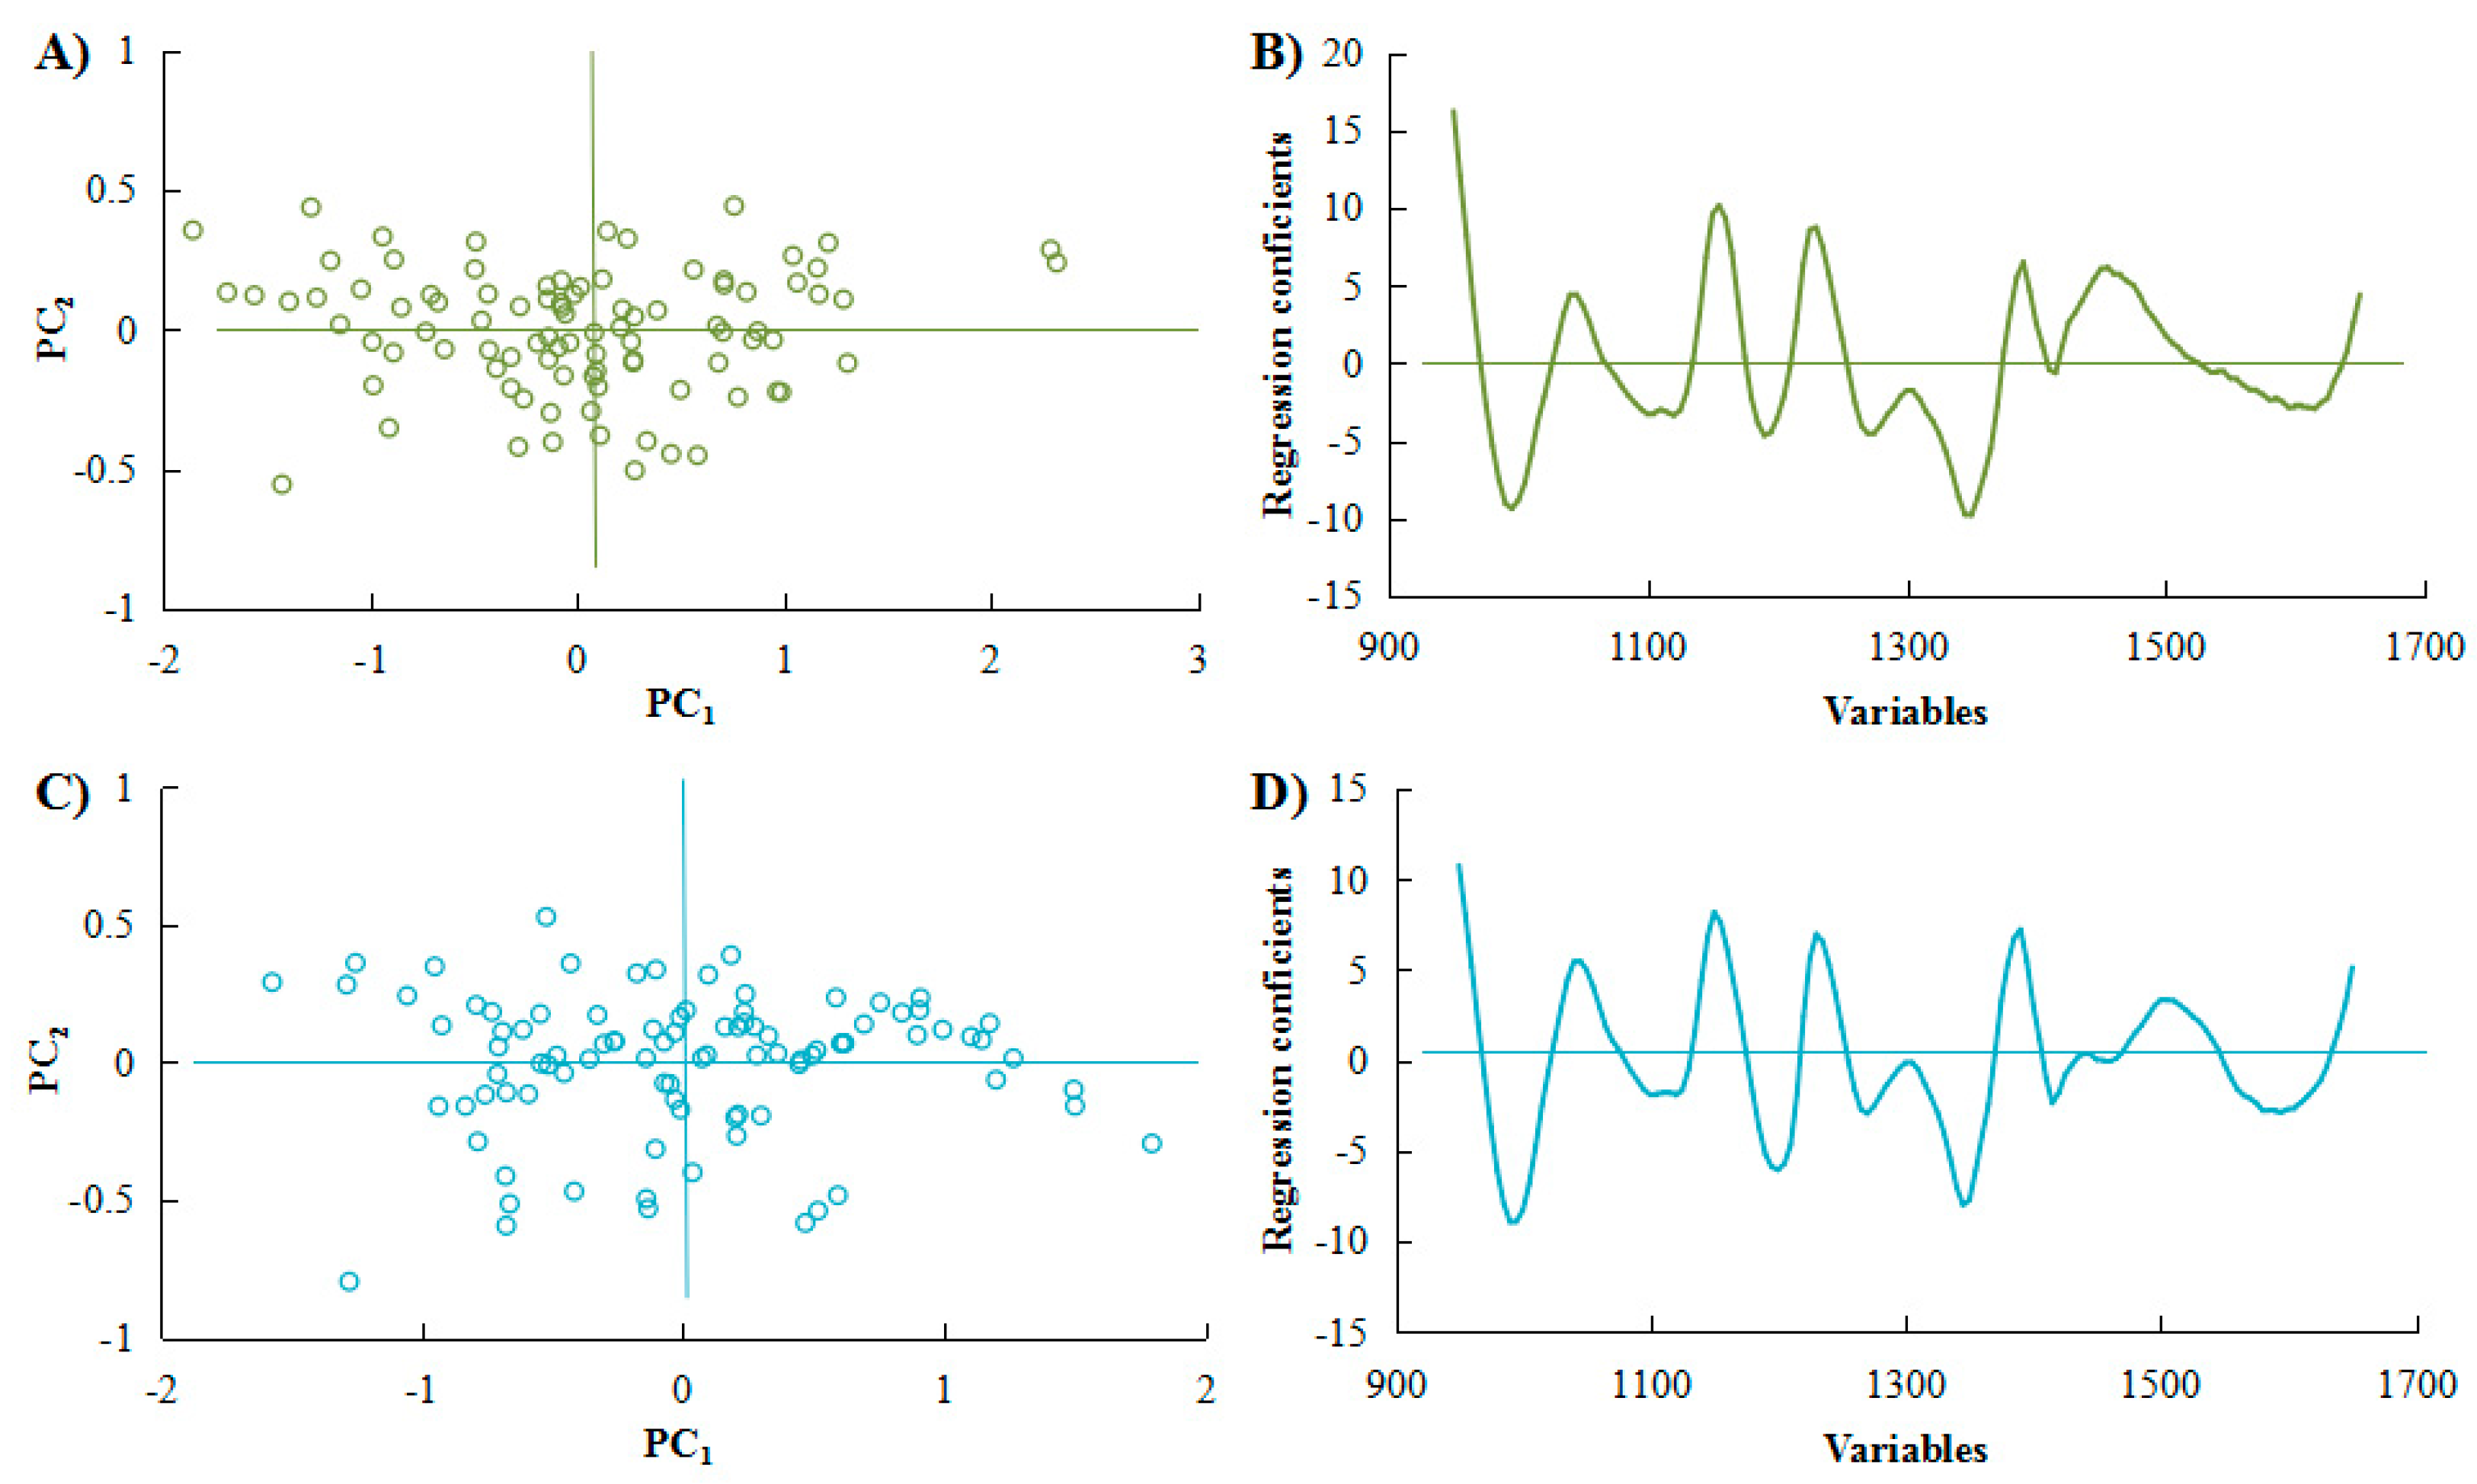
3.2.1. NIRS Analysis of Camellia Oil

The calibration models had good accuracy for the detection of C. gauchowensis Chang and C. semiserrata Chi kernels oil (Table 1 and Table 2). Some spectral variables, including irrelevant information and unreliable prediction, were removed by suitable algorithms [32] from all 110 samples by principal component analysis (PCA), in which the effective quantities of tested samples reached 106 for C. gauchowensis Chang and 104 for C. semiserrata Chi, respectively.
Table 1 exhibits the calibration statistics for oil content of C. gauchowensis Chang and C. semiserrata Chi kernels. For the 106 C. gauchowensis Chang samples, the maximal oil content was 68.43%, the minimum 23.85%, mean ± standard deviation (SD) 48.71 ± 8.94%, and coefficient of variation (CV) 0.18. For the 104 C. semiserrata Chi kernels, the maximum, minimum, mean ± SD, and CV of oil content were 71.08%, 31.71%, 58.37 ± 7.39%, and 0.13, respectively. The difference between Mean and Max (Min) was obvious, which meant the model could predict the validation set of samples well [7].
Different properties of samples have different spectrum. Therefore, Soxhlet method was used to treat the influence on the NIRS. In this study, the best spectrum pretreatment method was first derivation for the NIRS calibration model of oil content. The Rc, SEC, offset, bias, and slope were evaluated (Table 2). A good selected model should have high correlation coefficient of calibration (Rc) and low standard error of calibration (SEC) [33,34]. In our study, Rc values were high, 0.98 for C. gauchowensis Chang kernels oil and 0.95 for C. semiserrata Chi. Besides, SEC values were 1.57 for C. gauchowensis Chang kernels oil and 1.72 for C. semiserrata Chi, while SEP was 1.73 for C. gauchowensis Chang oil and 1.92 for C. semiserrata Chi. Results indicated that the SEC or SEP for Camellia oil in this study was relatively lower than sunflower (15.4–32.7 of SEP) [24] but higher than oilseed Brassica species (0.21–0.85 of SEC/SEP) [16], soybean (0.07–0.10 of SEP), and palm kernel (0.10–0.73 of SEP) [31]. The models’ accuracies for C. gauchowensis Chang and C. semiserrata Chi were both evaluated by offset (1.59 and 5.26, respectively), bias (1.99 × 10⁻⁶ and 1.26 × 10⁻⁶, respectively), and slope (0.97 and 0.91, respectively).
Typically, calibration models must be validated before application in practice [35]. Hence, the oil content by NIRS should be estimated with high correlation and good accuracy [36]. Partial least squares (PLS) regression was used to develop the quantitative model from cross-validation with different spectra pretreatments (data not shown). Table 1 shows the oil content of C. gauchowensis Chang and C. semiserrata Chi kernels in validation set. Besides the minimum and mean of Camellia semiserrata Chi, the data range of all calibration set covered the validation set. The maximal oil content of the 106 C. gauchowensis Chang samples in validation set was 56.82%, minimum 22.16%, mean ± SD 45.32 ± 7.57%, and CV 0.17. For the 104 C. semiserrata Chi kernels, the maximum, minimum, mean ± SD, and CV of oil content were 70.00%, 51.71%, 62.73 ± 4.38%, and 0.07, respectively.
The ratio of performance to deviation (PRD) indicates excellent validation accuracy when the value is more than 2.5; a value between 2.0 and 2.5 indicates approximate prediction is possible; and a value less than 1.5 indicates the prediction is poor [37]. In this study, RPD values were all above 2.5 (5.94 for C. gauchowensis Chang kernels oil and 4.92 for C. semiserrata Chi oil). The validation models of oil content for C. gauchowensis Chang and C. semiserrata Chi seeds kernels showed preferable accuracy.
Figure 2A,C shows that the sample scores were uniformly distribution by PCA. After the PCs from 0 to 20 were analyzed by residual validation variance, the regression coefficients were ideal when the PCs were both selected at 5 (Figure 2B,D). In Figure 3, the linear relationships were established between predicted and measured values. The regression equations were y = 0.9679x + 1.5805 (R2 = 0.96) for C. gauchowensis Chang and y = 0.9107x + 5.2561 (R2 = 0.91) for C. semiserrata Chi, which was similar to the accuracy of rapeseed (R2 = 0.91–0.96) [33].
Thereby, the models by NIRS of C. gauchowensis Chang and C. semiserrata Chi seeds kernels were practicable to predict the oil contents.

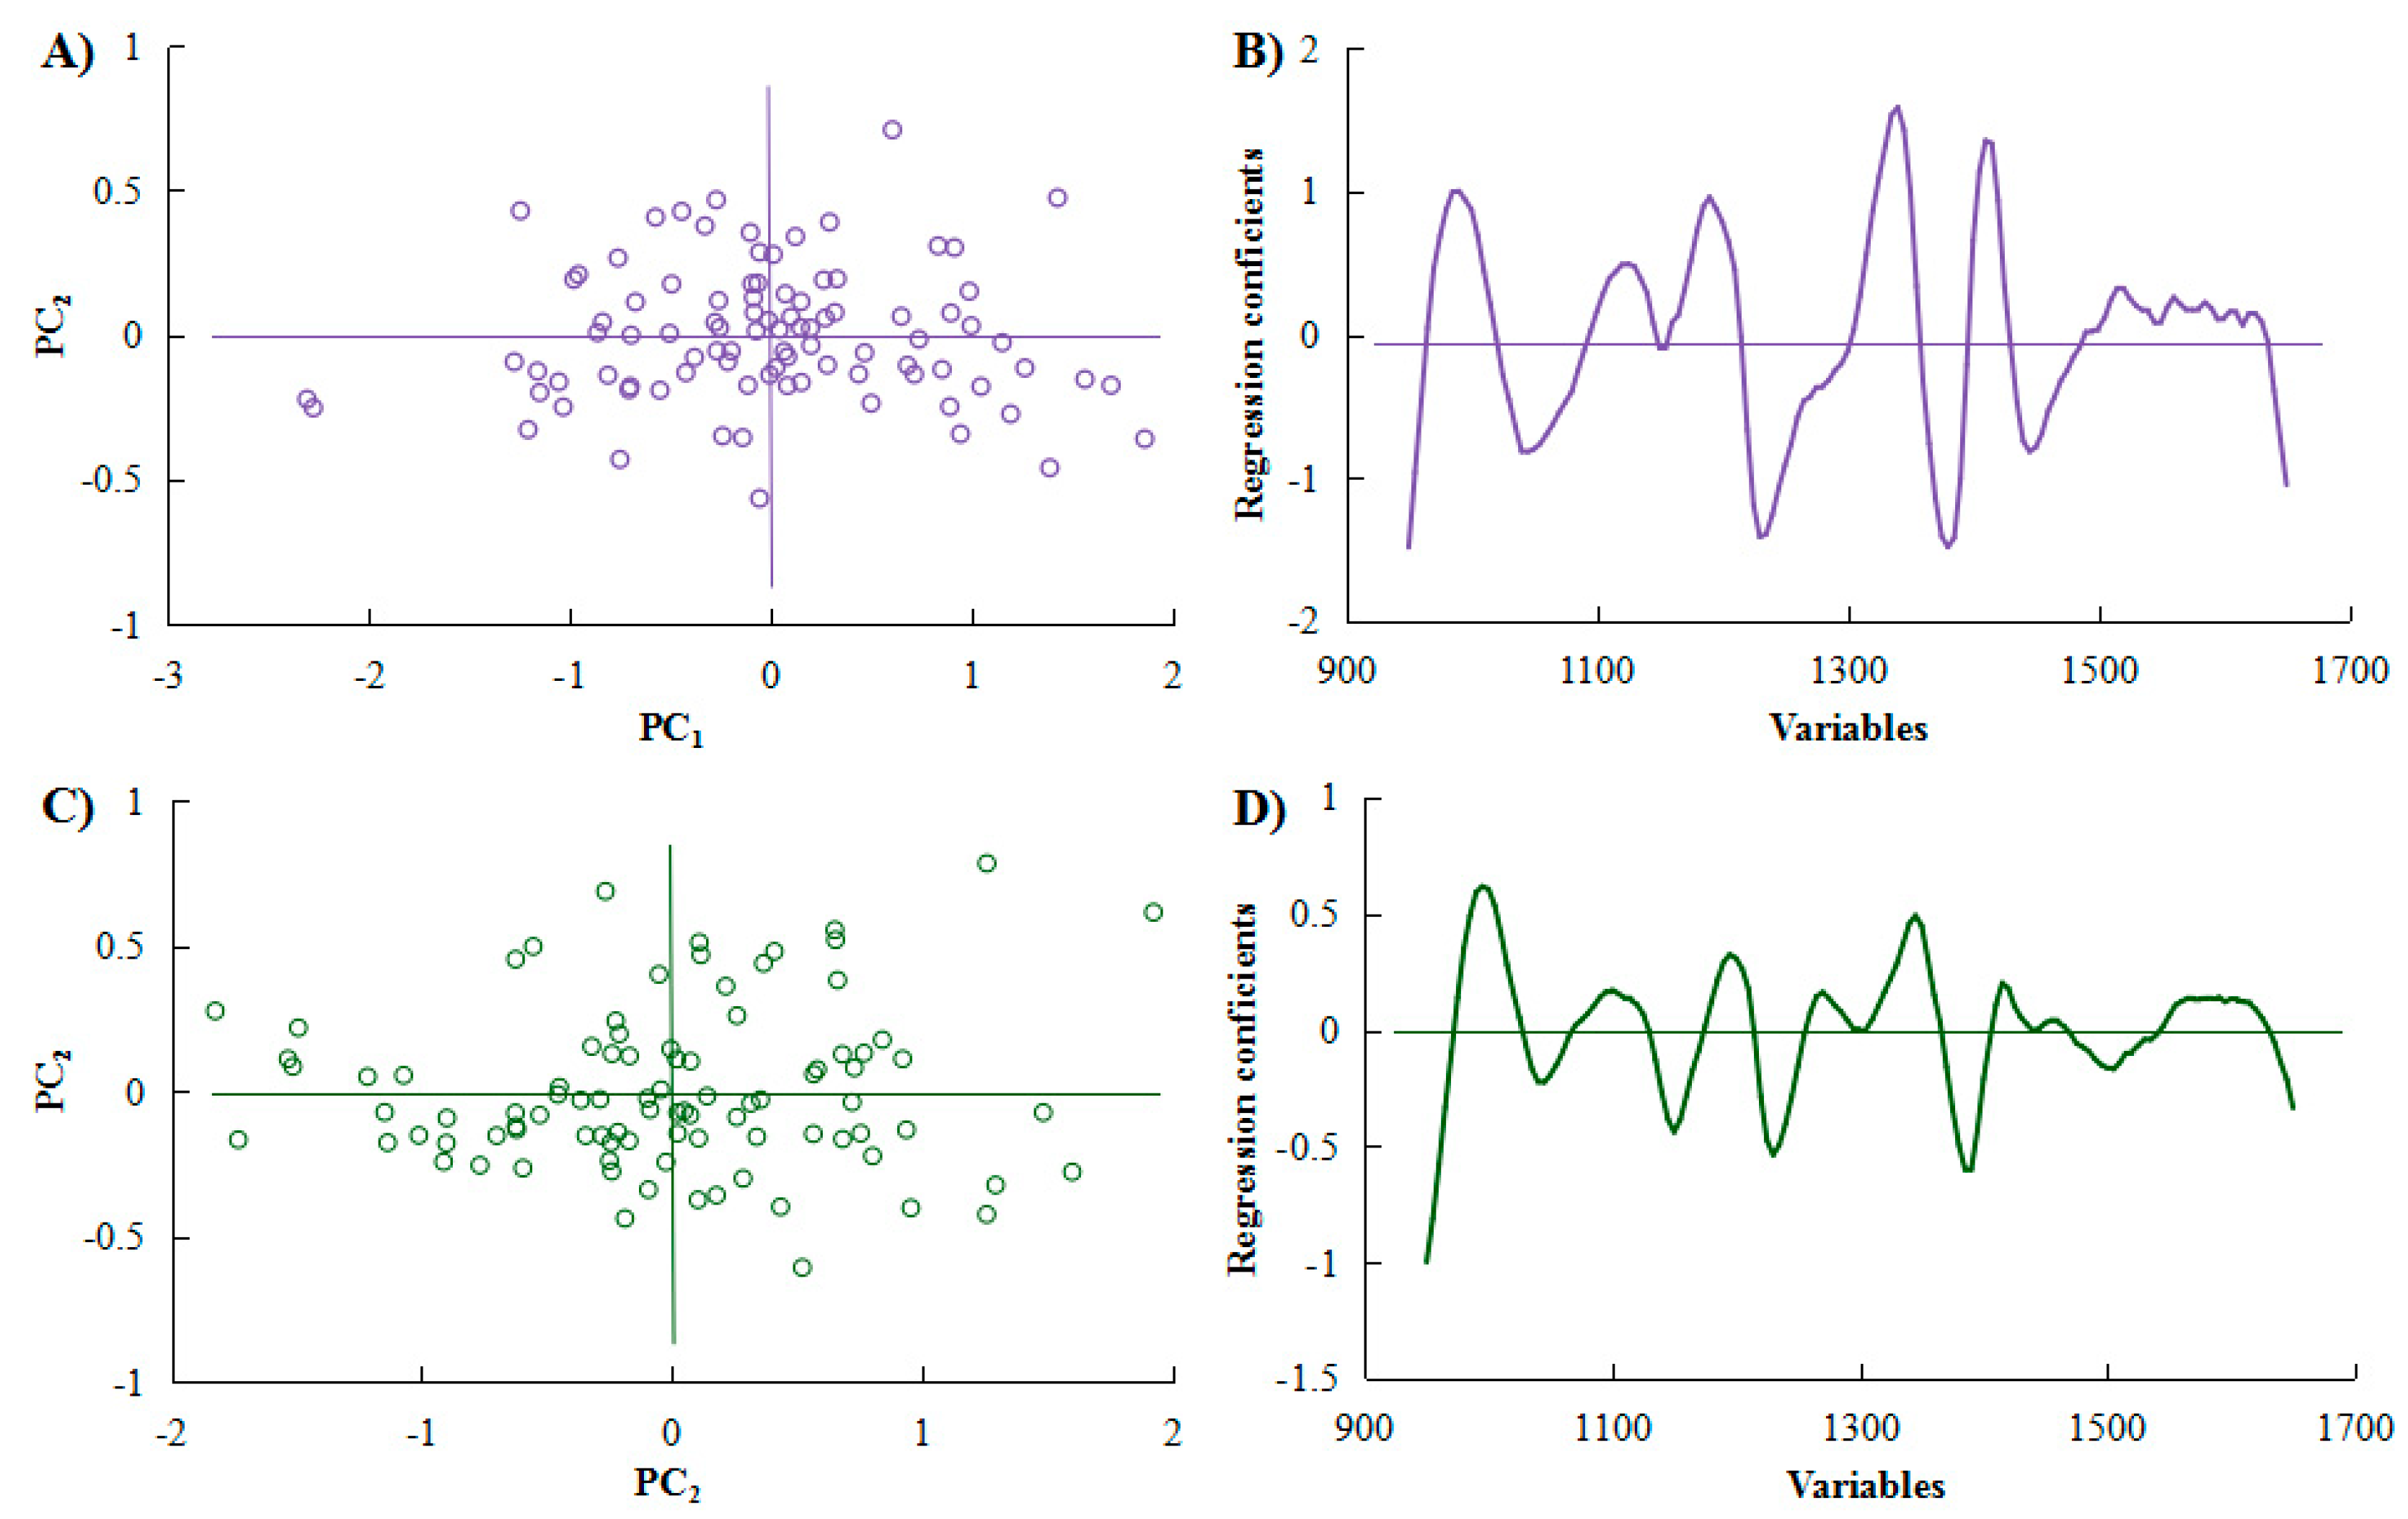
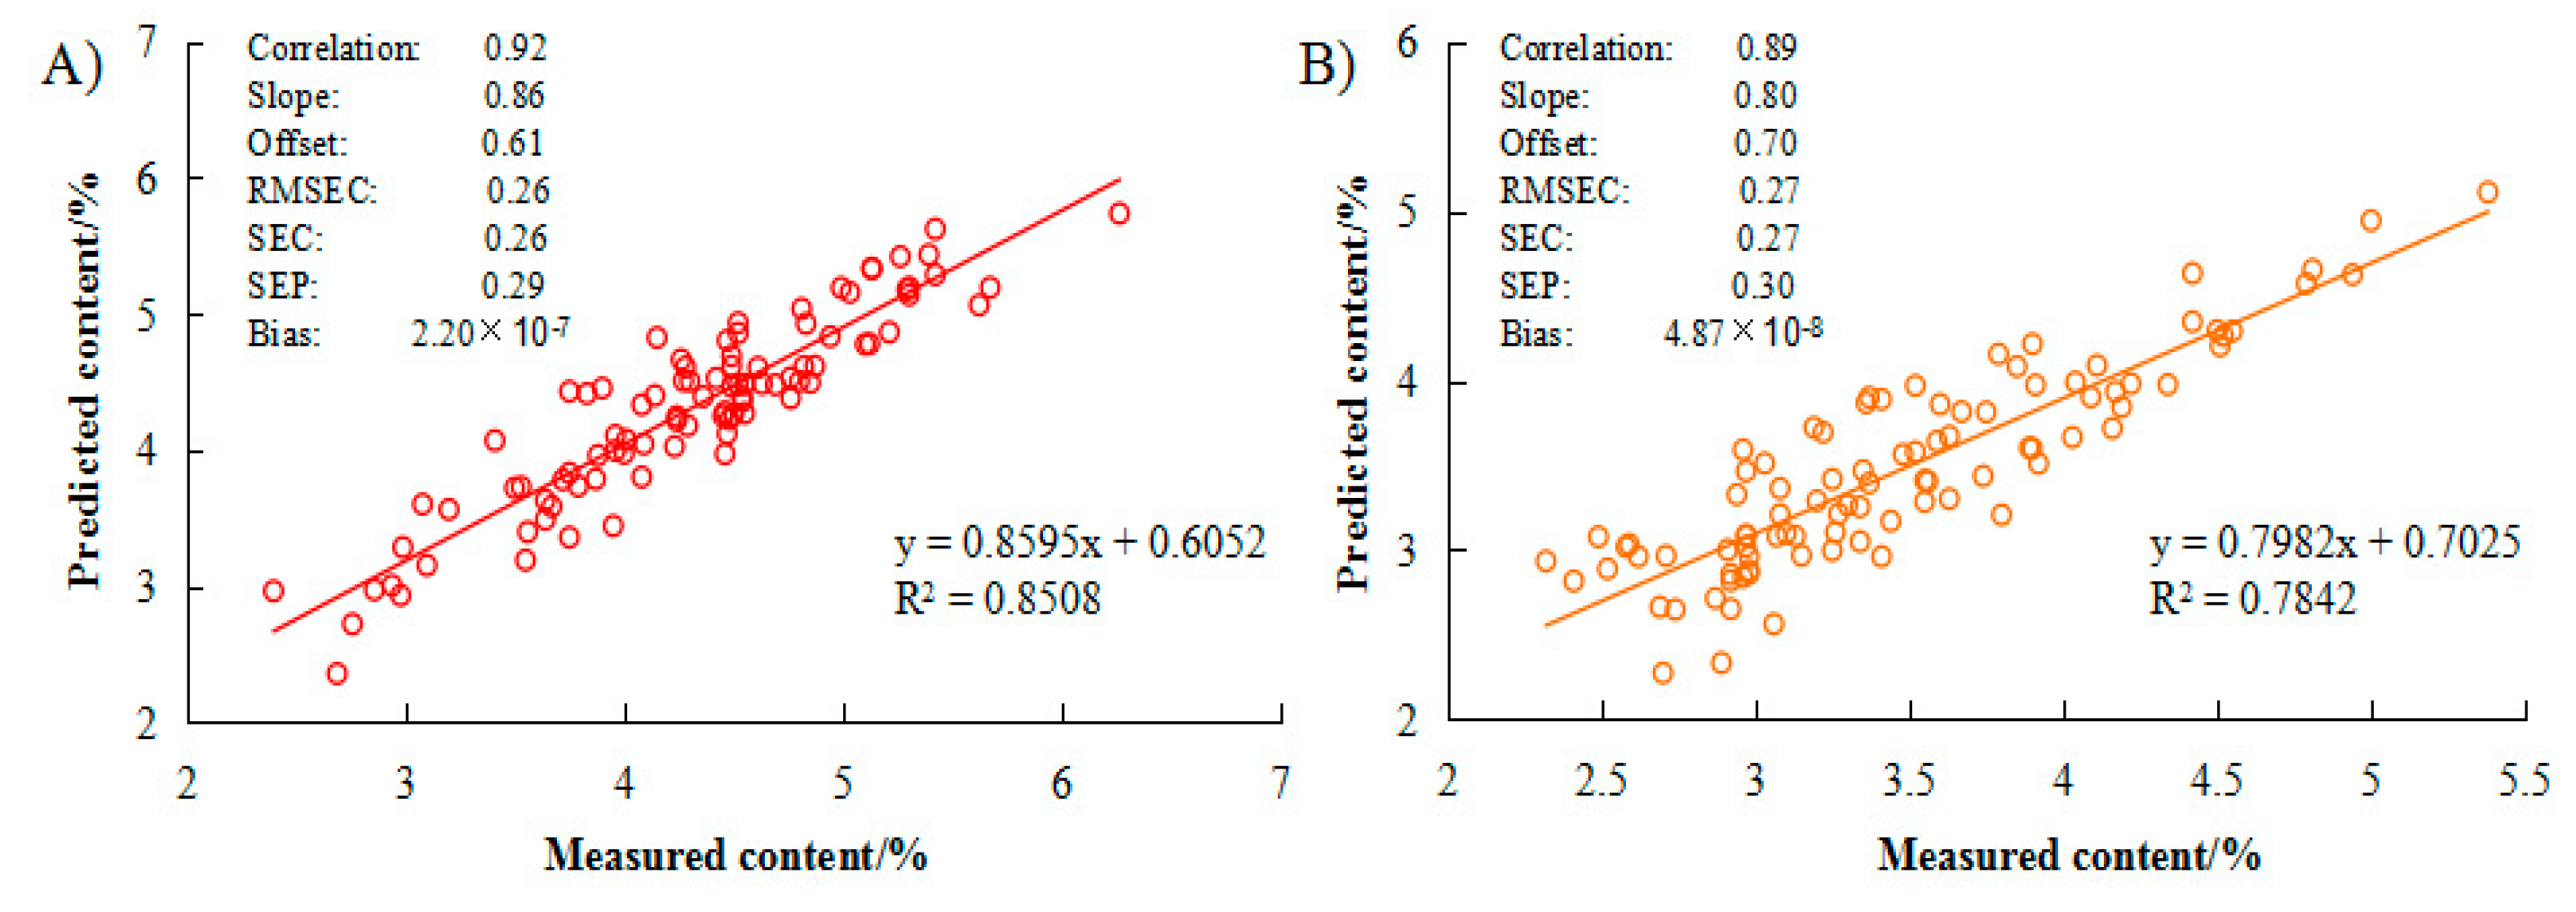
3.2.2. NIRS Analysis of Camellia Moisture

In Table 1, the maximum, minimum, mean ± SD, and CV of the moisture content of C. gauchowensis Chang samples in calibration set were 9.02%, 2.40%, 4.39 ± 1.08%, and 0.25, respectively. For the C. semiserrata Chi kernels, they were 6.37%, 2.32%, 3.49 ± 0.71%, 0.20, respectively. The oil content of C. gauchowensis Chang (48.71% of mean) was lower than C. semiserrata Chi (58.37% of mean); contrarily, the moisture content was higher (4.39% of C. gauchowensis Chang and 3.49% of C. semiserrata Chi, respectively). The lower moisture content is considered important for the specific application of Camellia, with regard to the economics of Camellia trading and quality-keeping to prevent the growth of microorganisms and mold spoilage [38]. C. semiserrata Chi seeds kernels had higher oil content and lower moisture compared with C. gauchowensis Chang, implying that C. semiserrata Chi was probably more suitable for cultivating, storage, processing, and application.
The calibration model for C. gauchowensis Chang and C. semiserrata Chi seeds kernels moisture is shown in Figure 4. The scores showed uniform distribution by PCA in Figure 4A,C for 106 samples of C. gauchowensis Chang and 104 samples of C. semiserrata Chi. The relationship between validation variance and regression coefficients (Figure 4B,D, respectively) was analyzed to set up the prediction models (Figure 5); the calibration parameters of which are also shown in Table 2.
Rc value for moisture content of C. gauchowensis Chang seeds kernels was as high as 0.92, and 0.89 for C. semiserrata Chi. SEC for C. gauchowensis Chang and C. semiserrata Chi was 0.26 and 0.27, respectively, lower than sunflower (SEC of 1.6–3.2) [24]. The offset (0.61 and 0.70, respectively), bias (2.20 × 10⁻⁷ and4.87 × 10−8, respectively), and slope (0.86 and 0.80, respectively) values were all within the reasonable range for these two species.
For C. gauchowensis Chang and C. semiserrata Chi samples, the maximum (9.00 and 5.15, respectively), minimum (2.74 and 0.71, respectively), mean ± SD (4.62 ± 0.84% and 3.19 ± 0.84%, respectively), and CV (0.18 and 0.26, respectively) in validation set are shown in Table 1. Table 2 presents that SEP was 0.29 and 0.30, respectively, lower than black tea (SEP of 2.8–3.0) [38]. The RPD values (4.22 and 2.77, respectively) were both above 2.5. The regression equations were y = 0.8595x + 0.6052 (R2 = 0.85) for C. gauchowensis Chang (Figure 5A) and y = 0.7982x + 0.7025 (R2 = 0.78) for C. semiserrata Chi (Figure 5B), respectively. All results implied a good predictive ability of the calibration model for C. gauchowensis Chang and C. semiserrata Chi kernels moisture content.

4. Conclusions

This study demonstrated that NIRS was a powerful technique to predict oil and moisture content of Camellia gauchowensis Chang and Camellia semiserrata Chi seeds kernels. Principal components analysis (PCA) was used and the sample scores examined to detect outlying or unusual spectra [25]. Then, partial least squares (PLS), one of the most classical multivariate calibration methods, was obtained the best calibration models in this research. High coefficient of calibrations showed that NIRS analysis, a fast and effective method, could be applied in Camellia oil industry. This predictive model had good accuracy and sufficient credibility. Compared with traditional chemical measurement and analysis, NIRS possessed the advantage of obviously shortened detection time, mainly due to the practical calibration models. Based on the establishment of a relatively accurate calibration model, the efficient determination of oil and moisture content for large number of C. gauchowensis Chang and C. semiserrata Chi seeds kernels samples could be realized. It would be important with regard to the economics of Camellia trading and potentially impact the procurement price of two species oil.

Author Contributions

Y.Z. and L.Z. conceived and designed the experiment; J.W. reviewed the literature and wrote the manuscript; X.T. and H.W. performed the experiments; M.W., Y.L., B.X. and M.Z. actively participated and contributed valuable opinions in accomplishing the article; W.Z., Q.M., J.L. and Y.H. contributed reagents/materials/analysis tools.

Funding

This research was funded by the Science and Technology Planning Project of Guangdong Province [2015B020202002, 2014A020208043], and the Forestry Science and Technology Innovational Project of Guangdong Province [2017KJCX003].

Acknowledgments

We would like to thank the staffs in the Shaoguan Institute of Forestry, Meizhou Institute of Forestry, Yunfu Institute of Forestry, Zhaoqing Institute of Forestry, Lianping Institute of Forestry, and Huizhou Institute of Forestry for their assistance with provided material.

Conflicts of Interest

The authors declare no conflicts of interest.

References

  1. Zhang, W.; Jin, G. Microwave puffing-pretreated extraction of oil from Camellia oleifera seed and evaluation of its physicochemical characteristics. Int. J. Food Sci. Technol. 2011, 46, 2544–2549. [Google Scholar] [CrossRef]
  2. Meng, X.; Ge, H.; Ye, Q.; Peng, L.; Wang, Z.; Jiang, L. Efficient and response surface optimized aqueous enzymatic extraction of Camellia oleifera (Tea seed) oil facilitated by concurrent calcium chloride addition. J. Am. Oil Chem. Soc. 2018, 95, 29–37. [Google Scholar] [CrossRef]
  3. Sakata, Y.; Arisumi, K. Anthocyanins in Camellia polyodonta How, C. semiserrata Chi and C. chekiangoleosa Hu, and their phylogenetic positions in section Camellia based on the pigmentation. J. Jpn. Soc. Hort. Sci. 1992, 61, 375–381. [Google Scholar] [CrossRef]
  4. Song, G.; Li, X.; Du, J.; Wang, J. Preparative separation of conjugated linoleic acids (CLAs) from fermented Camellia oleifera Abel cake by β-cyclodextrin (β-CD) encapsulation using pH-zone-refining countercurrent chromatography. Food Chem. 2014, 146, 437–442. [Google Scholar] [CrossRef] [PubMed]
  5. Fang, X.; Fei, X.; Sun, H.; Jin, Y. Aqueous enzymatic extraction and demulsification of Camellia seed oil (Camellia oleifera Abel.) and the oil’s physicochemical properties. Eur. J. Lipid Sci. Technol. 2016, 118, 244–251. [Google Scholar] [CrossRef]
  6. Fu, C.G.; Zhou, P. Camellia oil: A new special type of plant oil. Food Sci. Technol. 2003, 2, 19–21. [Google Scholar]
  7. Yuan, J.; Wang, C.; Chen, H.; Zhou, H.; Ye, J. Prediction of fatty acid composition in Camellia oleifera oil by near infrared transmittance spectroscopy (NITS). Food Chem. 2013, 138, 1657–1662. [Google Scholar] [CrossRef] [PubMed]
  8. Sramala, I.; Pinket, W.; Pongwan, P.; Jarussophon, S.; Kasemwong, K. Development of an in vitro system to simulate the adsorption of self-emulsifying tea (Camellia oleifera) seed oil. Molecules 2016, 21, 479. [Google Scholar] [CrossRef] [PubMed]
  9. Cozzolino, D.; Murray, I.; Paterson, R. Visible and near infrared reflectance spectroscopy for the determination of moisture, fat and protein in chicken breast and thigh muscle. J. Near Infrared Spectrosc. 1996, 4, 213–223. [Google Scholar] [CrossRef]
  10. Akkaya, M.R. Prediction of fatty acid composition of sunflower seeds by near-infrared reflectance spectroscopy. J. Food Sci. Technol. 2018. [Google Scholar] [CrossRef] [PubMed]
  11. Shenk, J.S.; Landa, I.; Hoover, M.R.; Westerhaus, M.O. Description and evaluation of a near infrared reflectance spectro-computer for forage and grain analysis. Crop Sci. 1981, 21, 355–358. [Google Scholar] [CrossRef]
  12. Liu, T.; Zhang, Q.; Chang, D.; Niu, Y.; Lu, W.; Xiao, Z. Characterization of tobacco leaves by near-infrared reflectance spectroscopy and electronic nose with support vector machine. Anal. Lett. 2018. [Google Scholar] [CrossRef]
  13. Lim, J.; Kim, G.; Mo, C.; Oh, K.; Kim, G.; Ham, H.; Kim, S.; Kim, M.S. Application of near infrared reflectance spectroscopy for rapid and non-destructive discrimination of hulled barley, naked barley, and wheat contaminated with Fusarium. Sensors 2018, 18, 113. [Google Scholar] [CrossRef] [PubMed]
  14. Dunko, A.; Dovletoglou, A. Moisture assay of an antifungal by near-infrared diffuse reflectance spectroscopy. J. Pharm. Biomed. Anal. 2002, 28, 145–154. [Google Scholar] [CrossRef]
  15. Davies, A.M.C.; Grant, A. Review: Near infra-red analysis of food. Int. J. Food Sci. Technol. 1987, 22, 191–207. [Google Scholar] [CrossRef]
  16. Sen, R.; Sharma, S.; Kaur, G.; Banga, S.S. Near-infrared reflectance spectroscopy calibrations for assessment of oil, phenols, glucosinolates and fatty acid content in the intact seeds of oilseed Brassica specice. J. Sci. Food Agric. 2018. [Google Scholar] [CrossRef] [PubMed]
  17. Izneid, B.A.; Fadhel, M.I.; Al-kharazi, T.; Ali, M.; Miloud, S. Design and develop a nondestructive infrared spectroscopy instrument for assessment of mango (Mangifera indica) quality. J. Food Sci. Technol. 2014, 51, 3244–3252. [Google Scholar] [CrossRef] [PubMed]
  18. Madalozzo, E.S.; Sauer, E.; Nagata, N. Determination of fat, protein and moisture in ricotta cheese by near infrared spectroscopy and multivariate calibration. J. Food Sci. Technol. 2015, 52, 1649–1655. [Google Scholar] [CrossRef] [PubMed]
  19. Srikham, W.; Noomhorm, A. Milling quality assessment of Khao Dok Mali 105 milled rice by near-infrared reflectance spectroscopy technique. J. Food Sci. Technol. 2015, 52, 7500–7506. [Google Scholar] [CrossRef]
  20. Kim, K.S.; Park, S.H.; Choung, M.G. Nondestructive determination of lignans and lignan glycosides in sesame seeds by near infrared reflectance spectroscopy. J. Agric. Food Chem. 2006, 54, 4544–4550. [Google Scholar] [CrossRef] [PubMed]
  21. Baye, T.M.; Pearson, T.C.; Settles, A.M. Development of a calibration to predict maize seed composition using single kernel near infrared spectroscopy. J. Cereal Sci. 2006, 43, 236–243. [Google Scholar] [CrossRef]
  22. Kim, Y.H.; Kang, C.S.; Lee, Y.S. Quantification of tocopherol and tocotrienol content in rice bran by near infrared reflectance spectroscopy. Korean J. Crop Sci. 2004, 49, 211–215. [Google Scholar]
  23. Guo, J.; You, T.; Prisecaru, V.; Costescu, D.; Nelson, R.L.; Baianu, I.C. NIR calibrations for soybean seeds and soy food composition analysis: Total carbohydrates, oil, proteins and water contents. Nat. Prec. 2011. [Google Scholar] [CrossRef] [Green Version]
  24. Fassio, A.; Cozzolino, D. Non-destructive prediction of chemical composition in sunflower seeds by near infrared spectroscopy. Ind. Crops Prod. 2004, 20, 321–329. [Google Scholar] [CrossRef]
  25. AOAC. Official Methods of Analysis, 15th ed.; Association of Official Analytical Chemists: Arlington, VA, USA, 1990. [Google Scholar]
  26. Leroy, B.; Lambotte, S.; Dotreppe, O.; Lecocq, H.; Istasse, L.; Clinquart, A. Prediction of technological and organoleptic properties of beef Longissimus thoracis from near-infrared reflectance and transmission spectra. Meat Sci. 2003, 66, 45–54. [Google Scholar] [CrossRef]
  27. Blanco, M.; Villarroya, I. NIR spectroscopy: A rapid response analytical tool. Trends Anal. Chem. 2002, 21, 240–250. [Google Scholar] [CrossRef]
  28. Acquah, G.E.; Via, B.K.; Fasina, O.O.; Eckhardt, L.G. Non-destructive prediction of the properties of forest biomass for chemical and bioenergy applications using near infrared spectroscopy. J. Near Infrared Spectrosc. 2015, 23, 93–102. [Google Scholar] [CrossRef]
  29. Shenk, J.S.; Westerhaus, M.O. Near Infrared Spectroscopy: The Future Waves; Davies, A.M.C., Williams, P.C., Eds.; NIR publications: Chichester, UK, 1996; pp. 198–202. [Google Scholar]
  30. Panford, J.A.; Williams, P.C.; deMan, J.M. Analysis of oilseeds for protein, oil, fiber and moisture by near-infrared reflectance spectroscopy. J. Am. Oil Chem. Soc. 1988, 65, 1627–1634. [Google Scholar] [CrossRef]
  31. Williams, P.; Norris, K. Near-Infrared Technology in the Agricultural and Food Industries, 1st ed.; American Association of Cereal Chemistis: St Paul, MN, USA, 1987. [Google Scholar]
  32. Xu, F.; Huang, X.; Dai, H.; Chen, W.; Ding, R.; Teye, E. Nondestructive determination of bamboo shoots lignificant using FT-NIR with efficient variables selection algorithms. Anal. Methods 2014, 6, 1090–1095. [Google Scholar] [CrossRef]
  33. Jie, D.; Xie, L.; Fu, X.; Rao, X.; Ying, Y. Variable selection for partial least squares analysis of soluble solids content in watermelon using near-infrared diffuse transmission technique. J. Food Eng. 2013, 118, 387–392. [Google Scholar] [CrossRef]
  34. Zhao, Q.; Lv, X.; Jia, Y.; Chen, Y.; Xu, G.; Qu, L. Rapid determination of the fat, moisture, and protein contents in homogenized chicken eggs based on near-infrared reflectance spectroscopy. Poult. Sci. 2018, 97, 2239–2245. [Google Scholar] [CrossRef] [PubMed]
  35. Martens, H.; Naes, T. Multivariate Calibration, 1st ed.; John Wiley and Sons Ltd.: New York, NY, USA, 1996. [Google Scholar]
  36. Tkachuk, R. Oil and protein analysis of whole rapeseed kernels by near infrared reflectance spectroscopy. J. Am. Oil Chem. Soc. 1981, 58, 819–822. [Google Scholar] [CrossRef]
  37. Nicolai, B.M.; Beullens, K.; Bobelyn, E.; Peirs, A.; Saeys, W.; Theron, K.I.; Lammertyn, J. Nondestructive measurement of fruit and vegetable quality by means of NIR spectroscopy: A. review. Postharvest Biol. Technol. 2007, 46, 99–118. [Google Scholar] [CrossRef]
  38. Hall, M.N.; Robertson, A.; Scotter, C.N.G. Near-infrared reflectance prediction of quality, theaflavin content and moisture content of black tea. Food Chem. 1988, 27, 61–75. [Google Scholar] [CrossRef]
Sample Availability: Samples of Camellia gauchowensis Chang and C. semiserrata Chi seeds are available from the authors.
Figure 1. Near infrared spectrogram comparison of Camellia gauchowensis Chang seeds kernels between: (A) non-destruction; and (B) comminution. 110 C. gauchowensis Chang samples represeneted 110 color lines, the same as C. semiserrata Chi seeds kernels (Figure not shown).
Molecules 23 02332 g001
Figure 2. NIRS kernels oil content analysis of: Camellia gauchowensis Chang (A,B); and C. semiserrata Chi (C,D).
Molecules 23 02332 g002
Figure 3. Scatter plots of measured versus predicted oil content of kernels for the PLS models by NIRS: (A) Camellia gauchowensis Chang; and (B) C. semiserrata Chi.
Molecules 23 02332 g003
Figure 4. NIRS analysis kernel moisture content of: Camellia gauchowensis Chang (A,B); and C. semiserrata Chi (C,D).
Molecules 23 02332 g004
Figure 5. Scatter plots of measured versus predicted moisture content of: (A) Camellia gauchowensis Chang; and (B) C. semiserrata Chi kernels for the PLS models by NIRS.
Molecules 23 02332 g005
Table 1. Calibration and validation statics in NIRS models for the estimation of oil and moisture contents of C. gauchowensis Chang and C. semiserrata Chi kernels used in sets (n = 110).
IndicatorsSeeds KernelsNumberStatisticsMax 1/%Min 2/%Mean ± SD 3/%CV 4
OilCamellia gauchowensis Chang106Calibration set68.4323.8548.71 ± 8.940.18
Validation set56.8222.1645.32 ± 7.570.17
C. semiserrata Chi104Calibration set71.0831.7158.37 ± 7.390.13
Validation set70.0051.7162.73 ± 4.380.07
MoistureC. gauchowensis Chang106Calibration set9.022.404.39 ± 1.080.25
Validation set9.002.744.62 ± 0.840.18
C. semiserrata Chi104Calibration set6.372.323.49 ± 0.710.20
Validation set5.140.713.19 ± 0.840.26
Note: 1 Max, Maximum; 2 Min, Minimum; 3 SD, standard deviation; 4 CV, coefficient of variation.
Table 2. Calibration and validation model parameters of oil and moisture contents by NIRS.
IndicatorsSeeds KernelsRc 1SEC 2SEP 3OffsetBiasSlopRPD 4
OilCamellia gauchowensis Chang0.981.571.731.591.99 × 10−60.975.94
C. semiserrata Chi0.951.721.925.261.26 × 10−60.914.92
MoistureC. gauchowensis Chang0.920.260.290.612.21 × 10−70.864.22
C. semiserrata Chi0.890.270.300.704.87 × 10−80.802.77
Note: 1 Rc, Correlation coefficients of calibration; 2 SEC, Standard error of calibration; 3 SEP, Standard error of prediction; 4 RPD, Ratio of performance to deviation (Standard deviation/SEP).

