Article

Photocatalytic Oxidation of Diethyl Sulfide Vapor over TiO2-Based Composite Photocatalysts

by
Dmitry Selishchev
1,2,3,* and
Denis Kozlov
1,2,3
1
Boreskov Institute of Catalysis, pr. Ak. Lavrentieva 5, Novosibirsk 630090, Russia
2
Novosibirsk State University, st. Pirogova 2, Novosibirsk 630090, Russia
3
Research and Educational Centre for Energoefficient Catalysis (NSU), st. Pirogova 2, Novosibirsk 630090, Russia
*
Author to whom correspondence should be addressed.
Molecules 2014, 19(12), 21424-21441; https://doi.org/10.3390/molecules191221424
Submission received: 31 August 2014 / Revised: 4 December 2014 / Accepted: 12 December 2014 / Published: 19 December 2014
(This article belongs to the Special Issue Photocatalysis)

Abstract

:
Composite TiO2/activated carbon (TiO2/AC) and TiO2/SiO2 photocatalysts with TiO2 contents in the 10 to 80 wt. % range were synthesized by the TiOSO4 thermal hydrolysis method and characterized by AES, BET, X-ray diffraction and FT-IR ATR methods. All TiO2 samples were in the anatase form, with a primary crystallite size of about 11 nm. The photocatalytic activities of the TiO2/AC and TiO2/SiO2 samples were tested in the gas-phase photocatalytic oxidation (PCO) reaction of diethyl sulfide (DES) vapor in a static reactor by the FT-IR in situ method. Acetaldehyde, formic acid, ethylene and SO2 were registered as the intermediate products which finally were completely oxidized to the final oxidation products – H2O, CO2, CO and SO42− ions. The influence of the support on the kinetics of DES PCO and on the TiO2/AC and TiO2/SiO2 samples’ stability during three long-term DES PCO cycles was investigated. The highest PCO rate was observed for TiO2/SiO2 photocatalysts. To evaluate the activity of photocatalysts the turnover frequency values (TOF) were calculated for three photocatalysts (TiO2, TiO2/AC and TiO2/SiO2) for the same amount of mineralized DES. It was demonstrated that the TOF value for composite TiO2/SiO2 photocatalysts was 3.5 times higher than for pure TiO2.

Graphical Abstract

1. Introduction

Volatile organic compounds containing N, S, P or Cl heteroatoms are often highly toxic and very dangerous for human health [1,2,3], and some of them could be used as chemical warfare agents (CWA) [4]. One of the best known CWAs is bis(2-chloroethyl) sulfide or mustard gas (HD). This species is a highly toxic vesicant which causes destruction of cell membranes and nucleic acids. It binds with nucleophilic groups like sulphur atoms in the SH-groups of proteins and nitrogen atoms in the nitrogen bases of DNA [5]. The relative toxicity (LD50) for HD inhalation is about 1.5 mg·min/L and this value is the highest among vesicants [6]. In this way the development of effective methods for HD neutralization is an important task to ensure human safety.
The main chemical methods of HD detoxification include nucleophilic substitution or oxidation, which result in the cleavage of C-S or C-Cl bonds and partial or even complete oxidation of the target molecule [7]. HD can be destroyed by photolysis or oxidized by photogenerated ozone under UV light irradiation [8]. At the same time the method of photocatalytic oxidation using TiO2 as the photocatalyst is regarded as one of the promising methods of CWA disposal due to the high oxidative ability of TiO2 under UV irradiation [9]. PCO makes it possible to destroy dangerous compounds completely with the formation of CO2, H2O, NO 3 , SO 4 2 , PO 4 3 and Cl as final products [10].
In the view of the high toxicity of HD, researchers usually use for laboratory investigations simulants such as 2-chloroethyl ethyl sulfide [11], 2-chloroethyl methyl sulfide [12], 2-phenethyl 2-chloroethyl sulfide [13], diethyl sulfide (DES) [14] and dimethyl sulfide [15]. These simulants are safer due to their lower toxicity, but at the same time they simulate well the chemical behavior of HD.
In the current work we focused on the investigation of DES vapor PCO. In our previous works we demonstrated that DES can be easily decontaminated under the UV irradiation using TiO2 as the photocatalyst with the formation of CO2, H2O and surface sulfate and carbonate species as the final PCO products [14,16,17,18]. Acetaldehyde, ethanol, ethylene, SO2 and other trace products were detected as the gas-phase intermediates, while polysulfides, diethyl sulfone, diethyl sulfoxide were detected as the surface intermediates. All intermediates were completely oxidized to the final products after long-term irradiation [14,16]. Analysis of intermediates and products allowed the authors to propose the main routes of the DES PCO, which include C-S bond cleavage, and oxidation of sulfur and carbon atoms.
To enhance the rate of air purification from DES vapor in a closed chamber a TiO2 aerosol generated by a sonic method could be applied [19]. Aerosol spraying led to the fast adsorption of DES vapor and its further photocatalytic oxidation under UV irradiation.
The main problem during the long-term DES oxidation is the deactivation of the TiO2 photocatalyst. An increase of the time required for the complete mineralization of DES was clearly seen from the kinetic curves of CO2 accumulation during several oxidation cycles in a batch reactor [14]. FT-IR analysis demonstrated that the accumulation of non-volatile organic intermediates like polysulfides, diethyl sulfone, diethyl sulfoxide and sulfate species on the surface of photocatalyst are responsible for its deactivation during the long-term experiments. The positive influence of using the composite TiO2/adsorbent photocatalysts was also discussed in our previously published paper devoted to the computer simulation of the kinetics of photocatalytic reactions [20] where we demonstrated an increase of the rate of substrate removal for TiO2/adsorbent photocatalysts.
In recent years composite photocatalysts in which TiO2 is deposited onto the surface of a porous support like activated carbon (AC), silica or zeolite were actively investigated in the PCO processes of various pollutants, both in the gas and liquid phases [21,22,23,24,25,26]. In addition to the increase of the adsorption capacity in some cases the increase of the PCO rate and the decrease of deactivation degree were observed for such composite photocatalysts [27,28,29].
Concerning mustard gas, several research groups have studied PCO of HD simulants using composite photocatalysts. Cr-modified TiO2-loaded MCM-41 silica photocatalyst was studied in the oxidation of DES vapor in a batch reactor under UV irradiation [30]. It was demonstrated that the TiO2 deposition on the Cr-MCM-41 support increases the DES removal rate, but decreases the CO2 formation rate if compares with the commercial Hombifine N TiO2 (Sachtleben Chemie GmbH, Duisburg, Germany).
Panayotov and co-workers investigated the PCO of 2-chloroethyl ethyl sulfide (CEES) and DES on a mixed oxide TiO2-SiO2 photocatalyst [31,32,33]. They revealed that the CEES adsorbs on the surface of the composite photocatalyst through both the chlorine and sulfur atoms by bonding to isolated OH groups. The authors also demonstrated that the presence of the Cl atom in the CEES molecule does not significantly influence the PCO rate if compared with the DES molecule. Partially or fully oxidized products were observed during the photooxidation of both tested molecules over the composite photocatalyst. Partially oxidized products have been demonstrated to block OH groups on the surface of photocatalysts and to prevent further adsorption of target molecules and to thus reduce the rate of photooxidation. Unfortunately, no comparison between pure TiO2 and composite TiO2-SiO2 photocatalyst was done. The main drawback of the previous works is the absence of systematic investigations of the behavior of composite photocatalysts during the long-term PCO of HD simulants.
In spite of the fact that AC is the most frequently used TiO2 support in composite photocatalysts, the SiO2 material is also promising due to its higher hydrophilicity, transparency and quantity of OH-groups. In this connection, the main objective of the current study was to investigate the PCO of DES in the gas-phase over composite photocatalysts in which TiO2 was deposited onto AC or SiO2 surfaces. We investigated the effect of the porous support on the kinetics of DES PCO and on the composite photocatalyst activity in multiple long-term experiments. Finally, a comparison between pure TiO2 and TiO2/adsorbent photocatalysts was made.

2. Results and Discussion

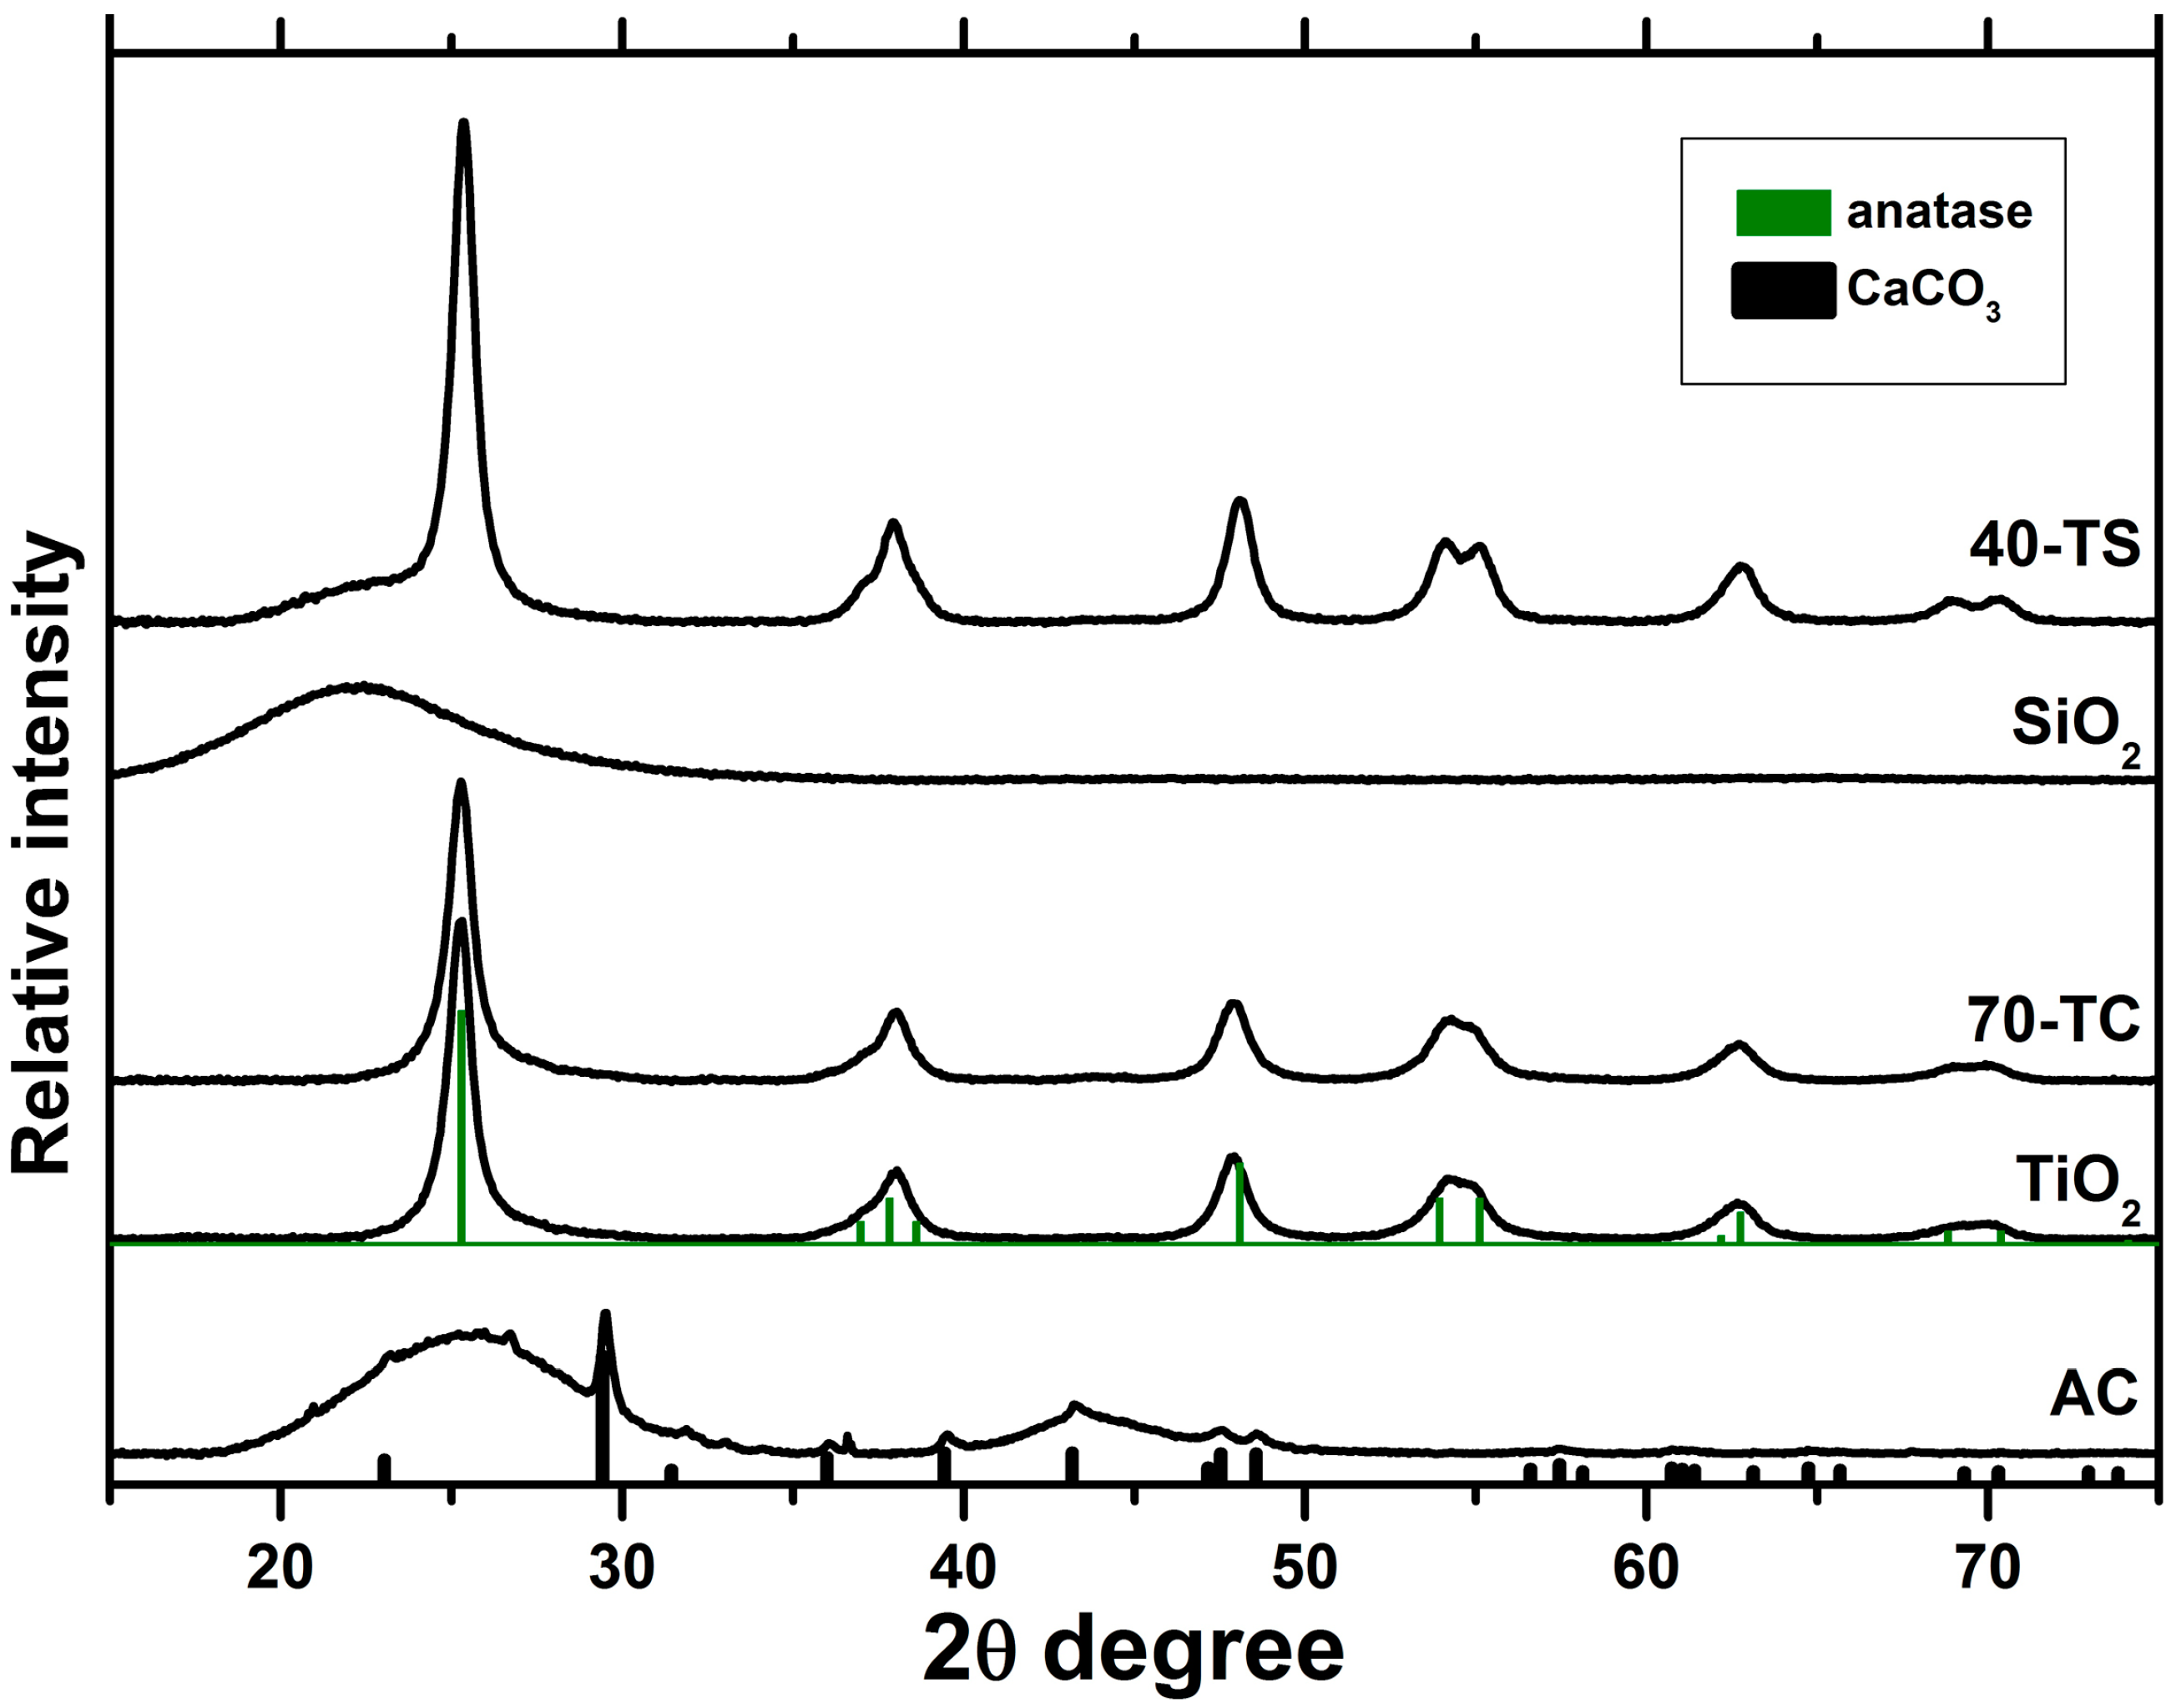
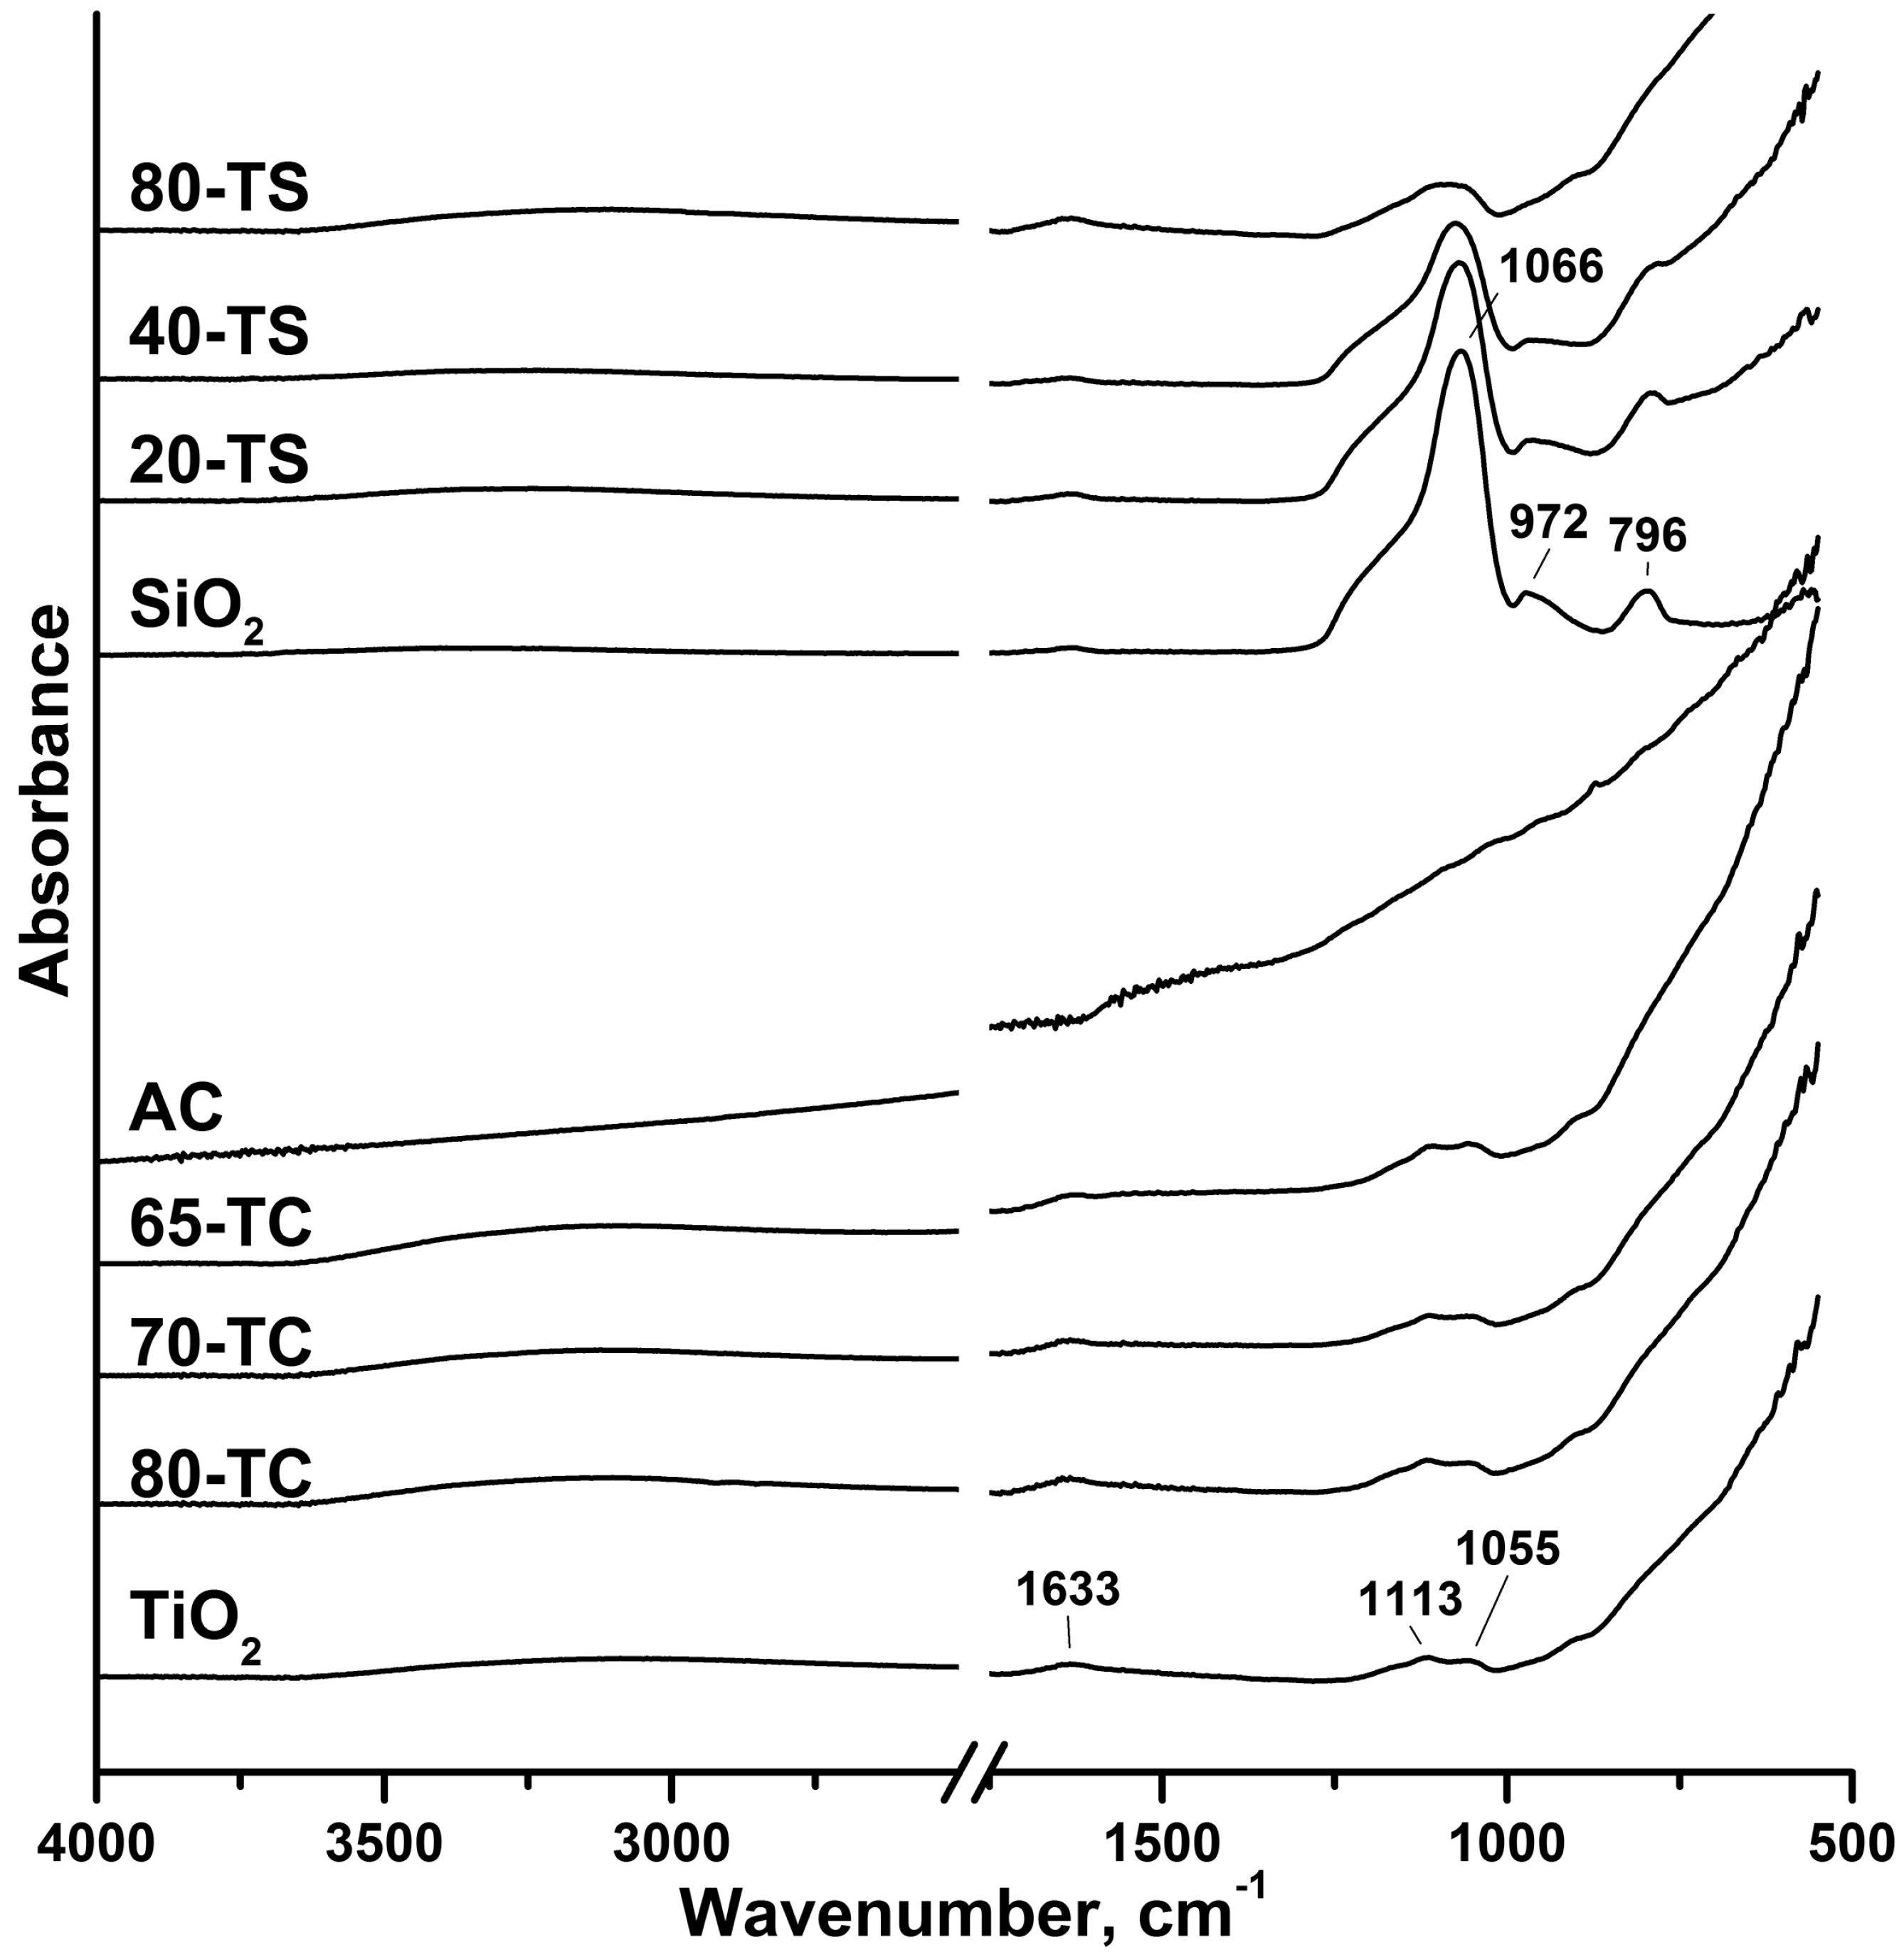
2.1. Characterization of the Synthesized Photocatalysts
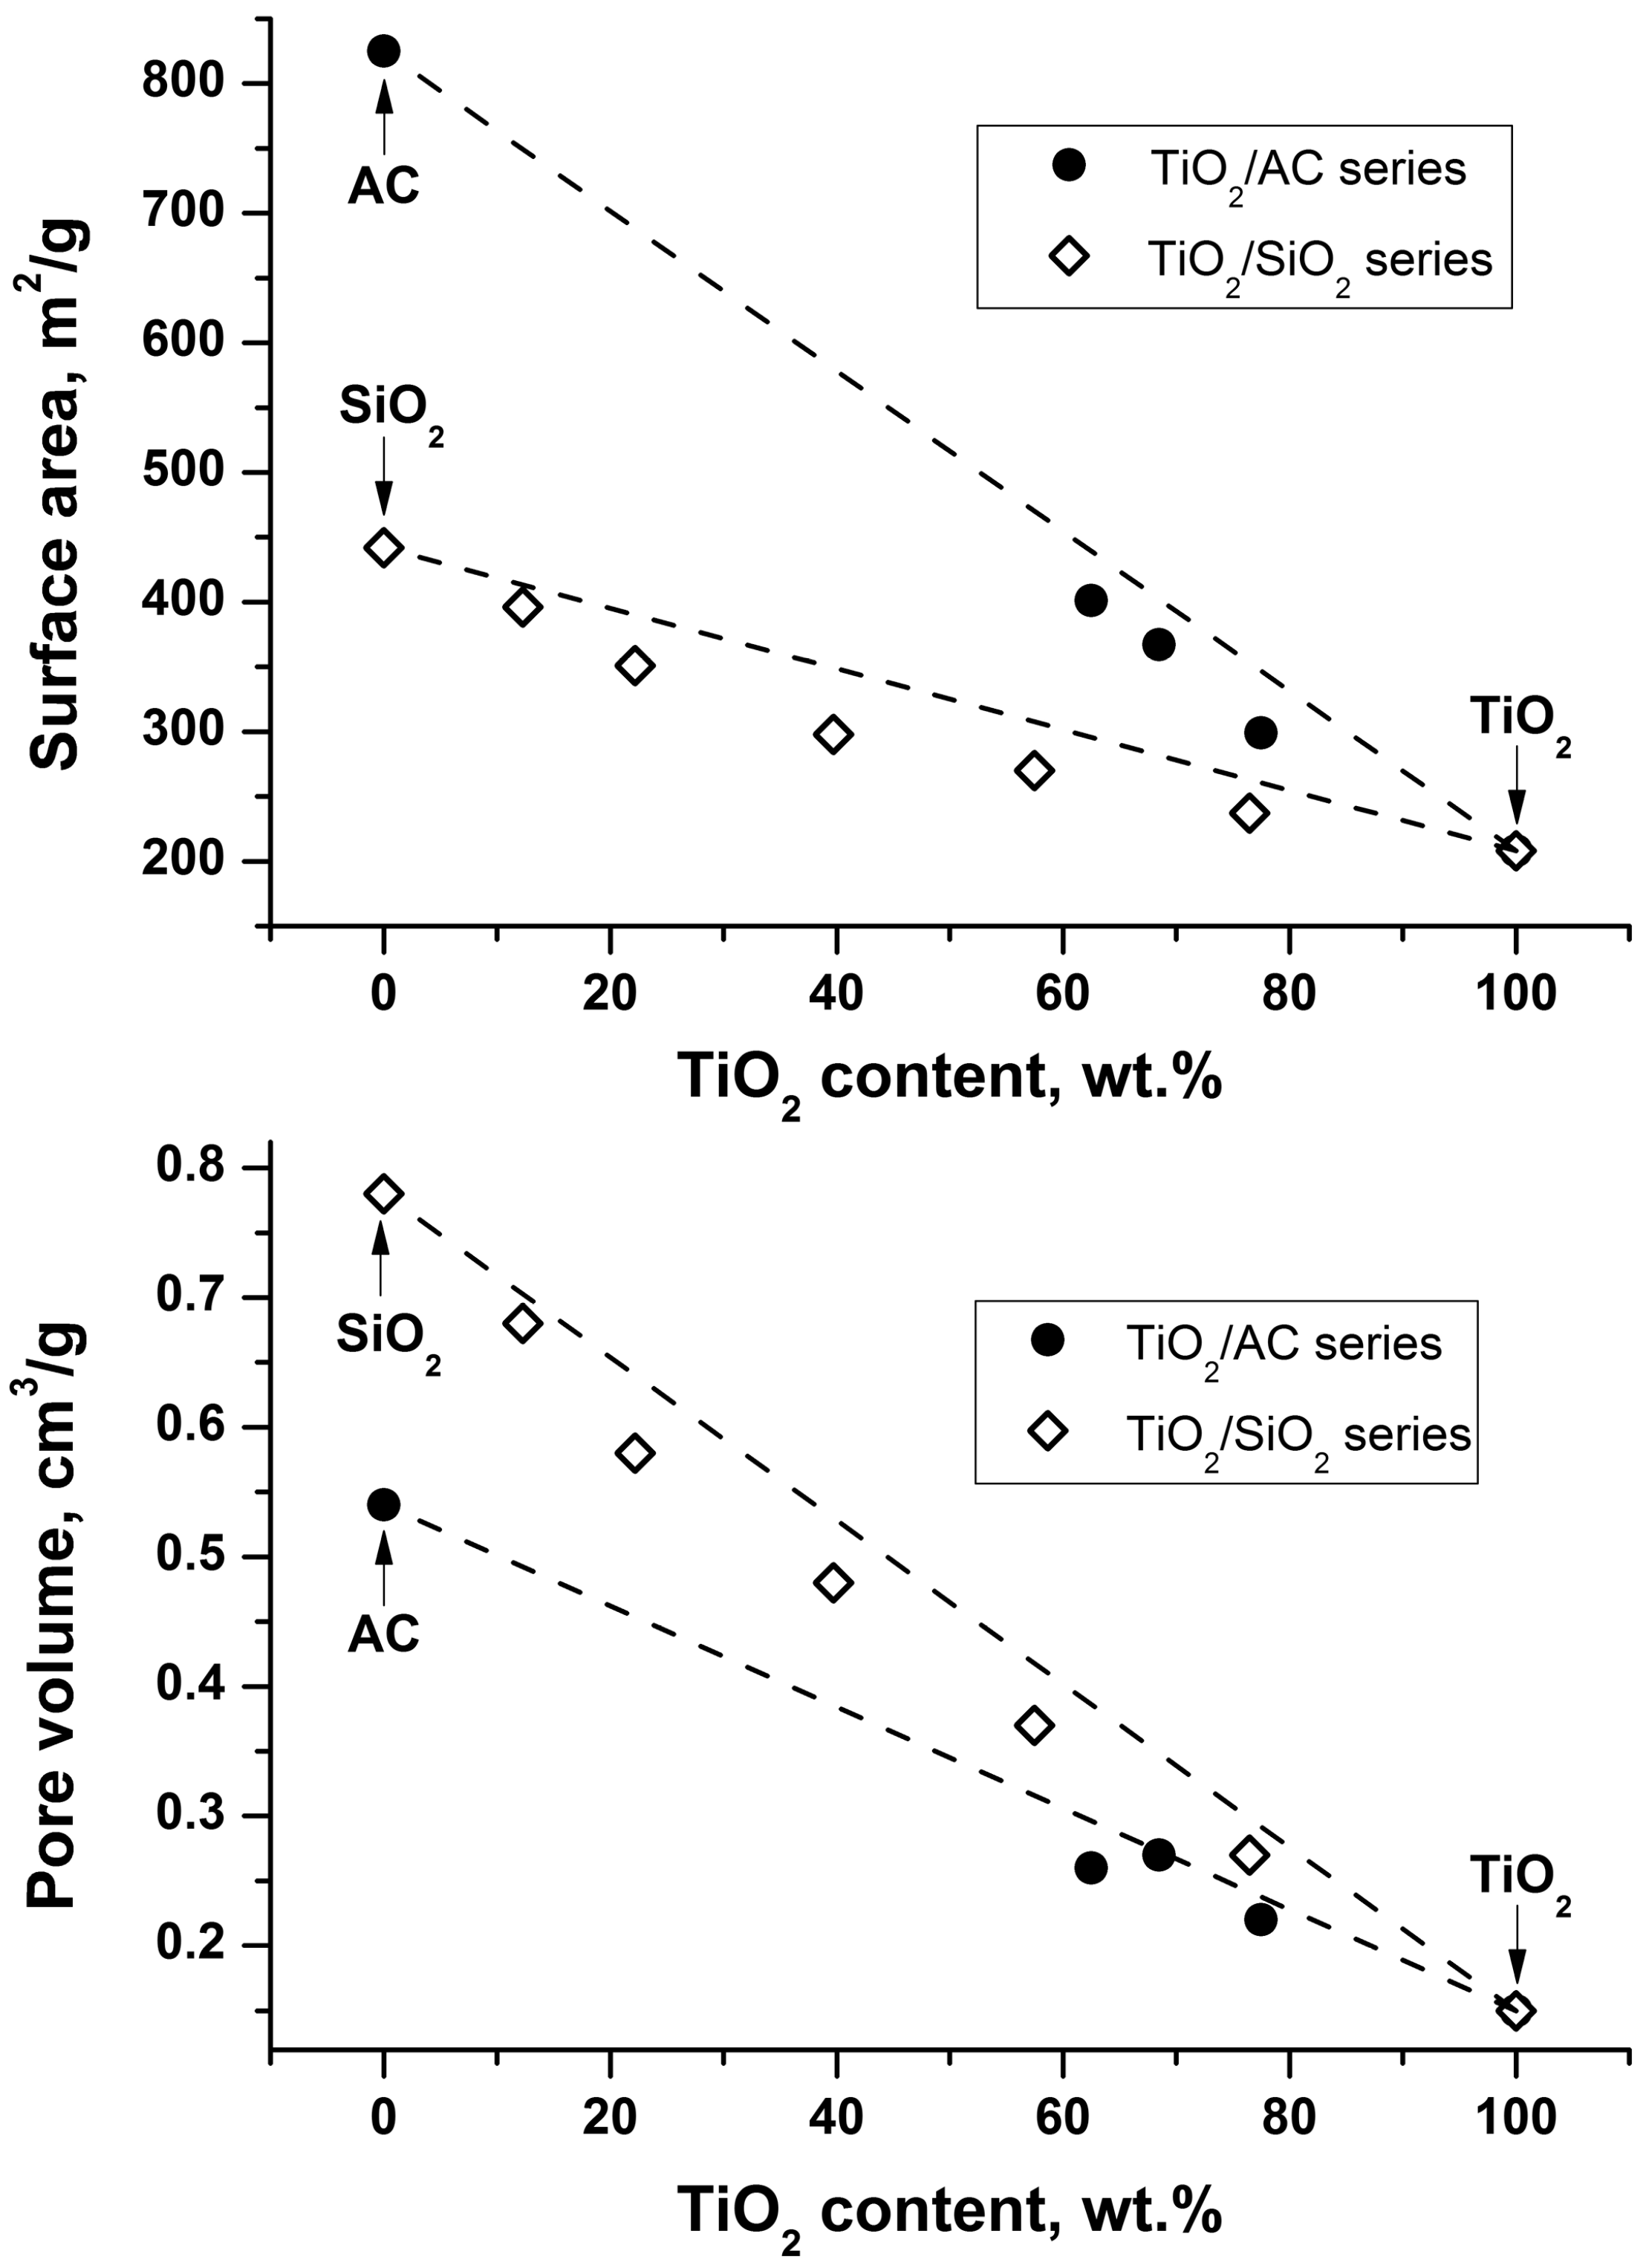
Synthesis of TiO2, TiO2/AC and TiO2/SiO2 samples was performed by the TiOSO4 thermal hydrolysis method. This method has some advantages in comparison with the popular sol-gel method which utilizes titanium alkoxides because titanyl sulfate is a cheaper precursor. Synthesized TiO2 samples were of anatase crystal structure with a high surface area and good crystallinity. As a result the TiO2 photocatalyst synthesized by this procedure usually have high photocatalytic activity in the oxidation of volatile organic compounds [34].
In our previous work TiO2/AC samples with TiO2 contents higher than 60 wt. % demonstrated high photocatalytic activity [22]. Therefore in this work we prepared TiO2/AC samples with estimated TiO2 contents equal to 65, 70 and 80 wt. %. The TiO2/SiO2 photocatalysts have high photoactivity even at a relatively low TiO2 content, so we prepared several TiO2/SiO2 samples with estimated TiO2 contents in the range from 10 to 80 wt. %. Varying the TiO2 content in the series of TiO2/adsorbent samples allows us to choose a photocatalyst with high adsorption capacity and at the same time with high photocatalytic activity for further investigation of DES PCO. The results of AES and BET analysis are presented in the Table 1.
Table 1. TiO2 content and textural properties of the samples.
SeriesSample *TiO2 Content, wt. %Surface Area, m2/gPore Volume, cm3/g
SupportsAC--8250.54
SiO2--4420.78
TiO2TiO21002080.15
TiO2/AC80-TC77.52990.22
70-TC68.53670.27
65-TC62.54010.26
TiO2/SiO280-TS76.52370.27
60-TS57.52700.37
40-TS39.72980.48
20-TS22.23510.58
10-TS12.33960.68
* Number in the sample label indicates the estimated TiO2 content, wt. %.
It follows from the Table 1 that the synthesized TiO2 sample has a high surface area (208 m2/g) and pore volume (0.15 cm3/g). The corresponding values for composite TiO2/AC and TiO2/SiO2 photocatalysts are higher because of the higher porosity of AC and SiO2. Moreover, the lower the TiO2 content is the higher specific surface area and pore volume of the composite photocatalyst are (Figure 1). Figure 1 demonstrates that the specific surface area and pore volume of the composite photocatalyst are slightly lower than the algebraic sum of the corresponding values of TiO2 and adsorbent (AC or SiO2). This means that a partial blocking of the support surface by TiO2 nanoparticles occurs.
XRD patterns for pure TiO2 and composite photocatalysts are presented in Figure 2. It can be seen that the XRD patterns of TiO2/AC catalyst only have anatase peaks while broad activated carbon peaks are not detected due to the low AC content. Also a small amount of CaCO3 admixture is observed in the AC sample.
In the TiO2/SiO2 samples, in addition to anatase peaks, there appears a broad silica peak at the 2θ value equal to 20–30° indicating its amorphous structure. This silica peak overlaps with the 2θ = 25.3° peak of anatase. By and large the anatase peaks are similar for pure TiO2 and composite TiO2/AC and TiO2/SiO2 samples which indicates that TiO2 crystallites have the same size in all cases because the value of the coherent-scattering domains size is about 11 nm for all samples.
Figure 1. Dependences of the specific surface area and pore volume on TiO2 content for the TiO2/AC and TiO2/SiO2 composite photocatalysts.
Molecules 19 21424 g001
Figure 2. XRD patterns for the pure TiO2, AC, SiO2 and for the composite 70-TC and 40-TS photocatalysts.
Molecules 19 21424 g002
Figure 3 shows the IR spectra of all synthesized photocatalysts, AC and SiO2 supports measured by the FT-IR ATR technique. Since all measurements were carried out under ambient conditions the water δs(H2O) absorption band at 1633 cm−1 was recorded in all samples except for AC powder. A broad absorption band in the 2800–3750 cm−1 range corresponds to the stretching vibration of the surface OH-groups and physically adsorbed H2O molecules.
The 1055 and 1113 cm−1 absorption bands in the spectrum of the pure TiO2 sample correspond to the vibrations in sulfate complexes [35]. The presence of sulfur was additionally confirmed by the atomic emission spectroscopy (AES) results, which revealed about 1.3 wt. % of S. This means that bonded sulfate complexes remain on the catalyst surface even after thorough washing. The presence of sulfate groups on the photocatalyst surface was also observed for the TiO2/AC sample. For the TiO2/SiO2 catalysts identification of surface sulfate group was difficult because their signals overlapped with the stretching vibration bands of Si-O-Si and Si-O-H bonds near the 1000 cm−1 region.
Figure 3. ATR FT-IR spectra for pure TiO2, AC, SiO2 and for the composite photocatalysts.
Molecules 19 21424 g003

2.2. Kinetic Experiments

The main purpose of our work was to study the PCO of diethyl sulfide with the composite photocatalysts and to investigate their stability in long-term experiments. In this connection in the beginning we optimized the quantity of the photocatalyst. Then we chose the photocatalyst with adsorptivity and photocatalytic activity in good proportions and finally we investigated its stability in the DES PCO.

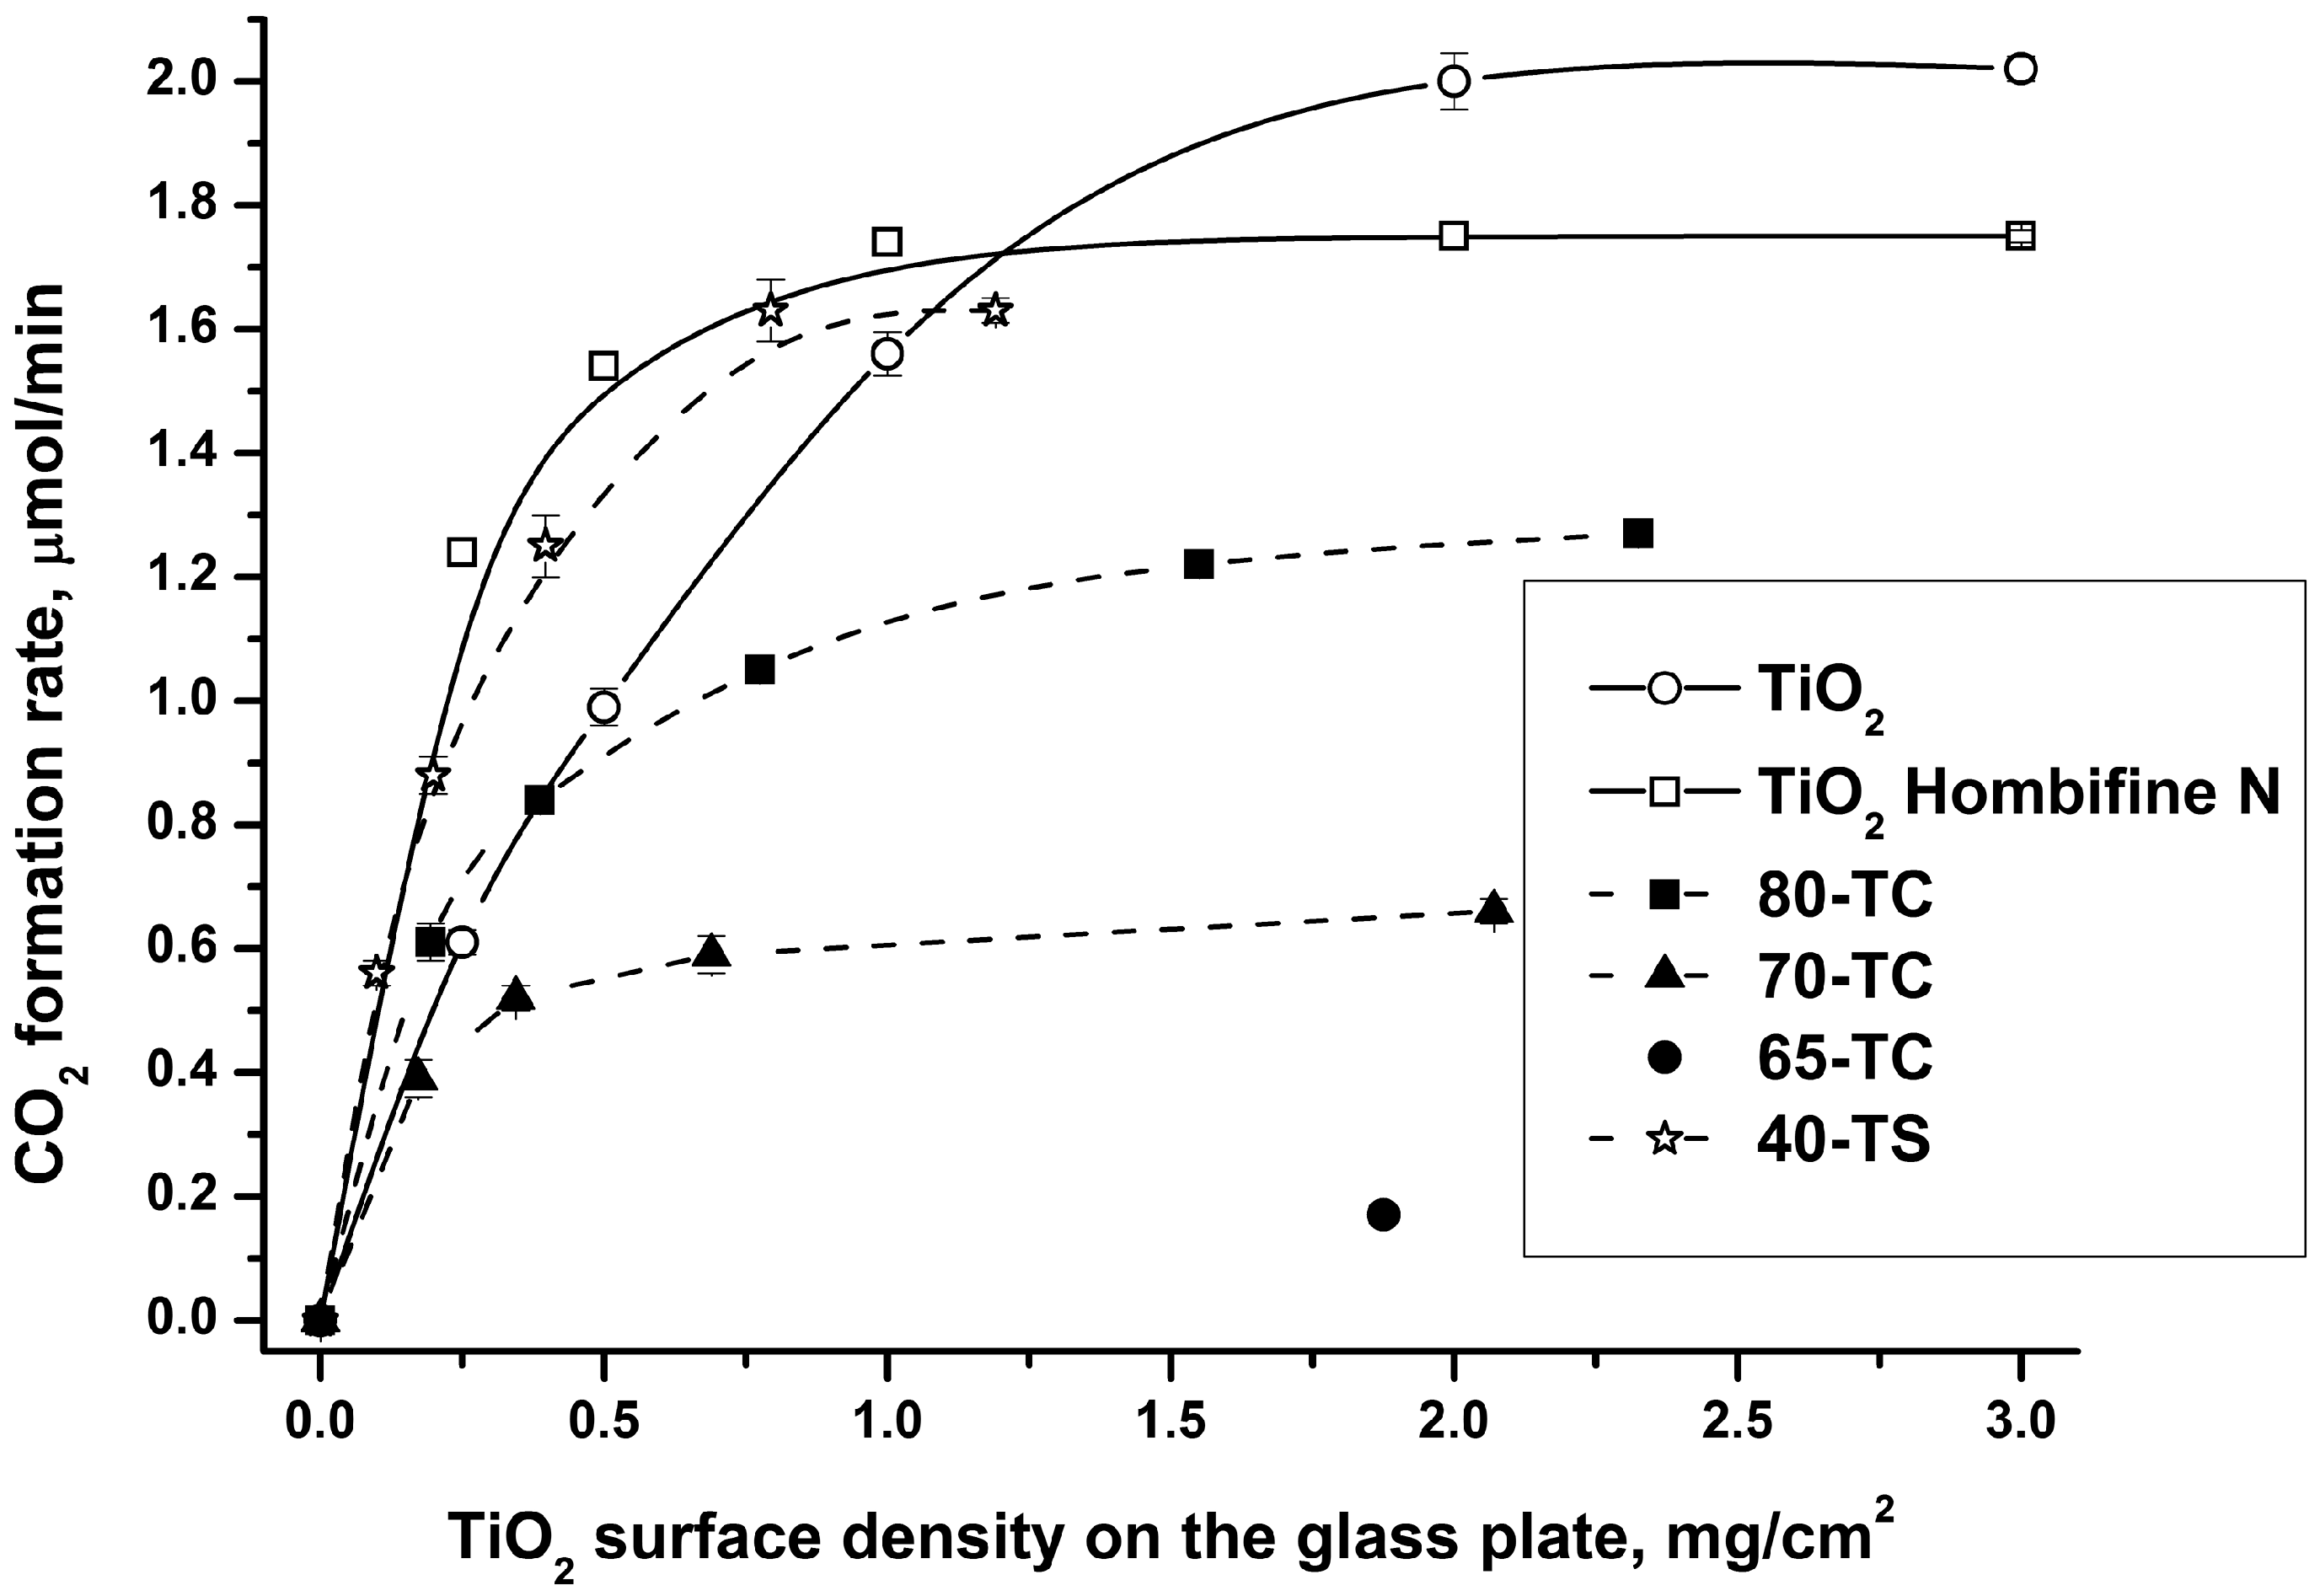
2.2.1. Effect of the Sample Quantity on the Photocatalytic Activity

The photocatalytic activities of pure TiO2 and composite samples were measured in a continuous flow reactor in the reaction of acetone vapor PCO. The CO2 formation rate was used as a measure of the photocatalytic activity. Photocatalysts were uniformly deposited onto a 3 × 3 cm glass support and then installed into the continuous flow reactor (see Experimental Section). The quantity of photocatalyst deposited was measured in mg/cm2 units. For the quantity optimization experiments several glass supports with different quantities were prepared for all photocatalysts. For the pure TiO2 the quantities were 0.25, 0.5, 1, 2 and 3 mg/cm2. For the composite samples their quantities were adjusted in such a way that the quantities of contained TiO2 were in the 0.2–3 mg/cm2 range. For example the 40-TS sample contains 39.7 wt. % of TiO2 (Table 1) and to achieve the 0.25 mg/cm2 value a quantity of 0.25/0.397 = 0.63 mg/cm2 of 40-TS sample was deposited onto the glass support.
Figure 4 demonstrates the dependencies of the steady-state rate of CO2 formation during acetone oxidation over TiO2, TiO2/AC and TiO2/SiO2 samples on the quantity of contained TiO2. The higher is the contained TiO2 on the glass support, the thicker the photocatalyst layer is.
Figure 4. Influence of the quantity of photocatalyst on its photocatalytic activity.
Molecules 19 21424 g004
It could be seen that in all cases the PCO rate achieves the maximum value. It corresponds to the situation when the incident light is completely absorbed by the photocatalyst and any further increase in the quantity of photocatalyst leads to the formation of the bottom unirradiated photocatalyst layers which do not work.
The quantity of photocatalyst which corresponds to the maximum PCO rate depends on the TiO2 content and its dispersion. For example for the commercial Hombifine N TiO2 (Sachtleben Chemie GmbH, 100% anatase, SBET = 350 m2/g) the maximum rate quantity is about 1 mg/cm2, whereas for the synthesized TiO2 sample it is about 2 mg/cm2.
It should be noted that at low sample quantity the 40-TS sample is more active than pure TiO2. As it follows from the Table 1 both photocatalysts have the same size of TiO2 crystallites—11 nm—therefore the difference of activities could be explained by a higher dispersion of the TiO2 particles deposited onto the silica in the 40-TS sample than in the pure TiO2.
On the other hand activities of the TiO2/AC samples are lower than for pure TiO2 because unlike silica, AC absorbs UV irradiation. Due to low photocatalytic activity of TiO2/AC photocatalysts we used samples 80-TC and 70-TC with high TiO2 content. Two conclusions could be reached from the above discussion:
(1)
Comparison of the photocatalysts’ activity should be done using high quantities when the thickness of the photocatalyst layer is sufficient for complete light absorption (e.g., 2–3 mg/cm2). We used this approach when choosing a photocatalyst with good adsorptivity and photocatalytic activity (see Section 2.2.2);
(2)
Studies of long-term photocatalyst use should be done using a relatively low TiO2 quantity (e.g., 0.5 mg/cm2) because in this case we can assume that the entire photocatalyst surface is irradiated and is involved in the reaction process. This is the reason why we investigated the diethyl sulfide oxidation with a 0.5 mg/cm2 quantity of TiO2.

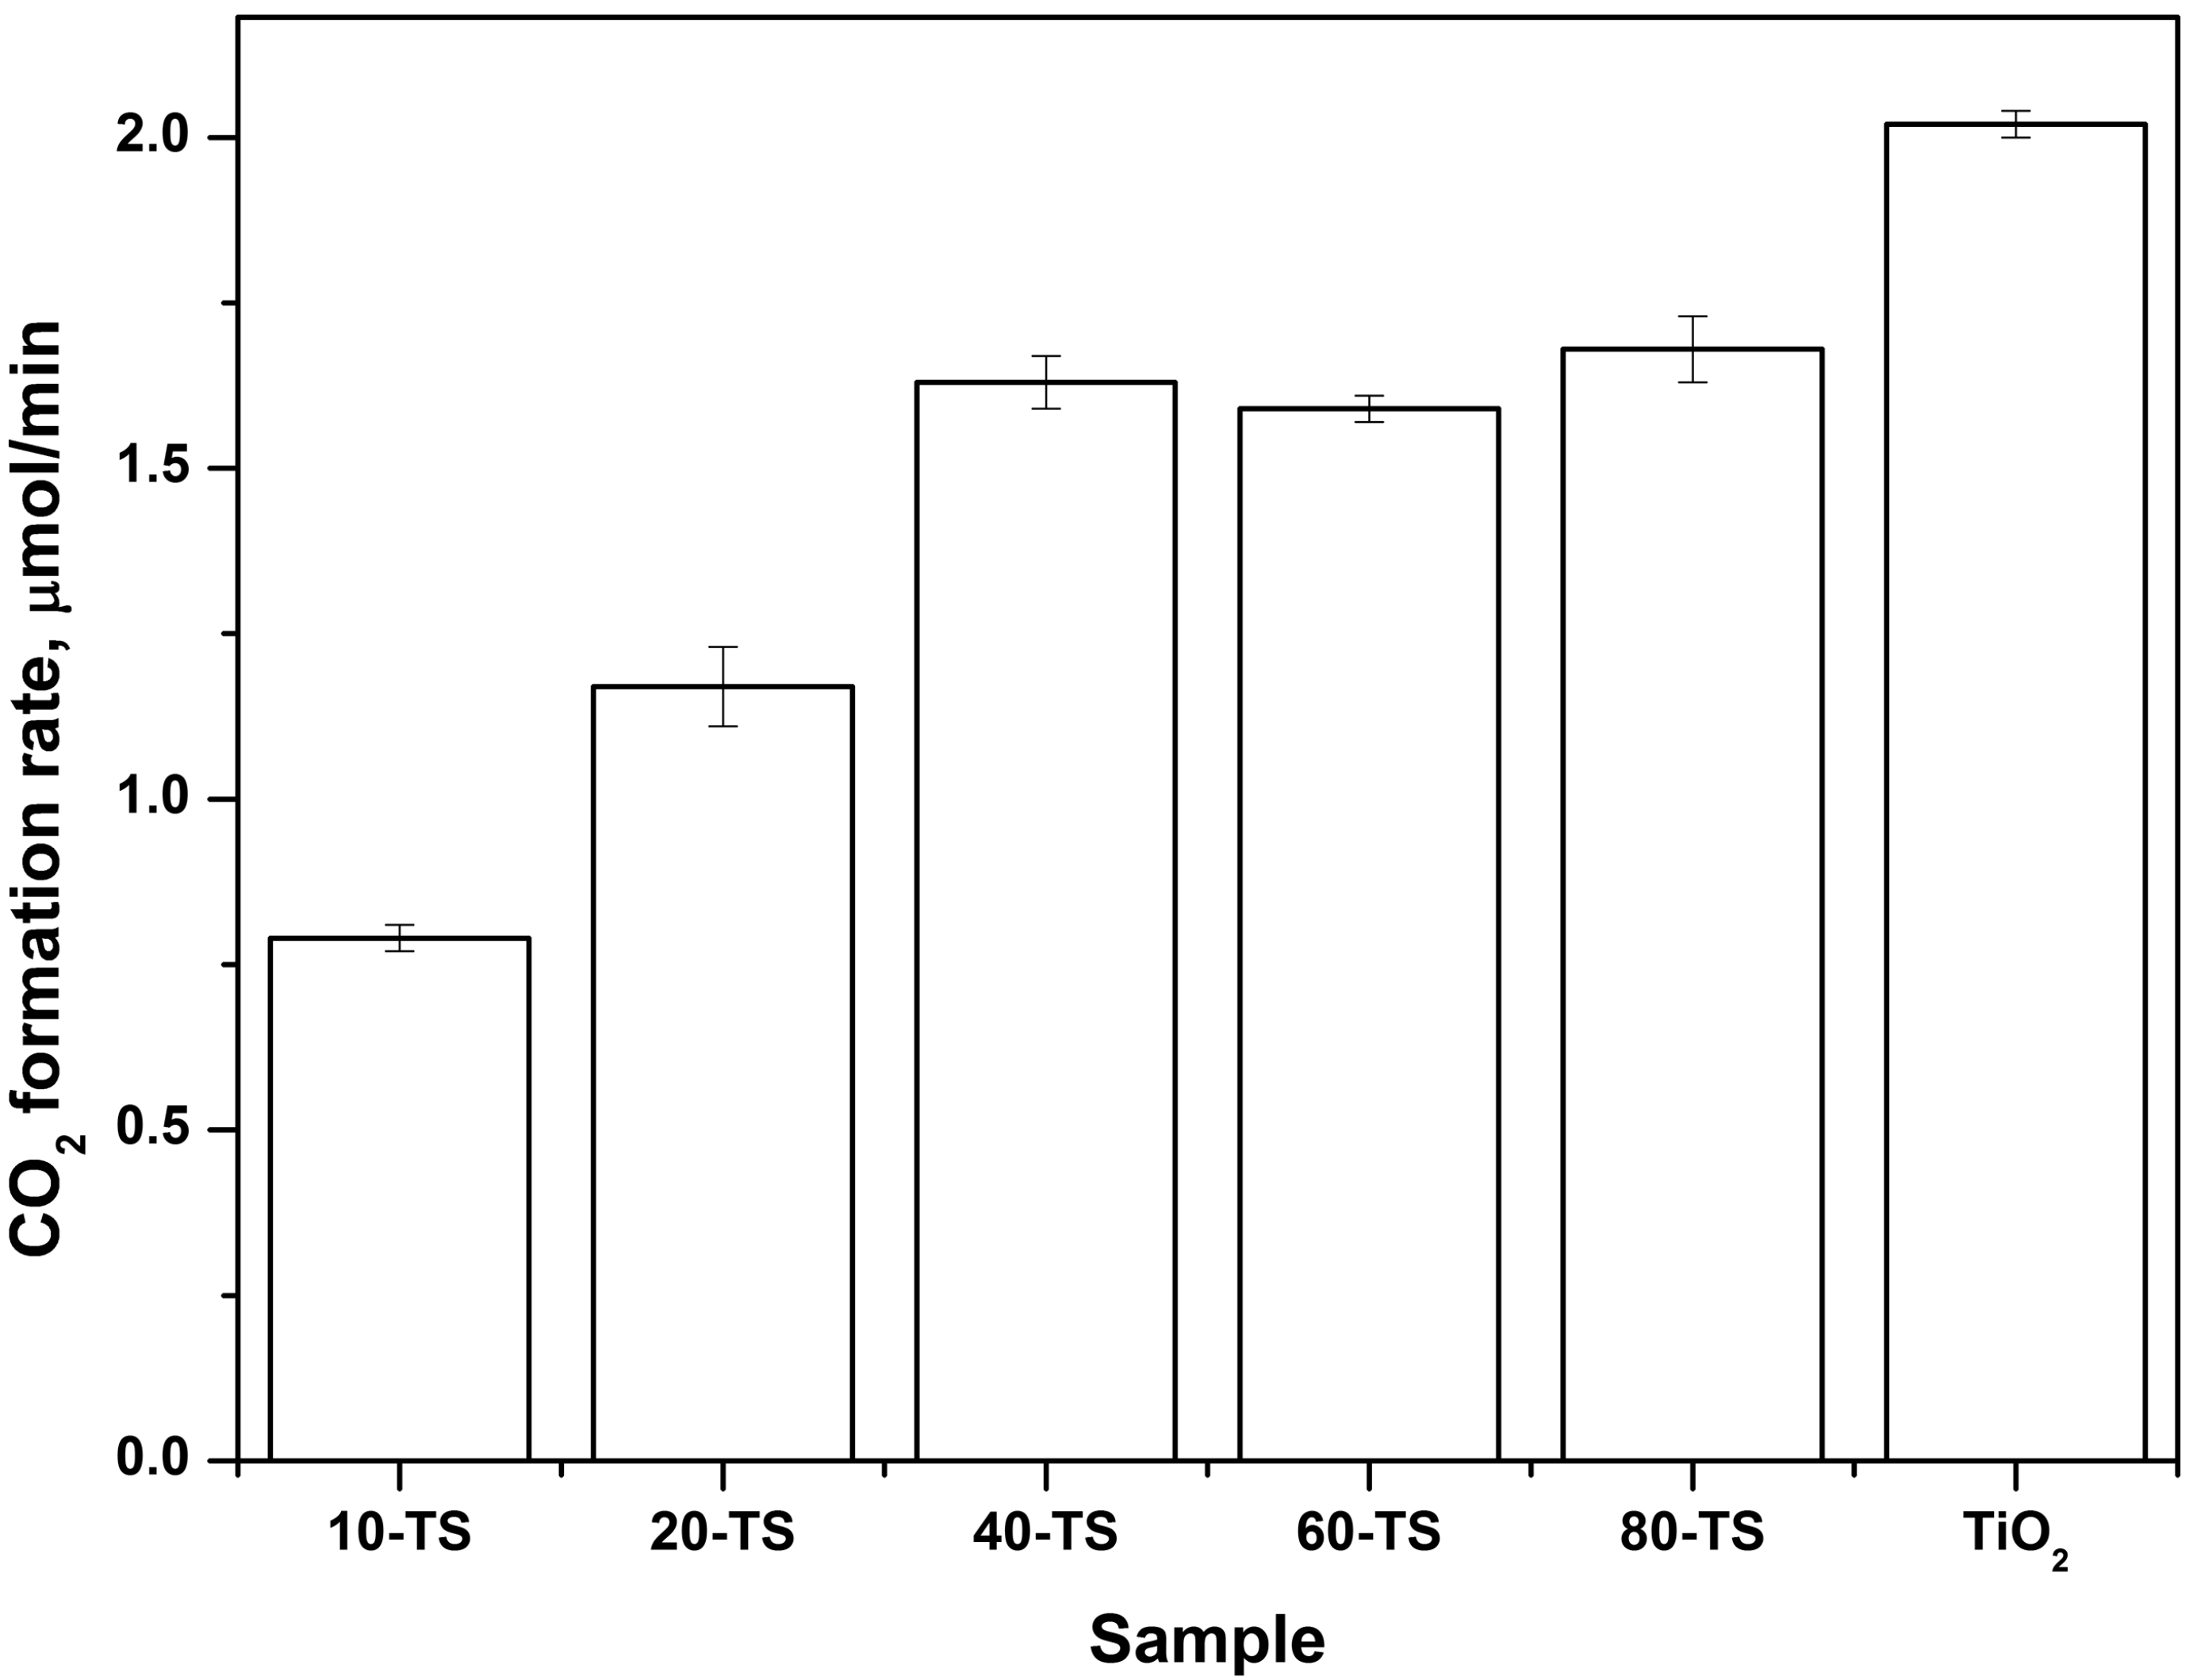
2.2.2. Effect of TiO2 Content on the Photocatalytic Activity of the TiO2/SiO2 Catalyst

Figure 5 demonstrates dependencies of the steady-state rate of CO2 formation during acetone oxidation over the TiO2/SiO2 photocatalysts. The quantity of catalysts on the glass supports in these experiments was 3 mg/cm2 in order to compare the highest possible photocatalytic activity of the samples.
Figure 5. Dependence of the CO2 formation rate during acetone PCO on the TiO2 content for TiO2/SiO2 series.
Molecules 19 21424 g005
All TiO2/SiO2 samples demonstrate high activity, even at a low TiO2 content, because silica does not absorb UV light. The CO2 formation rate for the 10-TS sample which contains 12 wt. % of TiO2 was 0.79 μmol/min and it was only 2.5 times lower than for a pure TiO2 sample.
The oxidation rate increases with the increase of TiO2 content and achieves almost the highest value for the 40-TS sample with 40 wt. % TiO2 content. The 60-TS and 80-TS samples have slightly higher activity and it means that at 40 wt. % TiO2 content SiO2 particles are already completely covered with the TiO2 particles. Therefore the following DES PCO experiments were conducted with the 40-TS sample which demonstrated high adsorption capacity due to its high content of porous support and at the same time high photocatalytic activity.

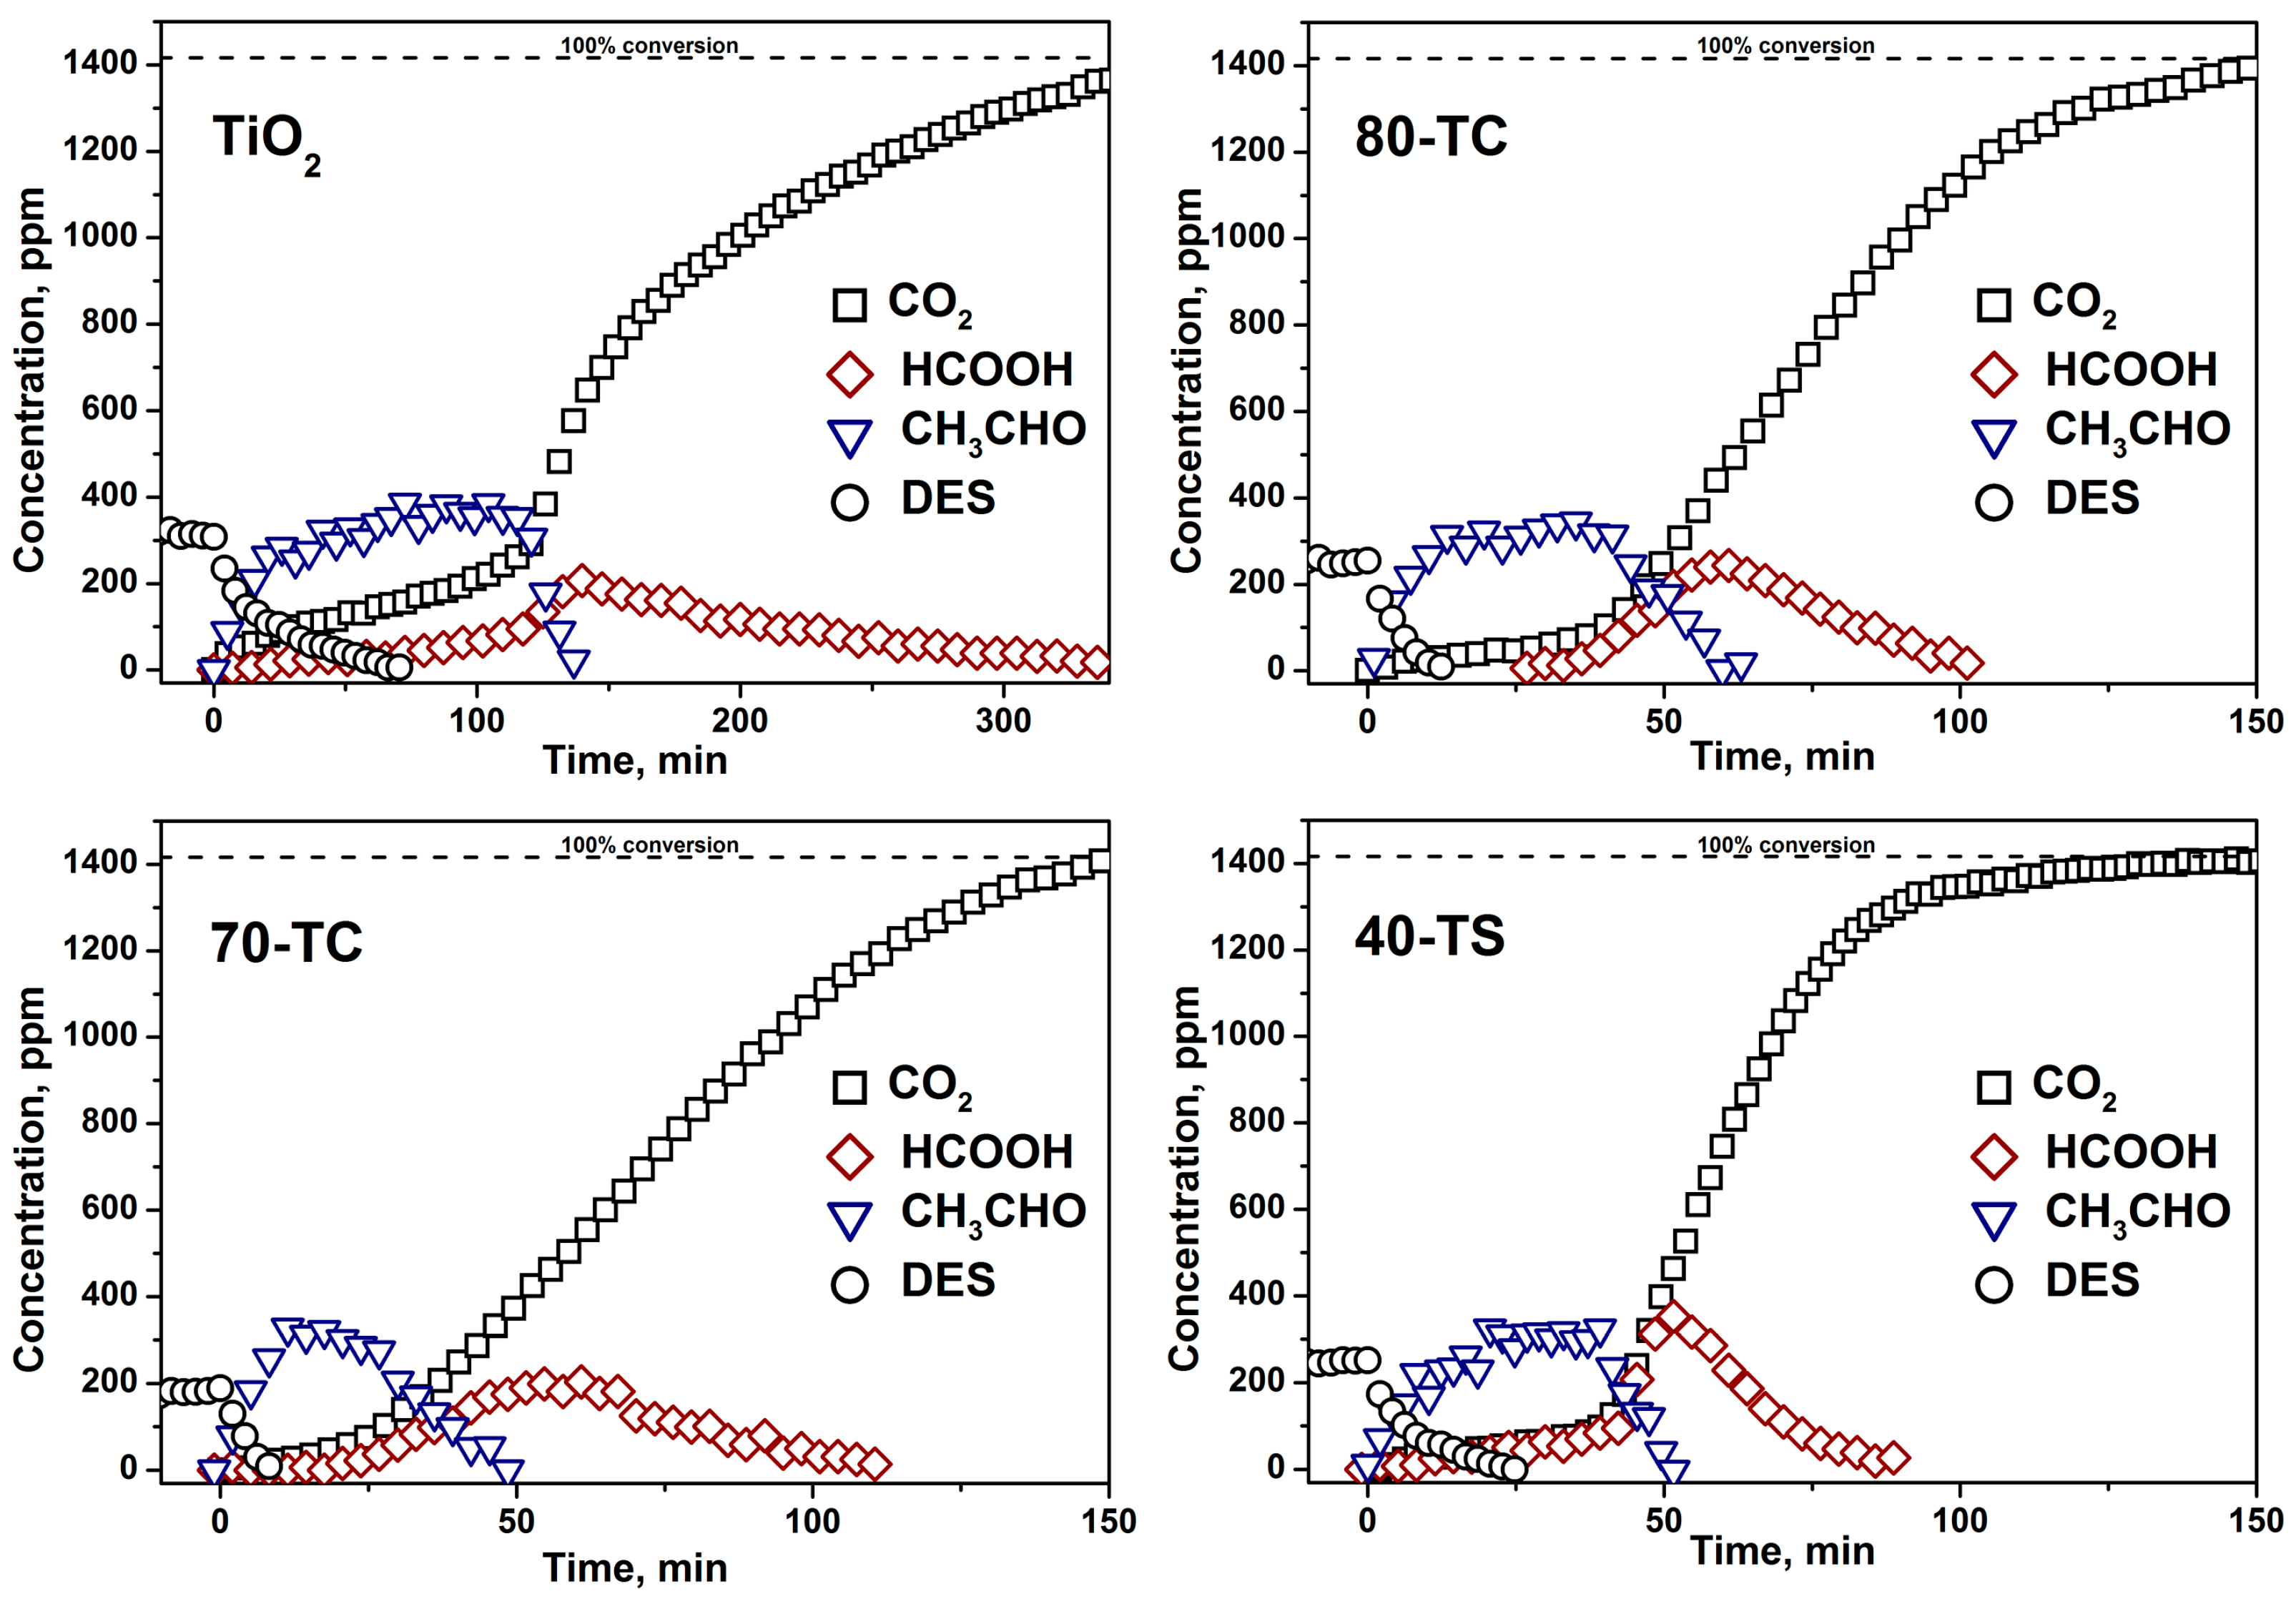
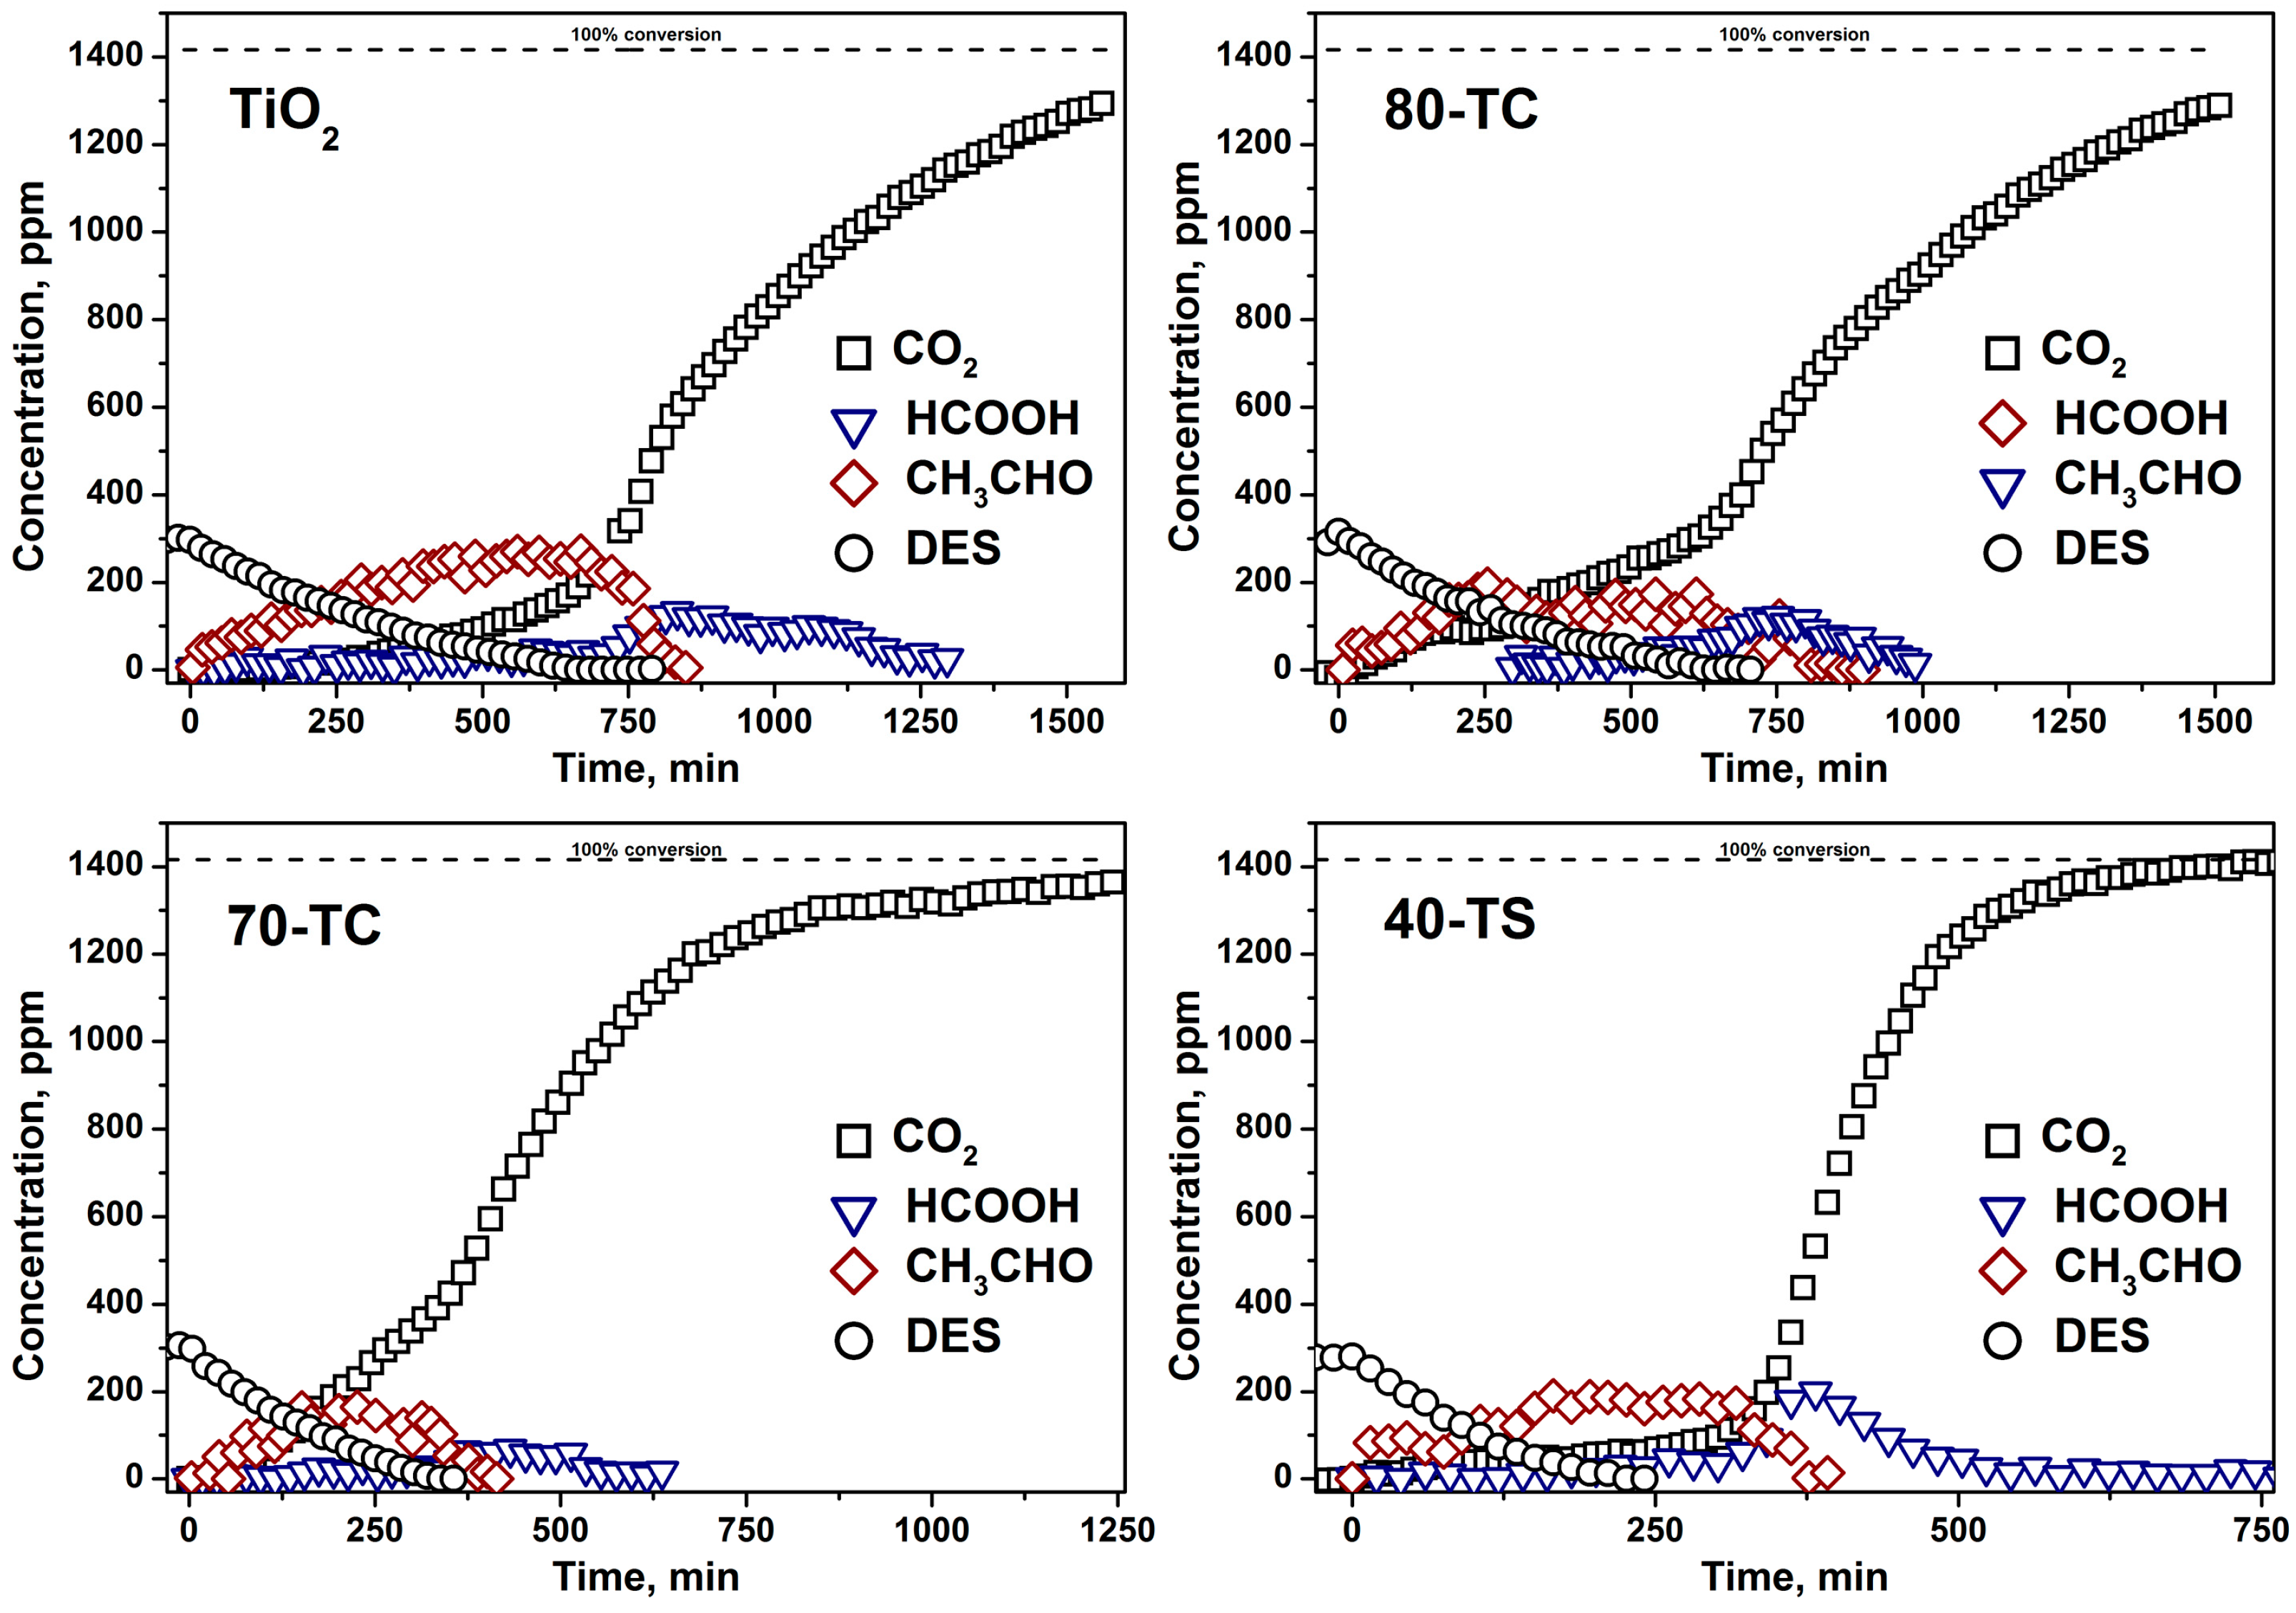
2.2.3. Kinetics of the DES PCO in a Static Reactor

The main objective of the experiments in the static reactor was to compare the kinetics of DES oxidation over pure TiO2 and composite TiO2/AC and TiO2/SiO2 photocatalysts and to compare the photocatalysts’ deactivation during three consecutive DES PCO cycles.
Composite 80-TC, 70-TC and 40-TS samples as well as pure TiO2 photocatalyst were chosen for these investigations. Sample quantities were correspondingly adjusted to 0.65, 0.73, 1.3, and 0.5 mg/cm2 for 80-TC, 70-TC, 40-TS and pure TiO2, so that the net TiO2 quantity was equal to 0.5 mg/cm2 in all cases. The same amount of active component (i.e., TiO2) placed in the reactor allowed us to carry out a valid comparison of photocatalyst deactivation for the samples with different TiO2 content and to estimate the effect of the support.
Н2O, CO2 and СO were detected as final gaseous oxidation products. The concentration of CO did not exceed the 55 ppm level and it was which much lower than the final CO2 concentration which was equal to about 1400 ppm. The final surface products of DES PCO were sulfate complexes. The accumulation of sulfates on the photocatalysts surface was confirmed by FT-IR analysis and it was the reason of irreversible photocatalysts deactivation.
Acetaldehyde (CH3CHO), formic acid (HCOOH), ethylene (C2H4) and SO2 were detected in the gas phase as intermediates of DES PCO. All intermediates were completely oxidized to final products during the long-term irradiation. Noticeable concentrations were detected only for acetaldehyde and formic acid, therefore their kinetic curves were discussed along with DES removal and CO2 accumulation kinetic curves.
SO2 was detected in the gas phase only during the first PCO cycle and its concentration did not exceed the 30-50 ppm level. Quantitative analysis of ethylene was not performed due to its low concentration.
Kinetic curves of DES, acetaldehyde, formic acid and CO2 during the first and the third cycle of 0.5 μL DES PCO in the static reactor over TiO2, 80-TC, 70-TC and 40-TS samples are presented in the Figure 6 and Figure 7, respectively.
Besides irreversible photocatalyst deactivation caused by attachment of sulfate ions to the photocatalyst surface, temporal deactivation was also observed. In the kinetic curves this is well illustrated by the intense accumulation of acetaldehyde in the gas phase and the increase of induction period for the CO2 kinetic curves in the beginning of PCO run (compare the same samples in Figure 6 and Figure 7).
The reason for this temporal deactivation is the formation of partial oxidation products like diethyl sulfoxide, diethyl sulfone and others [14,16]. These non-volatile compounds accumulate on the photocatalyst surface and hinder the PCO process. The continuous photocatalyst irradiation results in the gradual oxidation of surface non-volatile species making the catalyst surface available for further DES destruction. At this moment the fast removal of acetaldehyde from the gas phase and intensive accumulation of CO2 begin. Formation of formic acid in the gas phase during DES PCO could be explained by its low adsorption on the photocatalyst surface due to its low molecular weight.
Figure 6. Kinetics of 0.5 μL DES PCO in the static reactor during the first cycle over the pure TiO2, 80-TC, 70-TC and 40-TS samples.
Molecules 19 21424 g006
Figure 7. Kinetics of 0.5 μL DES PCO in the static reactor during the third cycle over the pure TiO2, 80-TC, 70-TC and 40-TS samples.
Molecules 19 21424 g007
After the long-term irradiation complete oxidation of all intermediates was observed and the final CO2 concentration reached the expected 1416 ppm value calculated from the mass balance.
The use of the composite photocatalyst increases the available surface. As a result the DES removal rate and kinetics of photooxidation change. A decrease of the time needed for complete removal of DES vapor from the gas phase was observed for the composite photocatalysts. For example, in the first oxidation cycle the time values of DES removal were 73, 14, 9 and 22 min for TiO2, 80-TC, 70-TC and 40-TS samples, respectively. The increase of the rate of DES removal can be explained by reversible transfer of non-volatile intermediates from the TiO2 surface onto the support surface (AC or SiO2). As a result active sites on the TiO2 surface remained free for further interaction with DES molecules. This effect was discussed in our previous work [20].
The fast DES removal in the case of composite photocatalysts led to a decrease of the induction period of CO2 accumulation by about 2-fold (Figure 6). The initial rate of CO2 accumulation after the induction period in the first oxidation cycle was 18.9, 18.7, 14.7 and 33.2 ppm/min for TiO2, 80-TC, 70-TC and 40-TS samples, respectively. In contrast to the composite photocatalyst the CO2 accumulation rate over pure TiO2 sample was declining strongly with the increase of reaction time. As in the case of acetone PCO, the 40-TS demonstrated the highest activity in the DES PCO.
In each subsequent oxidation cycle over the same sample a decrease of DES PCO rate was observed. As a result in the third cycle the times of complete DES removal were 600, 550, 315 and 220 min, respectively, for the pure TiO2, 80-TC, 70-TC and 40-TS samples (Figure 7). This means that a strong deactivation of the samples occurs. To estimate the extent of photocatalyst deactivation the time of 90% DES mineralization was calculated in each cycle. Calculated times for all samples in each oxidation cycle are presented in Figure 8.
Figure 8. Time values of 90% DES conversion into CO2 in three oxidation cycles for pure TiO2 and TiO2/adsorbent composite photocatalysts.
Molecules 19 21424 g008
As it follows from Figure 8, the time of the complete mineralization of DES becomes higher for each subsequent PCO cycle. For example, for the pure TiO2 sample in the first cycle the reaction was complete after 290 min, but in the third cycle it took 1522 min. Photocatalyst deactivation is decreasing in the following sequence: TiO2 > 80-TC > 70-TC > 40-TS. For example, the sum of mineralization times in all three cycles for the pure TiO2 sample is equal to 2848 min but for the most active and stable composite 40-TS photocatalyst it is only 800 min.
The excellent behavior of the 40-TS sample in the DES PCO can be explained by its high photocatalytic activity and large surface area which is available for the adsorption of intermediates. TiO2/AC samples are less active than the 40-TS sample, but are still better than pure TiO2 samples. It should be noted that the 70-TC sample demonstrated lower deactivation than the 80-TC sample due to its higher content of AC. In addition, the lowest concentration of gaseous intermediates, acetaldehyde and formic acid among all synthesized samples, was also observed for the 70-TC sample.
Decrease of deactivation in the case of composite photocatalyst as well as the increase of DES removal rates can be explained by reversible transfer of non-volatile intermediates, which are the reason of deactivation, from TiO2 particles onto the support [20]. Another possible explanation for the increased activity of the composite photocatalysts is the possible transfer of OH radicals from TiO2 onto the support surface. Such a possibility was shown by Carretero-Genevrier et al. [36], who demonstrated that OH radicals could migrate up to 10 nm distance from TiO2 surface into the SiO2 matrix.
Finally, turnover frequency (TOF) was calculated for all samples. The total amount of mineralized DES for three consecutive runs was 3 × 0.5 = 1.5 μL or 8 × 10¹⁸ molecules. For all samples the amount of active component (i.e., TiO2) was the same—3.5 mg. To estimate the surface active sites concentration we used the value of 5 × 10¹⁴ a.s./cm2 proposed by Ollis in 1980 [37].
Based on these data it is possible to calculate the total number of active sites:
5   ×   10 14 a . s . 10 4 m 2 × 208 m 2 g × 0 . 0035 g = 3 . 6 × 10 18   a . s .
The TiO2 specific surface area from Table 1 was used for estimation of the active surface area because these experiments were performed at low sample quantity and we supposed that the entire photocatalyst surface was irradiated. The total time of complete DES mineralization was calculated as the sum of mineralization times in three consecutive PCO cycles presented in the Figure 8.
The estimated TON values are 1.3 × 10⁻⁵, 1.9 × 10⁻⁵, 3.0 × 10⁻⁵ and 4.6 × 10⁻⁵ s−1 for TiO2, 80-TC, 70-TC and 40-TS samples, respectively. The TOF value for 40-TS composite photocatalyst is 3.5 times higher than for pure TiO2 sample. Fast purification of air from the DES vapor over composite TiO2/SiO2 photocatalyst and its low deactivation during the long-term oxidation can thus be used for the development of purification methods against S-containing CWAs.

3. Experimental Section

3.1. Materials

The following chemical reagents were used for the catalyst preparation and oxidation experiments: titanyl sulfate (TiOSO4∙2H2O, >98%, Vekton, St. Petersburg, Russia), sulfuric acid (H2SO4, 93.5%–95.6%, PKF Ant, Russia), acetone (CH3COCH3, >99.8%, Mosreaktiv, Moscow, Russia), DES (C2H5SC2H5, >98%, Fluka, Buchs, Switzerland). The reagents were used as supplied without further purification.
Activated carbon (AC) obtained by steam-gas activation of wood matter with SBET = 825 m2/g and silica with SBET = 440 m2/g and particle size of 10–40 μm were used for immobilization of TiO2 particles. AC powder (Sorbent, Perm, Russia) was boiled before synthesis in distilled water during several hours to remove ionic impurities and finally washed out thoroughly by deionized water. Silica powder was supplied from Sigma-Aldrich (St. Louis, MO, USA) and used without any treatments. Titanyl sulfate water solution with a concentration of approximately 10 wt. % was used for TiO2 deposition by the thermal hydrolysis method.

3.2. Synthesis of the Composite Photocatalyst

Composite photocatalysts were synthesized by thermal hydrolysis of TiOSO4 according to the procedure described in details previously [22]. Typically, a certain amount of activated carbon or silica powder was suspended in a titanyl sulfate water solution (300 mL) and boiled for 5 hours under constant mixing. The calculated TiO2 content in the sample was varied in the range of 65–80 wt. % for AC-containing samples and 10–80 wt. % for SiO2-containing samples. The TiO2 content was adjusted by adding a certain amount of support to 300 mL of TiOSO4 solution. The samples containing AC or silica were marked as X-TC or X-TS correspondingly, where X was the TiO2 content (wt. %). The reference TiO2 sample was synthesized by the same procedure without addition of support (AC or silica) and marked as TiO2.

3.3. Characterization Method

The Ti content in the synthesized samples was determined by atomic emission spectroscopy using an Optima 4300 DV spectrometer (PerkinElmer, Waltham, MA, USA). Content of TiO2 was recalculated using these results according to the stoichiometric formula of oxides. The surface area and pore volume of the samples were measured by nitrogen adsorption at 77 K using the ASAP 2020 instrument (Micromeritics, Norcross, GA, USA). The specific surface area was calculated using the BET analysis and the pore volume was determined as total pore volume at P/P0~1. X-ray diffraction was applied to determine crystal phase composition and size of crystalline particles. XRD patterns were recorded using a D8 Advance (Bruker AXS GmbH, Karlsruhe, Germany) diffractometer with CuKα radiation. The calculation of coherent-scattering domains size was performed using the Scherrer equation:
< D > = K λ Δ ( 2 θ ) c o s θ
with K equaled to 1.
The surface of samples and initial supports were investigated by FT-IR analysis using attenuated total reflectance technique. IR spectra of sample surface were registered using a Varian 640-IR FT-IR spectrometer (Varian Inc., Palo Alto, CA, USA) equipped by the ATR attachment. Samples were not treated in any way before analysis.

3.4. Kinetic Experiments

3.4.1. Acetone Oxidation

Acetone oxidation was investigated in the continuous flow unit described in details previously [38]. The continuous flow unit was equipped by an IR long-path gas cell (Infrared Analysis Inc., Anaheim, CA, USA) installed in a FT801 FT-IR spectrometer (Simex, Novosibirsk, Russia). Standard operational parameters were the following: acetone concentration—20 ± 4 μmol/L, temperature—40 °C, relative humidity—22% ± 2%, volumetric flow rate (U)—0.058 L/min. Detailed information about the effect of acetone concentration on the oxidation rate in the continuous flow unit is presented in Figure S1 in the Supplementary Information.
A certain amount of sample was uniformly deposited on a glass support of 9.1 cm2 surface area and irradiated with UV light produced by a UV LED (Nichia, Tokushima, Japan) with λmax ~373 nm. The sample irradiance in the 320–400 nm region was 9.7 mW/cm2. The measurement of light intensity was performed using a Spectrilight spectroradiometer (International Light Technologies, Peabody, MA, USA). The emission spectrum of the UV LED is presented in Figure S2 in the Supplementary Information section.
The concentration of acetone and CO2 in the reaction mixture was calculated from the FT-IR spectra using the integral form of the Beer-Lambert law:
ω 1 ω 2 A ( ω ) d ω = ε × l × C
where A ( ω ) = lg ( I 0 ( ω ) I ( ω ) ) —absorbance, ω1 and ω2—limit of the corresponding absorption band (cm−1), ε —coefficient of extinction (L·μmol−1·cm−2), l—optical path length (cm), C—gas phase concentration (μmol/L).
The rate of CO2 formation was used to evaluate photocatalytic activity and was calculated according to the following formula:
W C O 2 = Δ   C C O 2 × U
where Δ C C O 2 is the difference in CO2 concentrations in the outlet and inlet air streams of the reactor and U is the volumetric flow rate.

3.4.2. DES Oxidation

Oxidation of the DES vapor was investigated in a 0.3 L static reactor installed in the cell compartment of a Nicolet 380 FT-IR spectrometer (Thermo Fisher Scientific Inc., Waltham, MA, USA). A detailed description of the experimental setup was presented in our previous work [22].
The sample was uniformly deposited onto a 7.0 cm2 glass support which was placed in the reactor and irradiated with UV light produced by the UV LED described above during several hours in order to completely oxidize all organic species previously adsorbed on the catalyst surface during its storage. The sample irradiance in the 320–400 nm region was 10.2 mW/cm2.
After sample training 0.5 μL of liquid DES was injected into the reactor and evaporated during 30 min to achieve adsorption-desorption equilibrium. Then the UV LED was turned on and IR spectra were taken periodically. Concentrations of DES and other oxidation products in the gas phase were calculated using the Beer-Lambert law described above. The details of the quantitative calculations using IR spectra can be found in [39]. The IR spectra of individual substances which were detected in the gas phase during the DES PCO and other information which was used for calculation of extinction coefficients for each substance are presented in the Supplementary Information section in Figure S3 and Table S1.
After complete mineralization of DES in the reactor (i.e., when the amount of accumulated CO2 reached the expected level calculated from the stoichiometric equations) the reactor was swept with fresh air and the next DES oxidation cycle was performed. Three oxidation cycles of the same amount of DES were performed for each sample.

4. Conclusions

Composite TiO2/adsorbent photocatalysts were synthesized by the TiOSO4 thermal hydrolysis method in the presence of activated carbon or SiO2 and were tested in the photocatalytic oxidation of acetone and DES vapor. The following conclusions were made:
(1)
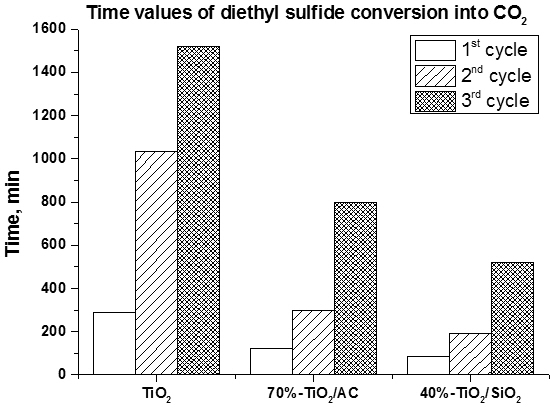
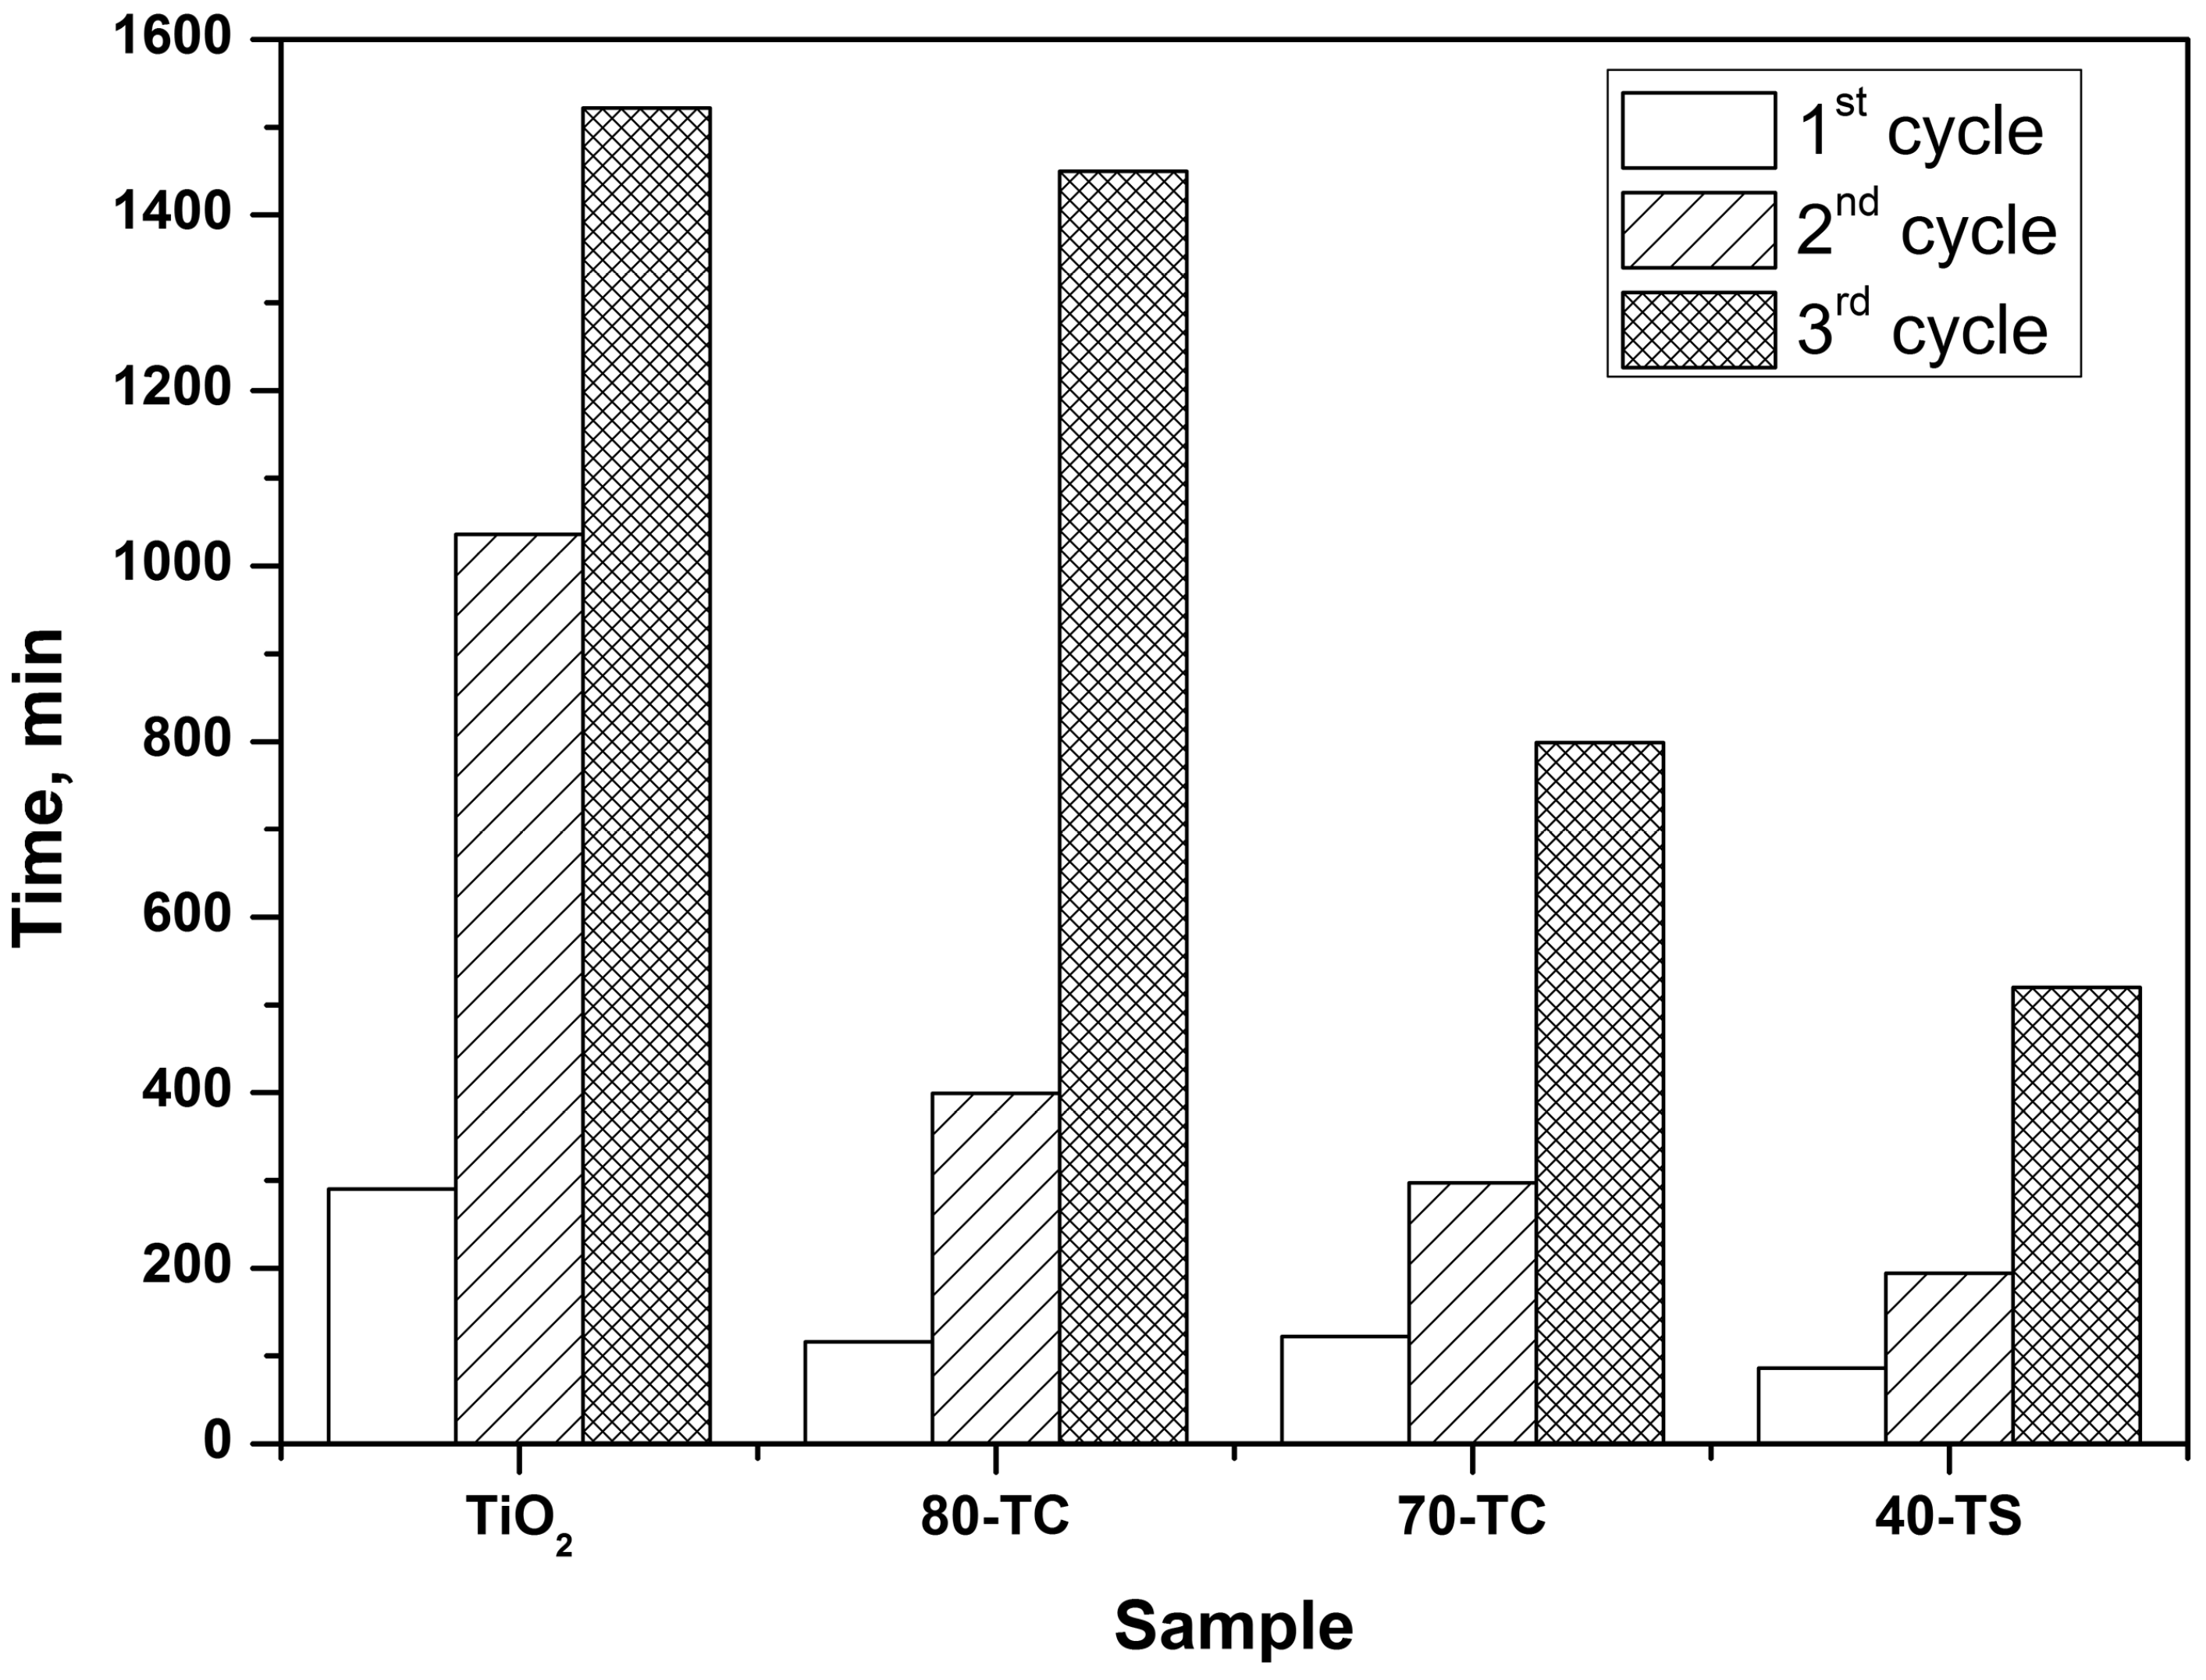
The usage of composite photocatalyst results in up to an 8-fold decrease of DES removal time if compared with pure unmodified TiO2. This could be explained by an increase of the available surface area in the case of composite photocatalyst and reversible transfer of non-volatile intermediates from TiO2 surface to the support surface thus keeping the photocatalyst surface available for further interaction with substrate. Additionally the removal of intermediates—acetaldehyde and formic acid—occurs faster over composite photocatalyst;
(2)
The long-term oxidation of DES leads to a strong deactivation of the photocatalyst. The deactivation decreases in the following sequence: TiO2>TiO2/AC>TiO2/SiO2. The most active and stable catalyst is the TiO2/SiO2 one which contains 40 wt. % of TiO2. The calculated TOF number for this sample is 3.5 times higher than for pure TiO2.

Supplementary Materials

Supplementary materials can be accessed at: https://www.mdpi.com/1420-3049/19/12/21424/s1.

Acknowledgments

The work was performed with support of the Skolkovo Foundation (Grant Agreement for Russian educational organization №1 on 28.11.2013).

Author Contributions

Dmitry Selishchev synthesized the photocatalysts and performed experiments; Dmitry Selishchev and Denis Kozlov analyzed the data and wrote the manuscript. All authors read and approved the final version of the manuscript.

Conflicts of Interest

The authors declare no conflict of interest.

References

  1. Watson, A.P.; Griffin, G.D. Toxicity of vesicant agents scheduled for destruction by the Chemical Stockpile Disposal Program. Environ. Health Perspect. 1992, 98, 259–280. [Google Scholar] [CrossRef] [PubMed]
  2. Munro, N.B.; Watson, A.P.; Ambrose, K.R.; Griffin, G.D. Treating exposure to chemical warfare agents: Implications for health care providers and community emergency planning. Environ. Health Perspect. 1990, 89, 205–215. [Google Scholar] [CrossRef] [PubMed]
  3. Munro, N. Toxicity of the organophosphate chemical warfare agents GA, GB, and VX: Implications for public protection. Environ. Health Perspect. 1994, 102, 18–38. [Google Scholar] [CrossRef] [PubMed]
  4. Perry Robinson, J.P. (Ed.) Public Health Response to Biological and Chemical Weapons: WHO Guidance, 2nd ed.; World Health Organization: Geneva, Switzerland, 2004; p. 340.
  5. Ivarsson, U.; Nilsson, H.; Santesson, J. A FOA Briefing book on Chemical Weapons: Threat, Effects, and Protection; National Defence Research Establishment: Umea, Sweden, 1992. [Google Scholar]
  6. Alexandrov, V.N.; Emel’yanov, V.I. Poisonous Compounds (in Russian); Voenizdat: Moscow, Russia, 1990; p. 271. [Google Scholar]
  7. Yang, Y.C.; Baker, J.A.; Ward, J.R. Decontamination of chemical warfare agents. Chem. Rev. 1992, 92, 1729–1743. [Google Scholar] [CrossRef]
  8. Zuo, G.M.; Cheng, Z.X.; Li, G.W.; Wang, L.Y.; Miao, T. Photoassisted Reaction of Sulfur Mustard under UV Light Irradiation. Environ. Sci. Technol. 2005, 39, 8742–8746. [Google Scholar] [CrossRef] [PubMed]
  9. Zuo, G.M.; Cheng, Z.X.; Li, G.W.; Shi, W.P.; Miao, T. Study on photolytic and photocatalytic decontamination of air polluted by chemical warfare agents (CWAs). Chem. Eng. J. 2007, 128, 135–140. [Google Scholar] [CrossRef]
  10. Bhatkhande, D.S.; Pangarkar, V.G.; Beenackers, A.A. Photocatalytic degradation for environmental applications—A review. J. Chem. Technol. Biotechnol. 2002, 77, 102–116. [Google Scholar] [CrossRef]
  11. Martyanov, I.N.; Klabunde, K.J. Photocatalytic Oxidation of Gaseous 2-Chloroethyl Ethyl Sulfide over TiO2. Environ. Sci. Technol. 2003, 37, 3448–3453. [Google Scholar] [CrossRef] [PubMed]
  12. Fox, M.A.; Kim, Y.S.; Abdel-Wahab, A.A.; Dulay, M. Photocatalytic decontamination of sulfur-containing alkyl halides on irradiated semiconductor suspensions. Catal. Lett. 1990, 5, 369–376. [Google Scholar] [CrossRef]
  13. Vorontsov, A.V.; Panchenko, A.A.; Savinov, E.N.; Lion, C.; Smirniotis, P.G. Photocatalytic Degradation of 2-Phenethyl-2-chloroethyl Sulfide in Liquid and Gas Phases. Environ. Sci. Technol. 2002, 36, 5261–5269. [Google Scholar] [CrossRef] [PubMed]
  14. Kozlov, D.; Vorontsov, A.; Smirniotis, P.; Savinov, E. Gas-phase photocatalytic oxidation of diethyl sulfide over TiO2: Kinetic investigations and catalyst deactivation. Appl. Catal. B Environ. 2003, 42, 77–87. [Google Scholar] [CrossRef]
  15. González-Garcı́a, N.; Ayllón, J.A.; Doménech, X.; Peral, J. TiO2 deactivation during the gas-phase photocatalytic oxidation of dimethyl sulfide. Appl. Catal. B Environ. 2004, 52, 69–77. [Google Scholar] [CrossRef]
  16. Vorontsov, A.V.; Savinov, E.V.; Davydov, L.; Smirniotis, P.G. Photocatalytic destruction of gaseous diethyl sulfide over TiO2. Appl. Catal. B Environ. 2001, 32, 11–24. [Google Scholar] [CrossRef]
  17. Vorontsov, A. TiO2 reactivation in photocatalytic destruction of gaseous diethyl sulfide in a coil reactor. Appl. Catal. B Environ. 2003, 44, 25–40. [Google Scholar] [CrossRef]
  18. Vorontsov, A.V. Photocatalytic transformations of organic sulfur compounds and H2S. Russ. Chem. Rev. 2008, 77, 909–926. [Google Scholar] [CrossRef]
  19. Vorontsov, A.V.; Besov, A.S.; Parmon, V.N. Fast purification of air from diethyl sulfide with nanosized TiO2 aerosol. Appl. Catal. B Environ. 2013, 129, 318–324. [Google Scholar] [CrossRef]
  20. Selishchev, D.; Kolinko, P.; Kozlov, D. Adsorbent as an essential participant in photocatalytic processes of water and air purification: Computer simulation study. Appl. Catal. A Gen. 2010, 377, 140–149. [Google Scholar] [CrossRef]
  21. Leary, R.; Westwood, A. Carbonaceous nanomaterials for the enhancement of TiO2 photocatalysis. Carbon 2011, 49, 741–772. [Google Scholar] [CrossRef]
  22. Selishchev, D.S.; Kolinko, P.A.; Kozlov, D.V. Influence of adsorption on the photocatalytic properties of TiO2/AC composite materials in the acetone and cyclohexane vapor photooxidation reactions. J. Photochem. Photobiol. A Chem. 2012, 229, 11–19. [Google Scholar] [CrossRef]
  23. Bouazza, N.; Lillo-Ródenas, M.A.; Linares-Solano, A. Photocatalytic activity of TiO2-based materials for the oxidation of propene and benzene at low concentration in presence of humidity. Appl. Catal. B Environ. 2008, 84, 691–698. [Google Scholar] [CrossRef]
  24. Pucher, P.; Benmami, M.; Azouani, R.; Krammer, G.; Chhor, K.; Bocquet, J.F.; Kanaev, A.V. Nano-TiO2 sols immobilized on porous silica as new efficient photocatalyst. Appl. Catal. A Gen. 2007, 332, 297–303. [Google Scholar] [CrossRef]
  25. Kitano, M.; Matsuoka, M.; Ueshima, M.; Anpo, M. Recent developments in titanium oxide-based photocatalysts. Appl. Catal. A Gen. 2007, 325, 1–14. [Google Scholar] [CrossRef]
  26. Xu, Y.; Langford, C.H. Photoactivity of titanium dioxide supported on MCM-41, zeolite X, and zeolite Y. J. Phys. Chem. B 1997, 101, 3115–3121. [Google Scholar] [CrossRef]
  27. Liu, S.X.; Chen, X.Y.; Chen, X. A TiO2/AC composite photocatalyst with high activity and easy separation prepared by a hydrothermal method. J. Hazard. Mater. 2007, 143, 257–263. [Google Scholar] [CrossRef] [PubMed]
  28. Takeda, N.; Iwata, N.; Torimoto, T.; Yoneyama, H. Influence of carbon black as an adsorbent used in TiO2 photocatalyst films on photodegradation behaviors of propyzamide. J. Catal. 1998, 177, 240–246. [Google Scholar] [CrossRef]
  29. Anderson, C.; Bard, A.J. An Improved Photocatalyst of TiO2/SiO2 Prepared by a Sol-Gel Synthesis. J. Phys. Chem. 1995, 99, 9882–9885. [Google Scholar] [CrossRef]
  30. Kolinko, P.A.; Smirniotis, P.G.; Kozlov, D.V.; Vorontsov, A.V. Cr modified TiO2-loaded MCM-41 catalysts for UV-light driven photodegradation of diethyl sulfide and ethanol. J. Photochem. Photobiol. A Chem. 2012, 232, 1–7. [Google Scholar] [CrossRef]
  31. Panayotov, D.; Yates, J.T. Bifunctional Hydrogen Bonding of 2-Chloroethyl Ethyl Sulfide on TiO2-SiO2 Powders. J. Phys. Chem. B 2003, 107, 10560–10564. [Google Scholar] [CrossRef]
  32. Panayotov, D.A.; Paul, D.K.; Yates, J.T. Photocatalytic Oxidation of 2-Chloroethyl Ethyl Sulfide on TiO2-SiO2 Powders. J. Phys. Chem. B 2003, 107, 10571–10575. [Google Scholar] [CrossRef]
  33. Panayotov, D.; Kondratyuk, P.; Yates, J.T. Photooxidation of a Mustard Gas Simulant over TiO2-SiO2 Mixed-Oxide Photocatalyst: Site Poisoning by Oxidation Products and Reactivation. Langmuir 2004, 20, 3674–3678. [Google Scholar] [CrossRef] [PubMed]
  34. Ito, S.; Inoue, S.; Kawada, H.; Hara, M.; Iwasaki, M.; Tada, H. Low-Temperature Synthesis of Nanometer-Sized Crystalline TiO2 Particles and Their Photoinduced Decomposition of Formic Acid. J. Colloid Interface Sci. 1999, 216, 59–64. [Google Scholar] [CrossRef] [PubMed]
  35. Saur, O. The structure and stability of sulfated alumina and titania. J. Catal. 1986, 99, 104–110. [Google Scholar] [CrossRef]
  36. Carretero-Genevrier, A.; Boissiere, C.; Nicole, L.; Grosso, D. Distance dependence of the photocatalytic efficiency of TiO2 revealed by in situ ellipsometry. J. Am. Chem. Soc. 2012, 134, 10761–10764. [Google Scholar] [CrossRef] [PubMed]
  37. Childs, L.; Ollis, D. Is photocatalysis catalytic? J. Catal. 1980, 66, 383–390. [Google Scholar] [CrossRef]
  38. Korovin, E.; Selishchev, D.; Besov, A.; Kozlov, D. UV-LED TiO2 photocatalytic oxidation of acetone vapor: Effect of high frequency controlled periodic illumination. Appl. Catal. B Environ. 2015, 163, 143–149. [Google Scholar] [CrossRef]
  39. Kozlov, D.; Besov, A. Method of Spectral Subtraction of Gas-Phase Fourier Transform Infrared (FT-IR) Spectra by Minimizing the Spectrum Length. Appl. Spectrosc. 2011, 65, 918–923. [Google Scholar] [CrossRef] [PubMed]
  • Sample Availability: Samples are available from authors.

