
Dose-Dependent Neuroprotective Effects of Bovine Lactoferrin Following Neonatal Hypoxia–Ischemia in the Immature Rat Brain


Abstract
: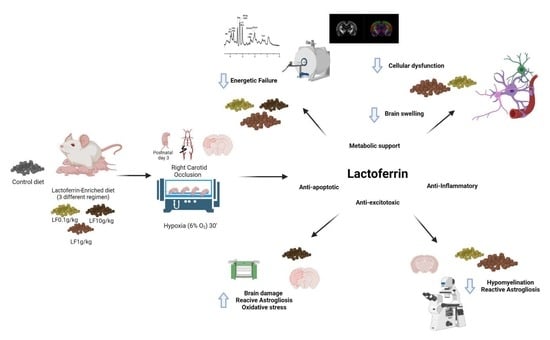
1. Introduction
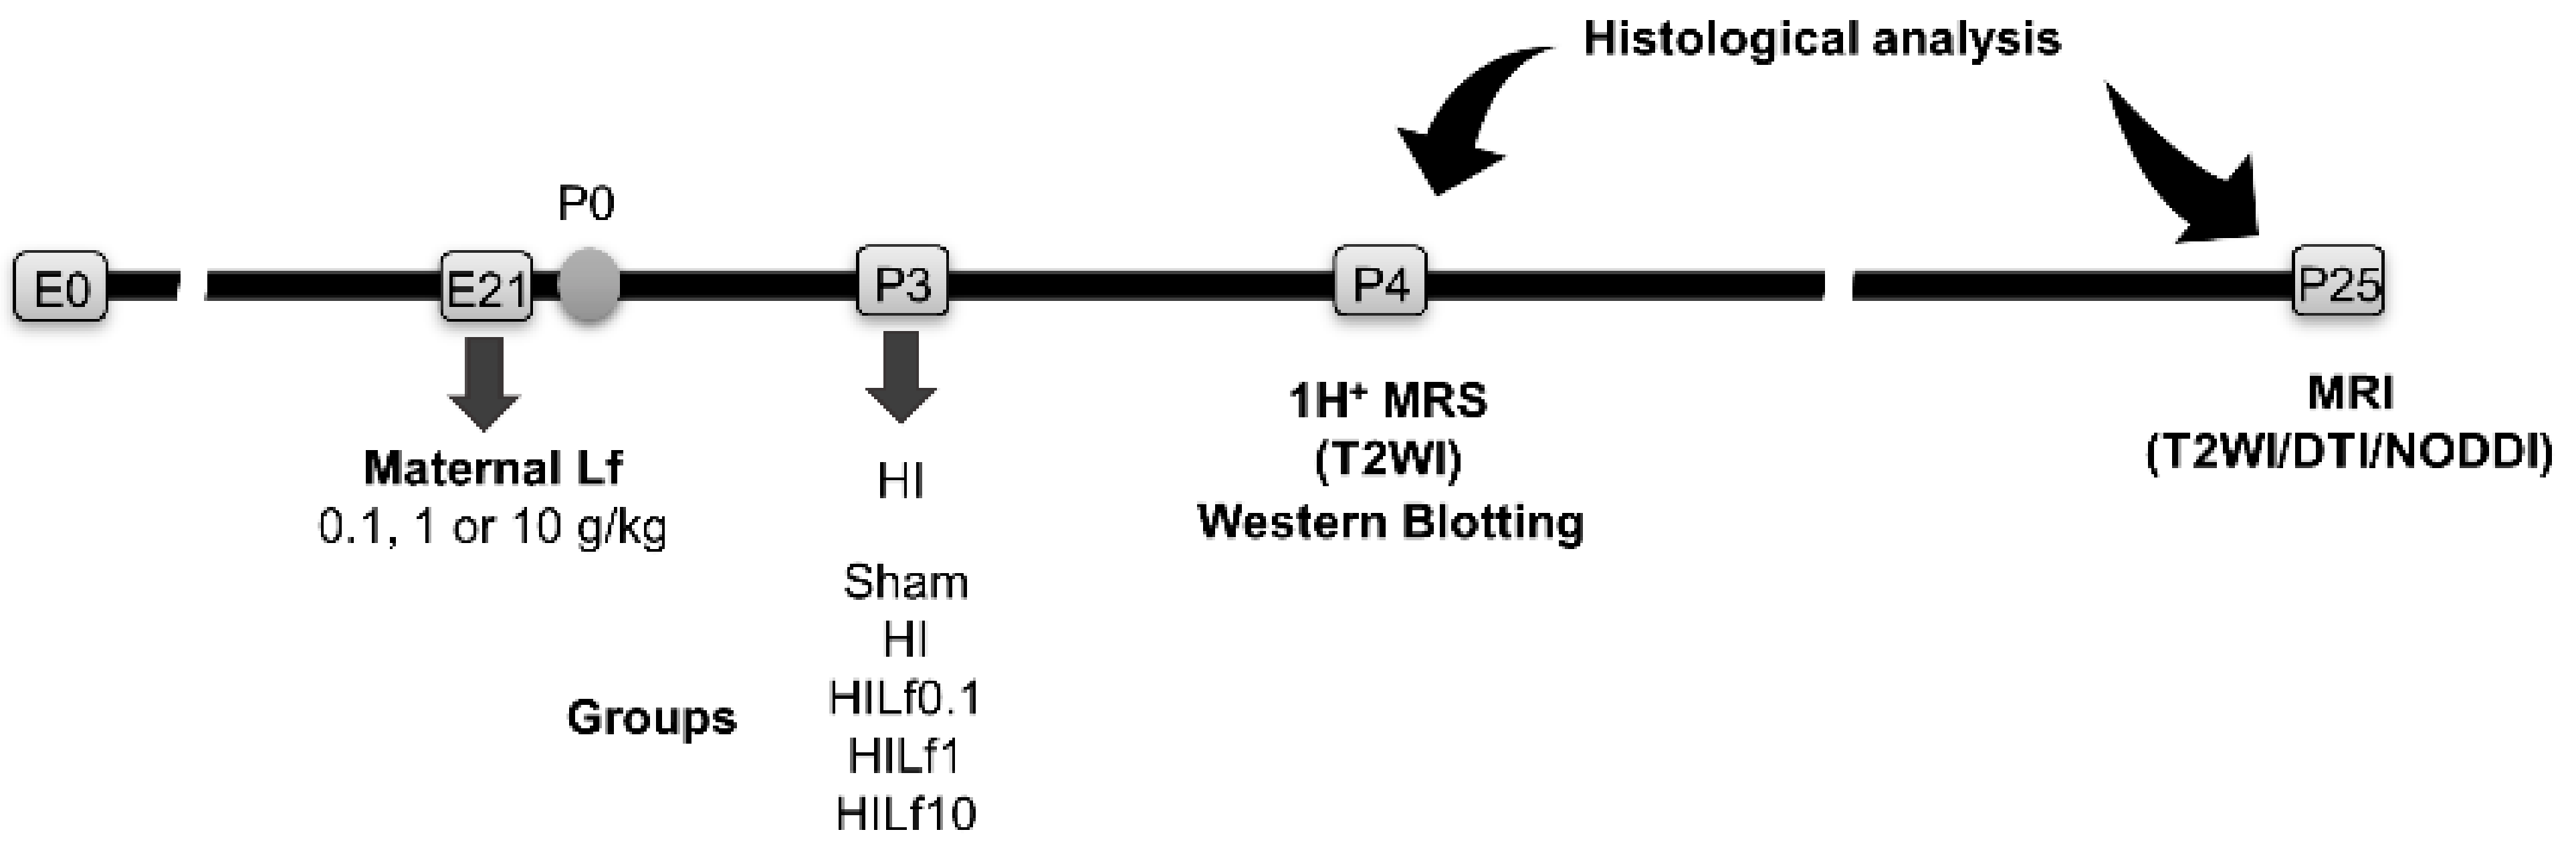
2. Material and Methods
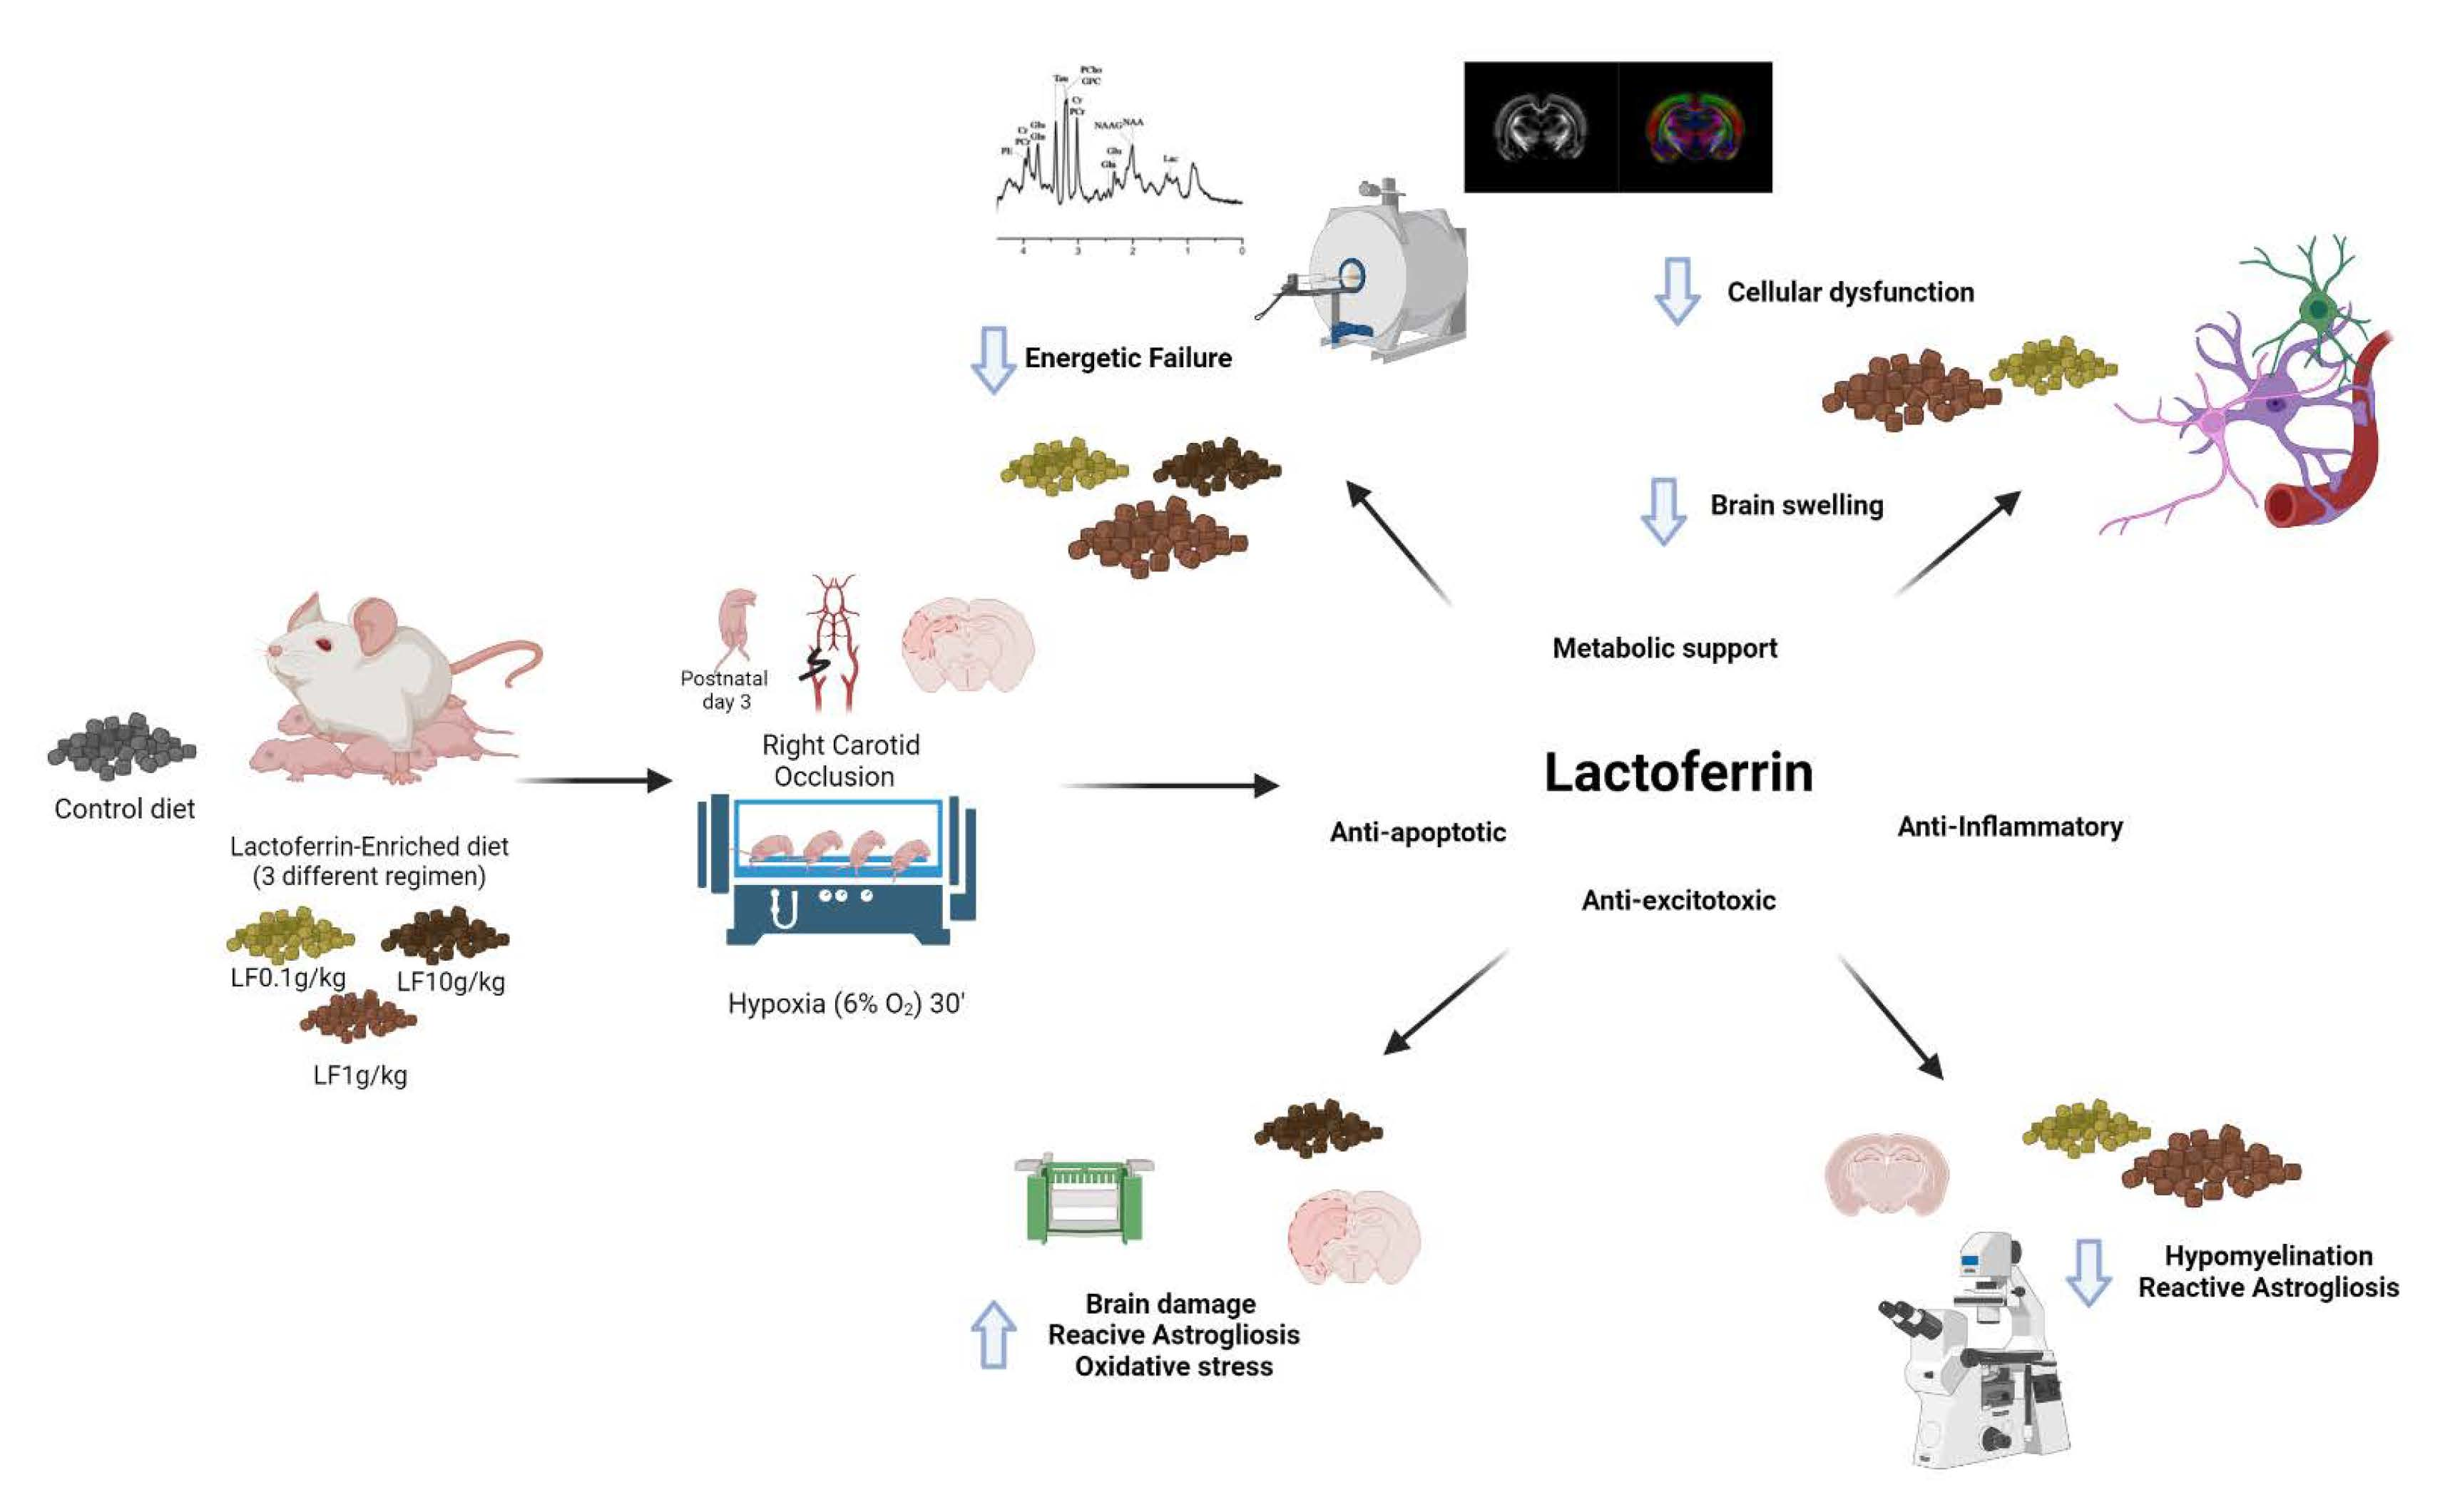
2.1. Animals
2.2. Brain Hypoxia–Ischemia
2.3. 1H-Magnetic Resonance Assessment
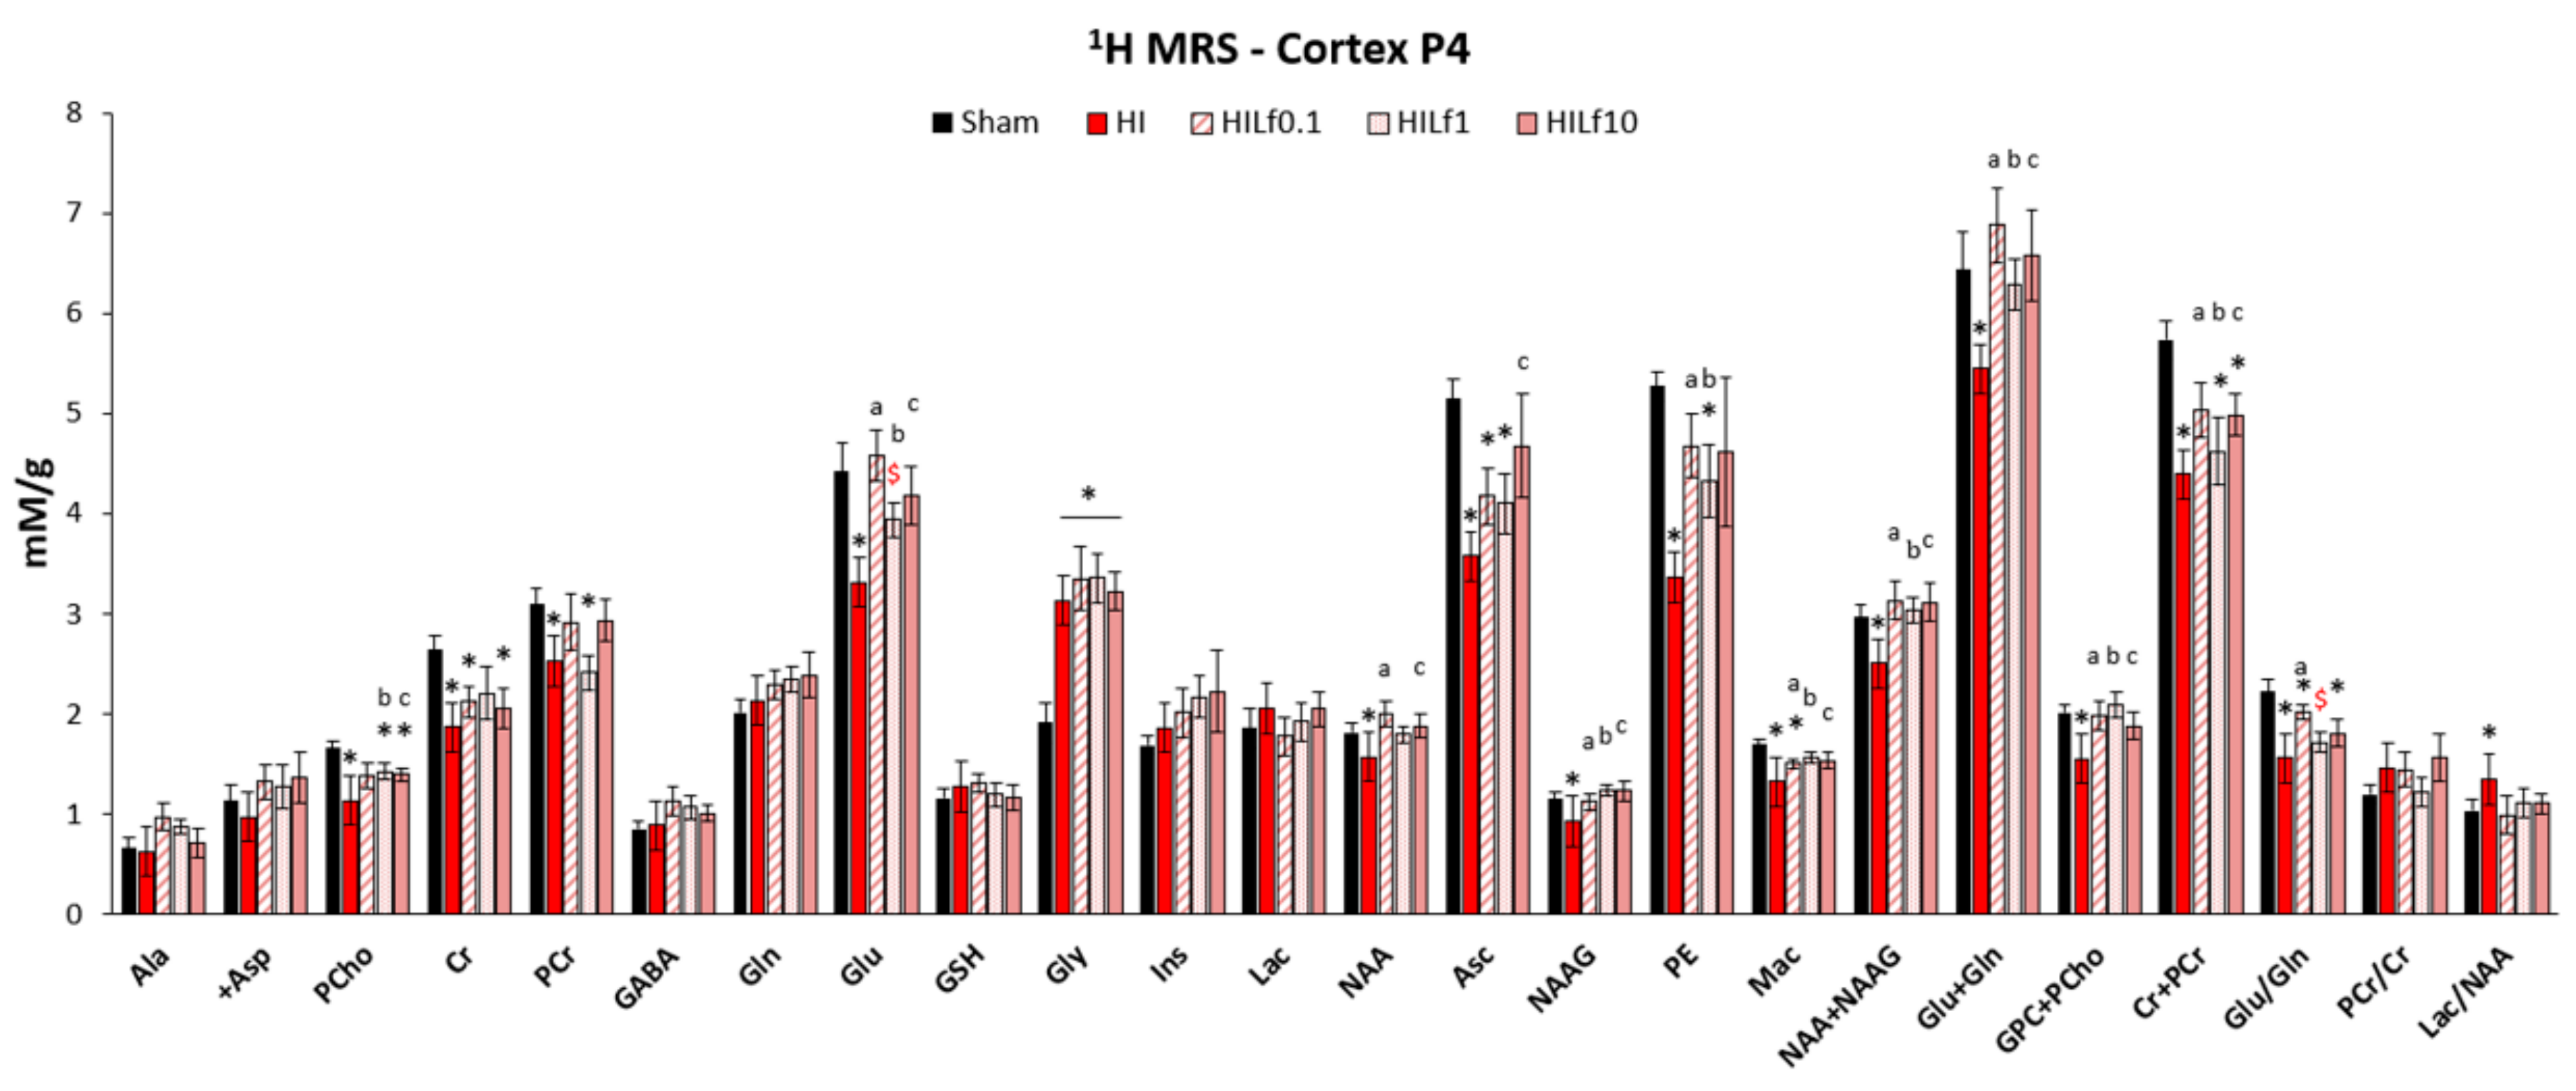
2.3.1. 1H-Magnetic Resonance Spectroscopy (MRS)
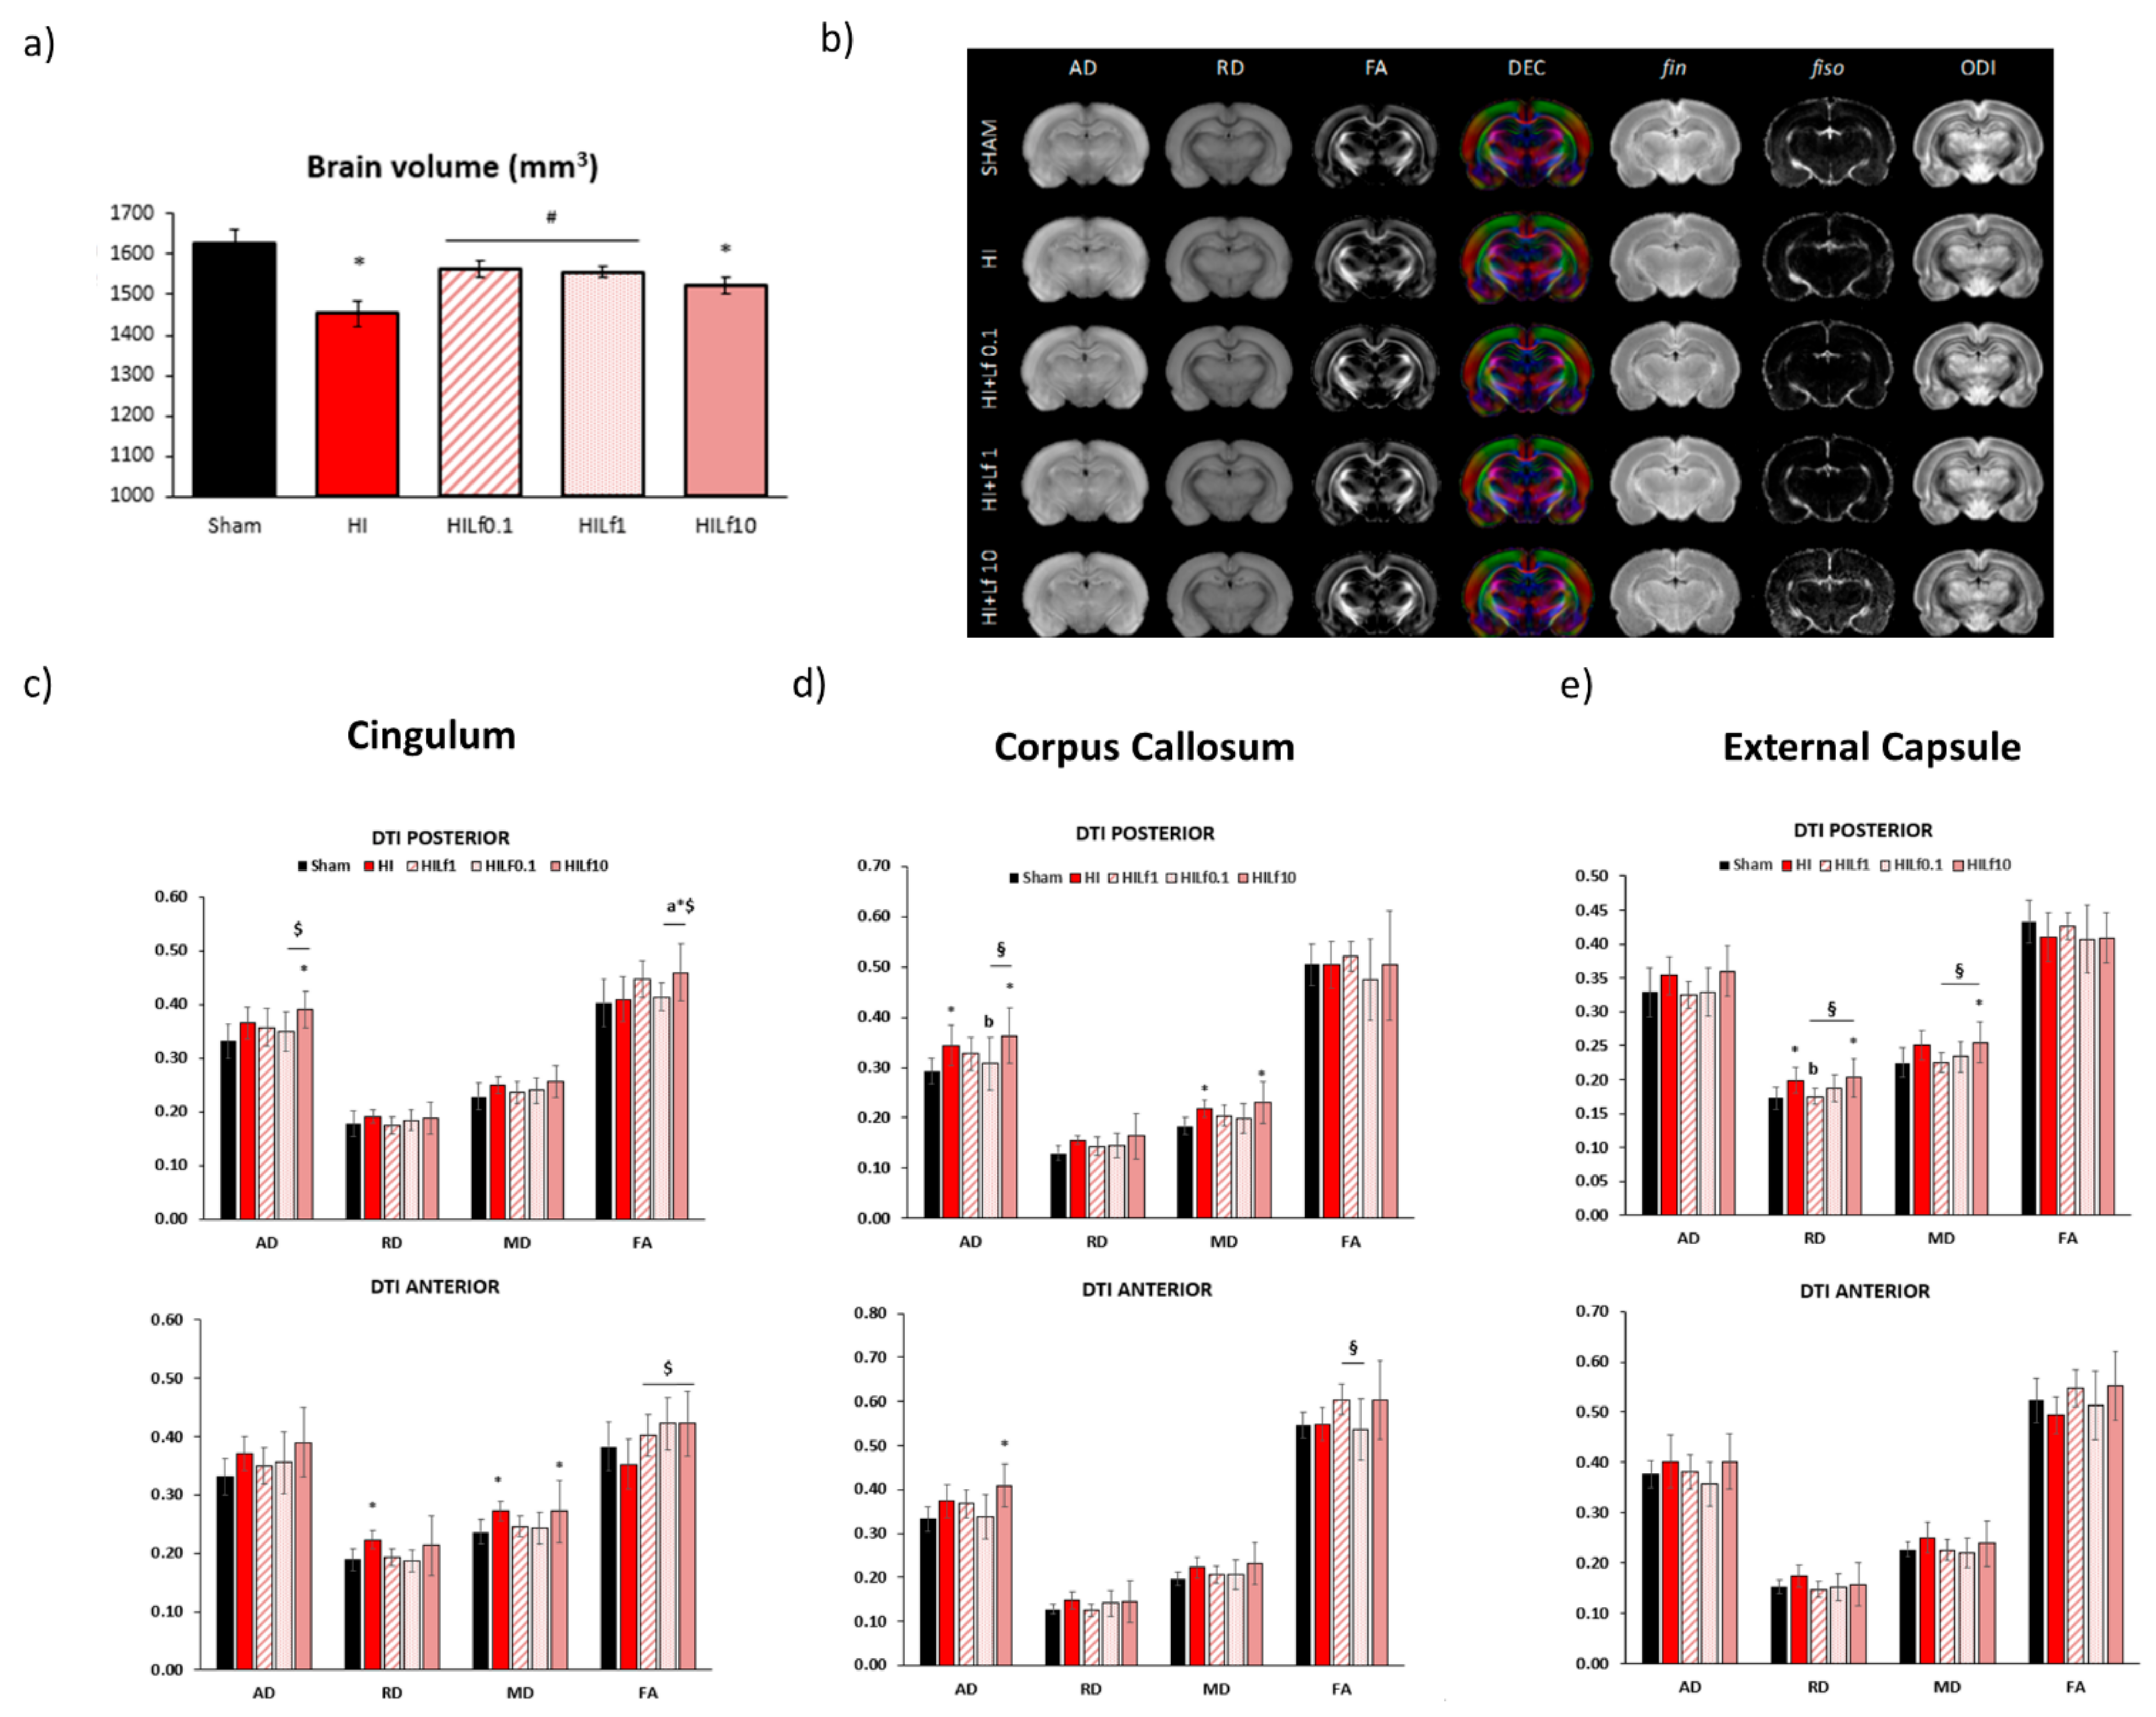
2.3.2. Diffusion Imaging (DTI-NODDI)
2.4. Immunoblotting
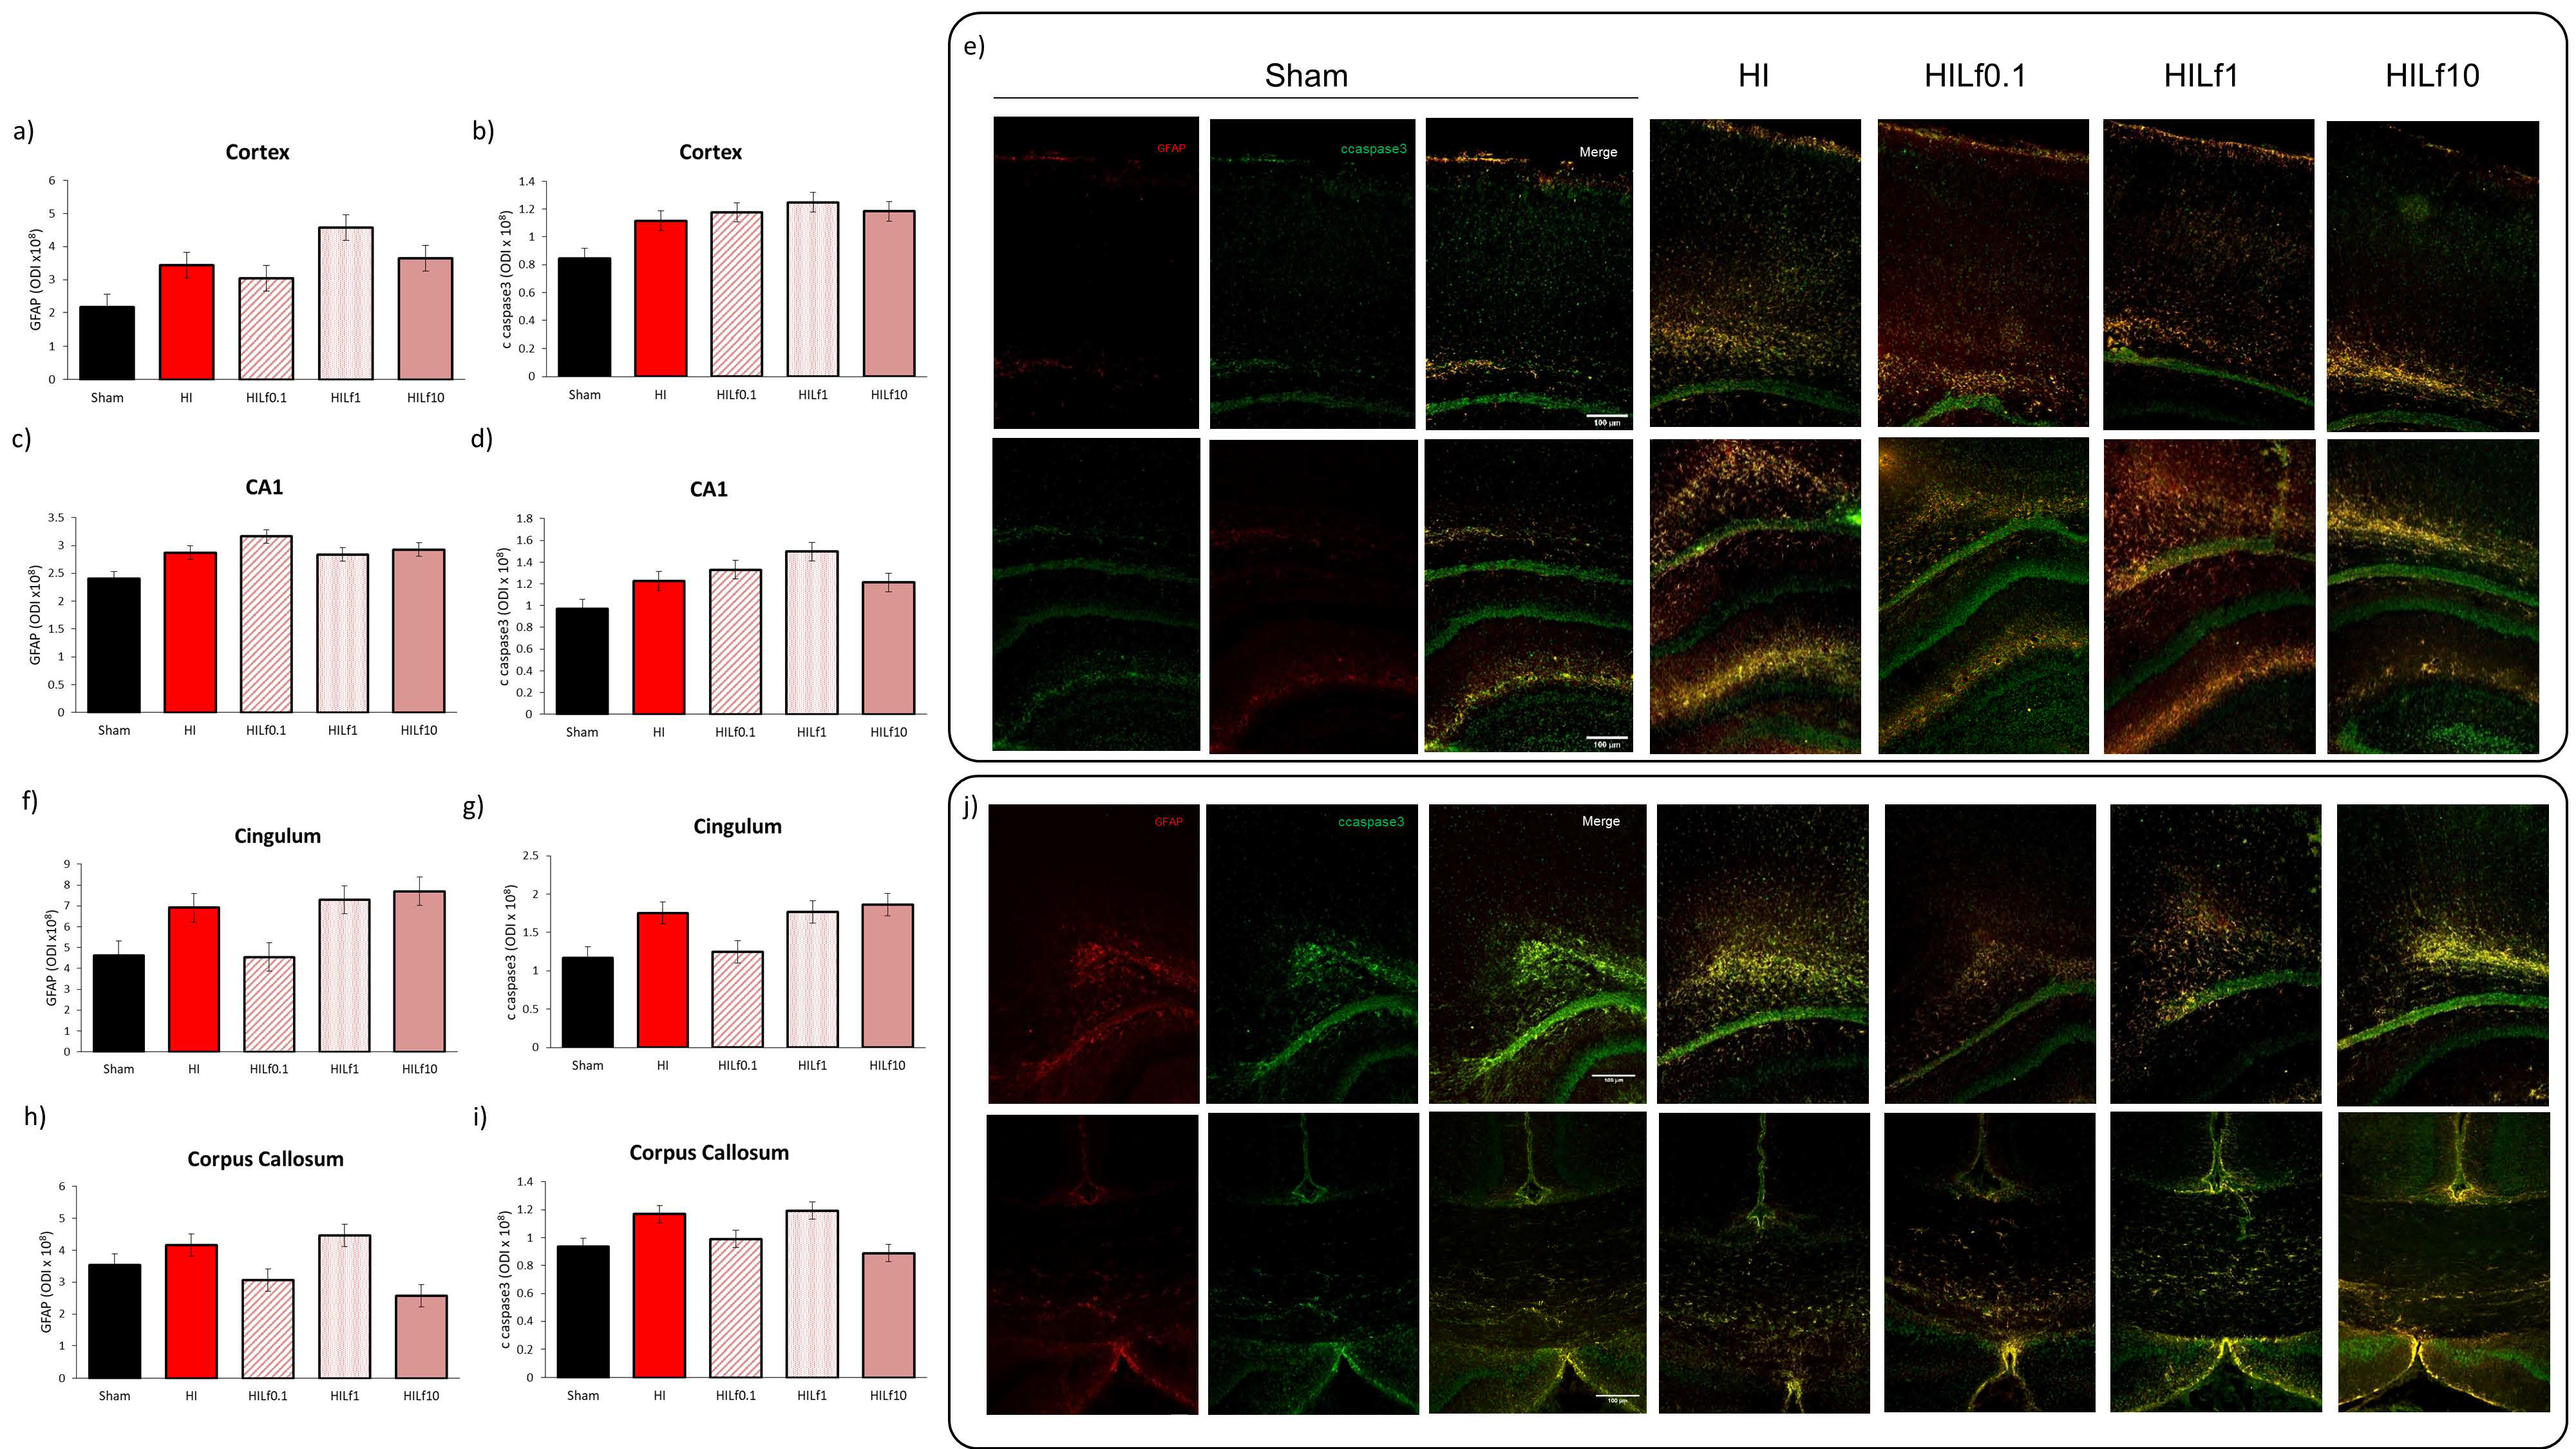
2.5. Immunofluorescence
2.6. Statistics
3. Results
3.1. HI Causes a Decrease in Body Weight Not Reversed by Lf
3.2. Lf Reduces Brain Metabolic Deficits in the Cerebral Cortex Following HI
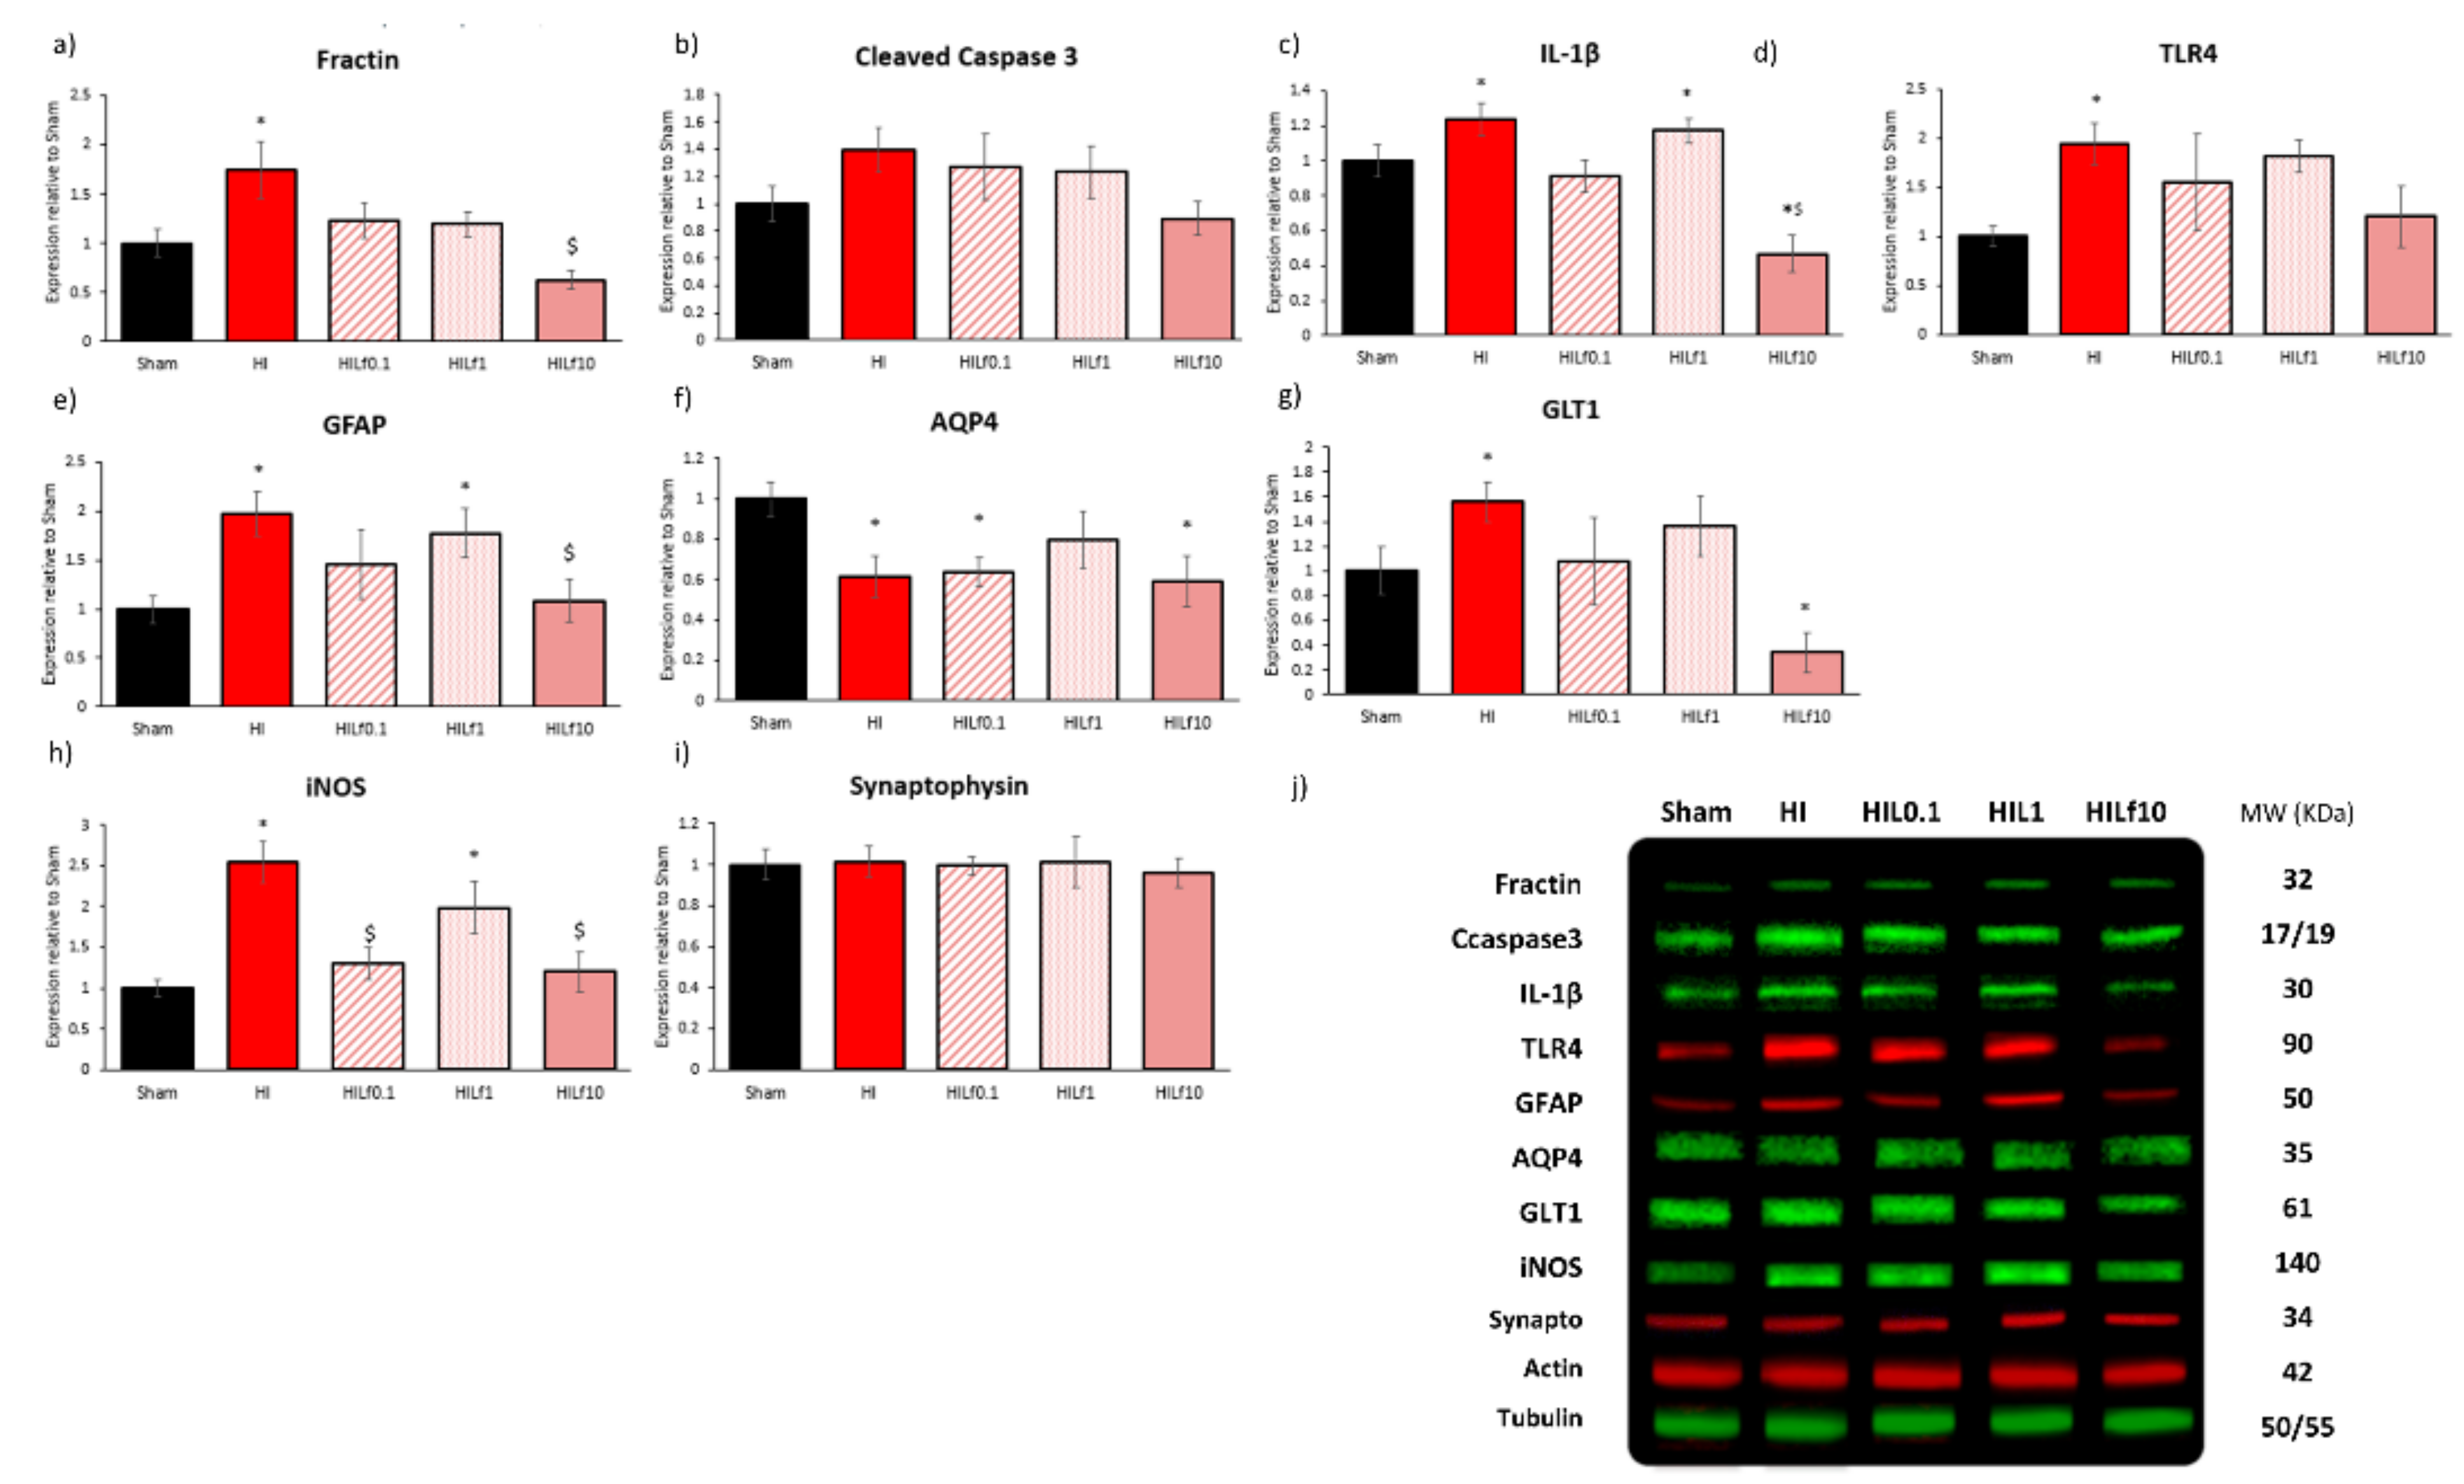
3.3. Molecular Substrates of Lactoferrin Neuroprotection
3.4. Long-Term Brain Macro and Microstructure Evaluation
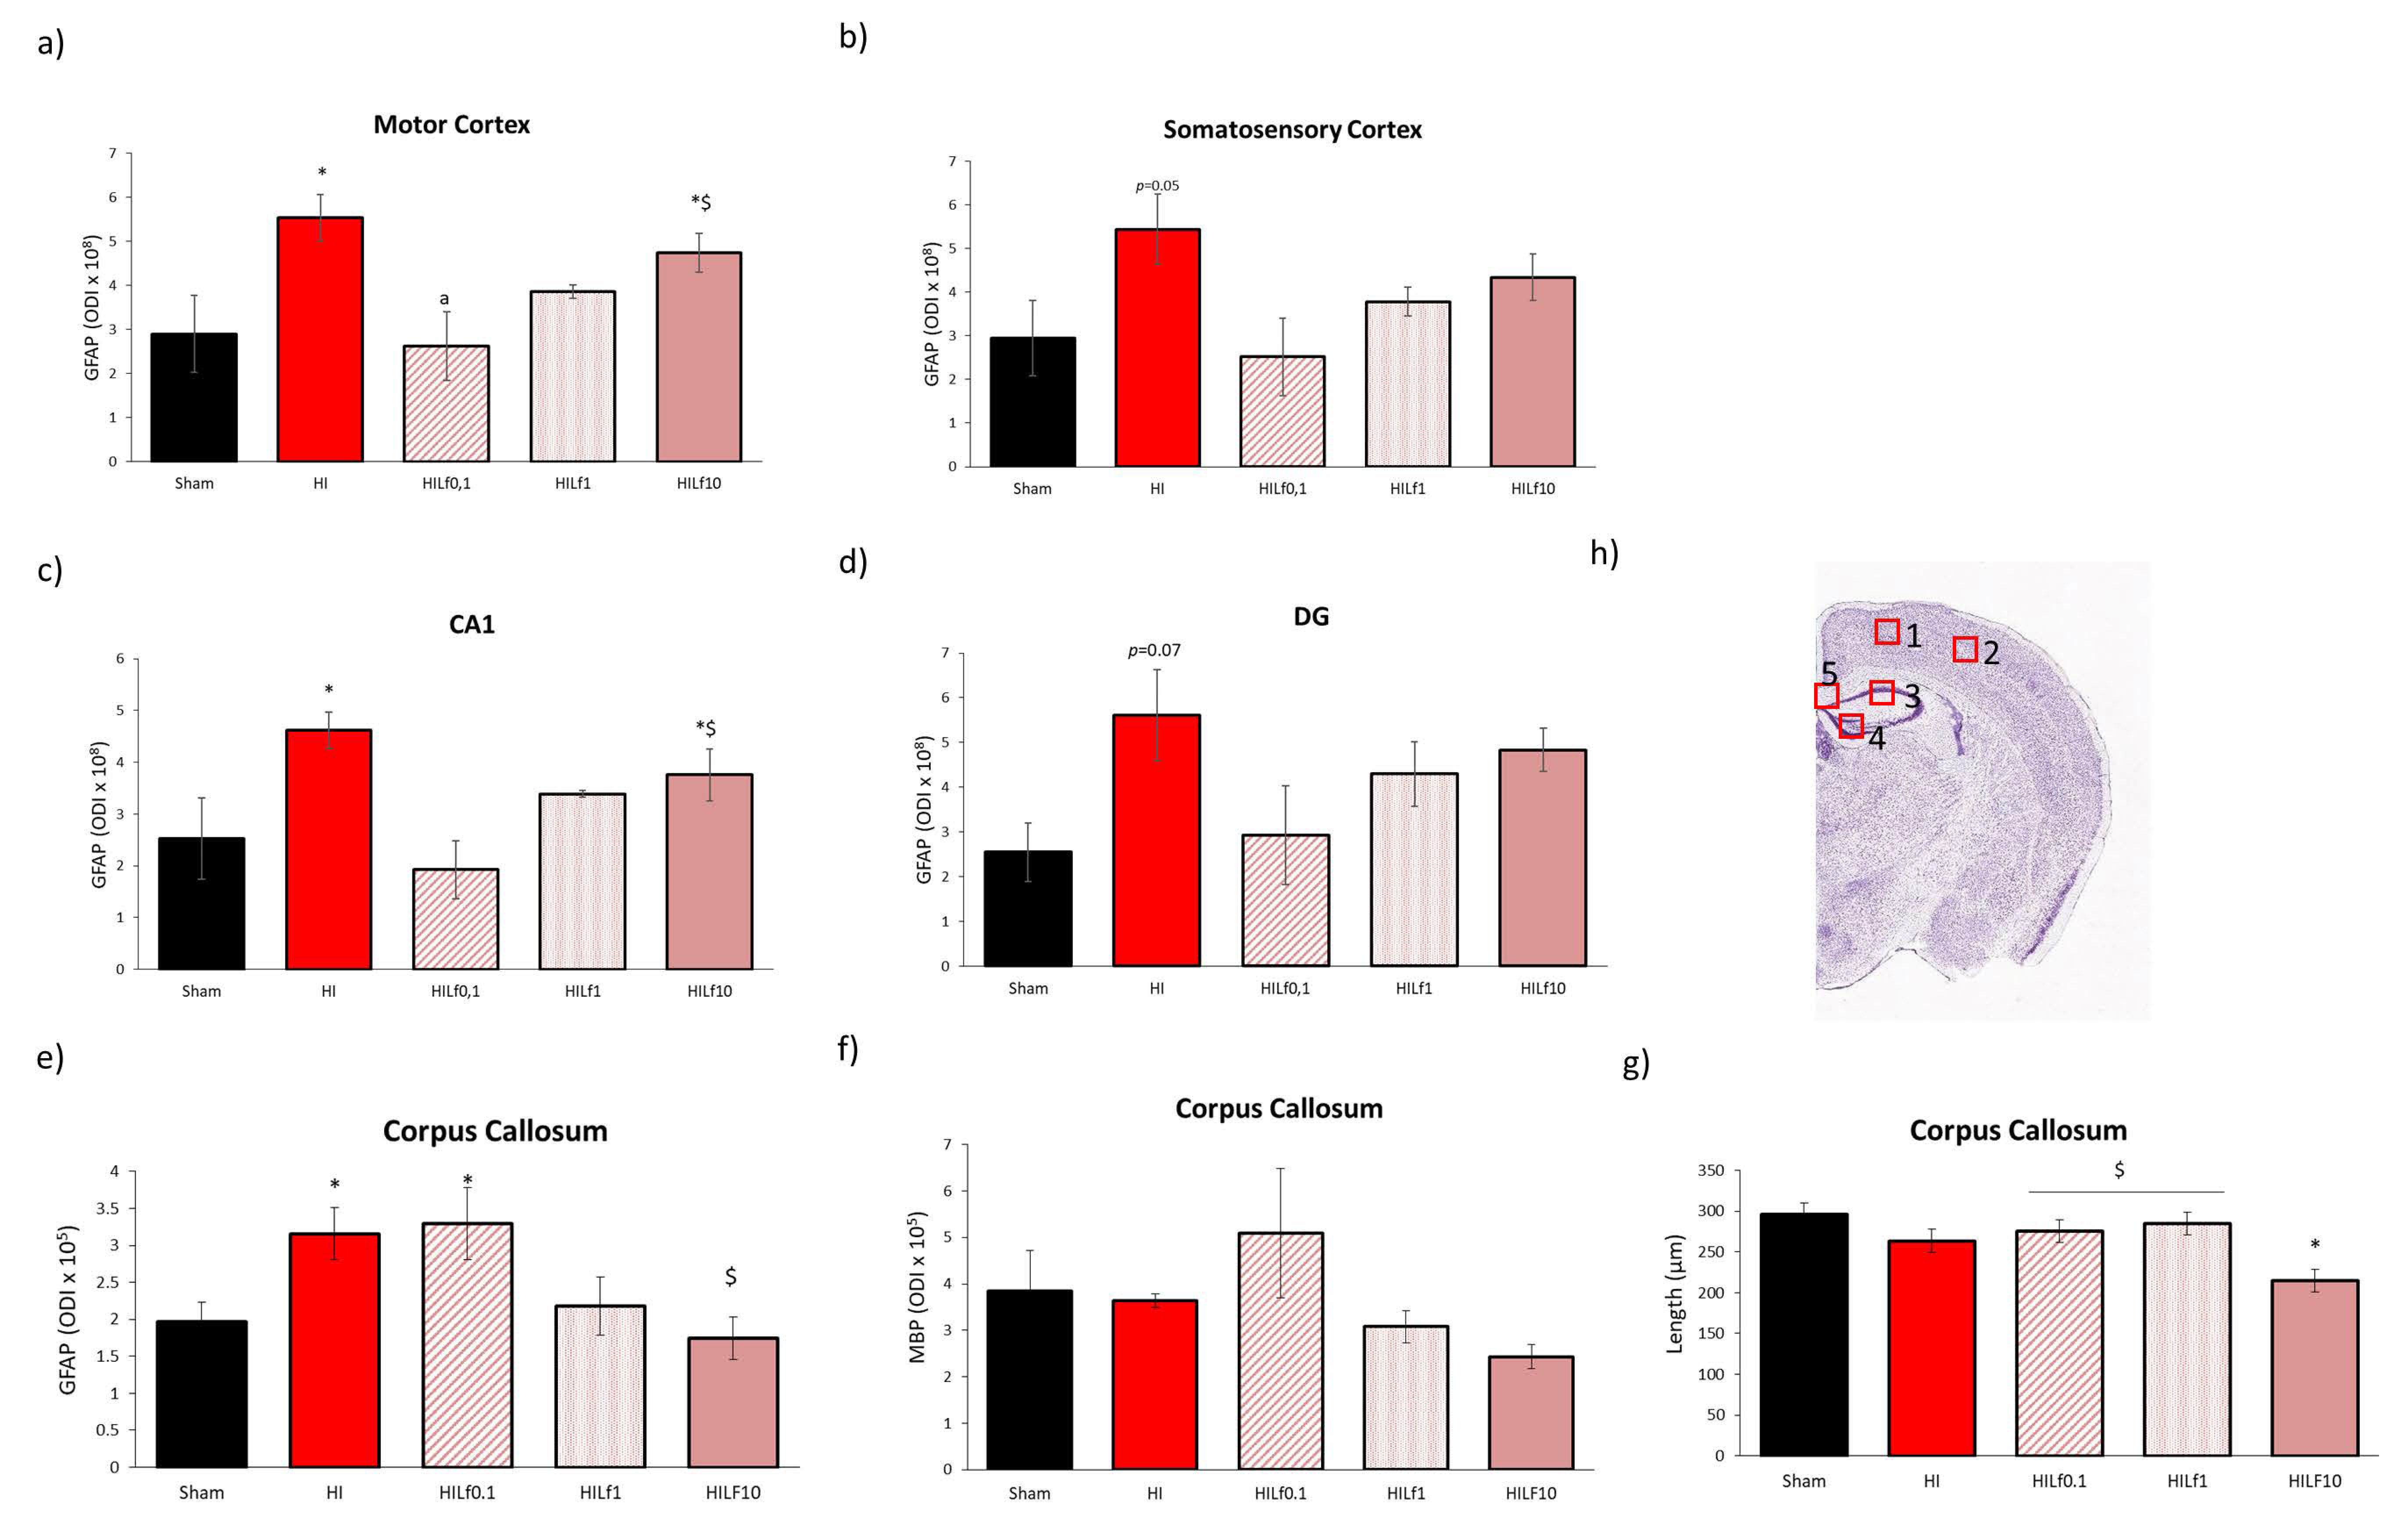
3.5. High Doses of Lf Increase Long-Term Astrogliosis in Myelinated Structures and Hypomyelination
4. Discussion
5. Conclusions
Supplementary Materials
Author Contributions
Funding
Institutional Review Board Statement
Informed Consent Statement
Data Availability Statement
Acknowledgments
Conflicts of Interest
References
- Salmaso, N.; Jablonska, B.; Scafidi, J.; Vaccarino, F.M.; Gallo, V. Neurobiology of premature brain injury. Nat. Neurosci. 2014, 17, 341–346. [Google Scholar] [CrossRef] [PubMed]
- Sauber-Schatz, E.K.; Sappenfield, W.; Grigorescu, V.; Kulkarni, A.; Zhang, Y.; Salihu, H.M.; Rubin, L.P.; Kirby, R.S.; Jamieson, D.J.; Macaluso, M. Obesity, assisted reproductive technology, and early preterm birth—Florida, 2004–2006. Am. J. Epidemiol. 2012, 176, 886–896. [Google Scholar] [CrossRef] [Green Version]
- Silbereis, J.C.; Huang, E.; Back, S.A.; Rowitch, D.H. Towards improved animal models of neonatal white matter injury associated with cerebral palsy. Dis. Models Mech. 2010, 3, 678–688. [Google Scholar] [CrossRef] [Green Version]
- Rice, J.E., 3rd; Vannucci, R.C.; Brierley, J.B. The influence of immaturity on hypoxic-ischemic brain damage in the rat. Ann. Neurol. 1981, 9, 131–141. [Google Scholar] [CrossRef] [PubMed]
- Lapchak, P.A.; Zhang, J.H. Translational stroke research guideline projections: The 20/20 standards. Transl. Stroke Res. 2018, 9, 9–12. [Google Scholar] [CrossRef] [PubMed]
- Parikh, P.; Juul, S.E. Neuroprotective Strategies in Neonatal Brain Injury. J. Pediatr. 2018, 192, 22–32. [Google Scholar] [CrossRef]
- Costa, F.; Hakimi, N.; Van Bel, F. Neuroprotection of the Perinatal Brain by Early Information of Cerebral Oxygenation and Perfusion Patterns. Int. J. Mol. Sci. 2021, 22, 5389. [Google Scholar] [CrossRef] [PubMed]
- Wu, Y.W.; Gonzalez, F.F. Erythropoietin: A novel therapy for hypoxic-ischaemic encephalopathy? Dev. Med. Child Neurol. 2015, 57 (Suppl. 3), 34–39. [Google Scholar] [CrossRef]
- Chang, H.-Y.; Sung, Y.-H.; Wang, S.-M.; Lung, H.-L.; Chang, J.-H.; Hsu, C.-H.; Jim, W.-T.; Lee, C.-H.; Hung, H.-F. Short- and Long-Term Outcomes in Very Low Birth Weight Infants with Admission Hypothermia. PLoS ONE 2015, 10, e0131976. [Google Scholar] [CrossRef] [PubMed]
- Gunn, A.J.; Thoresen, M. Neonatal encephalopathy and hypoxic–ischemic encephalopathy. Handb. Clin. Neurol. 2019, 162, 217–237. [Google Scholar] [CrossRef]
- Matsuda, V.D.V.; Tejada, M.B.; Motta-Teixeira, L.C.; Ikebara, J.M.; Cardoso, D.S.; Machado-Nils, A.V.; Lee, V.Y.; Diccini, I.; Arruda, B.P.; Martins, P.P.; et al. Impact of neonatal anoxia and hypothermic treatment on development and memory of rats. Exp. Neurol. 2021, 340, 113691. [Google Scholar] [CrossRef]
- Sizonenko, S.V.; Kiss, J.Z.; Inder, T.; Gluckman, P.D.; Williams, C.E. Distinctive Neuropathologic Alterations in the Deep Layers of the Parietal Cortex after Moderate Ischemic-Hypoxic Injury in the P3 Immature Rat Brain. Pediatr. Res. 2005, 57, 865–872. [Google Scholar] [CrossRef] [Green Version]
- Sizonenko, S.V.; Camm, E.J.; Dayer, A.; Kiss, J.Z. Glial responses to neonatal hypoxic–ischemic injury in the rat cerebral cortex. Int. J. Dev. Neurosci. 2008, 26, 37–45. [Google Scholar] [CrossRef]
- Craig, A.; Luo, N.L.; Beardsley, D.J.; Wingate-Pearse, N.; Walker, D.W.; Hohimer, A.; A Back, S. Quantitative analysis of perinatal rodent oligodendrocyte lineage progression and its correlation with human. Exp. Neurol. 2003, 181, 231–240. [Google Scholar] [CrossRef]
- Clancy, B.; Darlington, R.; Finlay, B. Translating developmental time across mammalian species. Neuroscience 2001, 105, 7–17. [Google Scholar] [CrossRef] [Green Version]
- Back, S.A.; Han, B.H.; Luo, N.L.; Chricton, C.A.; Xanthoudakis, S.; Tam, J.; Arvin, K.L.; Holtzman, D.M. Selective Vulnerability of Late Oligodendrocyte Progenitors to Hypoxia–Ischemia. J. Neurosci. 2002, 22, 455–463. [Google Scholar] [CrossRef] [PubMed] [Green Version]
- Segovia, K.N.; McClure, M.; Moravec, M.; Luo, N.L.; Wan, Y.; Gong, X.; Riddle, A.; Craig, A.; Struve, J.; Sherman, L.S.; et al. Arrested oligodendrocyte lineage maturation in chronic perinatal white matter injury. Ann. Neurol. 2008, 63, 520–530. [Google Scholar] [CrossRef] [PubMed] [Green Version]
- Durán-Carabali, L.; Sanches, E.; Marques, M.; Aristimunha, D.; Pagnussat, A.; Netto, C. Longer hypoxia–ischemia periods to neonatal rats causes motor impairments and muscular changes. Neuroscience 2017, 340, 291–298. [Google Scholar] [CrossRef]
- Khwaja, O.; Volpe, J.J. Pathogenesis of cerebral white matter injury of prematurity. Arch. Dis. Child. Fetal Neonatal Ed. 2007, 93, F153–F161. [Google Scholar] [CrossRef] [PubMed]
- Patrick, L.A.; Smith, G. Proinflammatory Cytokines: A Link Between Chorioamnionitis and Fetal Brain Injury. J. Obstet. Gynaecol. Can. 2002, 24, 705–709. [Google Scholar] [CrossRef]
- Volpe, J.J. Neonatal encephalitis and white matter injury: More than just inflammation? Ann. Neurol. 2008, 64, 232–236. [Google Scholar] [CrossRef] [PubMed]
- Sizonenko, S.V.; Sirimanne, E.; Mayall, Y.; Gluckman, P.D.; Inder, T.; Williams, C. Selective Cortical Alteration after Hypoxic-Ischemic Injury in the Very Immature Rat Brain. Pediatr. Res. 2003, 54, 263–269. [Google Scholar] [CrossRef] [Green Version]
- Sanches, E.F.; Van De Looij, Y.; Toulotte, A.; Da Silva, A.R.; Romero, J.; Sizonenko, S.V. Brain Metabolism Alterations Induced by Pregnancy Swimming Decreases Neurological Impairments Following Neonatal Hypoxia-Ischemia in Very Immature Rats. Front. Neurol. 2018, 9, 480. [Google Scholar] [CrossRef]
- Carletti, J.V.; Deniz, B.F.; Miguel, P.M.; Rojas, J.J.; Kolling, J.; Scherer, E.B.; Wyse, A.T.D.S.; Netto, C.A.; Pereira, L. Folic Acid Prevents Behavioral Impairment and Na+, K+—ATPase Inhibition Caused by Neonatal Hypoxia–Ischemia. Neurochem. Res. 2012, 37, 1624–1630. [Google Scholar] [CrossRef] [PubMed]
- Deniz, B.F.; Confortim, H.D.; Deckmann, I.; Miguel, P.M.; Bronauth, L.; de Oliveira, B.C.; Vieira, M.C.; Dos Santos, T.M.; Bertó, C.G.; Hartwig, J.; et al. Gestational folic acid supplementation does not affects the maternal behavior and the early development of rats submitted to neonatal hypoxia-ischemia but the high supplementation impairs the dam’s memory and the Na+, K+—ATPase activity in the pup’s hippocampus. Int. J. Dev. Neurosci. 2018, 71, 181–192. [Google Scholar] [PubMed]
- Berman, D.; Mozurkewich, E.; Liu, Y.; Barks, J. Docosahexaenoic Acid Pretreatment Confers Neuroprotection in a Rat Model of Perinatal Cerebral Hypoxia-Ischemia. Obstet. Anesth. Dig. 2010, 30, 227. [Google Scholar] [CrossRef]
- Berman, D.R.; Liu, Y.Q.; Barks, J.; Mozurkewich, E. Docosahexaenoic acid confers neuroprotection in a rat model of perinatal hypoxia-ischemia potentiated by Escherichia coli lipopolysaccharide-induced systemic inflammation. Am. J. Obstet. Gynecol. 2010, 202, 469.e1–469.e6. [Google Scholar] [CrossRef] [PubMed] [Green Version]
- Arteaga, O.; Revuelta, M.; Urigüen, L.; Álvarez, A.; Montalvo, H.; Hilario, E. Pretreatment with Resveratrol Prevents Neuronal Injury and Cognitive Deficits Induced by Perinatal Hypoxia-Ischemia in Rats. PLoS ONE 2015, 10, e0142424. [Google Scholar] [CrossRef] [Green Version]
- Jiang, W.; Guo, M.; Gong, M.; Chen, L.; Bi, Y.; Zhang, Y.; Shi, Y.; Qu, P.; Liu, Y.; Chen, J.; et al. Vitamin A bio-modulates apoptosis via the mitochondrial pathway after hypoxic-ischemic brain damage. Mol. Brain 2018, 11, 14. [Google Scholar] [CrossRef] [Green Version]
- Cardinali, D.P. An Assessment of Melatonin’s Therapeutic Value in the Hypoxic-Ischemic Encephalopathy of the Newborn. Front. Synaptic Neurosci. 2019, 11, 34. [Google Scholar] [CrossRef] [Green Version]
- Loren, D.J.; Seeram, N.P.; Schulman, R.N.; Holtzman, D.M. Maternal Dietary Supplementation with Pomegranate Juice Is Neuroprotective in an Animal Model of Neonatal Hypoxic-Ischemic Brain Injury. Pediatr. Res. 2005, 57, 858–864. [Google Scholar] [CrossRef] [Green Version]
- Black, A.; Armstrong, E.; Scott, O.; Juurlink, B.; Yager, J. Broccoli sprout supplementation during pregnancy prevents brain injury in the newborn rat following placental insufficiency. Behav. Brain Res. 2015, 291, 289–298. [Google Scholar] [CrossRef] [PubMed]
- García-Montoya, I.A.; Cendón, T.S.; Arévalo-Gallegos, S.; Rascón-Cruz, Q. Lactoferrin a multiple bioactive protein: An overview. Biochim. Et Biophys. Acta (BBA) Gen. Subj. 2011, 1820, 226–236. [Google Scholar] [CrossRef]
- Baker, H.M.; Baker, E. Lactoferrin and Iron: Structural and dynamic aspects of binding and release. BioMetals 2004, 17, 209–216. [Google Scholar] [CrossRef]
- De Ferrer, P.A.R.; Baroni, A.; Sambucetti, M.E.; López, N.E.; Cernadas, J.M.C. Lactoferrin Levels in Term and Preterm Milk. J. Am. Coll. Nutr. 2000, 19, 370–373. [Google Scholar] [CrossRef]
- Ji, B.; Maeda, J.; Higuchi, M.; Inoue, K.; Akita, H.; Harashima, H.; Suhara, T. Pharmacokinetics and brain uptake of lactoferrin in rats. Life Sci. 2006, 78, 851–855. [Google Scholar] [CrossRef] [PubMed]
- Ochoa, T.J.; Sizonenko, S.V. Lactoferrin and prematurity: A promising milk protein? Biochem. Cell Biol. 2017, 95, 22–30. [Google Scholar] [CrossRef] [PubMed] [Green Version]
- Sullivan, S.; Schanler, R.J.; Kim, J.H.; Patel, A.; Trawöger, R.; Kiechl-Kohlendorfer, U.; Chan, G.M.; Blanco, C.L.; Abrams, S.; Cotten, C.M.; et al. An Exclusively Human Milk-Based Diet Is Associated with a Lower Rate of Necrotizing Enterocolitis than a Diet of Human Milk and Bovine Milk-Based Products. J. Pediatr. 2010, 156, 562–567.e1. [Google Scholar] [CrossRef] [PubMed] [Green Version]
- Frey, H.A.; Klebanoff, M.A. The epidemiology, etiology, and costs of preterm birth. Semin. Fetal Neonatal Med. 2016, 21, 68–73. [Google Scholar] [PubMed]
- Van de Looij, Y.; Ginet, V.; Chatagner, A.; Toulotte, A.; Somm, E.; Hüppi, P.S.; Sizonenko, S.V. Lactoferrin during lactation protects the immature hypoxic-ischemic rat brain. Ann. Clin. Transl. Neurol. 2014, 1, 955–967. [Google Scholar] [CrossRef]
- Ginet, V.; van de Looij, Y.; Petrenko, V.; Toulotte, A.; Kiss, J.; Hüppi, P.; Sizonenko, S.V. Lactoferrin during lactation reduces lipopolysaccharide-induced brain injury. BioFactors 2016, 42, 323–336. [Google Scholar]
- Van De Looij, Y.; Larpin, C.; Cabungcal, J.-H.; Sanches, E.F.; Toulotte, A.; Do, K.Q.; Sizonenko, S.V. Nutritional Intervention for Developmental Brain Damage: Effects of Lactoferrin Supplementation in Hypocaloric Induced Intrauterine Growth Restriction Rat Pups. Front. Endocrinol. 2019, 10, 46. [Google Scholar] [CrossRef] [Green Version]
- Somm, E.; Larvaron, P.; Van De Looij, Y.; Toulotte, A.; Chatagner, A.; Faure, M.; Métairon, S.; Mansourian, R.; Raymond, F.; Gruetter, R.; et al. Protective effects of maternal nutritional supplementation with lactoferrin on growth and brain metabolism. Pediatr. Res. 2013, 75, 51–61. [Google Scholar] [CrossRef] [Green Version]
- Mlynarik, V.; Gambarota, G.; Frenkel, H.; Gruetter, R. Localized short-echo-time proton MR spectroscopy with full signal-intensity acquisition. Magn. Reson. Med. 2006, 56, 965–970. [Google Scholar] [CrossRef] [Green Version]
- Gruetter, R.; Tkáč, I. Field mapping without reference scan using asymmetric echo-planar techniques. Magn. Reson. Med. 2000, 43, 319–323. [Google Scholar] [CrossRef] [Green Version]
- Provencher, S.W. Estimation of metabolite concentrations from localized in vivo proton NMR spectra. Magn. Reson. Med. 1993, 30, 672–679. [Google Scholar] [CrossRef]
- Zhang, H.; Schneider, T.; Wheeler-Kingshott, C.A.G.; Alexander, D.C. NODDI: Practical in vivo neurite orientation dispersion and density imaging of the human brain. NeuroImage 2012, 61, 1000–1016. [Google Scholar] [CrossRef] [PubMed]
- Khazipov, R.; Zaynutdinova, D.; Ogievetsky, E.; Valeeva, G.; Mitrukhina, O.; Manent, J.-B.; Represa, A. Atlas of the Postnatal Rat Brain in Stereotaxic Coordinates. Front. Neuroanat. 2015, 9, 161. [Google Scholar] [CrossRef] [PubMed] [Green Version]
- Palkovits, M. The rat brain in stereotaxic coordinates. Neuropeptides 1983, 3, 319. [Google Scholar] [CrossRef]
- Chen, Y.; Wang, B.; Yang, C.; Shi, Y.; Dong, Z.; Troy, F.A. Functional Correlates and Impact of Dietary Lactoferrin Intervention and its Concentration-dependence on Neurodevelopment and Cognition in Neonatal Piglets. Mol. Nutr. Food Res. 2021, 65, e2001099. [Google Scholar] [CrossRef] [PubMed]
- Kucia, M.; Langhammer, M.; Görs, S.; Albrecht, E.; Hammon, H.; Nürnberg, G.; Metges, C. High-protein diet during gestation and lactation affects mammary gland mRNA abundance, milk composition and pre-weaning litter growth in mice. Animal 2011, 5, 268–277. [Google Scholar] [CrossRef] [PubMed] [Green Version]
- Jahan-Mihan, A.; Rodriguez, J.; Christie, C.; Sadeghi, M.; Zerbe, T. The Role of Maternal Dietary Proteins in Development of Metabolic Syndrome in Offspring. Nutrients 2015, 7, 9185–9217. [Google Scholar] [CrossRef] [Green Version]
- Cheong, J.; Cady, E.; Penrice, J.; Wyatt, J.; Cox, I.; Robertson, N. Proton MR Spectroscopy in Neonates with Perinatal Cerebral Hypoxic-Ischemic Injury: Metabolite Peak-Area Ratios, Relaxation Times, and Absolute Concentrations. Am. J. Neuroradiol. 2006, 27, 1546–1554. [Google Scholar]
- Yan, X.; Zhang, J.; Shi, J.; Gong, Q.; Weng, X. Cerebral and functional adaptation with chronic hypoxia exposure: A multi-modal MRI study. Brain Res. 2010, 1348, 21–29. [Google Scholar] [CrossRef]
- Rijn, A.M.R.-V.; van der Grond, J.; de Vries, L.S.; Groenendaal, F. Value of 1H-MRS Using Different Echo Times in Neonates with Cerebral Hypoxia-Ischemia. Pediatr. Res. 2001, 49, 356–362. [Google Scholar] [CrossRef] [PubMed] [Green Version]
- Van De Looij, Y.; Dean, J.M.; Gunn, A.; Hüppi, P.; Sizonenko, S.V. Advanced magnetic resonance spectroscopy and imaging techniques applied to brain development and animal models of perinatal injury. Int. J. Dev. Neurosci. 2015, 45, 29–38. [Google Scholar] [CrossRef]
- van de Looij, Y.; Chatagner, A.; Hüppi, P.; Gruetter, R.; Sizonenko, S.V. Longitudinal MR assessment of hypoxic ischemic injury in the immature rat brain. Magn. Reson. Med. 2010, 65, 305–312. [Google Scholar] [CrossRef] [PubMed] [Green Version]
- Liu, N.; Tong, X.; Huang, W.; Fu, J.; Xue, X. Synaptic Injury in the Thalamus Accompanies White Matter Injury in Hypoxia/Ischemia-Mediated Brain Injury in Neonatal Rats. BioMed Res. Int. 2019, 2019, 1–10. [Google Scholar] [CrossRef] [Green Version]
- Huang, Z.; Liu, J.; Cheung, P.-Y.; Chen, C. Long-term cognitive impairment and myelination deficiency in a rat model of perinatal hypoxic-ischemic brain injury. Brain Res. 2009, 1301, 100–109. [Google Scholar] [CrossRef]
- Martin, H.L.; Teismann, P. Glutathione—A review on its role and significance in Parkinson’s disease. FASEB J. 2009, 23, 3263–3272. [Google Scholar] [CrossRef] [Green Version]
- Dickinson, D.A.; Forman, H.J. Cellular glutathione and thiols metabolism. Biochem. Pharmacol. 2002, 64, 1019–1026. [Google Scholar] [CrossRef]
- Dringen, R. Metabolism and functions of glutathione in brain. Prog. Neurobiol. 2000, 62, 649–671. [Google Scholar] [CrossRef]
- Broman, J.; Hassel, B.; Rinvik, E.; Ottersen, O. Biochemistry and anatomy of transmitter glutamate. Handb. Chem. Neuroanat. 2000, 18, 1–44. [Google Scholar] [CrossRef]
- Soni, N.; Reddy, B.; Kumar, P. GLT-1 transporter: An effective pharmacological target for various neurological disorders. Pharmacol. Biochem. Behav. 2014, 127, 70–81. [Google Scholar] [CrossRef] [PubMed]
- Northington, F.J.; Chavez-Valdez, R.; Martin, L.J. Neuronal cell death in neonatal hypoxia-ischemia. Ann. Neurol. 2011, 69, 743–758. [Google Scholar] [CrossRef] [PubMed]
- Fogal, B.; Hewett, S.J. Interleukin-1beta: A bridge between inflammation and excitotoxicity? J. Neurochem. 2008, 106, 1–23. [Google Scholar] [CrossRef]
- Machnicki, M.; Zimecki, M.; Zagulski, T. Lactoferrin regulates the release of tumour necrosis factor alpha and interleukin 6 in vivo. Int. J. Exp. Pathol. 1993, 74, 433–439. [Google Scholar]
- Sanches, E.; Arteni, N.; Nicola, F.; Aristimunha, D.; Netto, C.A. Sexual dimorphism and brain lateralization impact behavioral and histological outcomes following hypoxia–ischemia in P3 and P7 rats. Neuroscience 2015, 290, 581–593. [Google Scholar] [CrossRef]
- Vannucci, S.J.; Hagberg, H. Hypoxia–ischemia in the immature brain. J. Exp. Biol. 2004, 207, 3149–3154. [Google Scholar] [CrossRef] [Green Version]
- Parada, E.; Casas, A.I.; Palomino-Antolin, A.; Gómez-Rangel, V.; Rubio-Navarro, A.; Alins, V.F.; Narros-Fernandez, P.; Guerrero-Hue, M.; Moreno, J.A.; Rosa, J.M.; et al. Early toll-like receptor 4 blockade reduces ROS and inflammation triggered by microglial pro-inflammatory phenotype in rodent and human brain ischaemia models. Br. J. Pharmacol. 2019, 176, 2764–2779. [Google Scholar] [CrossRef]
- Li, X.-Q.; Wang, J.; Fang, B.; Tan, W.-F.; Ma, H. Intrathecal antagonism of microglial TLR4 reduces inflammatory damage to blood–spinal cord barrier following ischemia/reperfusion injury in rats. Mol. Brain 2014, 7, 28. [Google Scholar] [CrossRef] [Green Version]
- Yang, H.-G.; Li, H.-Y.; Li, P.; Bao, X.-Y.; Huang, G.-X.; Xing, L.; Zheng, N.; Wang, J.-Q. Modulation activity of heat-treated and untreated lactoferrin on the TLR-4 pathway in anoxia cell model and cerebral ischemia reperfusion mouse model. J. Dairy Sci. 2020, 103, 1151–1163. [Google Scholar] [CrossRef]
- Hagberg, H.; Mallard, C.; Rousset, C.I.; Thornton, C. Mitochondria: Hub of injury responses in the developing brain. Lancet Neurol. 2014, 13, 217–232. [Google Scholar] [CrossRef]
- Nicchia, G.P.; Nico, B.; Camassa, L.M.A.; Mola, M.G.; Ribatti, D.; Spray, D.C.; Bosco, A.; Svelto, M.; Frigeri, A. Responsive Astrocytic Endfeet: The Role of AQP4 in BBB Development and Functioning. Blood-Brain Barriers 2006, 20, 209–236. [Google Scholar] [CrossRef]
- Manley, G.; Binder, D.; Papadopoulos, M.; Verkman, A. New insights into water transport and edema in the central nervous system from phenotype analysis of aquaporin-4 null mice. Neuroscience 2004, 129, 981–989. [Google Scholar] [CrossRef]
- Vajda, Z.; Pedersen, M.; Fuchtbauer, E.-M.; Wertz, K.; Stødkilde-Jørgensen, H.; Sulyok, E.; Doczi, T.; Neely, J.D.; Agre, P.; Frokiaer, J.; et al. Delayed onset of brain edema and mislocalization of aquaporin-4 in dystrophin-null transgenic mice. Proc. Natl. Acad. Sci. USA 2002, 99, 13131–13136. [Google Scholar] [CrossRef] [Green Version]
- Meng, S.; Qiao, M.; Lin, L.; Del Bigio, M.R.; Tomanek, B.; Tuor, U.I. Correspondence of AQP4 expression and hypoxic-ischaemic brain oedema monitored by magnetic resonance imaging in the immature and juvenile rat. Eur. J. Neurosci. 2004, 19, 2261–2269. [Google Scholar] [CrossRef]
- Taniguchi, M.; Yamashita, T.; Kumura, E.; Tamatani, M.; Kobayashi, A.; Yokawa, T.; Maruno, M.; Kato, A.; Ohnishi, T.; Kohmura, E.; et al. Induction of aquaporin-4 water channel mRNA after focal cerebral ischemia in rat. Mol. Brain Res. 2000, 78, 131–137. [Google Scholar] [CrossRef]
- Sanches, E.F.; Van De Looij, Y.; Toulotte, A.; Sizonenko, S.V.; Lei, H. Mild Neonatal Brain Hypoxia-Ischemia in Very Immature Rats Causes Long-Term Behavioral and Cerebellar Abnormalities at Adulthood. Front. Physiol. 2019, 10, 634. [Google Scholar] [CrossRef]
- Kannan, S.; Saadani-Makki, F.; Muzik, O.; Chakraborty, P.; Mangner, T.J.; Janisse, J.; Romero, R.; Chugani, D.C. Microglial Activation in Perinatal Rabbit Brain Induced by Intrauterine Inflammation: Detection with 11C-(R)-PK11195 and Small-Animal PET. J. Nucl. Med. 2007, 48, 946–954. [Google Scholar] [CrossRef] [Green Version]
- Li, Y.-Q.; Guo, C. A Review on Lactoferrin and Central Nervous System Diseases. Cells 2021, 10, 1810. [Google Scholar] [CrossRef] [PubMed]
- Klintworth, G.K.; Valnickova, Z.; Kielar, R.A.; Baratz, K.H.; Campbell, R.J.; Enghild, J.J. Familial subepithelial corneal amyloidosis—A lactoferrin-related amyloidosis. Investig. Ophthalmol. Vis. Sci. 1997, 38, 2756–2763. [Google Scholar]
- Kaufman, D.A.; Berenz, A.; Itell, H.L.; Conaway, M.; Blackman, A.; Nataro, J.P.; Permar, S.R. Dose escalation study of bovine lactoferrin in preterm infants: Getting the dose right. Biochem. Cell Biol. 2020, 99, 7–13. [Google Scholar] [CrossRef]


| Antibody | Company | Reference | Host | Molecular Weight |
|---|---|---|---|---|
| Actin | Millipore | MAB1501 | Mouse | 42 kDa |
| AQP4 | Abcam | ab125049 | Rabbit | 35 KDa |
| ccaspase 3 | Cell Signalling | 9661 | Rabbit | 19 kDa |
| ccaspase 3 | Abcam | ab214430 | Rabbit | 17 KDa |
| DCX | Abcam | ab18723 | Rabbit | 45 kDa |
| Fractin | Millipore | aB3150 | Rabbit | 32 kDa |
| GFAP | Sigma | G6171 | Mouse | 50 KDa |
| GLT1 | Abcam | ab106289 | Rabbit | 62 kDa |
| Iba-1 | Abcam | ab5076 | Goat | 17 KDa |
| IL-1β | Abcam | ab254360 | Rabbit | 30 KDa |
| iNOS | Abcam | Ab15323 | Rabbit | 140 KDa |
| NeuN | Millipore | MAB377 | Mouse | 46/48 kDa |
| Synaptophysin | Abcam | Ab8049 | Mouse | 34 KDa |
| TLR4 | Abcam | Ab22048 | Mouse | 90 KDa |
| Tubulin | Abcam | Ab18207 | Rabbit | 50/55 kDa |
| P3 | P4 | P5 | P6 † | P11 † | P18 † | P25 † | |
|---|---|---|---|---|---|---|---|
| Sham (n = 10) | 9.31 ± 1.15 | 10.95 ± 1.07 | 13.19 ± 1.51 | 15.24 ± 1.43 | 25.8 ± 2.15 | 41.4 ± 2.91 | 74.12 ± 6.08 |
| HI (n = 18) | 8.88 ± 1.10 | 10.01 ± 1.44 | 11.88 ± 1.86 | 13.48 ± 2.22 .06 | 23.2 ± 2.62 * | 38.06 ± 4.23 | 67.81 ± 8.97 * |
| HILf0.1 (n = 29) | 9.25 ± 1.56 | 10.62 ± 1.43 | 12.00 ± 1.77 | 13.93 ± 1.73 | 23.79 ± 2.94 | 36.69 ± 4.55 *a | 65.05 ± 8.20 *a |
| HILf1 (n = 20) | 9.44 ± 0.50 | 10.41 ± 0.78 | 11.90 ± 1.17 | 13.75 ± 1.55 | 23.65 ± 2.13 | 38.65 ± 2.92 | 67.27 ± 6.86 * |
| HILf10 (n = 27) | 9.17 ± 0.87 | 10.11 ± 1.02 | 11.67 ± 1.33 | 13.11 ± 1.36 * | 22.52 ± 1.78 * | 36.56 ± 3.22 *c | 66.42 ± 6.79 *c$ |
Publisher’s Note: MDPI stays neutral with regard to jurisdictional claims in published maps and institutional affiliations. |
© 2021 by the authors. Licensee MDPI, Basel, Switzerland. This article is an open access article distributed under the terms and conditions of the Creative Commons Attribution (CC BY) license (https://creativecommons.org/licenses/by/4.0/).
Share and Cite
Sanches, E.; van de Looij, Y.; Sow, S.; Toulotte, A.; da Silva, A.; Modernell, L.; Sizonenko, S. Dose-Dependent Neuroprotective Effects of Bovine Lactoferrin Following Neonatal Hypoxia–Ischemia in the Immature Rat Brain. Nutrients 2021, 13, 3880. https://doi.org/10.3390/nu13113880
Sanches E, van de Looij Y, Sow S, Toulotte A, da Silva A, Modernell L, Sizonenko S. Dose-Dependent Neuroprotective Effects of Bovine Lactoferrin Following Neonatal Hypoxia–Ischemia in the Immature Rat Brain. Nutrients. 2021; 13(11):3880. https://doi.org/10.3390/nu13113880
Chicago/Turabian StyleSanches, Eduardo, Yohan van de Looij, Sadou Sow, Audrey Toulotte, Analina da Silva, Laura Modernell, and Stéphane Sizonenko. 2021. "Dose-Dependent Neuroprotective Effects of Bovine Lactoferrin Following Neonatal Hypoxia–Ischemia in the Immature Rat Brain" Nutrients 13, no. 11: 3880. https://doi.org/10.3390/nu13113880
APA StyleSanches, E., van de Looij, Y., Sow, S., Toulotte, A., da Silva, A., Modernell, L., & Sizonenko, S. (2021). Dose-Dependent Neuroprotective Effects of Bovine Lactoferrin Following Neonatal Hypoxia–Ischemia in the Immature Rat Brain. Nutrients, 13(11), 3880. https://doi.org/10.3390/nu13113880