Abstract
Tomatoes are rich in secondary metabolites such as lycopene, β-carotene, phenolics, flavonoids, and vitamin C, which are responsible for their antioxidant activates. A high level of γ-Aminobutyric acid (GABA), a health-promoting functional compound, was also found to accumulate in tomato fruit. In addition to the internal quality attributes, the acceptance of the tomato fruit by consumers is highly dependent on appearance and taste. Hence, we conducted this study to evaluate ‘Tori’, ‘TY VIP’, ‘Mamirio’, and ‘Arya’ tomato cultivars based on their physicochemical characteristics, contents of secondary metabolites, and GABA content. The results have revealed that the tested cultivars were very firm, which renders them the best choice for postharvest distribution of fresh market tomatoes as they resist impacts during harvesting and postharvest operations. Based on total soluble solids (TSS), titratable acidity (TA), and Brix acid ratio (BAR) the choice of cultivar could be ‘Mamirio’ > ’Tori’ > ‘TY VIP’ > ‘Arya’. Apart from flavor intensity, ‘Mamirio’ and ’Tori’ also revealed the highest content of ascorbic acid while ‘Mamirio’ and ‘Arya’ had the highest carotenoids (lycopene and β-carotene) accumulation. On the other hand, the highest total phenolics content was recorded from ‘TY VIP’ and ‘Arya’. Moreover, the highest total flavonoids and GABA contents were recorded from ‘TY VIP’. Nevertheless, the antioxidant activity of ‘TY VIP’ was the lowest of all tested cultivars while the highest was recorded from ‘Mamirio’. Taken together, the findings of the present study could suggest that the consumers’ requirements could be better fulfilled by choosing cultivars for the specific target functional compounds. From the tested cultivars, if the target is ascorbic acid, carotenoids, and antioxidant activity then ‘Mamirio’ is the best choice. On the other hand, if the target is total phenolics, flavonoids, and GABA then ‘TY VIP’ is the best choice. One could also label ‘Mamirio’ as an ‘antioxidant tomato’ and ‘TY VIP’ as the ‘GABA tomato’.
1. Introduction
Tomato (Solanum lycopersicum L.) is a vegetable crop belonging to the Solanaceae (nightshade) family and it is native to the Andean region [1]. It is one of the most popular vegetable crops in the world in terms of production and consumption. According to the Food and Agriculture Organization’s corporate statistical database (FAOSTAT) [2], the world production of this crop in particular is 180.77 million tons from 5.03 million ha and Asia holds 60.1% of the production share. The production in the Republic of Korea in 2019 was 420,573 tons from 6460 ha of land [2].
Tomatoes are one of the most widely consumed horticultural crops in a diversified fresh or processed form. The tomato water content is very high (approximately 93–95%) and solid matter content varies from 5.5–9.5% [3]. The crop contributes to overall health benefit [4]. It is rich in antioxidants such as vitamin C and E, lycopene, phenolics, flavonoids, and β-carotene [5], which may protect cells from the damage caused by free radicals [6]. Daily intake of tomatoes and their derivatives has the potential to lower the risk of many forms of cancer and cardiovascular diseases because of the protective effect of the antioxidants [3,7].
γ-Aminobutyric acid (GABA) is a four-carbon non-proteinogenic amino acid that is widely found in plants, animals, and bacteria [8]. GABA has received much attention as a health-promoting functional compound due to its role as an inhibitory neurotransmitter in the central nervous system [9] and the observation that it reduces blood pressure, induces relaxation, and improves immunity when administered orally [10]. In plants, GABA is primarily metabolized through the GABA shunt pathway which is involved in many physiological responses such as defense against insects, protection from oxidative stresses, and response to diverse stimuli including heat shock and phytohormones [10]. A high level of GABA was found to accumulate in tomato fruit before the breaker stage and catabolized rapidly thereafter [8]. Hence, screening the tomato cultivars that possess higher secondary metabolites, which are responsible for providing their antioxidant activity and cultivars that maintain GABA after the breaker stage, could assist in improving the nutritional quality of tomatoes.
In addition to the above-stated antioxidant properties and GABA content, the acceptance of tomato fruit by consumers is highly dependent on physicochemical characteristics such as firmness, color, total soluble solids (TSS), titratable acidity (TA), and Brix acid ratio (BAR) [11]. The physical properties such as color, shape, firmness, size, and absence of defects are the important components that determine the appearance. Color transformation, flavor changes, and loss of firmness are changes that take place during the maturation and ripening process [12,13]. The postharvest quality of tomatoes develops during the growth of the product and is dependent on several factors such as growing environment, agronomic practices, fertilization, and many other pre-harvest and post-harvest factors [11,14,15]. Moreover, research results have revealed the variation among tomato cultivars in their antioxidant properties and physicochemical properties [15,16,17]. Hence, the external and internal quality attributes during growing could be achieved by the selection of genotypes that must satisfy the consumers’ requirements. Therefore, this study was initiated to evaluate the antioxidant properties, amino acid content (mainly GABA), and physicochemical characteristics of four tomato cultivars that are commonly grown in the Republic of Korea.
2. Materials and Methods
2.1. Plant Material
Four tomato cultivars (‘Tori’, ‘TY VIP’, ‘Mamirio’, and ‘Arya’), which are commonly grown by the surrounding farmers, were selected and grown in the same climate-controlled greenhouse in Gangwon province, Republic of Korea, in spring 2019. The fertigation solution was prepared with EC 2.0–2.2 dS m−1 and pH 5.5–5.8 depending on the growth stages. Harvest maturity was attained after 72 days from transplanting. The fruits were harvested from the third cluster of each plant and the fruits at the edge of the cluster have not been included in the experiment. Fruits free from any physical defects and of uniform size were at the pink stage using the United States Department of Agriculture (USDA) tomato ripeness color classification chart [18]. Sorting of the pink stage was conducted again in the laboratory using the color chart developed by USDA [18]. After selection, the physicochemical data were taken immediately and samples for the analysis of important secondary metabolites (lycopene, β-carotene, ascorbic acid, polyphenols, and flavonoids) and antioxidant activity were frozen by liquid nitrogen and placed in a deep freezer (−80 °C) for about three weeks until analysis. Samples for GABA analysis were freeze dried, grounded to fine powder, filtered with 40-µm mesh, and then stored at −20 °C until extraction.
2.2. Firmness
The firmness of tomato fruit was determined using the methodology described by Tilahun et al. [16]. Measurements were made at the equator of the fruit using a Rheometer (Sun Scientific Co. Ltd., Tokyo, Japan) fitted with a 3 mm diameter round stainless-steel probe having a flat end and the results were expressed in N.
2.3. Total Soluble Solids (TSS), Titratable Acidity (TA), and Brix Acid Ratio (BAR)
TSS and TA were determined based on Tilahun et al. [19]. The tomato fruit was cut into two halves, squeezed by hand, and then filtered with gauze (Daehan Medical Supply Co., Ltd., Seoul, Korea). The TSS was measured from five sample fruits at 20 °C using a Atago DR-A1 digital refractometer (Atago Co. Ltd., Tokyo, Japan) and expressed in degree Brix (°Bx). TA was determined after titrating diluted tomato juice (1 mL juice: 19 mL distilled water) with 0.1 N NaOH until pH of 8.1 using a DL22 Food and Beverage Analyzer (Mettler Toledo Ltd., Zurich, Switzerland). The citric acid (mg 100 g−1) of fresh tomato weight was used to express the TA result. BAR was determined by dividing the TSS with TA [20].
2.4. Color Changes
The color of the tomato fruit was determined using the Hunter a * (redness), b * (yellowness), and L * (brightness) values [21] by a CR-400 Chroma meter (Minolta, Tokyo, Japan). Color variables were measured three times from each tomato close to the equatorial section and the average value was calculated.
2.5. Lycopene and β-Carotene Content
Measurements of lycopene and β-carotene content were performed with a spectrophotometer (Thermo Fisher Scientific, Waltham, MA, USA). The lycopene content was measured from three tomato samples based on the Fish et al. [22] method with some adjustments as stated by Tilahun et al. [23]. The β-carotene content was also measured from three tomato samples as described by Tilahun et al. [23]. Quantification of lycopene content was then expressed as mg kg−1 of fresh weight, according to the method reported by Fish et al. [22], and the β-carotene content was quantified and expressed as mg kg−1 by comparing the sample readings with the standard curve.
2.6. Ascorbic Acid
A tomato fruit sample (1 g) was mixed with 10 mL of 5% metaphosphoric acid and homogenized for 1 min. The homogenized sample was centrifuged (7828× g for 10 min), the liquid layer of extracts was membrane-filtered (0.22 µm) (Advantec, Tokyo, Japan), and analyzed as described by Kim et al. [24]. Analysis was performed by using ZORBAX Eclipse XDB-C18 (4.6 × 250 mm, 5 µm, Agilent, Santa Clara, CA, USA) column and detector (UV-2075, Jasco, Tokyo, Japan) at 265 nm. MeOH: 0.1 M KH2PO4 (1:9 ratio) was used as the mobile phase.
2.7. Total Phenolics and Flavonoids
A method described by Tilahun et al. [25] was used for the determination of total phenolics content. Briefly, 2 g of each tomato sample was extracted with 20 mL of 0.05% (v/v) aqueous HCl/methanol (10:90, v/v) using a homogenizer (Ultra Turrax T18 Basic, IKA, Staufen, Germany) at speed 5000 rpm for 1 min and the homogenate was membrane-filtered (0.22 µm) (Advantec, Tokyo, Japan). The sample extract (0.2 mL) was mixed with 2.6 mL of deionized water, 2 mL of 7% (w/v) Na2CO3, and 0.2 mL of Folin-Ciocalteu’s phenol reagent. After incubating at 23 °C for 90 min, a spectrophotometer (Thermofisher Scientific, Waltham, MA, USA) was used to measure the absorbance of the reaction mixture at 750 nm against a blank sample containing the same mixture solution without the sample extract. The total phenolics content was expressed as mg of gallic acid equivalents (GAE) kg−1 fresh weight of the sample.
The total flavonoid content was determined using a method described by Zhishen et al. [26] with some modifications. Sample solution (0.5 mL) containing 5 mg mL−1 of the freeze-dried extract was mixed with 1.5 mL of ethanol, 0.1 mL of 10% aluminum nitrite solution, 0.1 mL of 1 M potassium acetate solution, and 2.8 mL distilled water. The mixture was stirred and permitted to react for 30 min. The absorbance was then measured at 415 nm using a microplate reader (Spectramax i3, Molecular Devices, Sunnyvale, CA, USA). The measurements were compared to a calibration curve of rutin and the results were expressed as milligrams of rutin equivalents (RE) per kg−1 fresh weight of the sample.
2.8. Amino Acids Mainly γ-Aminobutyric Acid (GABA)
Freeze dried fruit samples were extracted by 75% EtOH with ultrasonic extraction for 1 h followed by extraction at room temperature for 24 h. Analysis was made after filtering the extract with 0.2 µm filter. The amino acids content including GABA content was measured by Dionex Ultimate 3000 HPLC using the method described by Henderson et al. [27].
2.9. Antioxidant Activity
The DPPH spectrophotometric assay (Thermofisher Scientific, Madison, WI, USA) was used, as described by Pataro et al. [28], to determine the antioxidant activity from the same extract used for total phenolic content.
2.10. Statistical Analysis
The experiment was conducted in a completely randomized design. The data were subjected to analysis of variance (ANOVA) in order to determine the significance of differences between cultivars at p < 0.05 using SAS statistical software (SAS/STAT ® 9.1; SAS Institute Inc., Cary, NC, USA). Duncan’s multiple range test was performed to observe differences between the treatment means. Heat map analysis was used to visualize the differences in amino acids content between the cultivars.
3. Results and Discussion
3.1. Firmness
Firmness is one of the main aspects that consumers use to evaluate the quality of fresh tomato fruit [29]. It is also an important characteristic for resistance against mechanical injury during harvest or postharvest operations [15]. A statistically significant difference (p < 0.05) in firmness was observed among the four tomato cultivars in the present study (Table 1). The highest value (11.88 N) and the lowest value (8.31 N) of firmness were recorded from ‘Mamirio’ and ‘TY VIP’ cultivars, respectively, although the difference between ‘Mamirio’, ‘Tori’, and ‘Arya’ was not significant. Several research results have also found significant differences among different cultivars showing the dependence of firmness on cultivars [15,16,19,30,31]. However, the firmness result from all the four cultivars was above the recommended limits for home consumption (1.28 N) and retailers (1.46 N) [32]. This means that all the tested cultivars were very firm, which makes them the best choice for postharvest distribution of fresh market tomatoes as they resist impacts during harvesting and postharvest operations.

Table 1.
Firmness, TSS, TA, and BAR of ‘Tori’, ‘TY VIP’, ‘Mamirio’, and ‘Arya’ tomato cultivars at the commercial pink ripening stage.
3.2. TSS, TA, and BAR
The main components of soluble solids are soluble sugars and organic acids, which affects the sweetness, sourness, and flavor intensity of tomato [33]. The current study result has shown the effect of cultivars on the content of total soluble solids. The cultivar ‘TY VIP’ had significantly higher TSS (5.34 °Bx) content while ‘Tori’, ‘Mamirio’, and ‘Arya’ are statistically similar to one another (Table 1). In agreement with this result, Tilahun et al. [25] have found a significant difference among two cultivars in TSS ranging from 5.16 to 5.62%.
Even though citric acid, malic acid, and glutamic acid are the contributors to TA, citric acid is the major one and low TA is assumed to be due to loss of citric acid during maturity or over maturity [34]. Similar to TSS, TA of the fruit also contributes to the flavor of the tomato [35]. The statistical analysis of the current study has shown a significant difference between the cultivars in TA content. ‘Mamirio’ was found to be the cultivar with the lowest (0.26) acidity, while ‘Arya’ possessed the highest (0.59) acidity (Table 1). Similarly, Tigist et al. [36] have found a significant difference in TSS and TA among different tomato cultivars.
In addition to the contribution to the sweetness and sourness of tomatoes, since both TSS and TA are the major factors in overall flavor intensity, BAR data could be improved in the estimation of flavor intensity of the fruits [20]. Hence, increasing BAR could contribute to improving the flavor of tomatoes because the lack of flavor is the common complaint about fresh market tomatoes. In the present study, BAR was inversely related to TA. ‘Mamirio’ had the highest (18.61) BAR, while ‘Arya’ had the lowest (7.56) (Table 1). Hence, the choice of cultivar could be ‘Mamirio’ > ’Tori’ > ‘TY VIP’ > ‘Arya’ based on BAR.
3.3. Color Values
Color, which is derived from natural pigments, is the most commonly used criteria that determine the fruit’s appearance and affects consumers’ preference [34]. In the present study, harvesting at the commercial pink stage was preferred based on its relevance on functional substances (mainly to balance the contents of antioxidant properties and changes in GABA content since GABA catabolizes rapidly after breaker stage) and suitability for the postharvest distribution of fresh market tomatoes since the pink stage resists impact during harvesting and postharvest operations. Moreover, it was based on the growers’ experience to fulfill the consumers’ requirements. Objective color measurements were made by a Chroma meter and evaluated using Hunter a *, b *, and L * color values. The result of the present study revealed that the hunter a *, b *, and L * values were significantly different (p < 0.05) among all cultivars. The highest hunter a * value (+22.04) was recorded from the ‘Mamirio’ cultivar and this indicated more redness of the fruit while ‘Tori’, ‘TY VIP’, and ‘Arya’ showed statistically similar hunter a * values (Figure 1). The distinctive red color in tomato fruit is due to the accumulation of lycopene, which constitutes 98% of its carotenoid [37]. The accumulation takes place during ripening from the breakdown of chlorophyll, which is a genetically programmed process [38]. The highest hunter b * values (+24.74) and (+24.65) were recorded from ‘Mamirio’ and ‘Arya’, respectively, demonstrating more yellowness due to the higher content of β-carotene [23], while the lowest (+16.46) were recorded from ‘TY VIP’. Regarding hunter L *, ‘Mamirio’ was the cultivar that possessed more bright fruit among the four cultivars (Figure 1). Similar to this study, Kaur et al. [39] and Tilahun et al. [19] have found a significant color difference between tomato cultivars.
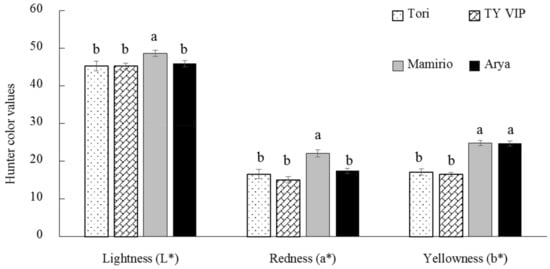
Figure 1.
Hunter’s L *, a *, and b *color values of ‘Tori’, ‘TY VIP’, ‘Mamirio’, and ‘Arya’ tomato cultivars at the commercial pink ripening stage. The bars with different letters indicate a significant difference (p < 0.05) between cultivars. The vertical bars represent the standard error of the means (n = 5).
3.4. Lycopene and β-Carotene Content
The transformation of chloroplasts to chromoplasts results in the characteristic pigmentation of tomato fruit due to the synthesis of carotenoids [38]. As the ripe tomato fruit accumulates lycopene (red linear carotene), it also accumulates its orange cyclization pro-vitamin A product (β-carotene) [40,41]. Lycopene is one of the most active antioxidants among dietary carotenoids, which is responsible for the redness of tomato fruit [42] and responsible for the biosynthesis of many carotenoids such as β-carotene [43]. The present study has demonstrated that there are significant variations among cultivars in lycopene content. ‘Mamirio’ was the highest (42.84 mg kg−1) in lycopene content and was followed by ‘Arya’ (35.30 mg kg−1). ‘Tori’ and ‘TY VIP’ were statistically the same in lycopene content. The lowest (24.86 mg kg−1) was recorded from ‘TY VIP’ (Figure 2). Similar results were recorded from different studies supporting the variation of lycopene content among cultivars. Its amount in fresh tomato and tomato products shows variation depending on the cultivars and other factors [11]. According to Dominguez et al. [44], the amount of lycopene could range from 19 to 65 mg kg−1 fresh weight in ripened tomato fruits. Kaur et al. [39] have also found significantly different lycopene content among seven tomato cultivars ranging from 79.7 to 142.8 mg kg−1. Similarly, Dobrin et al. [45] and Thompson et al. [46] have also found different lycopene content among tomato cultivars ranging from 47.4 to 66.4 mg kg−1 and 41.54 to 55.60 mg kg−1, respectively.
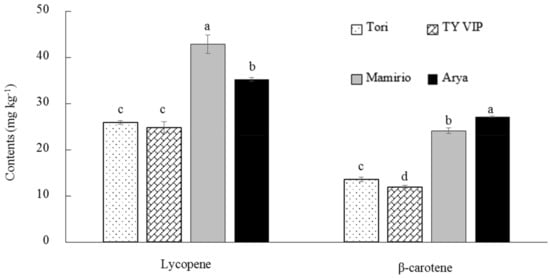
Figure 2.
Lycopene and β-carotene contents of ‘Tori’, ‘TY VIP’, ‘Mamirio’, and ‘Arya’ tomato cultivars at the commercial pink ripening stage. The bars with different letters indicate a significant difference (p < 0.05) between cultivars. The vertical bars represent the standard error of the means (n = 5).
In the present study, a significant variation among cultivars in β-carotene was also observed. ‘Arya’ was the highest (27.17 mg kg−1) in β-carotene content, while ‘TY VIP’ exhibited the lowest (11.97 mg kg−1). The range of β-carotene (11.97–27.17 mg kg−1) in the present study is higher than in previous reports (Figure 2). Baranska et al. [47] reported β-carotene content ranging from 2.3 to 7.8 mg kg−1 from six fresh tomato samples. Similarly, Tilahun et al. [23] reported β-carotene content ranging from 0.24 to 8.72 mg kg−1 from ‘244′ tomato cultivar that was harvested at different maturity stages. Overall, although this study was conducted at the commercial pink stage, the lycopene contents of all four cultivars were in the range of previous reports and their β-carotene contents were higher than previous reports. The results of the present study also confirm that higher hunter a * and b *values are corresponded to higher contents of lycopene and β-carotene contents (Figure 1 and Figure 2).
3.5. Ascorbic Acid
Tomatoes are rich in ascorbic acid (vitamin C) [48], which is easily absorbed by the body. It has a lot of health benefits such as preventing low-density lipoprotein oxidation, fighting scurvy, maintaining collagen, and ameliorate neurodegenerative disease [44,49]. As observed from this study, the content of vitamin C in tomato fruit is dependent on cultivars. Vitamin C has significantly varied among the four studied cultivars with the highest content (65.63 mg 100 g−1) recorded in ‘Mamirio’ and lowest (42.65 mg 100 g−1) in ‘TY VIP’ (Figure 3). Similar to the current study, Tilahun et al. [31] reported cultivar dependent ascorbic acid content ranging from 20.01 to 31.14 and from 20.97 to 30.16 mg 100 g−1 for ‘TY megaton’ and ‘Yureka’ tomato cultivars, respectively. Violeta et al. [50] have also reported a significant difference among ten tomato cultivars in their ascorbic acid content ranging from 9.58 to 32.97 mg 100 g−1. However, the range of ascorbic acid (42.65–65.63 mg 100 g−1) in the present study is higher than those reported by Tilahun et al. [31] and Violeta et al. [50], indicating a higher ascorbic acid content of all the tested cultivars in the order of ‘Mamirio’ > ’Tori’ > ‘Arya’ > ‘TY VIP’(Figure 3).
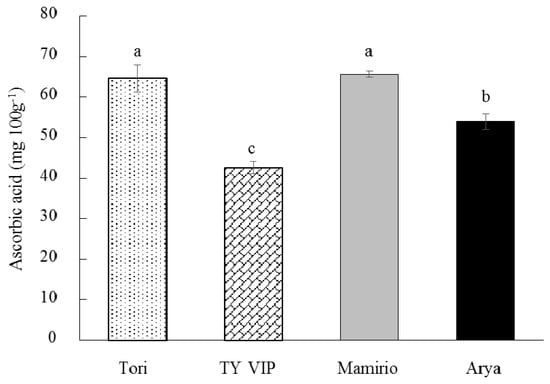
Figure 3.
Ascorbic acid content of ‘Tori’, ‘TY VIP’, ‘Mamirio’, and ‘Arya’ tomato cultivars at the commercial pink ripening stage. The bars with different letters indicate a significant difference (p < 0.05) between cultivars. The vertical bars represent the standard error of the means (n = 5).
3.6. Total Phenolics and Flavonoids
Phenolics are a large group of molecules [51] that function as natural antioxidants in plants [52]. They can prevent chronic diseases related to excess free radicals [53] by reducing oxidative stress [48]. In this study, the tested four cultivars have shown significantly different contents of total phenolics. The ‘TY VIP’ and ‘Arya’ cultivars had statistically similar highest results of total phenolics (736.52 and 730.15 mg kg−1, respectively), while the lowest (182.38 mg kg−1) was recorded from ‘Tori’ (Figure 4). Several studies have shown the difference between tomato cultivars in total phenolics content and the results of the current study are within the range of previous reports. Violeta et al. [50] have reported the total phenolics ranging from 312.2 to 557.8 mg GAE kg−1 among ten cultivars. Periago et al. [54] have also reported significant variation ranging from 259.15 to 498.60 mg kg−1 among nine varieties of fresh tomato cultivars.
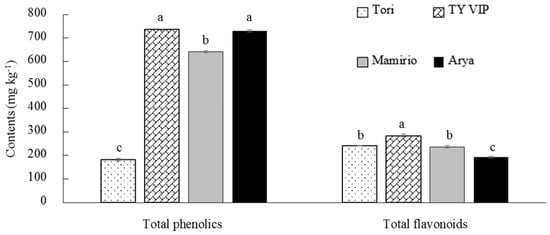
Figure 4.
Total phenolics and flavonoids content of ‘Tori’, ‘TY VIP’, ‘Mamirio’, and ‘Arya’ tomato cultivars at the commercial pink ripening stage. The bars with different letters indicate a significant difference (p < 0.05) between cultivars. The vertical bars represent the standard error of the means (n = 5).
Flavonoids are the main component of total phenolics [55]. They have high antioxidant power that significantly contributes to the health benefit [56]. Hence, efforts have been made to elevate flavonoids concentration in different tomato cultivars [57,58]. The flavonoid content in the present study has shown significant variation among the four cultivars ranging from 192.22 mg kg−1 in ‘Arya’ to 284.01 mg kg−1 in ‘TY VIP’ (Figure 4). Previous results ranging from 40 to 260 mg kg−1 were also reported by Slimestad et al. [57] for samples of different types of tomatoes observed. Taken together, all the tested cultivars in the present study have shown higher contents of total phenolics and flavonoids as compared to the previous reports. Moreover, ‘TY VIP’ and ‘Mamirio’ could be preferred in terms of total phenolics and flavonoids from the tested cultivars as indicated in Figure 4.
3.7. Free Amino Acids and γ-Aminobutyric Acid (GABA)
The content of free amino acids was significantly (p < 0.05) different among the four cultivars. From the tested cultivars, the total free amino acid content of ‘TY VIP’ was the highest (57.31 g kg−1) followed by ‘Mamirio’ (41.08 g kg−1), ‘Tori’ (39.76 g kg−1), and ‘Arya’ (38.81 g kg−1), respectively (Table 2). In agreement with the current results, Ahn [59] tested ‘Rafito’, ‘Momotaro’, and ‘Medison’ tomato cultivars and reported that the total free amino acid content ranged from 38.10 to 45.94 g kg−1 dry weight. Of all free amino acids, glutamic acid (glutamate) was the most abundant free amino acid in all the four cultivars and ranged from 17.93 g kg−1 for ‘TY VIP’ to 15.17 g kg−1 for ‘Arya’. Glutamine was the second most abundant free amino acid in all the four tested cultivars. The contents ranged from 17.98 g kg−1 in ‘TY VIP’ to 11.43 g kg−1 in ‘Mamirio’. Sorrequieta et al. [60] also reported glutamine and glutamate as the most abundant free amino acid during the ripening of tomato fruit. The relative proportions of aspartic acid, GABA, and asparagine were also higher than the other amino acids in all tested cultivars (Table 2 and Figure S1). Hence, glutamic acid, glutamine, aspartic acid, GABA, and asparagine were the abundant amino acids in all the four cultivars, comprising 80.65 to 89.98% of total free amino acids (Table 2). Ahn [59] also reported glutamic acid, glutamine, and aspartic acid as the primary amino acids that comprise 82.19 to 84.14% of total free amino acids in ‘Rafito’, ‘Momotaro’, and ‘Medison’ tomato cultivars. Similarly, Pratta et al. [61] reported a significant variation of free amino acids among different tomato genotypes and higher relative content of glutamine, glutamate, asparagine, aspartate, and GABA in all tested genotypes.
Table 2.
Free amino acid content of ‘Tori’, ‘TY VIP’, ‘Mamirio’, and ‘Arya’ tomato cultivars at commercial pink ripening stage.
3.8. Antioxidant Activity
Of the total free amino acids, the essential amino acid content ranged from 2.42 g kg−1 (6.09%) in ‘Tori’ to 6.84 g kg−1 (11.93%) in ‘TY VIP’. There was also a significant difference (p < 0.05) in the contents of essential amino acids of the four cultivars. The levels of nine essential amino acids (histidine, isoleucine, leucine, lysine, methionine, phenylalanine, threonine, tryptophan, and valine) can be used to measure the quality of the protein in a foodstuff [59]. All the four cultivars demonstrated a good balance of all the essential amino acids in the following order: ‘TY VIP’ > ‘Arya’ > ‘Mamirio’ > ‘Tori’.
A high level of GABA was found to accumulate in tomato fruit before the breaker stage and catabolized rapidly thereafter [8]. In the present study, ‘TY VIP’ significantly dominates the other three cultivars in terms of GABA content at commercial pink stage (Table 2 and Figure S2). Sorrequieta et al. [60] emphasized that the GABA content reduced significantly during the ripening transition. Hence, screening the tomato cultivars that maintain GABA after the breaker stage could assist in improving the nutritional quality of tomatoes. In this study, the highest GABA content (4.05 g kg−1) was recorded from ‘TY VIP’, while the lowest (2.20 g kg−1) was recorded from ‘Arya’ at the pink stage (Table 2 and Figure S2). Therefore, the order of preference in terms of GABA content could be ‘TY VIP’ > ‘Tori’ and ‘Mamirio’ > ‘Arya’. Similar to the present findings, Akihiro et al. [8] reported differences among cultivars in terms of GABA content and labeled ‘DG03-9′ as GABA rich cultivar.
The nutritional quality of tomato fruit is strongly dependent on antioxidants [56]. The antioxidant activities of the four cultivars in the present study were significantly different ranging from 89.04% in ‘TY VIP’ to 99.16% in ‘Mamirio’ (Figure 5). The methanol extracts of the tested cultivars in the present study showed excellent scavenging effects similar to the results reported by Chang et al. [62], who reported antioxidant activity ranging from 87.7 to 99.7% for methanol extracts from fresh and various processed tomatoes. In agreement with the current study, Tilahun et al. [19] reported significant differences between ‘TY Megaton’ and ‘Yureka’ tomato cultivars in antioxidant activity. As observed in Figure 5 the order of preference in terms of antioxidant activity could be ‘Mamirio’ > ‘Tori’ > ‘Arya’ > ‘TY VIP’.
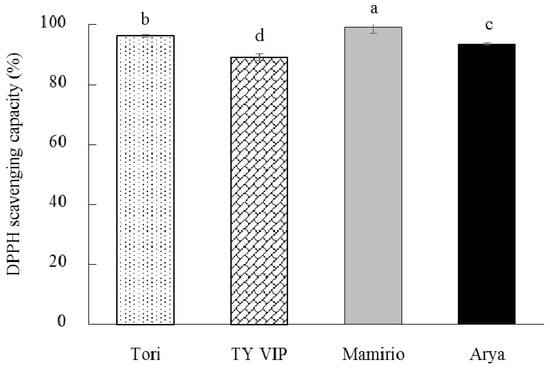
Figure 5.
Antioxidant activity of ‘Tori’, ‘TY VIP’, ‘Mamirio’, and ‘Arya’ tomato cultivars at commercial pink ripening stage. The bars with different letters indicate a significant difference (p < 0.05) between cultivars. The vertical bars represent the standard error of the means (n = 5).
4. Conclusions
The results of the present study revealed that the tested ‘Tori’, ‘TY VIP’, ‘Mamirio’, and ‘Arya’ tomato cultivars were very firm which renders them the best choice for postharvest distribution of fresh market tomatoes as they resist impacts during harvesting and postharvest operations. Furthermore, their color meets consumers’ preferences as the fruits were harvested at the commercial pink stage and in the range of previous reports. However, based on TSS, TA, and BAR for overall flavor intensity, the choice of cultivar from the four tested cultivars could be ‘Mamirio’ > ’Tori’ > ‘TY VIP’ > ‘Arya’. Apart from flavor intensity, ‘Mamirio’ and ’Tori’ also revealed the highest content of ascorbic acid, while ‘Mamirio’ and ‘Arya’ had the highest carotenoids (lycopene and β-carotene) accumulation. On the other hand, the highest total phenolics content was recorded from ‘TY VIP’ and ‘Arya’. Moreover, the highest total flavonoids and GABA contents were recorded from ‘TY VIP’. Nevertheless, the antioxidant activity of ‘TY VIP’ was the lowest of all tested cultivars while the highest was recorded from ‘Mamirio’. The findings of the present study could suggest that the cumulative effect of all functional substances could affect the antioxidant activity of tomato fruit. In order to fulfill the consumers’ requirements, it would be better to choose cultivar/s based on the specific functional compound. For instance, if the target is ascorbic acid, carotenoids, or antioxidant activity then ‘Mamirio’ is the best choice and one could label it as ‘antioxidant tomato’. On the other hand, if the target is total phenolics, flavonoids, or GABA then ‘TY VIP’ is the best choice and it may be labeled ‘GABA tomato’.
Supplementary Materials
The following are available online at https://www.mdpi.com/article/10.3390/agronomy11061204/s1, Figure S1: Heat map of the amino acids in ‘Arya’, ‘Tori’, ‘Mamirio’, and ‘TY VIP’ tomato cultivars. Three replicates were analyzed using three fruit for each replicate. The data were standardized for heat map. Figure S2: GABA content of ‘Tori’, ‘TY VIP’, ‘Mamirio’, and ‘Arya’ tomato cultivars at commercial pink ripening stage.
Author Contributions
Conceptualization, S.T., H.-R.C. and C.-S.J.; methodology, S.T. and H.-R.C. execution of experiment, S.T., M.-W.B., L.-H.C. and H.-R.C.; software, S.T. and T.S.; formal analysis, T.S. and H.-R.C.; resources, K.-W.K. and C.-S.J.; original draft preparation, T.S. and H.-R.C.; review and editing S.T., D.-S.P. and T.S.; supervision, C.-S.J.; project administration, M.-W.B. and K.-W.K.; funding acquisition, C.-S.J. All authors have read and agreed to the published version of the manuscript.
Funding
This work was supported by the National Research Foundation (NRF), Korea, under BK21 FOUR under project.
Institutional Review Board Statement
Not applicable.
Informed Consent Statement
Not applicable.
Data Availability Statement
All data sets are available upon reasonable request from the corresponding author.
Conflicts of Interest
The authors declare no conflict of interest.
References
- Costa, J.M.; Heuvelink, E. Introduction: The Tomato Crop and Industry. Oxford-CAB International: Wallingford, UK, 2015; ISBN 0851993966. [Google Scholar]
- FAOSTAT Food & Agriculture Organization of the United Nations Statistics Division. Available online: http://faost at3.fao.org/home/index.html (accessed on 20 December 2020).
- Nasir, M.U.; Hussain, S.; Jabbar, S. Tomato processing, lycopene and health benefits: A review. Sci. Lett. 2015, 3, 1–5. [Google Scholar]
- Burton-Freeman, B.; Reimers, K. Tomato Consumption and Health: Emerging Benefits. Am. J. Lifestyle Med. 2011, 5, 182–191. [Google Scholar] [CrossRef]
- Toor, R.K.; Savage, G.P. Antioxidant activity in different fractions of tomatoes. Food Res. Int. 2005, 38, 487–494. [Google Scholar] [CrossRef]
- Hamid, A.A.; Aiyelaagbe, O.O.; Usman, L.A.; Ameen, O.M.; Lawal, A. Antioxidants: Its medicinal and pharmacological applications. Afr. J. Pure Appl. Chem. 2010, 4, 142–151. [Google Scholar]
- Borguini, R.G.; Helena, D.; Bastos, M.; Moita-Neto, J.M.; Capasso, F.S.; Aparecida, E.; Da, F.; Torres, S. Brazilian Archives of Biology and Technology Antioxidant Potential of Tomatoes Cultivated in Organic and Conventional Systems. Arch. Biol. Technol. 2013, 56456, 521–529. [Google Scholar] [CrossRef]
- Akihiro, T.; Koike, S.; Tani, R.; Tominaga, T.; Watanabe, S.; Iijima, Y.; Aoki, K.; Shibata, D.; Ashihara, H.; Matsukura, C. Biochemical mechanism on GABA accumulation during fruit development in tomato. Plant Cell Physiol. 2008, 49, 1378–1389. [Google Scholar] [CrossRef] [PubMed]
- Owens, D.F.; Kriegstein, A.R. Is there more to GABA than synaptic inhibition? Nat. Rev. Neurosci. 2002, 3, 715–727. [Google Scholar] [CrossRef]
- Takayama, M.; Ezura, H. How and why does tomato accumulate a large amount of GABA in the fruit? Front. Plant Sci. 2015, 6, 612. [Google Scholar] [CrossRef] [PubMed]
- Shimeles, T.; Do, S.P.; Mu, H.S.; Cheon, S.J. Review on factors affecting the quality and antioxidant properties of tomatoes. Afr. J. Biotechnol. 2017, 16, 1678–1687. [Google Scholar] [CrossRef]
- Farneti, B. Tomato Quality: From the Field to the Consumer Interactions between Genotype, Cultivation Brian Farneti. Ph.D. Thesis, Wageningen University, Wageningen, Netherlands, 2014. [Google Scholar]
- Taye, A.M.; Tilahun, S.; Seo, M.H.; Park, D.S.; Jeong, C.S. Effects of 1-MCP on Quality and Storability of Cherry Tomato (Solanum lycopersicum L.). Horticulturae 2019, 5, 29. [Google Scholar] [CrossRef]
- Fanasca, S.; Colla, G.; Maiani, G.; Venneria, E.; Rouphael, Y.; Azzini, E.; Saccardo, F. Changes in antioxidant content of tomato fruits in response to cultivar and nutrient solution composition. J. Agric. Food Chem. 2006, 54, 4319–4325. [Google Scholar] [CrossRef]
- Peixoto, J.V.M.; Garcia, L.G.C.; Nascimento, A.D.R.; Moraes, E.R.D.; Ferreira, T.A.P.D.C.; Fernandes, M.R.; Pereira, V.D.A. Post-harvest evaluation of tomato genotypes with dual purpose. Food Sci. Technol. 2018, 38, 255–262. [Google Scholar] [CrossRef]
- Tilahun, S.; Seo, M.H.; Park, D.S.; Jeong, C.S. Effect of cultivar and growing medium on the fruit quality attributes and antioxidant properties of tomato (Solanum lycopersicum L.). Hortic. Environ. Biotechnol. 2018, 59, 215–223. [Google Scholar] [CrossRef]
- Lenucci, M.S.; Cadinu, D.; Taurino, M.; Piro, G.; Dalessandro, G. Antioxidant composition in cherry and high-pigment tomato cultivars. J. Agric. Food Chem. 2006, 54, 2606–2613. [Google Scholar] [CrossRef] [PubMed]
- United States Standards for Grades of Fresh Tomatoes (USDA). 1997. Available online: https://hort.purdue.edu/prod_quality/quality/tomatfrh.pdf (accessed on 10 November 2020).
- Tilahun, S.; Park, D.S.; Taye, A.M.; Jeong, C.S. Effect of ripening conditions on the physicochemical and antioxidant properties of tomato (Lycopersicon esculentum Mill.). Food Sci. Biotechnol. 2017, 26, 473–479. [Google Scholar] [CrossRef]
- Choi, H.R.; Tilahun, S.; Park, D.S.; Lee, Y.M.; Choi, J.H.; Baek, M.W.; Jeong, C.S. Harvest time affects quality and storability of kiwifruit (Actinidia spp.): Cultivars during long-term cool storage. Sci. Hortic. 2019, 256, 108523. [Google Scholar] [CrossRef]
- McGuire, R.G. Reporting of Objective Color Measurements. HortScience 1992, 27, 1254–1255. [Google Scholar] [CrossRef]
- Fish, W.W.; Perkins-Veazie, P.; Collins, J.K. A quantitative assay for lycopene that utilizes reduced volumes of organic solvents. J. Food Compos. Anal. 2002, 15, 309–317. [Google Scholar] [CrossRef]
- Tilahun, S.; Park, D.S.; Seo, M.H.; Hwang, I.G.; Kim, S.H.; Choi, H.R.; Jeong, C.S. Prediction of lycopene and β-carotene in tomatoes by portable chroma-meter and VIS/NIR spectra. Postharvest Biol. Technol. 2018, 136, 50–56. [Google Scholar] [CrossRef]
- Kim, H.S.; Jung, J.Y.; Kim, H.K.; Ku, K.M.; Suh, J.K.; Park, Y.; Kang, Y.H. Influences of Meteorological Conditions of Harvest Time on Water-Soluble Vitamin Contents and Quality Attributes of Oriental Melon. Prot. Hortic. Plant Fact. 2011, 20, 290–296. [Google Scholar]
- Tilahun, S.; Park, D.S.; Taye, A.M.; Jeong, C.S. Effects of storage duration on physicochemical and antioxidant properties of tomato (Lycopersicon esculentum Mill.). Korean J. Hortic. Sci. Technol. 2017, 35, 88–97. [Google Scholar] [CrossRef]
- Zhishen, J.; Mengcheng, T.; Jianming, W. The determination of flavonoid contents in mulberry and their scavenging effects on superoxide radicals. Food Chem. 1999, 64, 555–559. [Google Scholar] [CrossRef]
- Henderson, J.W.; Ricker, R.D.; Bidlingmeyer, B.A.; Woodward, C. Rapid, accurate, sensitive and reproducible HPLC analysis of amino acids. Amino Acids 2000, 1100, 1–10. [Google Scholar]
- Pataro, G.; Sinik, M.; Capitoli, M.M.; Donsì, G.; Ferrari, G. The influence of post-harvest UV-C and pulsed light treatments on quality and antioxidant properties of tomato fruits during storage. Innov. Food Sci. Emerg. Technol. 2015, 30, 103–111. [Google Scholar] [CrossRef]
- Wu, T.; Abbott, J.A. Firmness and force relaxation characteristics of tomatoes stored intact or as slices. Postharvest Biol. Technol. 2002, 24, 59–68. [Google Scholar] [CrossRef]
- Kabir, M.S.N.; Ali, M.; Lee, W.H.; Cho, S.I.; Chung, S.O. Physicochemical quality changes in tomatoes during delayed cooling and storage in a controlled chamber. Agriculture 2020, 10, 196. [Google Scholar] [CrossRef]
- Tilahun, S.; Park, D.S.; Solomon, T.; Choi, H.R.; Jeong, C.S. Maturity stages affect nutritional quality and storability of tomato cultivars. CyTA-J. Food 2019, 17, 87–95. [Google Scholar] [CrossRef]
- Batu, A. Determination of acceptable firmness and colour values of tomatoes. J. Food Eng. 2004, 61, 471–475. [Google Scholar] [CrossRef]
- Jones, R.A.; Scott, S.J. Improvement of tomato flavor by genetically increasing sugar and acid contents. Euphytica 1983, 32, 845–855. [Google Scholar] [CrossRef]
- Anthon, G.E.; Lestrange, M.; Barrett, D.M. Changes in pH, acids, sugars and other quality parameters during extended vine holding of ripe processing tomatoes. J. Sci. Food Agric. 2011, 91, 1175–1181. [Google Scholar] [CrossRef]
- Xu, S.; Sun, X.; Lu, H.; Yang, H.; Ruan, Q.; Huang, H.; Chen, M. Detecting and monitoring the flavor of tomato (Solanum lycopersicum) under the impact of postharvest handlings by physicochemical parameters and electronic nose. Sensors 2018, 18, 1847. [Google Scholar] [CrossRef]
- Tigist, M.; Workneh, T.S.; Woldetsadik, K. Effects of variety on the quality of tomato stored under ambient conditions. J. Food Sci. Technol. 2013, 50, 477–486. [Google Scholar] [CrossRef] [PubMed]
- Tadesse, T.N.; Ibrahim, A.M.; Abtew, W.G. Degradation and formation of fruit color in tomato (Solanum lycopersicum L.) in response to storage temperature. Am. J. Food Technol. 2015, 10, 147–157. [Google Scholar] [CrossRef]
- Pék, Z.; Helyes, L.; Lugasi, A. Color changes and antioxidant content of vine and postharvest-ripened tomato fruits. HortScience 2010, 45, 466–468. [Google Scholar] [CrossRef]
- Kaur, D.; Sharma, R.; Wani, A.A.; Gill, B.S.; Sogi, D.S. Physicochemical changes in seven tomato (Lycopersicon esculentum) cultivars during ripening. Int. J. Food Prop. 2006, 9, 747–757. [Google Scholar] [CrossRef]
- Rosati, C.; Aquilani, R.; Dharmapuri, S.; Pallara, P.; Marusic, C.; Tavazza, R.; Bouvier, F.; Camara, B.; Giuliano, G. Metabolic engineering of beta-carotene and lycopene content in tomato fruit. Plant J. 2000, 24, 413–420. [Google Scholar] [CrossRef]
- Carrillo-López, A.; Yahia, E.M. Changes in color-related compounds in tomato fruit exocarp and mesocarp during ripening using HPLC-APcI+-mass Spectrometry. J. Food Sci. Technol. 2014, 51, 2720–2726. [Google Scholar] [CrossRef]
- Davis, A.R.; Fish, W.W.; Perkins-Veazie, P. A rapid hexane-free method for analyzing lycopene content in watermelon. J. Food Sci. 2003, 68, 328–332. [Google Scholar] [CrossRef]
- Alda, L.M.; Gogoa, I.; Bordean, D.; Gergen, I.; Alda, S.; Moldovan, C.; Ni, L. Lycopene content of tomatoes and tomato products. J. Agroaliment. Process Technol. 2009, 15, 540–542. [Google Scholar]
- Rubén, D.; Gullon, P.; Pateiro, M.; Munekata, P.E.S.; Zhang, W.; Lorenzo, J.M. Tomato as Potential Source of Natural Additives for. Antioxidants 2020, 9, 73. [Google Scholar]
- Dobrin, A.; Nedelus, A.; Bujor, O.; Mot, A.; Zugravu, M.; Badulescu, L. Nutritional Quality Parameters of the Fresh Red Tomato Varieties Cultivated in Organic System. Sci. Pap. Ser. B. Hortic. 2019, LXIII, 439–443. [Google Scholar]
- Thompson, K.A.; Marshall, M.R.; Sims, C.A.; Wei, C.I.; Sargent, S.A.; Scott, J.W. Cultivar, maturity, and heat treatment on lycopene content in tomatoes. J. Food Sci. 2000, 65, 791–795. [Google Scholar] [CrossRef]
- Baranska, M.; Schütze, W.; Schulz, H. Determination of lycopene and β-carotene content in tomato fruits and related products: Comparison of FT-raman, ATR-IR, and NIR spectroscopy. Anal. Chem. 2006, 78, 8456–8461. [Google Scholar] [CrossRef]
- Chaudhary, P.; Sharma, A.; Singh, B.; Nagpal, A.K. Bioactivities of phytochemicals present in tomato. J. Food Sci. Technol. 2018, 55, 2833–2849. [Google Scholar] [CrossRef]
- Yahia, E.M.; Contreras-Padilla, M.; Gonzalez-Aguilar, G. Ascorbic acid content in relation to ascorbic acid oxidase activity and polyamine content in tomato and bell pepper fruits during development, maturation and senescence. LWT-Food Sci. Technol. 2001, 34, 452–457. [Google Scholar] [CrossRef]
- Nour, V.; Trandafir, I.; Ionica, M.E. Antioxidant compounds, mineral content and antioxidant activity of several tomato cultivars grown in Southwestern Romania. Not. Bot. Horti Agrobot. Cluj-Napoca 2013, 41, 136–142. [Google Scholar] [CrossRef]
- Di Matteo, A.; Ruggieri, V.; Sacco, A.; Rigano, M.M.; Carriero, F.; Bolger, A.; Fernie, A.R.; Frusciante, L.; Barone, A. Identification of candidate genes for phenolics accumulation in tomato fruit. Plant Sci. 2013, 205–206, 87–96. [Google Scholar] [CrossRef] [PubMed]
- Silva-Beltrán, N.P.; Ruiz-Cruz, S.; Cira-Chávez, L.A.; Estrada-Alvarado, M.I.; Ornelas-paz, J.D.J.; López-mata, M.A.; Del-toro-Sánchez, C.L.; Ayala-Zavala, J.F.; Márquez-ríos, E. Tomatidine Contents and Antioxidant and Antimicrobial Activities of Extracts of Tomato Plant. Int. J. Anal. Chem. 2015, 2015, 1–10. [Google Scholar] [CrossRef] [PubMed]
- Taveira, M.; Ferreres, F.; Gil-Izquierdo, A.; Oliveira, L.; Valentão, P.; Andrade, P.B. Fast determination of bioactive compounds from Lycopersicon esculentum Mill. leaves. Food Chem. 2012, 135, 748–755. [Google Scholar] [CrossRef]
- Periago, M.J.; Martínez-Valverde, I.; Chesson, A.; Provan, G. Phenolic compounds, lycopene and antioxidant activity in commercial varieties of tomato (Lycopersicum esculentum). J. Sci. Food Agric. 2002, 82, 323–330. [Google Scholar] [CrossRef]
- Slimestada, R.; Verheulb, M. Review of flavonoids and other phenolics from fruits of different tomato (Lycopersicon esculentum mill.) cultivars. J. Sci. Food Agric. 2009, 89, 1255–1270. [Google Scholar] [CrossRef]
- Frusciante, L.; Carli, P.; Ercolano, M.R.; Pernice, R.; Di Matteo, A.; Fogliano, V.; Pellegrini, N. Antioxidant nutritional quality of tomato. Mol. Nutr. Food Res. 2007, 51, 609–617. [Google Scholar] [CrossRef] [PubMed]
- Slimestad, R.; Fossen, T.; Verheul, M.J. The flavonoids of tomatoes. J. Agric. Food Chem. 2008, 56, 2436–2441. [Google Scholar] [CrossRef]
- Schijlen, E.; Ric De Vos, C.H.; Jonker, H.; Van Den Broeck, H.; Molthoff, J.; Van Tunen, A.; Martens, S.; Bovy, A. Pathway engineering for healthy phytochemicals leading to the production of novel flavonoids in tomato fruit. Plant Biotechnol. J. 2006, 4, 433–444. [Google Scholar] [CrossRef] [PubMed]
- Junbae Ahn Amino Acid, Amino Acid Metabolite, and GABA Content of Three Domestic Tomato Varieties. Culin. Sci. Hosp. Res. 2016, 22, 71–77. [CrossRef]
- Sorrequieta, A.; Ferraro, G.; Boggio, S.B.; Valle, E.M. Free amino acid production during tomato fruit ripening: A focus on L-glutamate. Amino Acids 2010, 38, 1523–1532. [Google Scholar] [CrossRef] [PubMed]
- Pratta, G.; Zorzoli, R.; Boggio, S.B.; Picardi, L.A.; Valle, E.M. Glutamine and glutamate levels and related metabolizing enzymes in tomato fruits with different shelf-life. Sci. Hortic. 2004, 100, 341–347. [Google Scholar] [CrossRef]
- Chang, C.H.; Lin, H.Y.; Chang, C.Y.; Liu, Y.C. Comparisons on the antioxidant properties of fresh, freeze-dried and hot-air-dried tomatoes. J. Food Eng. 2006, 77, 478–485. [Google Scholar] [CrossRef]
Publisher’s Note: MDPI stays neutral with regard to jurisdictional claims in published maps and institutional affiliations. |
© 2021 by the authors. Licensee MDPI, Basel, Switzerland. This article is an open access article distributed under the terms and conditions of the Creative Commons Attribution (CC BY) license (https://creativecommons.org/licenses/by/4.0/).