
A Study on Capacitive Micromachined Ultrasonic Transducer Periodic Sparse Array

 , ,
, ,
Abstract
1. Introduction
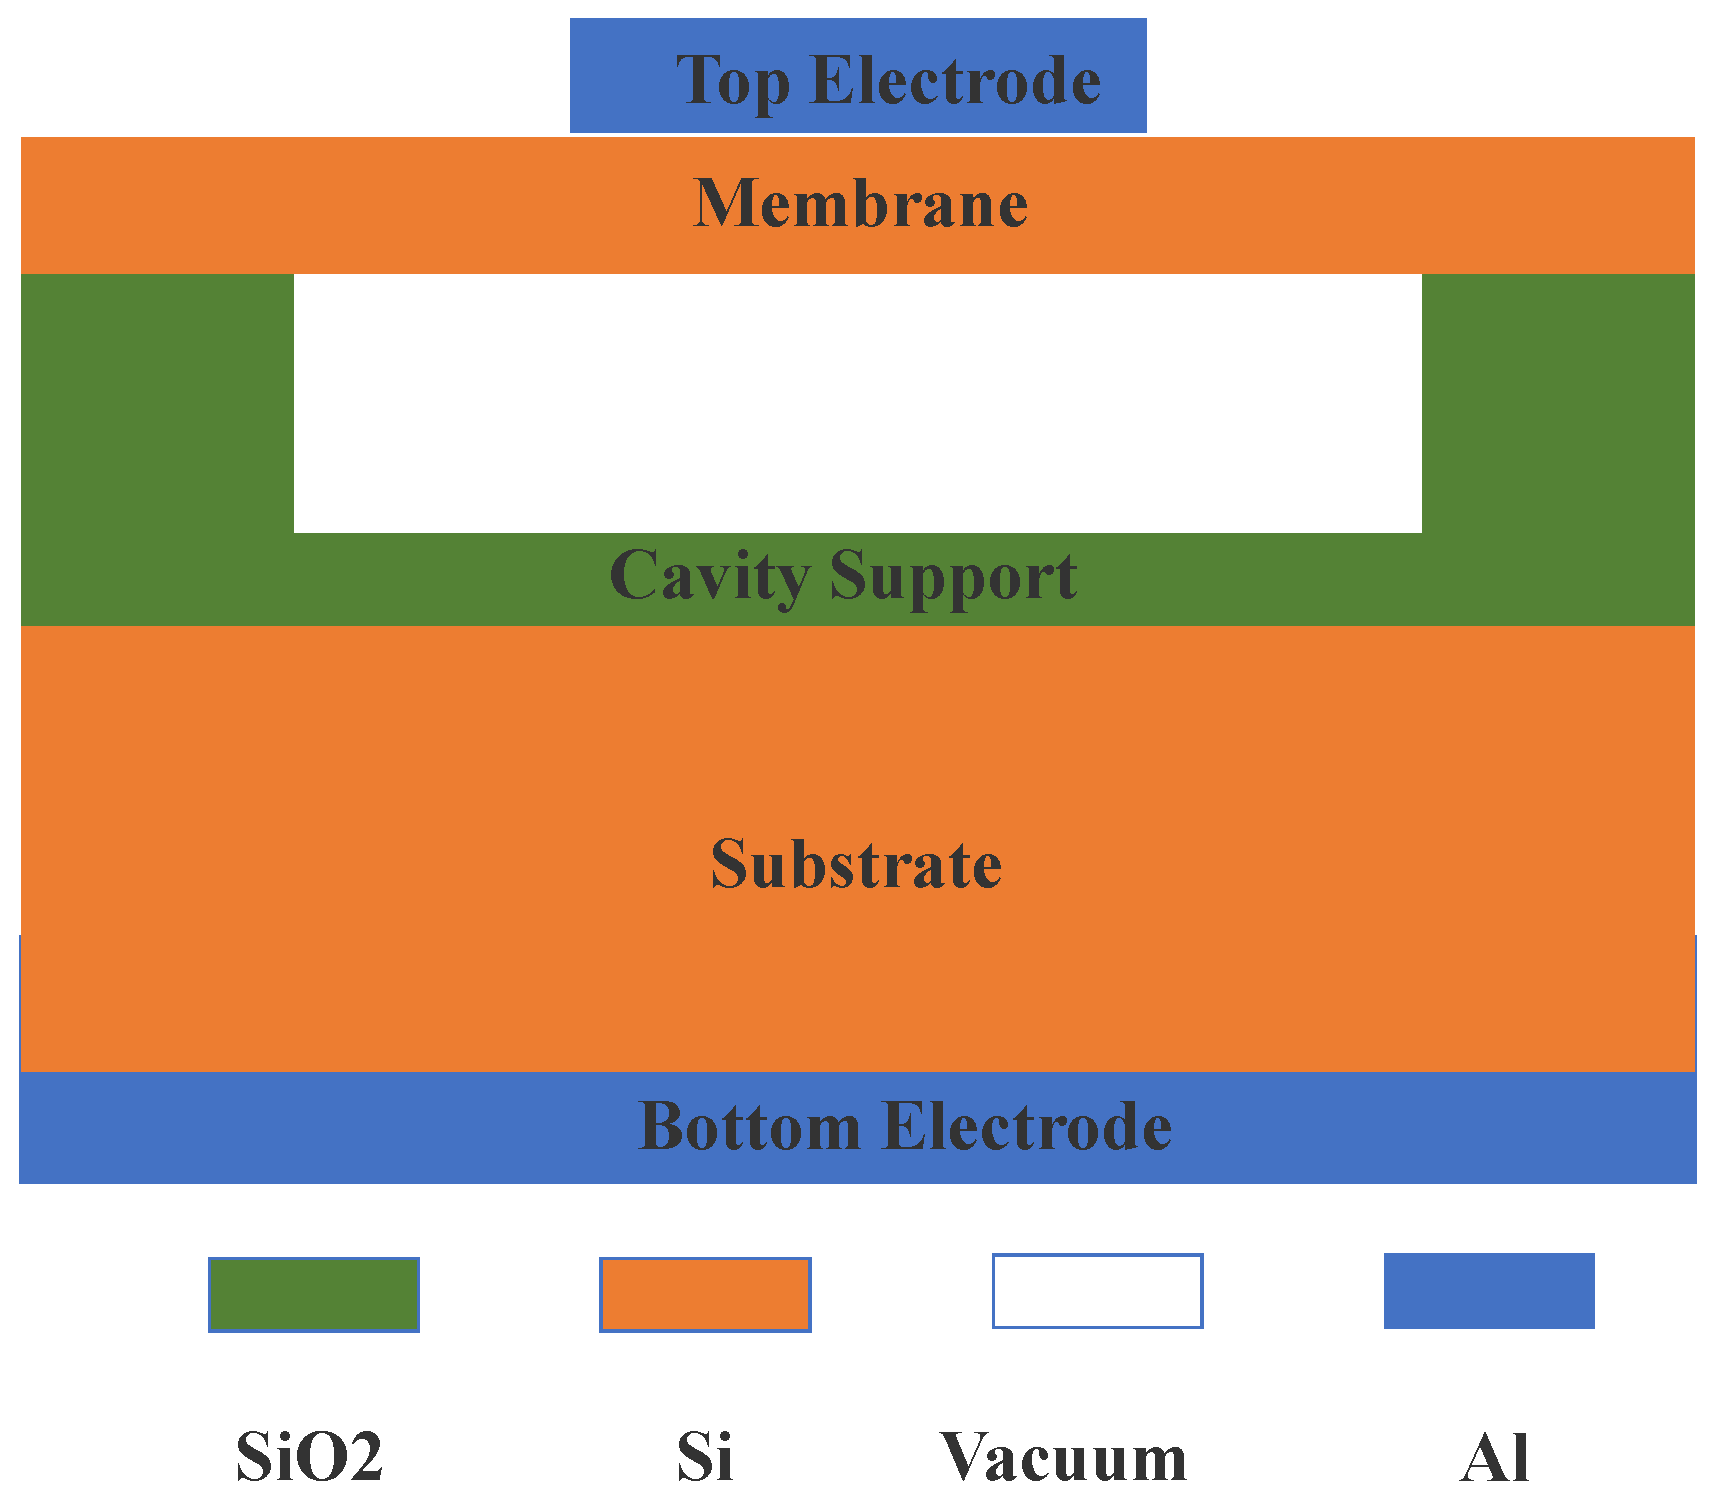
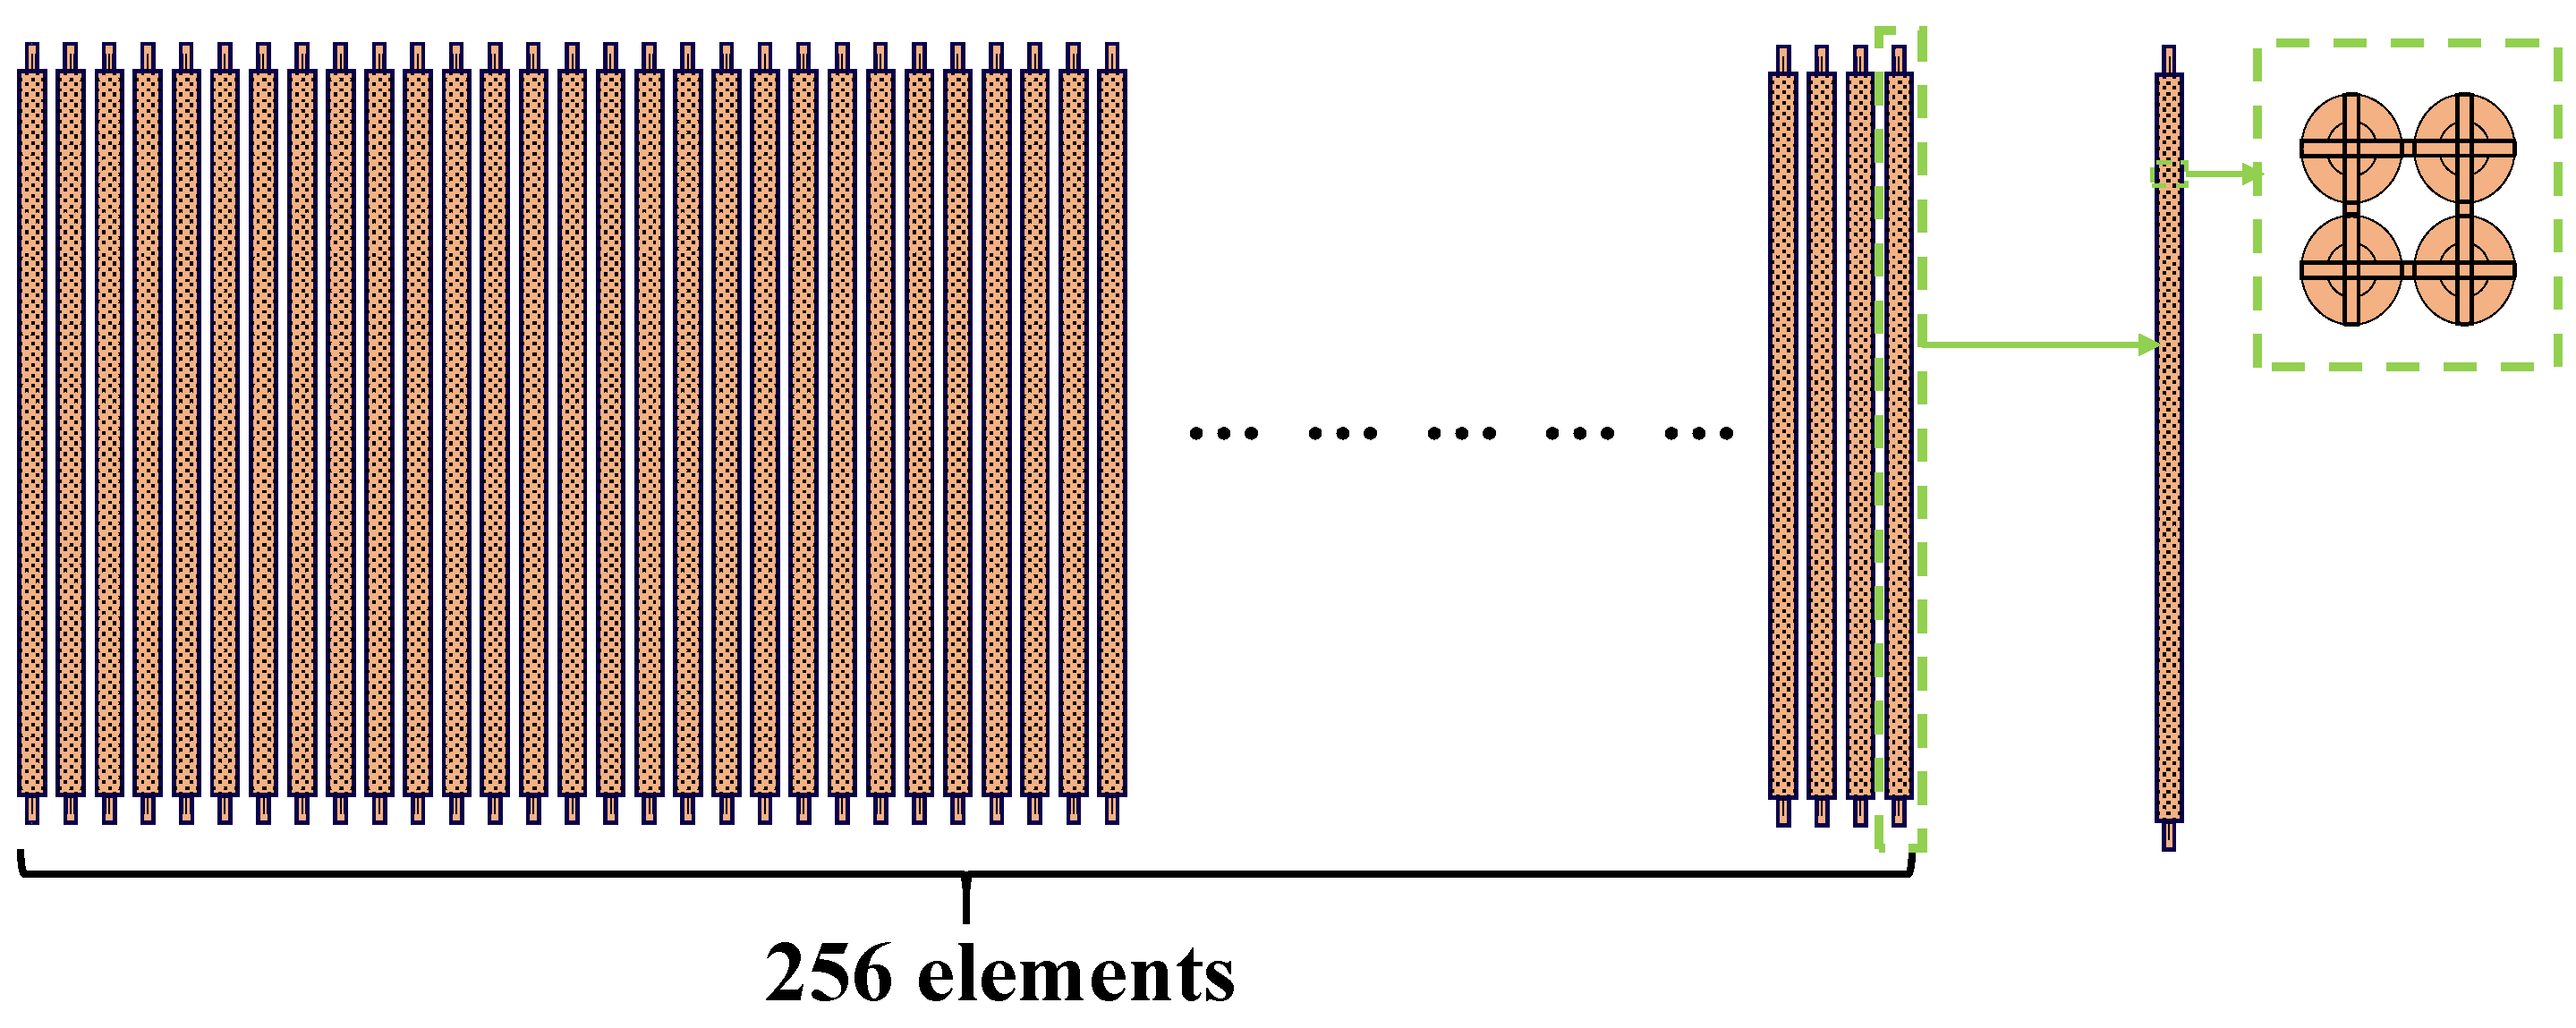
2. Structure of CMUT
3. CMUT Sparse Model and Simulation
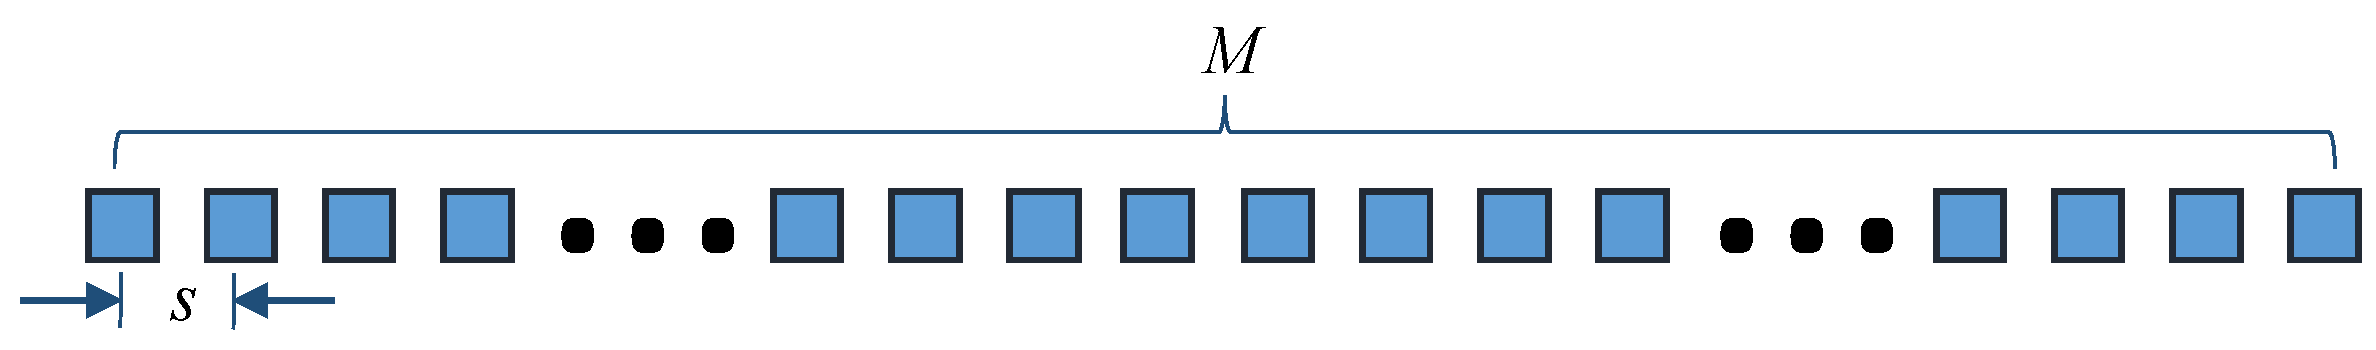
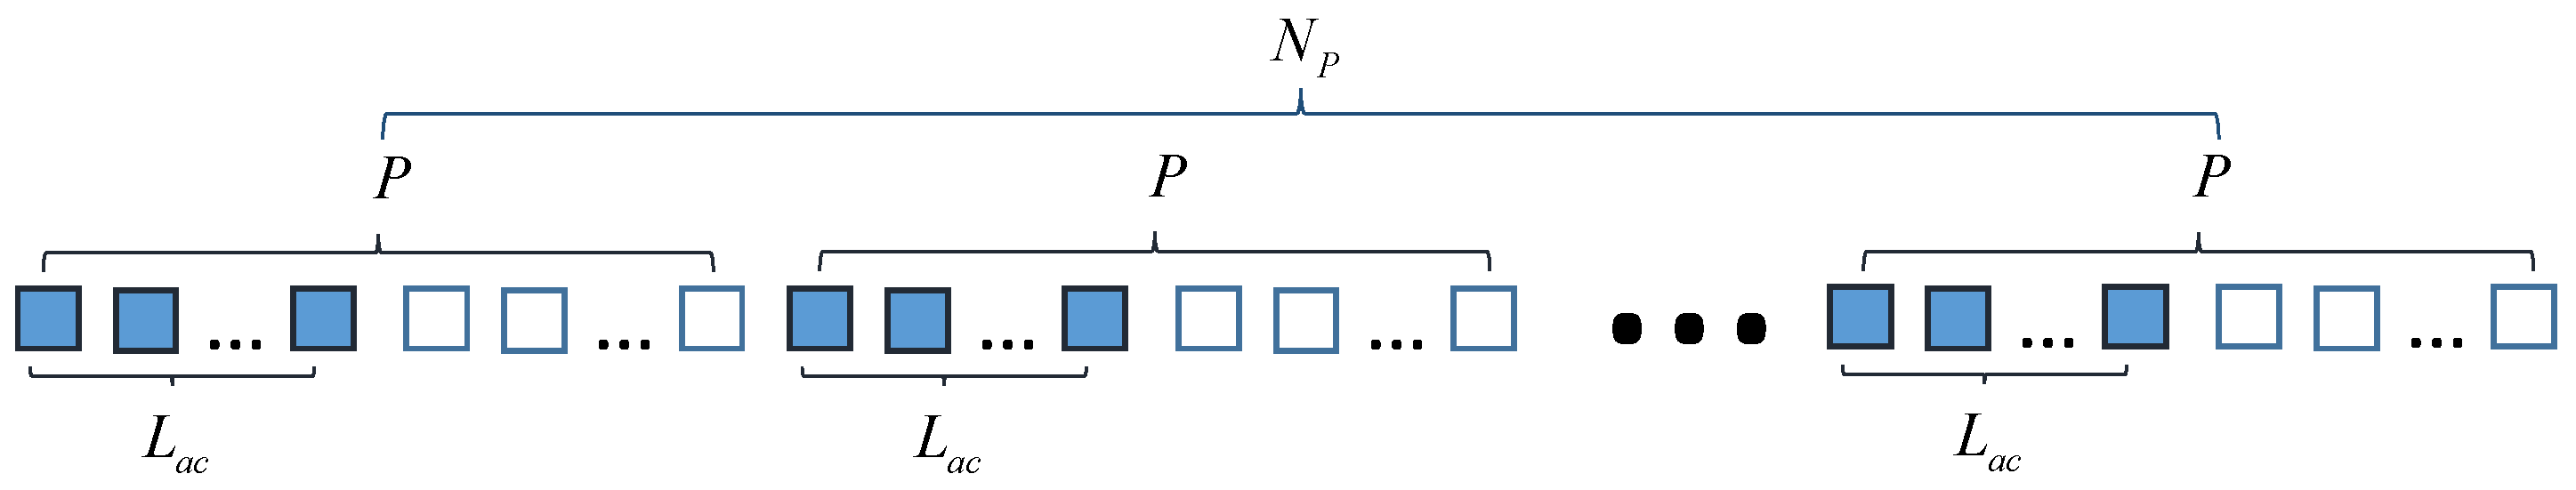
3.1. CMUT Sparse Model

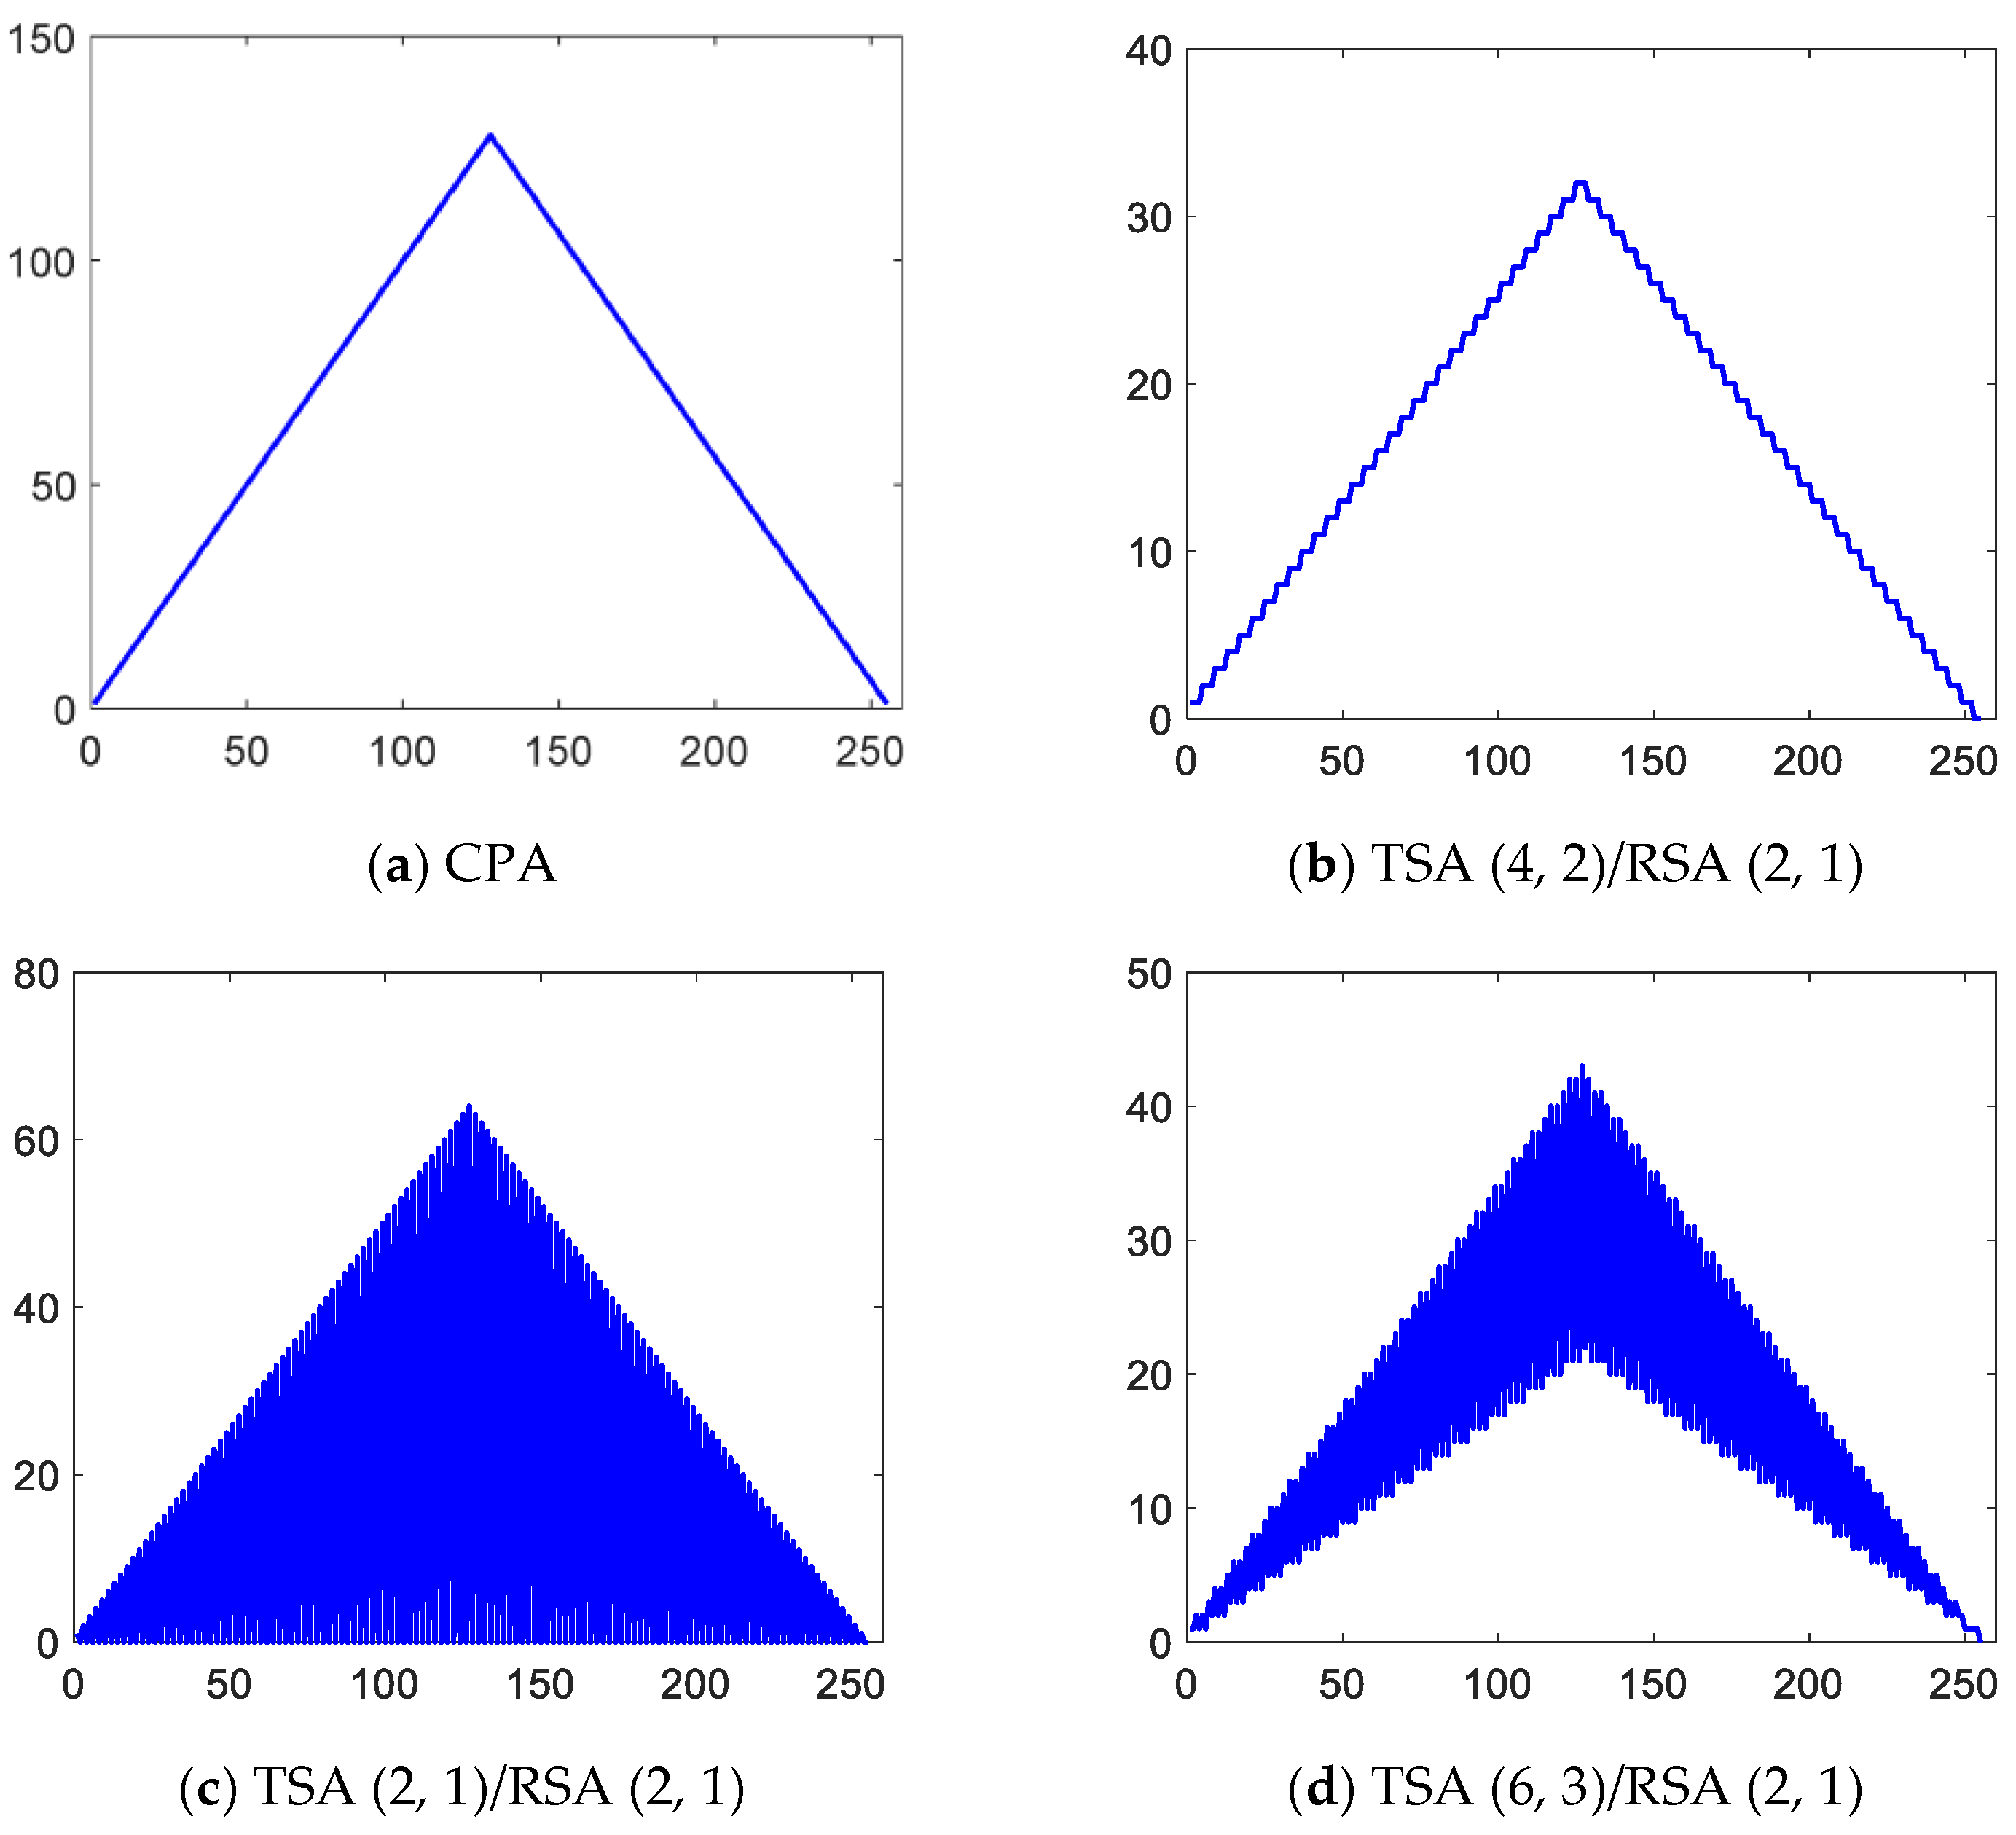
3.2. Effective Aperture Comparison
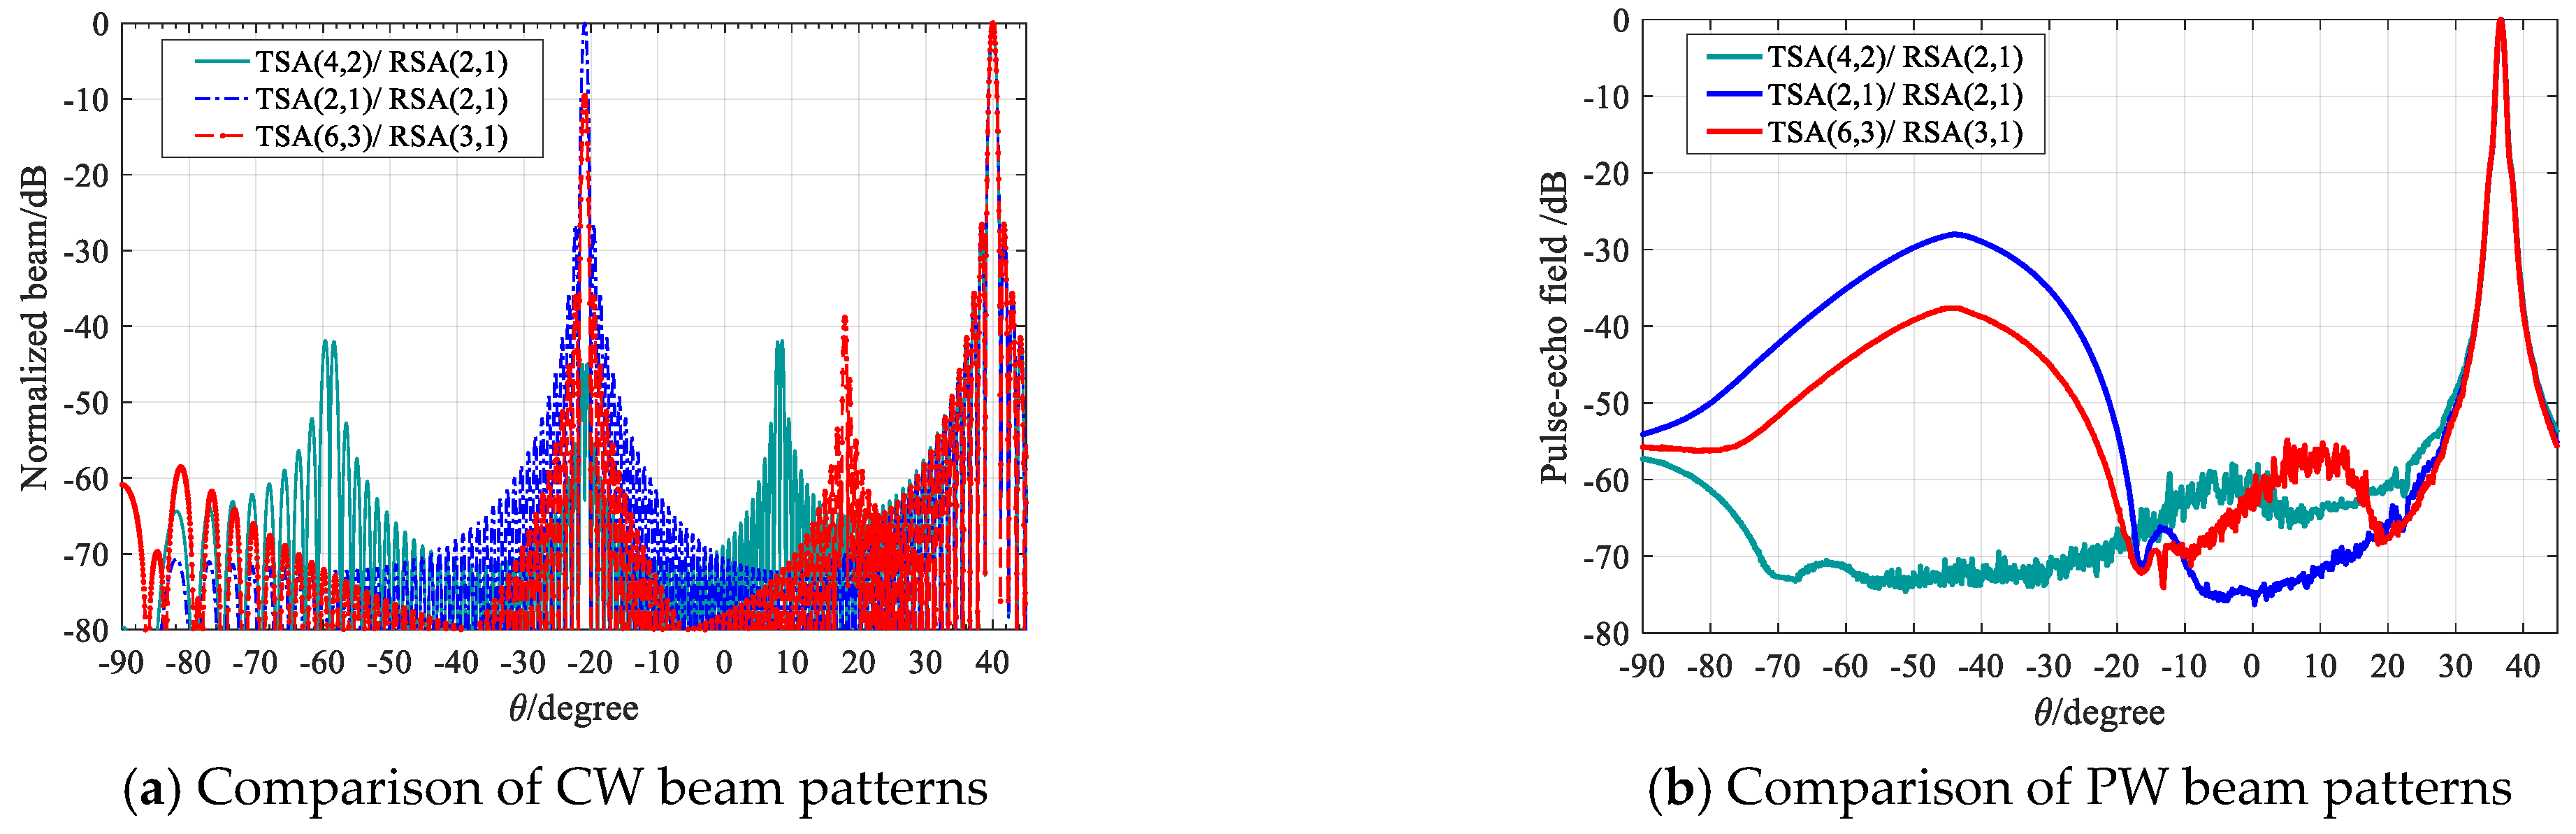
3.3. Beam Patterns Comparison
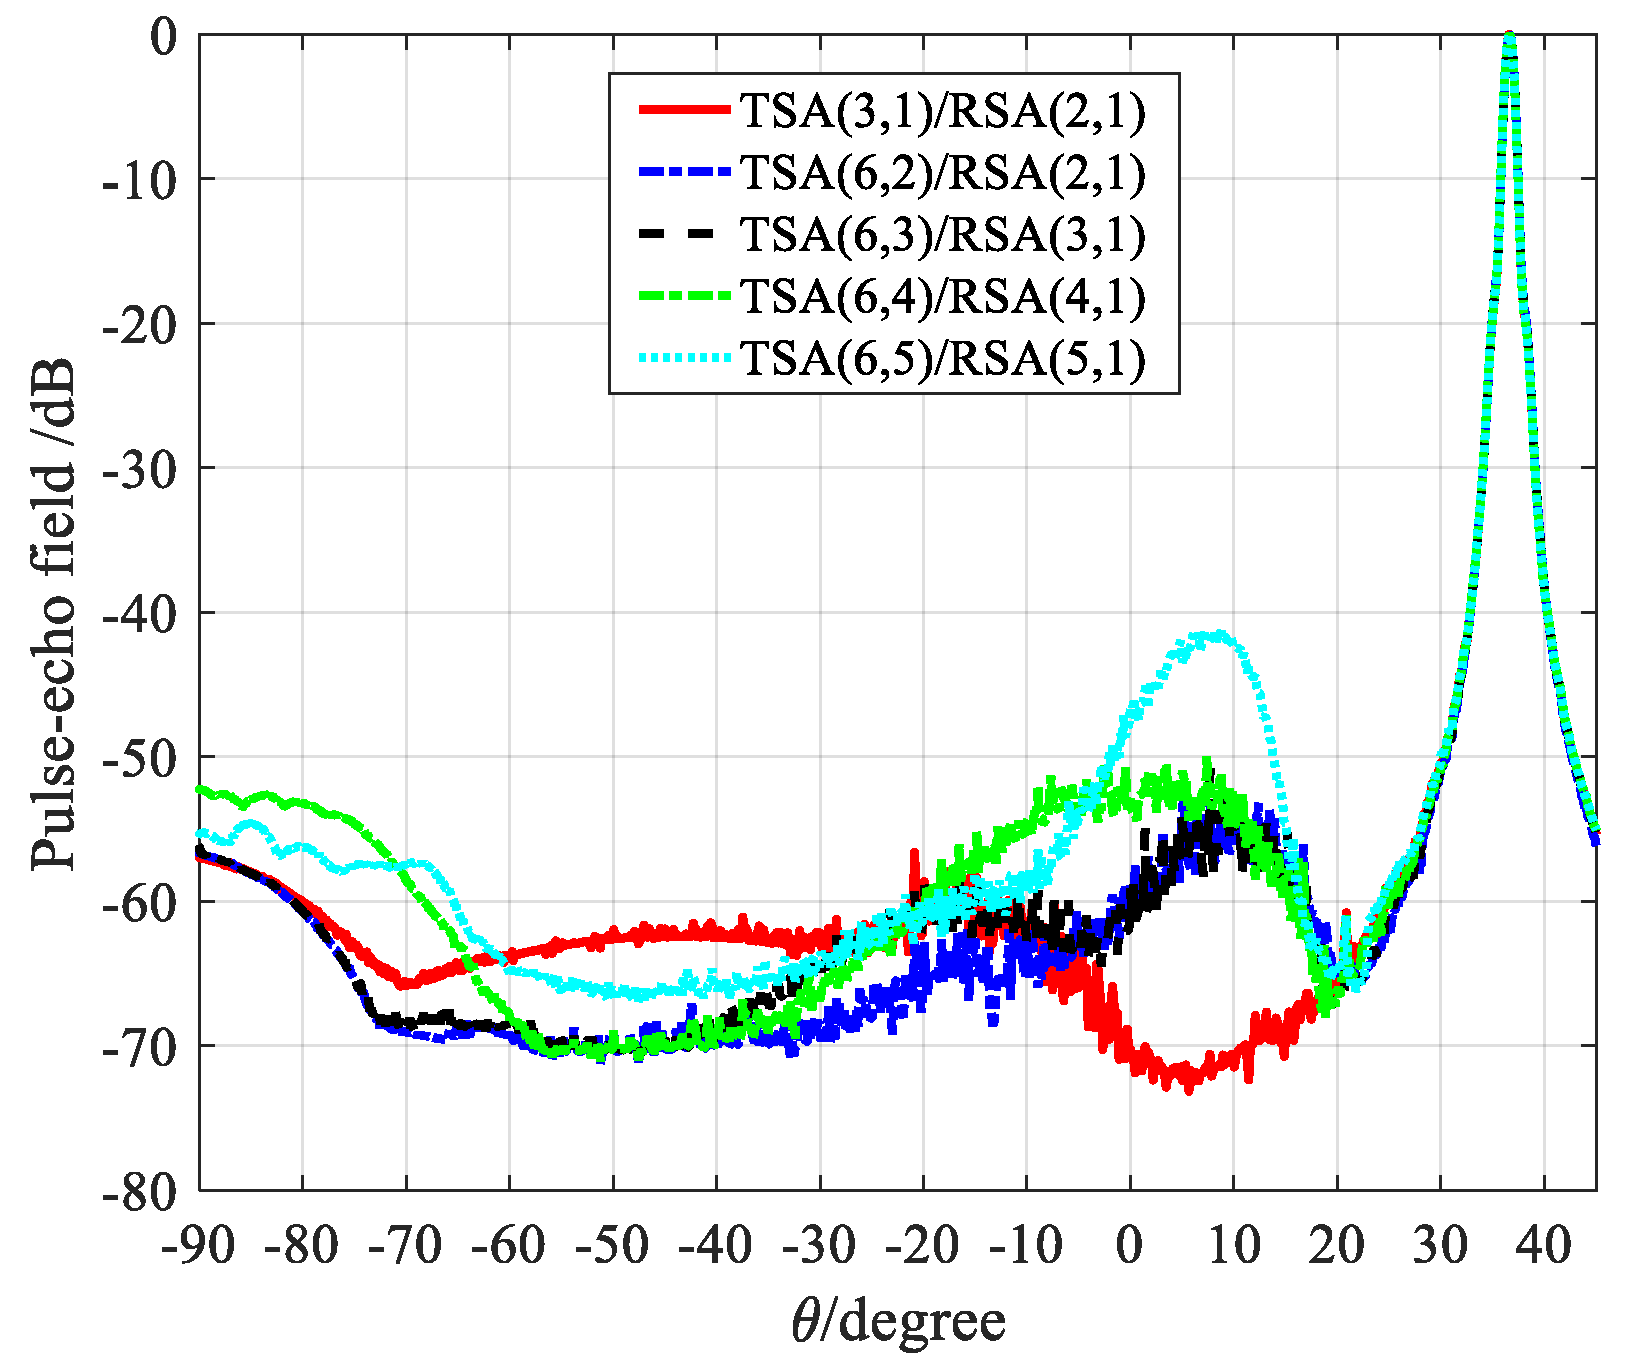
4. Selection of Optimal Sparse Array Configuration
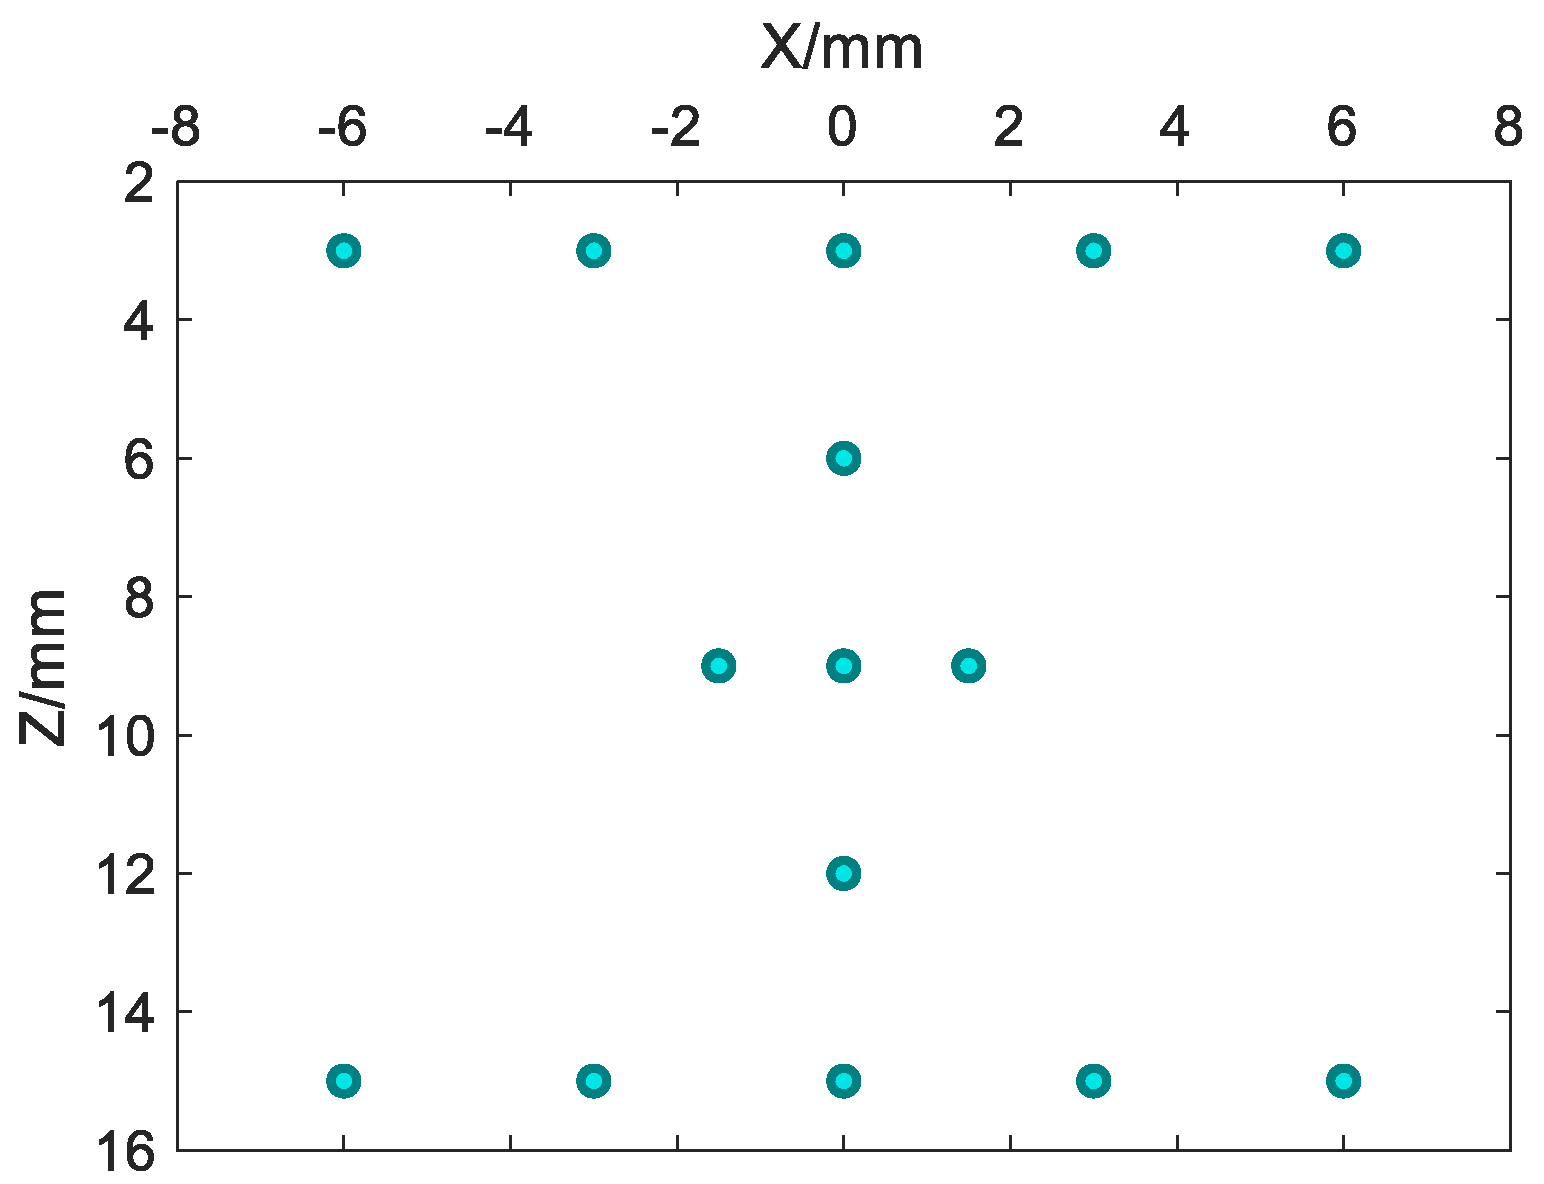
5. Verification
5.1. Simulation Verification
5.2. Experimental Verification
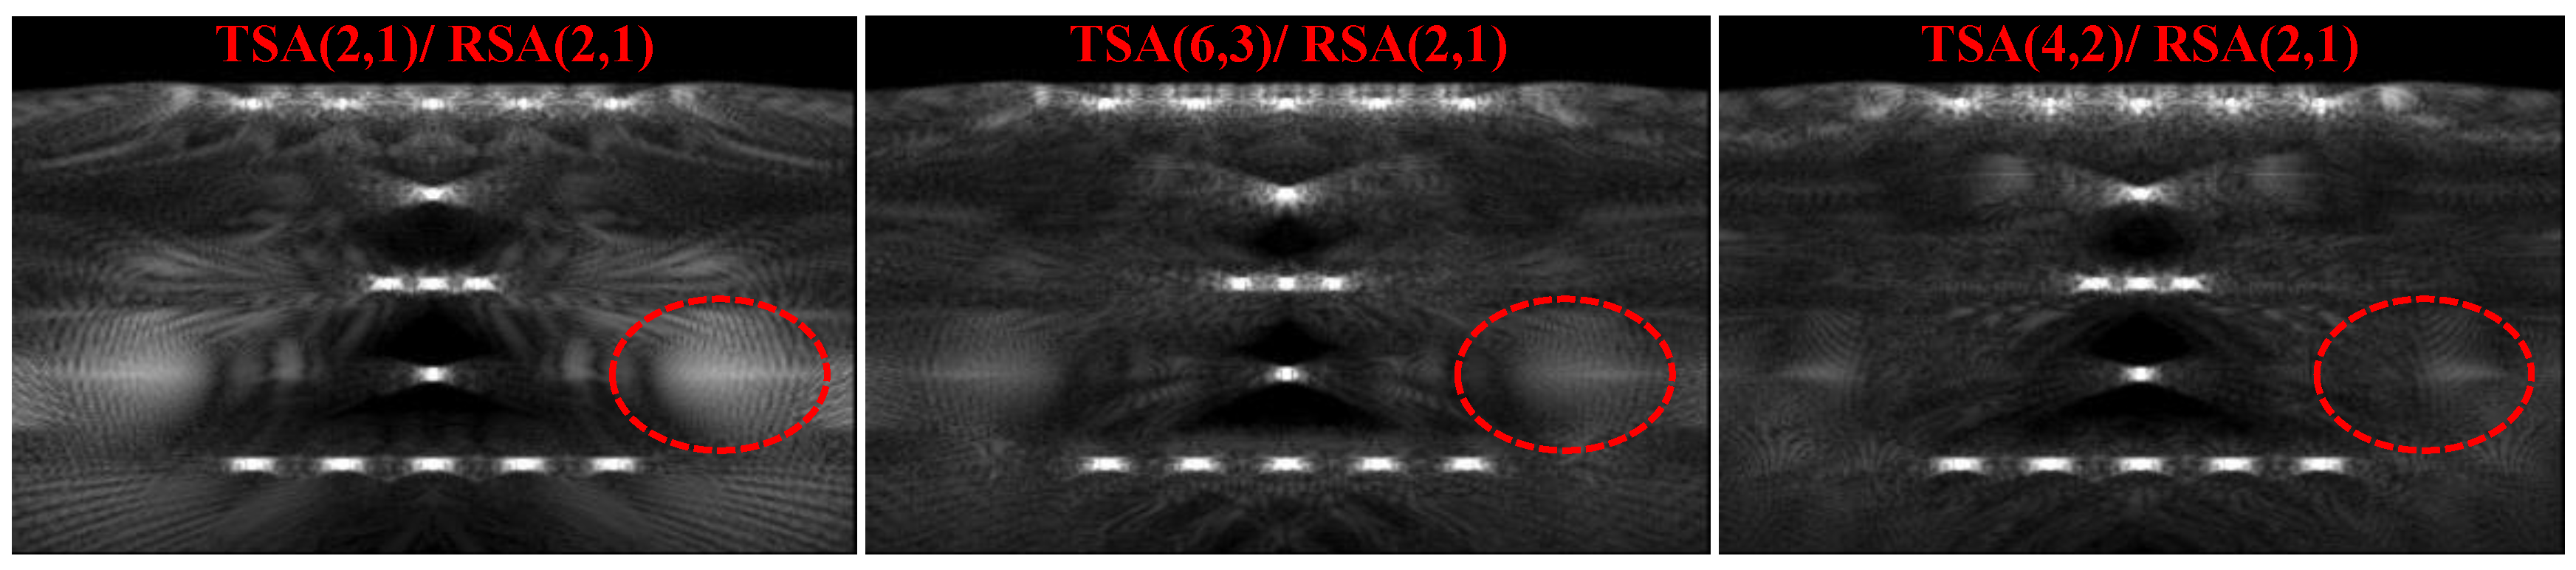
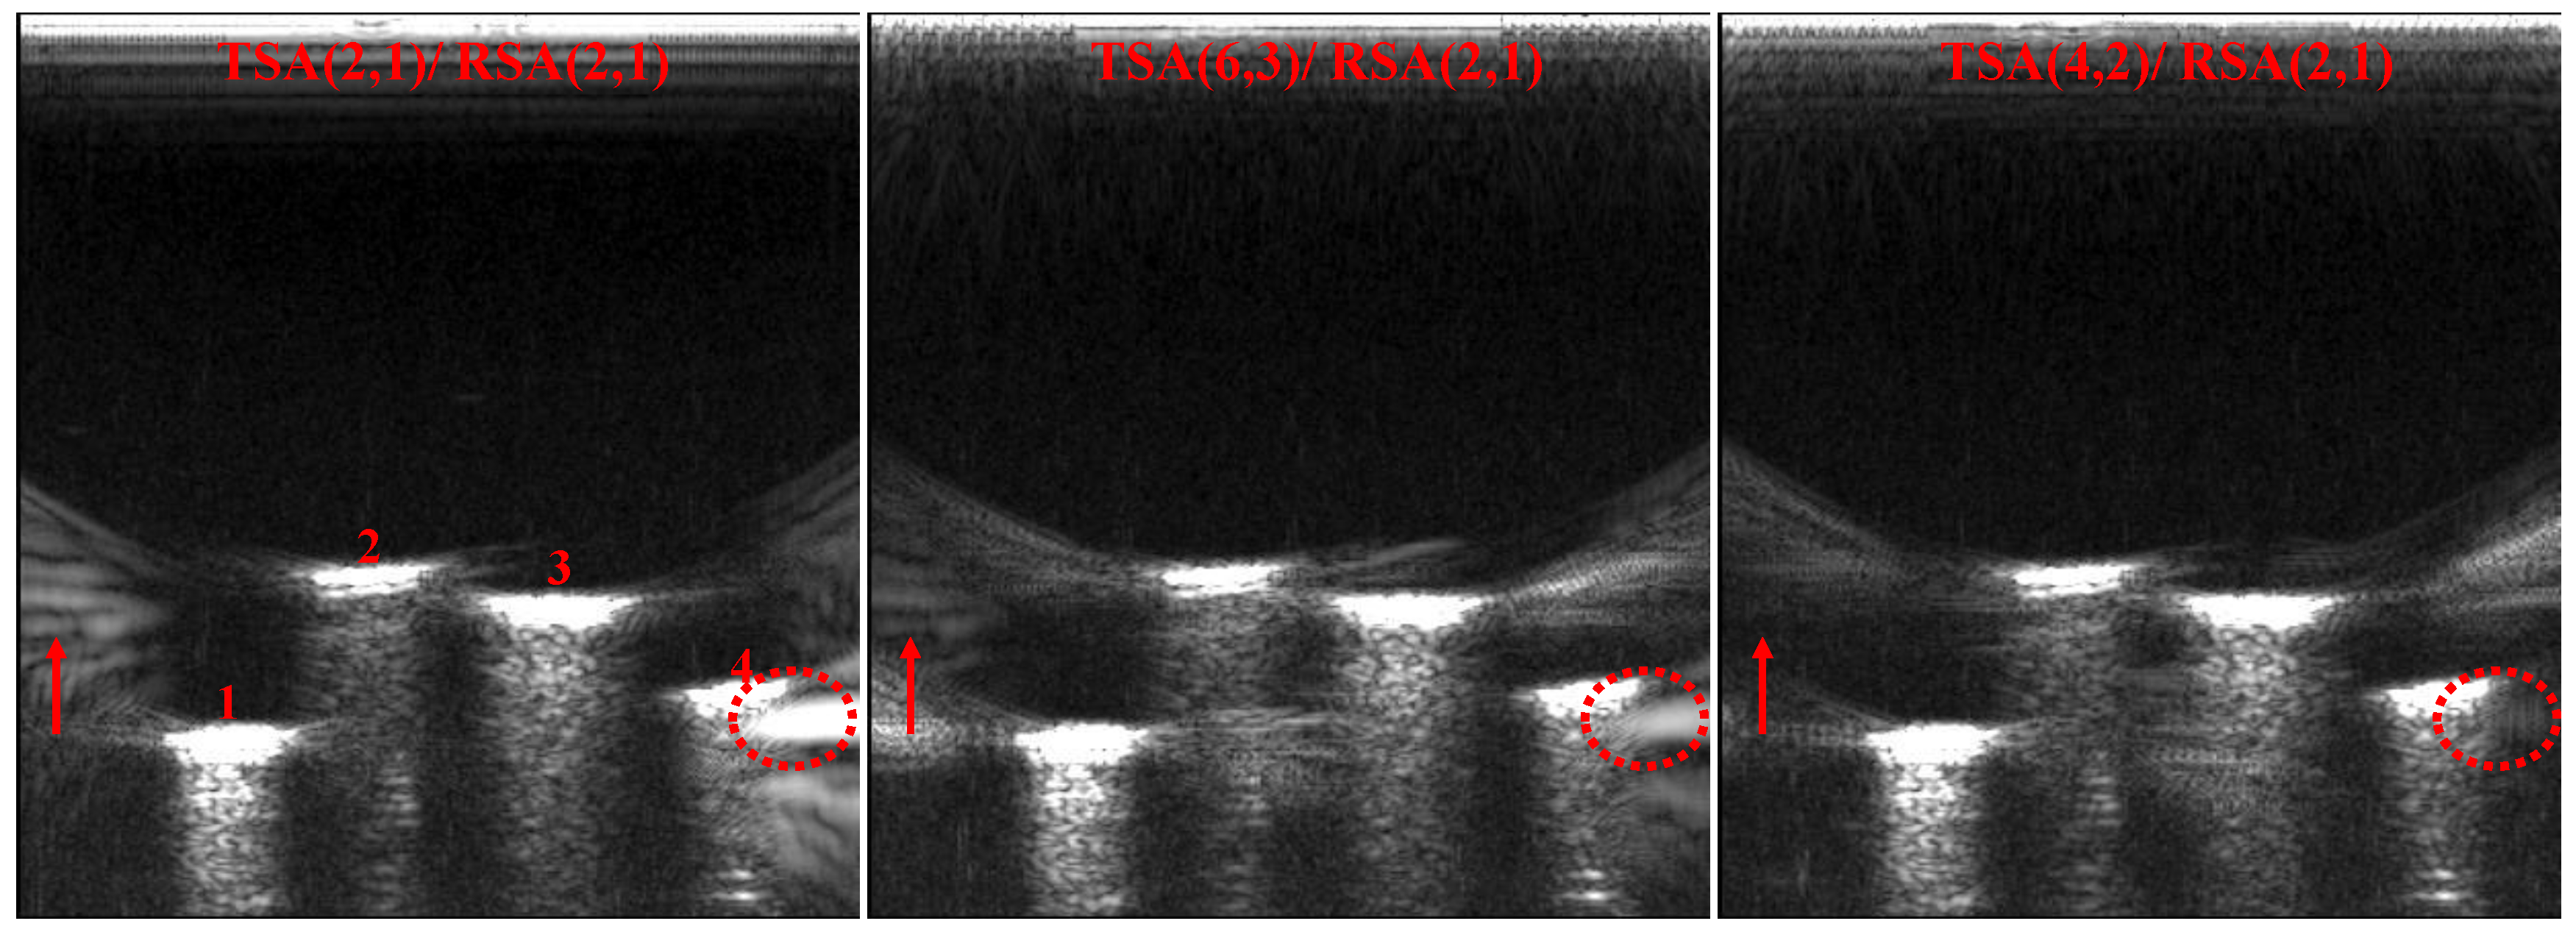
5.2.1. Criteria of CGLs Elimination Experimental Verification ()
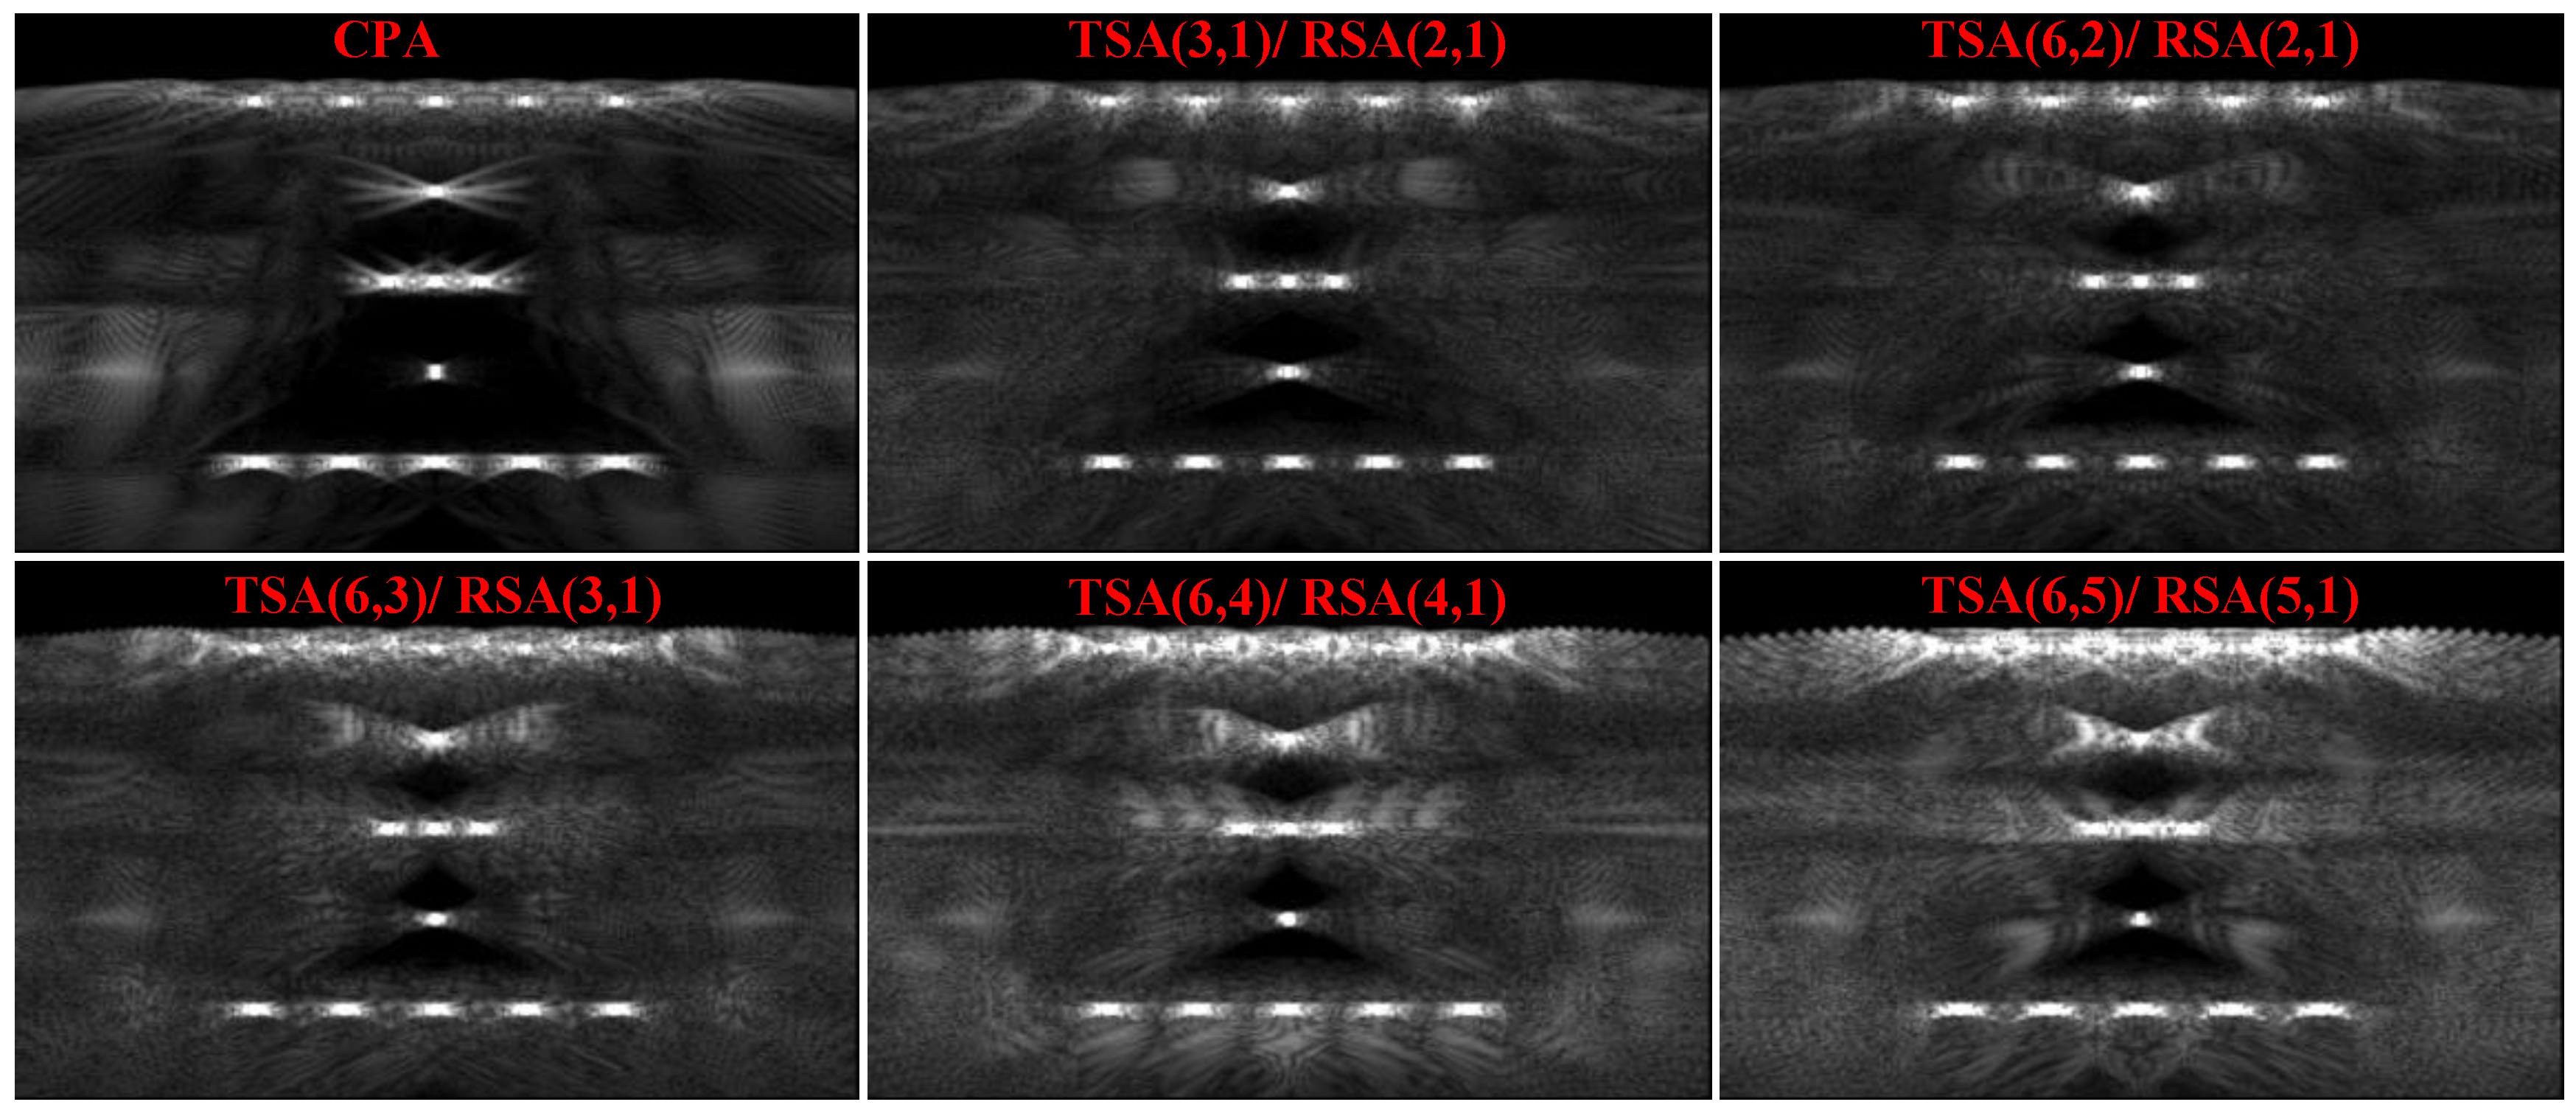
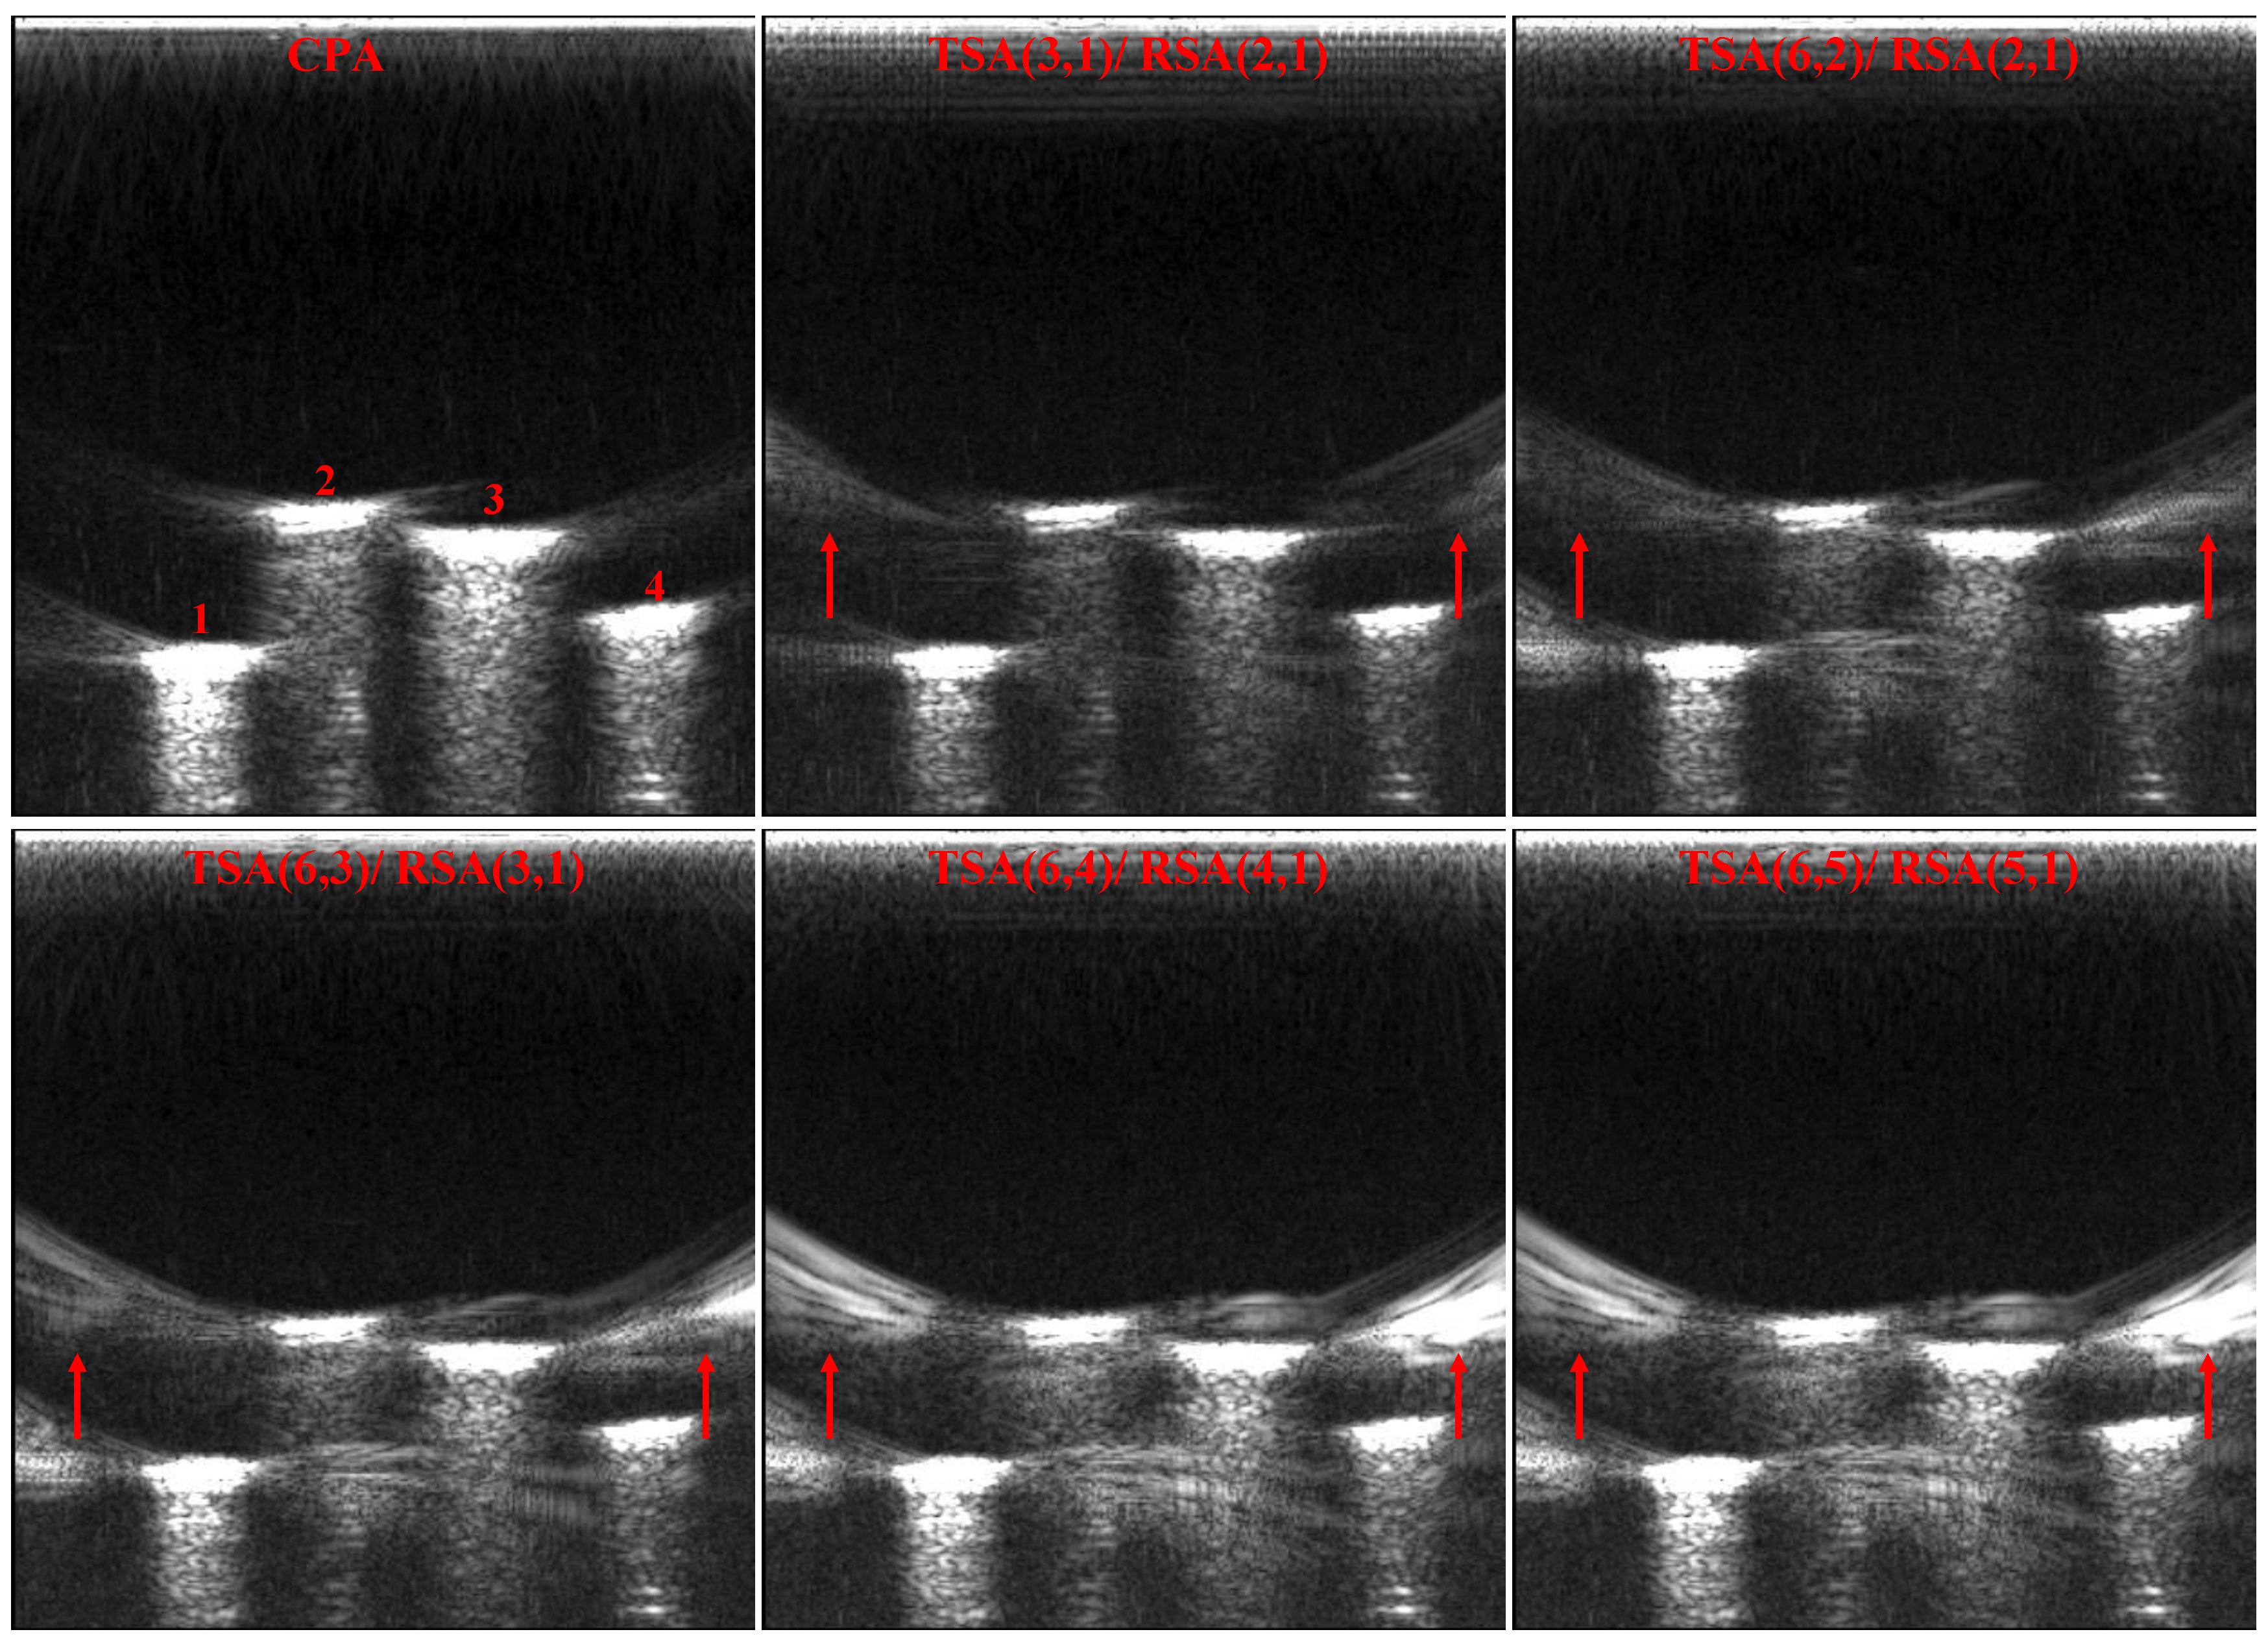
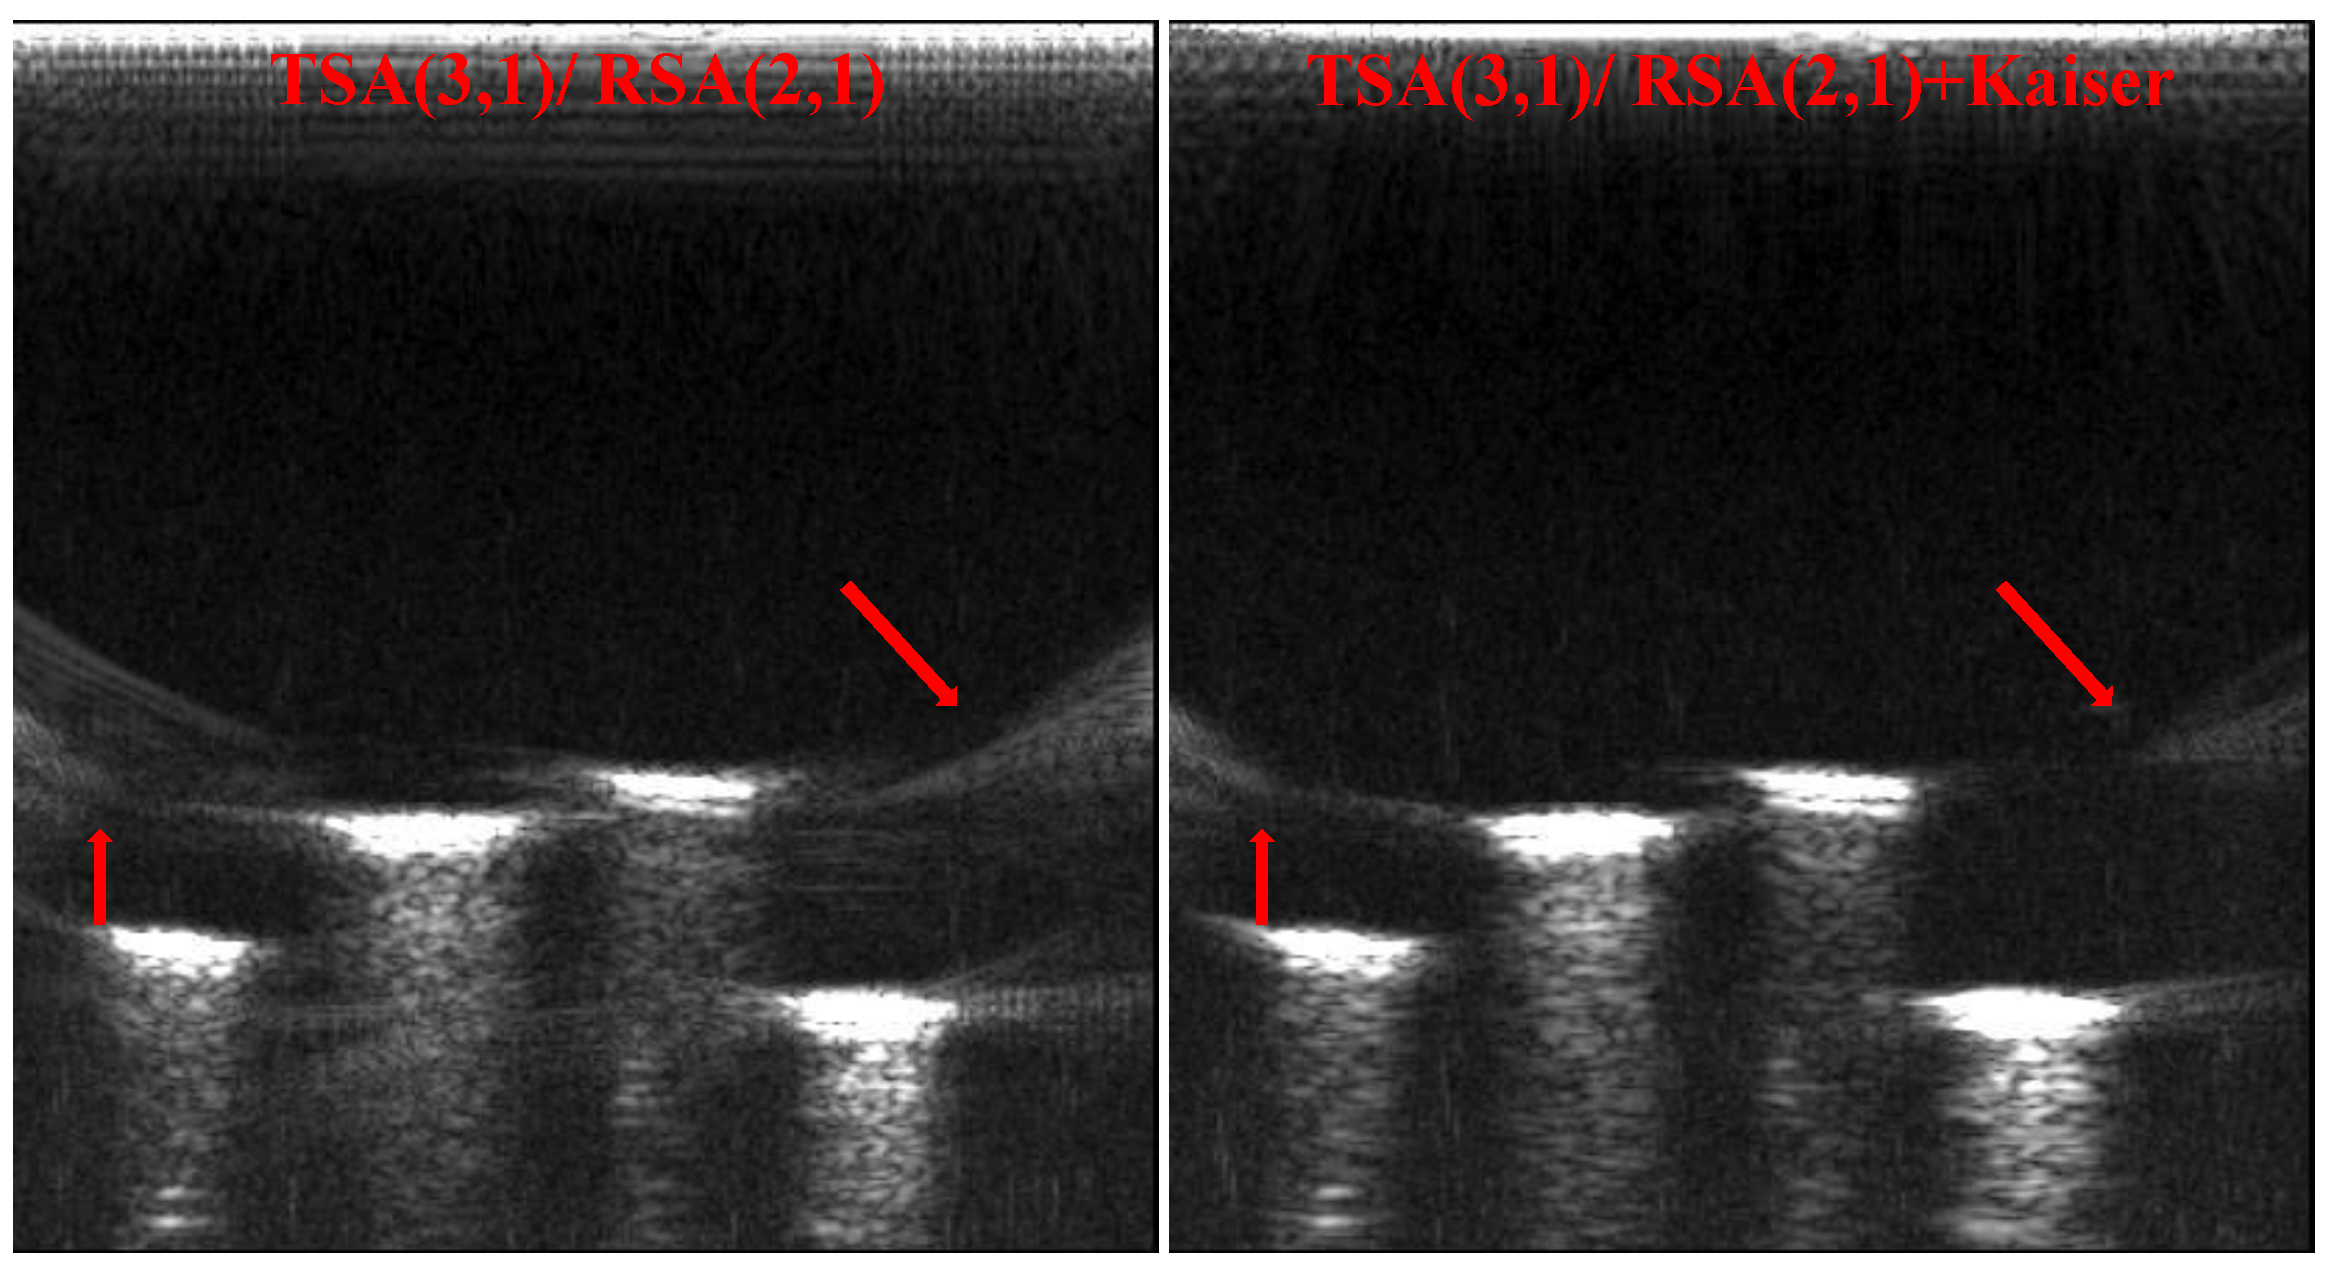
5.2.2. Experimental Verification of Optimal Sparse Array Configuration Selection ()
6. Conclusions
Author Contributions
Funding
Conflicts of Interest
References
- Vallet, M.; Varray, F.; Boutet, J.; Dinten, J.M.; Caliano, G.; Savoia, A.S.; Vray, D. Quantitative comparison of PZT and CMUT probes for photoacoustic imaging: Experimental validation. Photoacoustics 2017, 8, 48–58. [Google Scholar] [CrossRef]
- Bouzari, H.; Engholm, M.; Nikolov, S.I.; Stuart, M.B.; Thomsen, E.V.; Jensen, J.A. Imaging Performance for Two Row–Column Arrays. IEEE Trans. Ultrason. Ferroelectr. Freq. Control 2019, 66, 1209–1221. [Google Scholar] [CrossRef]
- Yashvanth, V.; Chowdhury, S. An Investigation of Silica Aerogel to Reduce Acoustic Crosstalk in CMUT Arrays. Sensors 2021, 21, 1459. [Google Scholar] [CrossRef]
- Khan, T.M.; Tasdelen, S.; Yilmaz, M.; Atalar, A.; Koymen, H. High-Intensity Airborne CMUT Transmitter Array with Beam Steering. J. Microelectromech. Syst. 2020, 29, 1537–1546. [Google Scholar] [CrossRef]
- Brenner, K.; Ergun, A.; Firouzi, K.; Rasmussen, M.; Stedman, Q.; Khuri-Yakub, B. Advances in Capacitive Micromachined Ultrasonic Transducers. Micromachines 2019, 10, 152. [Google Scholar] [CrossRef] [PubMed]
- Bhuyan, A.; Choe, J.W.; Lee, B.; Wygant, I.O.; Nikoozadeh, A.; Oralkan, Ö.; Khuriyakub, B.T. 3D Volumetric Ultrasound Imaging with a 32 × 32 CMUT Array Integrated with Front-End ICs Using Flip-Chip Bonding Technology; ISSCC: New York, NY, USA, 2013; pp. 396–397. [Google Scholar]
- Oralkan, O.; Ergun, A.S.; Johnson, J.A.; Karaman, M.; Demirci, U.; Kaviani, K.; Lee, T.H.; Khuri-Yakub, B.T. Capacitive micromachined ultrasonic transducers: Next-generation arrays for acoustic imaging? IEEE Trans. Ultrason. Ferroelectr. Freq. Control 2002, 49, 1596–1610. [Google Scholar] [CrossRef]
- Wygant, I.O.; Kupnik, M.; Khuri-Yakub, B.T. CMUT Design Equations for Optimizing Noise Figure and Source Pressure. In Proceedings of the IEEE Ultrasonics Symposium, Tours, France, 18–21 September 2016. [Google Scholar]
- Wygant, I.O.; Jamal, N.S.; Lee, H.J.; Nikoozadeh, A.; Khuri-Yakub, B.T. An Integrated Circuit with Transmit Beamforming Flip-Chip Bonded to a 2-D CMUT Array for 3-D Ultrasound Imaging. IEEE Trans. Ultrason. Ferroelectr. Freq. Control 2009, 56, 2145–2156. [Google Scholar] [CrossRef] [PubMed]
- Song, J.; Xue, C.; He, C.; Rui, Z.; Mu, L.; Cui, J.; Jing, M.; Yuan, L.; Zhang, W. Capacitive Micromachined Ultrasonic Transducers (CMUTs) for Underwater Imaging Applications. Sensors 2015, 15, 23205–23217. [Google Scholar] [CrossRef] [PubMed]
- Wang, H.; Wang, X.; He, C. Design and Performance Analysis of Capacitive Micromachined Ultrasonic Transducer Linear Array. Micromachines 2014, 5, 420–431. [Google Scholar] [CrossRef]
- Rui, Z.; Zhang, W.; He, C.; Zhang, Y.; Song, J.; Xue, C. Underwater Imaging Using a 1 × 16 CMUT Linear Array. Sensors 2016, 16, 312. [Google Scholar]
- Kim, K.; Choi, H. High-efficiency high-voltage class F amplifier for high-frequency wireless ultrasound systems. PLoS ONE 2021, 16, e0249034. [Google Scholar]
- Khuriyakub, B.T.; Oralkan, Ö. Capacitive micromachined ultrasonic transducers for medical imaging and therapy. J. Micromech. Microeng. 2011, 21, 54004. [Google Scholar] [CrossRef]
- Lockwood, G.R.; Li, P.C.; O’Donnell, M.; Foster, F.S. Optimizing the radiation pattern of sparse periodic linear arrays. IEEE Trans. Ultrason. Ferroelectr. Freq. Control 1996, 43, 7–14. [Google Scholar] [CrossRef]
- Mohammadian, N.; Furxhi, O.; Short, R.; Driggers, R. Performance comparison of sparse array millimeter wave imager configurations. Opt. Express 2019, 27, 19292–19308. [Google Scholar] [CrossRef]
- Chen, H.; Liu, Z.; Gong, Y.; Wu, B.; He, C. Evolutionary strategy–based location algorithm for high-resolution Lamb wave defect detection with sparse array. IEEE Trans. Ultrason. Ferroelectr. Freq. Control 2021, 68, 1–17. [Google Scholar] [CrossRef] [PubMed]
- Steinberg, B. Comparison between the peak sidelobe of the random array and algorithmically designed aperiodic arrays. IEEE Trans. Antennas. Propag. 1973, 21, 366–370. [Google Scholar] [CrossRef]
- Lockwood, G.; Foster, F. Design of Sparse Array Imaging Systems. In Ultrasonics Symposium: Proceedings; An International Symposium; Institute of Electrical and Electronics Engineers (IEEE): Piscataway, NJ, USA, 2002; pp. 1237–1243. [Google Scholar]
- Diarra, B.; Robini, M.; Tortoli, P.; Cachard, C.; Liebgott, H. Design of optimal 2-D nongrid sparse arrays for medical ultrasound. IEEE Trans. Biomed. Eng. 2013, 60, 3093–3102. [Google Scholar] [CrossRef] [PubMed]
- Roux, E.; Varray, F.; Petrusca, L.; Cachard, C.; Tortoli, P.; Liebgott, H. Experimental 3-D Ultrasound Imaging with 2-D Sparse Arrays using Focused and Diverging Waves. Sci. Rep. 2018, 8, 1–12. [Google Scholar] [CrossRef]
- Austeng, A.; Sverre, H. Sparse 2-D arrays for 3-D phased array imaging-design methods. IEEE Trans. Ultrason. Ferroelectr. Freq. Control 2002, 49, 1073–1086. [Google Scholar] [CrossRef]
- Austeng, A.; Holm, S. Simple Weighting to Enhance Sparse Periodic Arrays. In Proceedings of the International Conference on Acoustics, Speech and Signal Processing, Istanbul, Turkey, 5–9 June 2002; pp. 3109–3112. [Google Scholar]
- Erstad, J.O.; Holm, S. An Approach to the Design of Sparse Array Systems. In Proceedings of the IEEE Ultrasonics Symposium, Cannes, France, 31 October–3 November 1994; pp. 1507–1510. [Google Scholar]
- Song, J.H.; Lee, J.; Yeo, S.; Kim, G.-D.; Song, T.-K. An Analytical Approach to Designing Optimal Sparse 1-D Phased Arrays for Handheld Ultrasound Imaging. IEEE Trans. Ultrason. Ferroelectr. Freq. Control 2020, 67, 1354–1365. [Google Scholar] [CrossRef]
- Karaman, M.; Wygant, I.O.; Oralkan, Ö.; Khuri-Yakub, B.T. Minimally Redundant 2-D Array Designs for 3-D Medical Ultrasound Imaging. IEEE Trans. Med. Imag. 2009, 28, 1051–1061. [Google Scholar] [CrossRef]
- Salim, M.S.; Malek, M.; Heng, R.; Juni, K.M.; Sabri, N. Capacitive Micromachined Ultrasonic Transducers: Technology and Application. J. Med. Ultrasound 2012, 20, 8–31. [Google Scholar] [CrossRef]
- Caliano, G.; Matrone, G.; Savoia, A.S. Biasing of Capacitive Micromachined Ultrasonic Transducers. IEEE Trans. Ultrason. Ferroelectr. Freq. Control 2017, 64, 402–413. [Google Scholar] [CrossRef] [PubMed]
- Zhuang, S.; Zhao, D.; Chen, L.; Zhai, L. A 50-MHz CMUT Probe for Medical Ultrasound Imaging. In Proceedings of the IEEE Ultrasonics Symposium, Kobe, Japan, 22–25 October 2018. [Google Scholar]
- Khairalseed, M.; Rijal, G.; Hoyt, K. Spatial Comparison between the H-Scan Format for Classification of Ultrasound Scatterers and Histology-Preliminary Results Using an Animal Model of Breast Cancer. In Proceedings of the IEEE Ultrasonics Symposium, Las Vegas, NV, USA, 7–11 September 2020. [Google Scholar]
- Johnson, J.A.; Karaman, M.; Khuri-Yakub, B.T. Coherent-Array Imaging Using Phased Subarrays. Part I: Basic Principles. IEEE Trans. Ultrason. Ferroelectr. Freq. Control 2005, 52, 37–50. [Google Scholar] [CrossRef] [PubMed]
- Sara, U.; Akter, M.; Uddin, M.S. Image Quality Assessment through FSIM, SSIM, MSE and PSNR—A Comparative Study. J. Comput. Commun. 2019, 7, 8–18. [Google Scholar] [CrossRef]
- Kaczkowski, P.J.; Daigle, R.E. The Verasonics ultrasound system as a pedagogic tool in teaching wave propagation, scattering, beamforming, and signal processing concepts in physics and engineering. JASA 2011, 129, 2648. [Google Scholar] [CrossRef]
- Deng, Y.; Rouze, N.C.; Palmeri, M.L.; Nightingale, K.R. Ultrasonic Shear Wave Elasticity Imaging Sequencing and Data Processing Using a Verasonics Research Scanner. IEEE Trans. Ultrason. Ferroelectr. Freq. Control 2017, 64, 164–176. [Google Scholar] [CrossRef]
- Wang, Q.; Lv, Z.; Gao, X.; Zhang, P.; Lin, H.; Guo, Y.; Chen, X.; Wang, T.; Chen, S.; Zhang, X. In-Vivo Assessing the Age-Related Stiffness of Crystalline Lens in Rabbits by Acoustic Radiation Force Based Ultrasound Elastography. In Proceedings of the IEEE Ultrasonics Symposium, Washington, DC, USA, 6–9 September 2017. [Google Scholar]
- Datar, A.; Jain, A.; Sharma, P.C. Design of Kaiser window based optimized prototype filter for cosine modulated filter banks. Signal Process. 2010, 90, 1742–1749. [Google Scholar] [CrossRef]
- Goel, N.; Singh, J. Analysis of Kaiser and Gaussian Window Functions in the Fractional Fourier Transform Domain and Its Application. Iran. J. Sci. Technol. Trans. Electr. Eng. 2019, 43, 181–188. [Google Scholar] [CrossRef]
- Sulaiman, I.A.; Hassan, H.M.; Danish, M.; Singh, M.; Rajoriya, M. Design, comparison and analysis of low pass FIR filter using window techniques method. Mater. Today Proc. 2020, 10, 952. [Google Scholar]
- Gao, J.; Hou, Y.; Long, S. Design and FPGA Implementation of Linear FIR Low-pass Filter Based on Kaiser Window Function. In Proceedings of the International Conference on Intelligent Computation Technology and Automation, Shenzhen, China, 28–29 March 2011. [Google Scholar]
- Thomas, G.; Flores, B.C.; Sok-Son, J. SAR Sidelobe Apodization Using the Kaiser Window. In Proceedings of the 2000 International Conference on Image Processing, Vancouver, BC, Canada, 10–13 September 2000. [Google Scholar]
- Mbachu, C.B.; Onoh, G.N.; Idigo, V.E.; Ifeagwu, E.N.; Nnebe, S.U. Processing Ecg Signal with Kaiser Window-Based Fir Digital Filters. Int. J. Eng. Sci. Technol. 2011, 3, 6775–6783. [Google Scholar]


| Parameter Term | Value |
|---|---|
| Channels of elements | 256 |
| Center frequency | 15.00 MHz |
| Bandwidth | (8.00 MHz, 22.00 MHz) |
| Element kerf | 0.0377 mm |
| Element size | 0.0703 mm × 2.50 mm |
| DC bias voltage | 90.00 V |
| Sparse Array Configuration | Mean (dB) | Peak (dB) |
|---|---|---|
| TSA (3, 1)/RSA (2, 1) | −58.98 | −59.03 |
| TSA (6, 2)/RSA (2, 1) | −58.43 | −54.39 |
| TSA (6, 3)/RSA (3, 1) | −57.24 | −53.84 |
| TSA (6, 4)/RSA (4, 1) | −55.64 | −50.73 |
| TSA (6, 5)/RSA (5, 1) | −53.70 | −41.35 |
| Point-Targets Imaging | MSE | PSNR |
|---|---|---|
| TSA (2, 1)/RSA (2, 1) | 4369.84 | 24.33 |
| TSA (6, 3)/RSA (2, 1) | 3656.92 | 30.40 |
| TSA (4, 2)/RSA (2, 1) | 1755.90 | 33.89 |
| Point-Targets Imaging | MSE | PSNR |
|---|---|---|
| TSA (3, 1)/RSA (2, 1) | 3795.83 | 34.22 |
| TSA (6, 2)/RSA (2, 1) | 3837.70 | 34.07 |
| TSA (6, 3)/RSA (3, 1) | 3975.23 | 33.92 |
| TSA (6, 4)/RSA (4, 1) | 4115.12 | 33.77 |
| TSA (6, 5)/RSA (5, 1) | 4257.40 | 27.74 |
Publisher’s Note: MDPI stays neutral with regard to jurisdictional claims in published maps and institutional affiliations. |
© 2021 by the authors. Licensee MDPI, Basel, Switzerland. This article is an open access article distributed under the terms and conditions of the Creative Commons Attribution (CC BY) license (https://creativecommons.org/licenses/by/4.0/).
Share and Cite
Zhang, T.; Zhang, W.; Shao, X.; Yang, Y.; Wang, Z.; Wu, Y.; Pei, Y. A Study on Capacitive Micromachined Ultrasonic Transducer Periodic Sparse Array. Micromachines 2021, 12, 684. https://doi.org/10.3390/mi12060684
Zhang T, Zhang W, Shao X, Yang Y, Wang Z, Wu Y, Pei Y. A Study on Capacitive Micromachined Ultrasonic Transducer Periodic Sparse Array. Micromachines. 2021; 12(6):684. https://doi.org/10.3390/mi12060684
Chicago/Turabian StyleZhang, Tian, Wendong Zhang, Xingling Shao, Yuhua Yang, Zhihao Wang, Yang Wu, and Yu Pei. 2021. "A Study on Capacitive Micromachined Ultrasonic Transducer Periodic Sparse Array" Micromachines 12, no. 6: 684. https://doi.org/10.3390/mi12060684
APA StyleZhang, T., Zhang, W., Shao, X., Yang, Y., Wang, Z., Wu, Y., & Pei, Y. (2021). A Study on Capacitive Micromachined Ultrasonic Transducer Periodic Sparse Array. Micromachines, 12(6), 684. https://doi.org/10.3390/mi12060684