
Weak Association between Skin Autofluorescence Levels and Prediabetes with an ILERVAS Cross-Sectional Study

 , , , and
Abstract
:1. Introduction
2. Materials and Methods
2.1. Ethical Statement
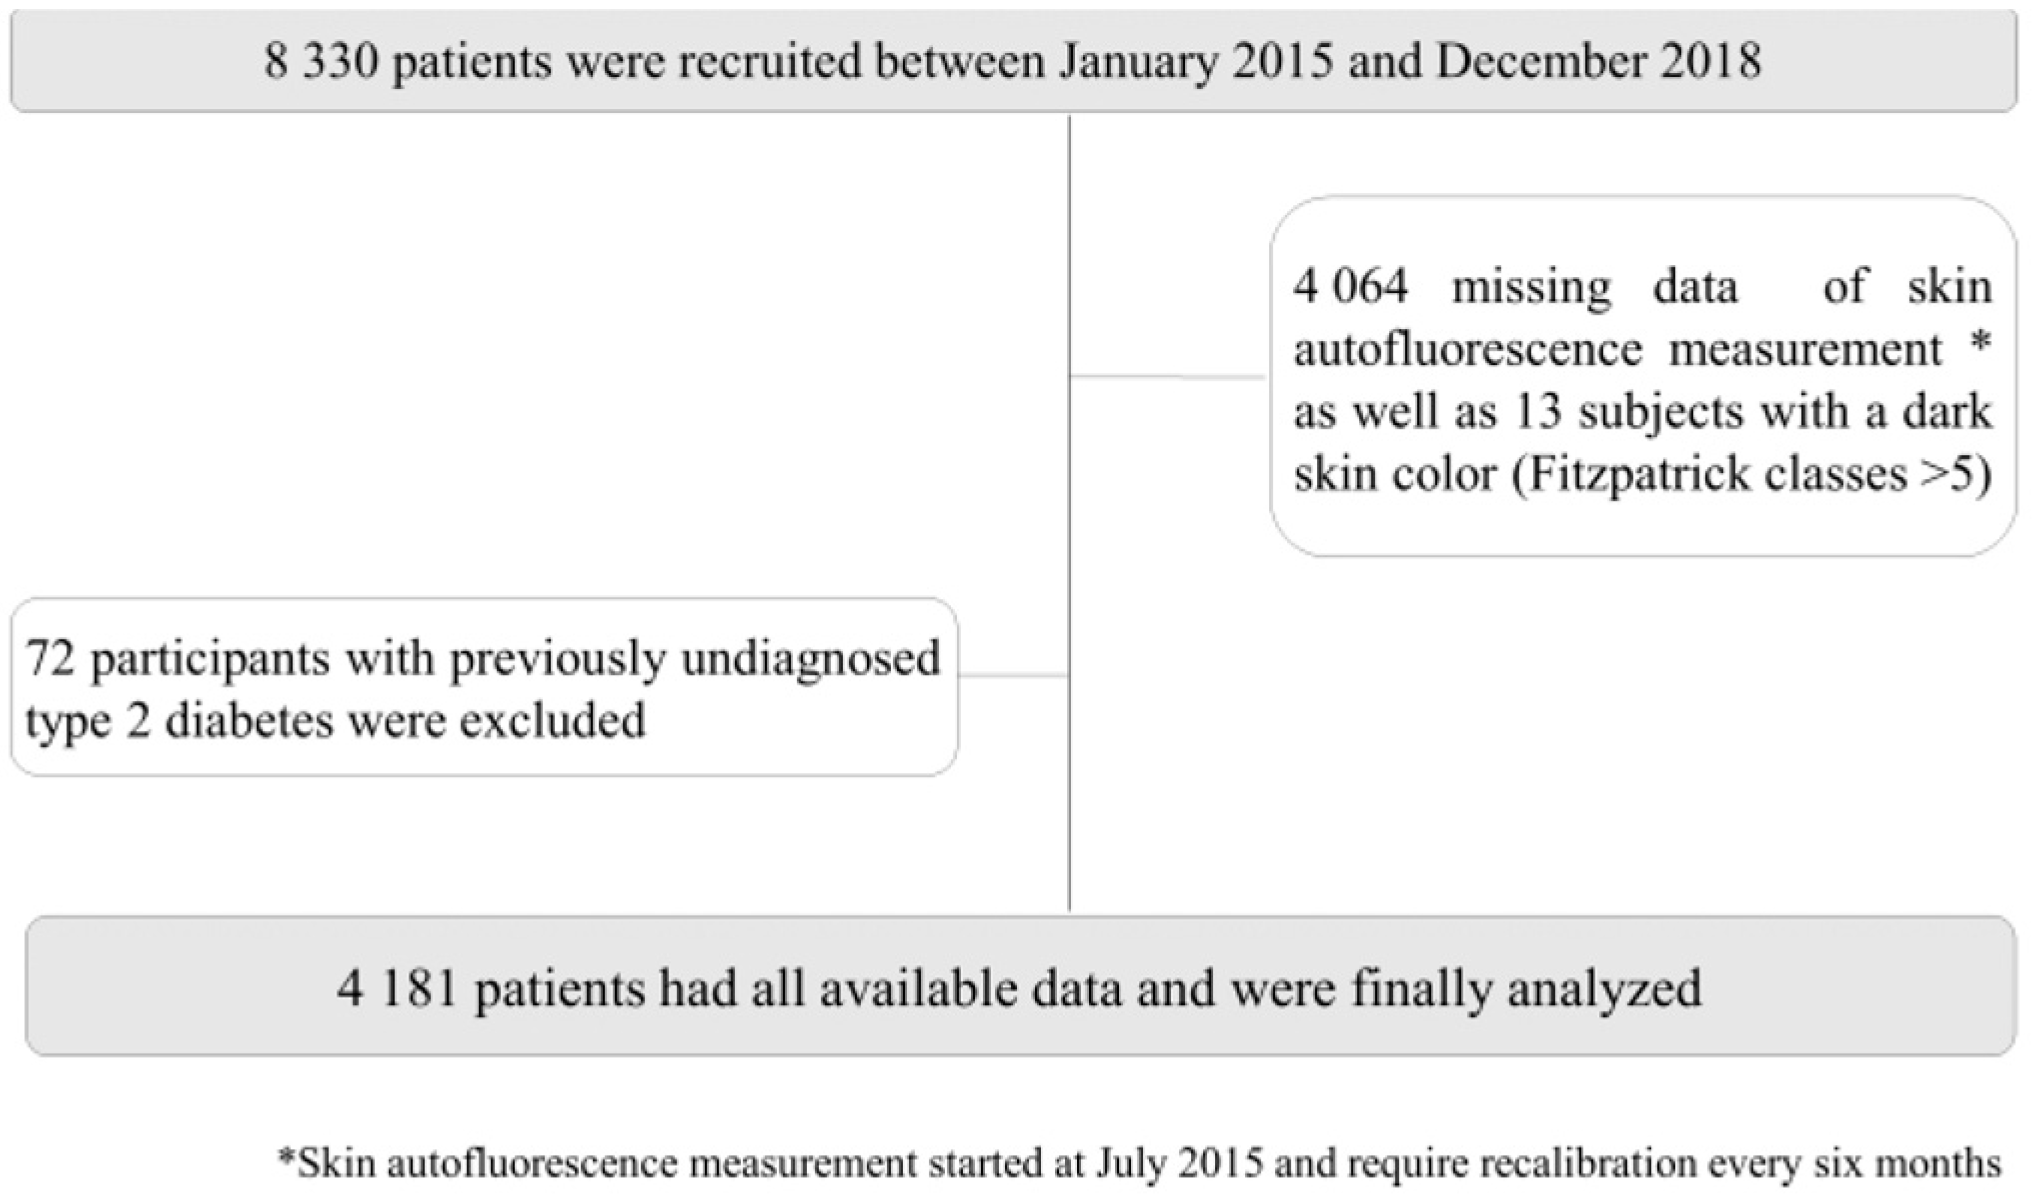
2.2. Design of the Study and Data of the Study Participants
2.3. Measurement of Skin Autofluorescence
2.4. Diagnosis of Prediabetes and Type 2 Diabetes
2.5. Statistical Analysis
3. Results
4. Discussion
5. Conclusions
Author Contributions
Funding
Institutional Review Board Statement
Informed Consent Statement
Data Availability Statement
Acknowledgments
Conflicts of Interest
References
- Ajith, T.A.; Vinodkumar, P. Advanced glycation end products: Association with the pathogenesis of diseases and the current therapeutic approaches. Curr. Clin. Pharmacol. 2016, 11, 118–127. [Google Scholar] [CrossRef] [PubMed]
- Bierhaus, A.; Hofmann, M.A.; Ziegler, R.; Nawroth, P.P. AGEs and their interaction with AGE-receptors in vascular disease and diabetes mellitus. I. The AGE concept. Cardiovasc. Res. 1998, 37, 586–600. [Google Scholar] [CrossRef] [Green Version]
- Goh, S.Y.; Cooper, M.E. The role of advanced glycation end products in progression and complications of diabetes. J. Clin. Endocrinol. Metab. 2008, 93, 1143–1152. [Google Scholar] [CrossRef] [PubMed] [Green Version]
- Vlassara, H.; Striker, G.E. Advanced glycation endproducts in diabetes and diabetic complications. Endocrinol. Metab. Clin. N. Am. 2013, 42, 697–719. [Google Scholar] [CrossRef] [PubMed]
- Uribarri, J.; Cai, W.; Peppa, M.; Goodman, S.; Ferrucci, L.; Striker, G.; Vlassara, H. Circulating glycotoxins and dietary advanced glycation endproducts: Two links to inflammatory response, oxidative stress, and aging. J. Gerontol. Ser. A Biol. Sci. Med. Sci. 2007, 62, 427–433. [Google Scholar] [CrossRef] [Green Version]
- Xia, P.F.; Tian, Y.X.; Geng, T.T.; Li, Y.; Tu, Z.Z.; Zhang, Y.B.; Guo, K.; Yang, K.; Liu, G.; Pan, A. Trends in Prevalence and Awareness of Prediabetes Among Adults in the U.S., 2005–2020. Diabetes Care 2022, 45, e21–e23. [Google Scholar] [CrossRef]
- Huang, Y.; Cai, X.; Mai, W.; Li, M.; Hu, Y. Association between prediabetes and risk of cardiovascular disease and all cause mortality: Systematic review and meta-analysis. BMJ 2016, 355, i5953. [Google Scholar] [CrossRef] [Green Version]
- Brunner, E.J.; Shipley, M.J.; Witte, D.R.; Fuller, J.H.; Marmot, M.G. Relation between blood glucose and coronary mortality over 33 years in the Whitehall Study. Diabetes Care 2006, 29, 26–31. [Google Scholar] [CrossRef]
- Sánchez, E.; Betriu, À.; López-Cano, C.; Hernández, M.; Fernández, E.; Purroy, F.; Bermúdez-López, M.; Farràs-Sallés, C.; Barril, S.; Pamplona, R.; et al. Characteristics of atheromatosis in the prediabetes stage: A cross-sectional investigation of the ILERVAS project. Cardiovasc. Diabetol. 2019, 18, 154. [Google Scholar] [CrossRef] [Green Version]
- Goldin, A.; Beckman, J.A.; Schmidt, A.M.; Creager, M.A. Advanced glycation end products: Sparking the development of diabetic vascular injury. Circulation 2006, 114, 597–605. [Google Scholar] [CrossRef] [Green Version]
- Kimura, H.; Tanaka, K.; Kanno, M.; Watanabe, K.; Hayashi, Y.; Asahi, K.; Suzuki, H.; Sato, K.; Sakaue, M.; Terawaki, H.; et al. Skin autofluorescence predicts cardiovascular mortality in patients on chronic hemodialysis. Ther. Apher. Dial. 2014, 18, 461–467. [Google Scholar] [CrossRef] [PubMed] [Green Version]
- Vélayoudom-Céphise, F.L.; Rajaobelina, K.; Helmer, C.; Nov, S.; Pupier, E.; Blanco, L.; Hugo, M.; Farges, B.; Astrugue, C.; Gin, H.; et al. Skin autofluorescence predicts cardio-renal outcome in type 1 diabetes: A longitudinal study. Cardiovasc. Diabetol. 2016, 15, 127. [Google Scholar] [CrossRef] [PubMed] [Green Version]
- Esquivel Zuniga, R.; DeBoer, M.D. Prediabetes in Adolescents: Prevalence, Management and Diabetes Prevention Strategies. Diabetes Metab. Syndr. Obes. Targets Ther. 2021, 14, 4609–4619. [Google Scholar] [CrossRef] [PubMed]
- American Diabetes Association. Classification and diagnosis of diabetes. Section 2. Diabetes Care 2017, 40, S11–S24. [Google Scholar] [CrossRef] [PubMed] [Green Version]
- Smit, A.J.; Smit, J.M.; Botterblom, G.J.; Mulder, D.J. Skin autofluorescence based decision tree in detection of impaired glucose tolerance and diabetes. PLoS ONE 2013, 8, e65592. [Google Scholar] [CrossRef] [PubMed] [Green Version]
- Maynard, J.D.; Rohrscheib, M.; Way, J.F.; Nguyen, C.M.; Ediger, M.N. Noninvasive type 2 diabetes screening, superior sensitivity to fasting plasma glucose and A1C. Diabetes Care 2007, 30, 1120–1124. [Google Scholar] [CrossRef] [Green Version]
- La Sala, L.; Tagliabue, E.; de Candia, P.; Prattichizzo, F.; Ceriello, A. One-hour plasma glucose combined with skin autofluorescence identifies subjects with pre-diabetes: The DIAPASON study. BMJ Open Diabetes Res. Care 2020, 8, e001331. [Google Scholar] [CrossRef]
- Hull, E.L.; Matter, N.I.; Olson, B.P.; Ediger, M.N.; Magee, A.J.; Way, J.F.; Vugrin, K.E.; Maynard, J.D. Noninvasive skin fluorescence spectroscopy for detection of abnormal glucose tolerance. J. Clin. Transl. Endocrinol. 2014, 1, 92–99. [Google Scholar] [CrossRef] [Green Version]
- Stirban, A. Noninvasive skin fluorescence spectroscopy for diabetes screening. J. Diabetes Sci. Technol. 2013, 7, 1001–1004. [Google Scholar] [CrossRef] [Green Version]
- Olson, B.P.; Matter, N.I.; Ediger, M.N.; Hull, E.L.; Maynard, J.D. Noninvasive skin fluorescence spectroscopy is comparable to hemoglobin A1c and fasting plasma glucose for detection of abnormal glucose tolerance. J. Diabetes Sci. Technol. 2013, 7, 990–1000. [Google Scholar] [CrossRef] [Green Version]
- Purroy, F.; Sánchez, E.; Lecube, A.; Arqué, G.; Vicente-Pascual, M.; Mauri-Capdevila, G.; Torreguitart, N.; Hernández, M.; Barbé, F.; Fernández, E.; et al. Prevalence and Predictors of Cerebral Microangiopathy Determined by Pulsatility Index in an Asymptomatic Population from the ILERVAS Project. Front. Neurol. 2021, 12, 785640. [Google Scholar] [PubMed]
- Meerwaldt, R.; Graaff, R.; Oomen, P.H.N.; Links, T.P.; Jager, J.J.; Alderson, N.L.; Thorpe, S.R.; Baynes, J.W.; Gans, R.O.B.; Smit, A.J. Simple non-invasive assessment of advanced glycation endproduct accumulation. Diabetologia 2004, 47, 1324–1330. [Google Scholar] [CrossRef] [PubMed] [Green Version]
- Lacolley, P.; Regnault, V.; Laurent, S. Mechanisms of arterial stiffening: From mechanotransduction to epigenetics. Arterioscler. Thromb. Vasc. Biol. 2020, 40, 1055–1062. [Google Scholar] [CrossRef] [PubMed]
- Perrone, A.; Giovino, A.; Benny, J.; Martinelli, F. Advanced Glycation End Products (AGEs): Biochemistry, Signaling, Analytical Methods, and Epigenetic Effects. Oxidative Med. Cell. Longev. 2020, 2020, 3818196. [Google Scholar] [CrossRef] [PubMed] [Green Version]
- Meerwaldt, R.; Lutgers, H.L.; Links, T.P.; Graaff, R.; Baynes, J.W.; Gans, R.O.; Smit, A.J. Skin autofluorescence is a strong predictor of cardiac mortality in diabetes. Diabetes Care 2007, 30, 107–112. [Google Scholar] [CrossRef] [Green Version]
- Vlassara, H.; Uribarri, J. Advanced glycation end products (AGE) and diabetes: Cause, effect, or both? Curr. Diabetes Rep. 2014, 14, 453. [Google Scholar] [CrossRef] [Green Version]
- Nowotny, K.; Jung, T.; Höhn, A.; Weber, D.; Grune, T. Advanced glycation end products and oxidative stress in type 2 diabetes mellitus. Biomolecules 2015, 16, 194–222. [Google Scholar] [CrossRef] [Green Version]
- Lutgers, H.L.; Graaff, R.; Links, T.P.; Ubink-Veltmaat, L.J.; Bilo, H.J.; Gans, R.O.; Smit, A.J. Skin autofluorescence as a noninvasive marker of vascular damage in patients with type 2 diabetes. Diabetes Care 2006, 29, 2654–2659. [Google Scholar] [CrossRef] [Green Version]
- Sánchez, E.; Betriu, À.; Yeramian, A.; Fernández, E.; Purroy, F.; Sánchez-de-la-Torre, M.; Pamplona, R.; Miquel, E.; Kerkeni, M.; Hernández, C.; et al. Skin Autofluorescence Measurement in Subclinical Atheromatous Disease: Results from the ILERVAS Project. J. Atheroscler. Thromb. 2019, 26, 879–889. [Google Scholar] [CrossRef] [Green Version]
- van Waateringe, R.P.; Fokkens, B.T.; Slagter, S.N.; van der Klauw, M.M.; van Vliet-Ostaptchouk, J.V.; Graaff, R.; Paterson, A.D.; Smit, A.J.; Lutgers, H.L.; Wolffenbuttel, B.H.R. Skin autofluorescence predicts incident type 2 diabetes, cardiovascular disease and mortality in the general population. Diabetologia 2019, 62, 269–280. [Google Scholar] [CrossRef] [Green Version]
- Rajaobelina, K.; Cougnard-Gregoire, A.; Delcourt, C.; Gin, H.; Barberger-Gateau, P.; Rigalleau, V. Autofluorescence of Skin Advanced Glycation End Products: Marker of Metabolic Memory in Elderly Population. J. Gerontol. Ser. A Biomed. Sci. Med. Sci. 2015, 70, 841–846. [Google Scholar] [CrossRef] [PubMed] [Green Version]


| Prediabetes (n = 1444) | Control Group (n = 2737) | |
|---|---|---|
| Age (years) | 59 [54; 64] | 56 [52; 62] |
| Women, n (%) | 827 (57.3) | 1268 (46.3) |
| BMI (kg/m2) | 29.5 [26.7; 33.1] | 27.7 [24.8; 30.8] |
| HbA1c (mmol/mol) | 40 [39; 42] | 36 [33; 37] |
| HbA1c (%) | 5.8 [5.7; 6.0] | 5.4 [5.2; 5.5] |
| Hypertension, n (%) | 684 (47.4) | 992 (36.2) |
| Dyslipidemia | 865 (59.9) | 1363 (49.8) |
| Obesity, n (%) | 581 (40.2) | 758 (27.7) |
| Current or former smoker, n (%) | 828 (57.3) | 1819 (66.5) |
| Prediabetes | OR (95% CI) | p Value | |
|---|---|---|---|
| Sex | Women | Reference | |
| Men | 1.34 (1.16 to 1.55) | <0.001 | |
| Age (years) | 1.04 (1.03 to 1.05) | <0.001 | |
| Body mass index (kg/m2) | 1.09 (1.07 to 1.10) | <0.001 | |
| Smoking status | Never | Reference | |
| Current or former | 1.08 (0.93 to 1.25) | 0.326 | |
| Skin autofluorescence (AU) | 0.97 (1.00 to 0.85) | 0.969 | |
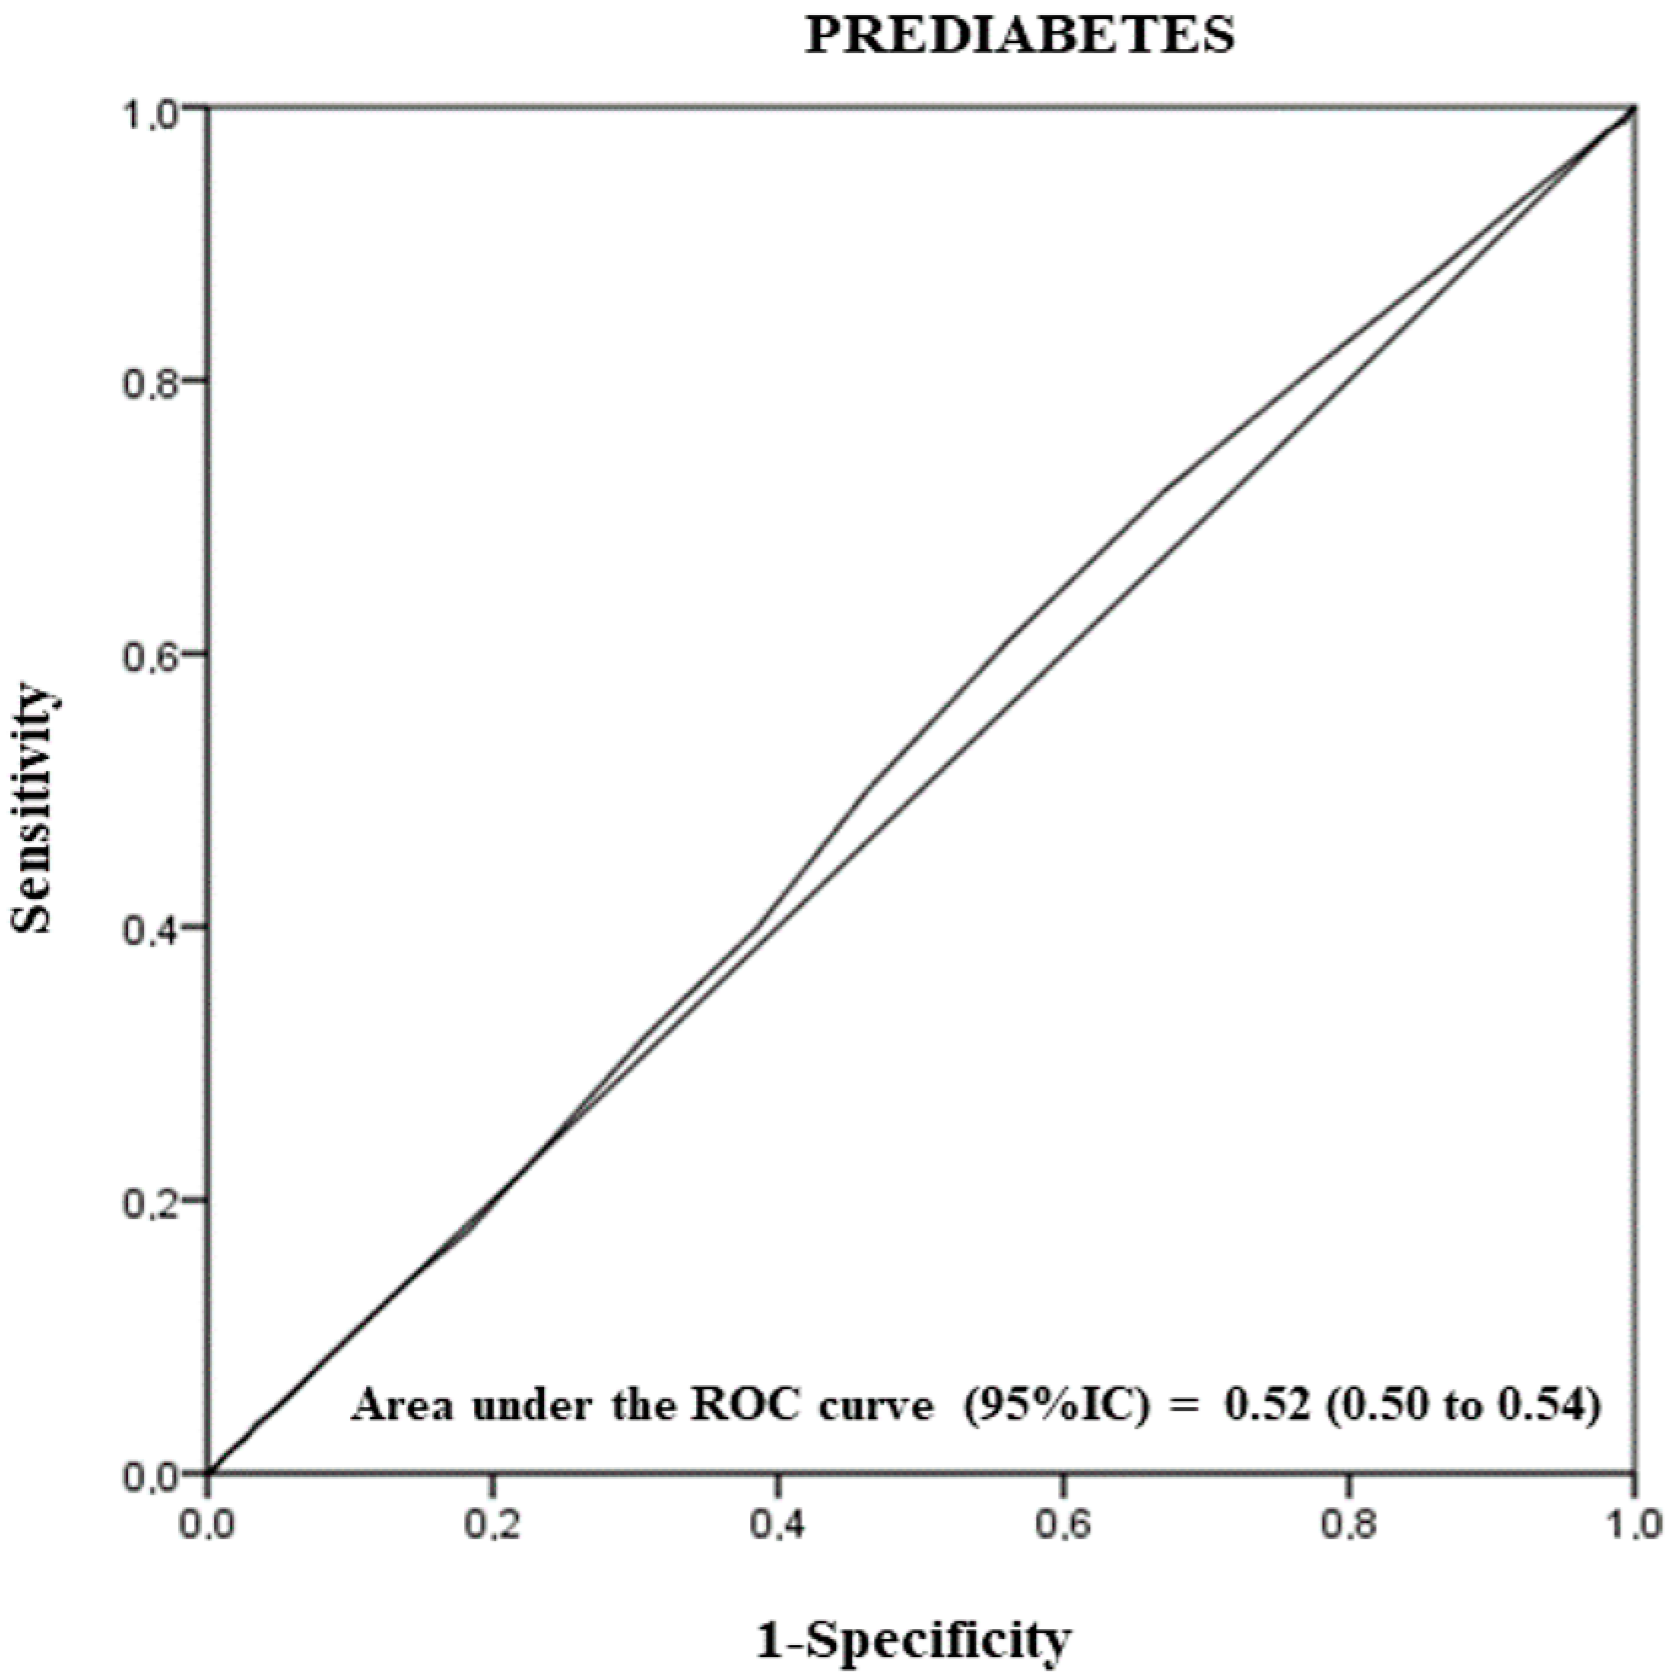
| Hosmer–Lemeshow test of fit | 0.65 (0.64 to 0.67) | 0.002 <0.001 | |
| Area under the ROC curve | |||
Publisher’s Note: MDPI stays neutral with regard to jurisdictional claims in published maps and institutional affiliations. |
© 2022 by the authors. Licensee MDPI, Basel, Switzerland. This article is an open access article distributed under the terms and conditions of the Creative Commons Attribution (CC BY) license (https://creativecommons.org/licenses/by/4.0/).
Share and Cite
Sánchez, E.; Kerkeni, M.; Hernández, M.; Gavaldà, R.; Rius, F.; Sauret, A.; Torres, G.; Bermúdez-López, M.; Fernández, E.; Castro-Boqué, E.; et al. Weak Association between Skin Autofluorescence Levels and Prediabetes with an ILERVAS Cross-Sectional Study. Nutrients 2022, 14, 1102. https://doi.org/10.3390/nu14051102
Sánchez E, Kerkeni M, Hernández M, Gavaldà R, Rius F, Sauret A, Torres G, Bermúdez-López M, Fernández E, Castro-Boqué E, et al. Weak Association between Skin Autofluorescence Levels and Prediabetes with an ILERVAS Cross-Sectional Study. Nutrients. 2022; 14(5):1102. https://doi.org/10.3390/nu14051102
Chicago/Turabian StyleSánchez, Enric, Mohsen Kerkeni, Marta Hernández, Ricard Gavaldà, Ferran Rius, Ariadna Sauret, Gerard Torres, Marcelino Bermúdez-López, Elvira Fernández, Eva Castro-Boqué, and et al. 2022. "Weak Association between Skin Autofluorescence Levels and Prediabetes with an ILERVAS Cross-Sectional Study" Nutrients 14, no. 5: 1102. https://doi.org/10.3390/nu14051102