
The Role of Diet in Prognosis among Cancer Survivors: A Systematic Review and Meta-Analysis of Dietary Patterns and Diet Interventions


Abstract
1. Introduction
2. Materials and Methods
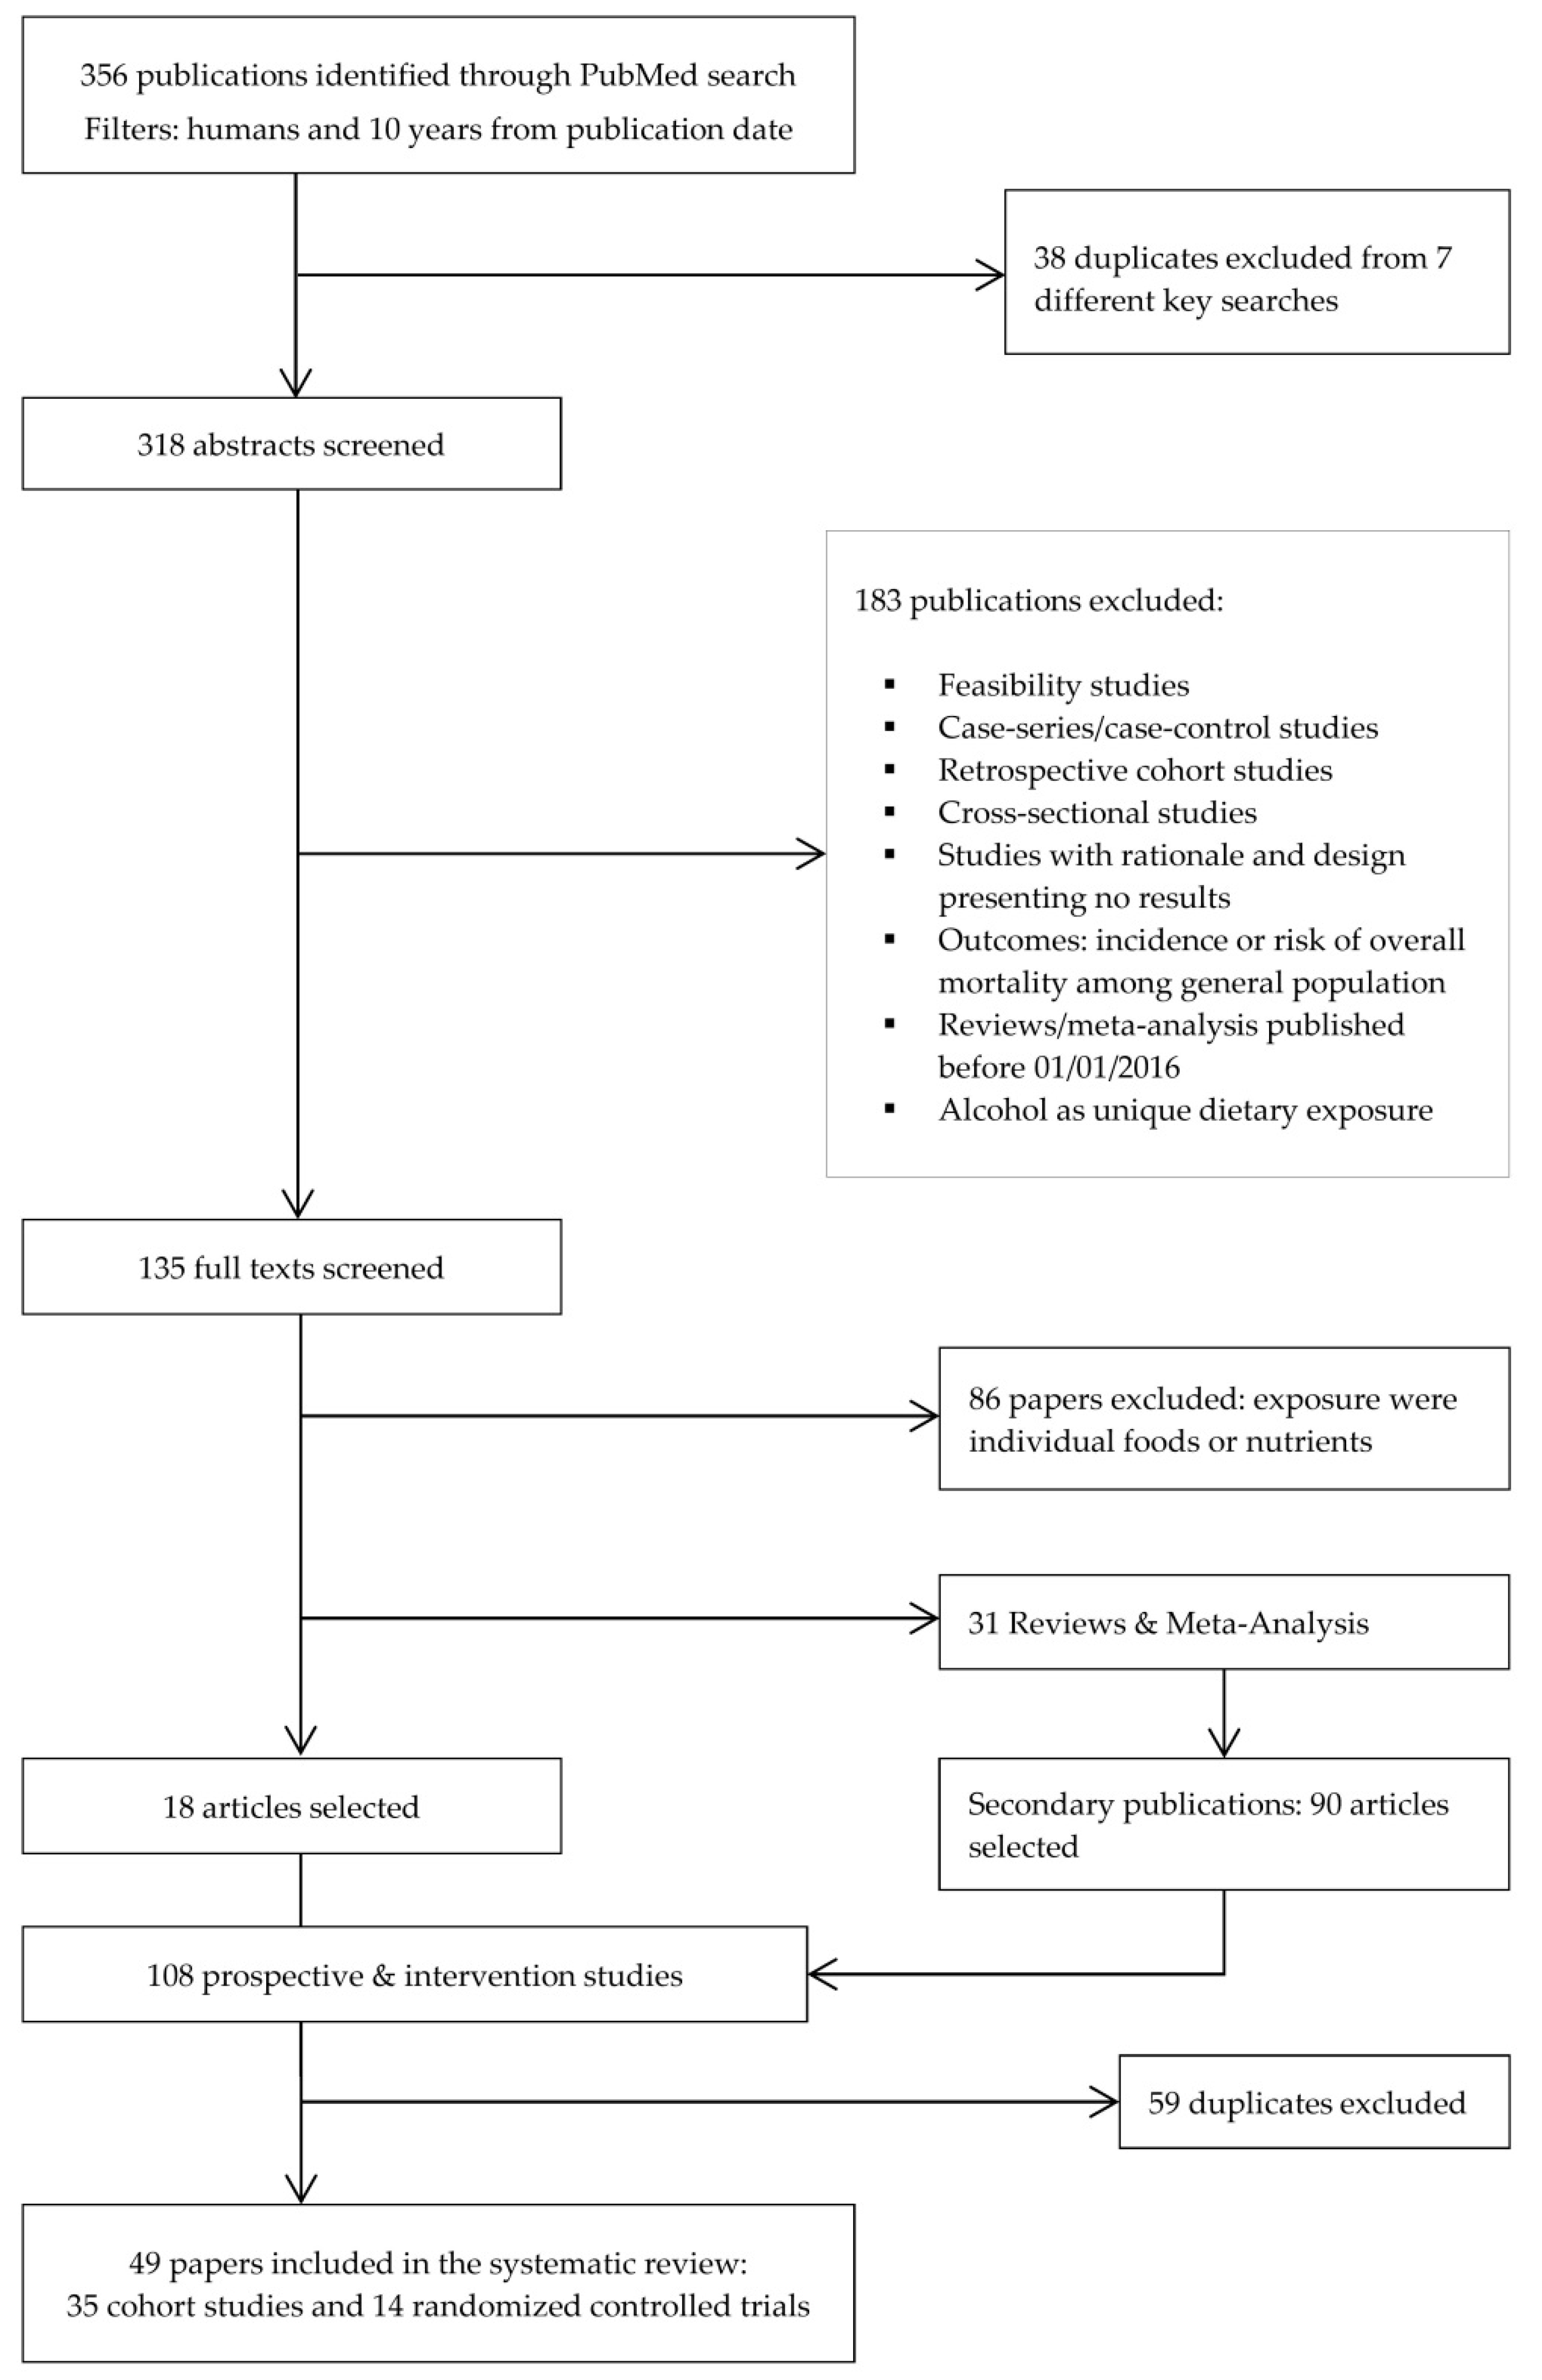
2.1. Search Strategy
2.2. Study Selection
2.3. Data Extraction
2.4. Outcomes
2.5. Bias Assessment
2.6. Meta-Analysis
3. Results
3.1. Identified Studies
3.2. Prospective Cohort Studies
3.2.1. Breast Cancer (BC)
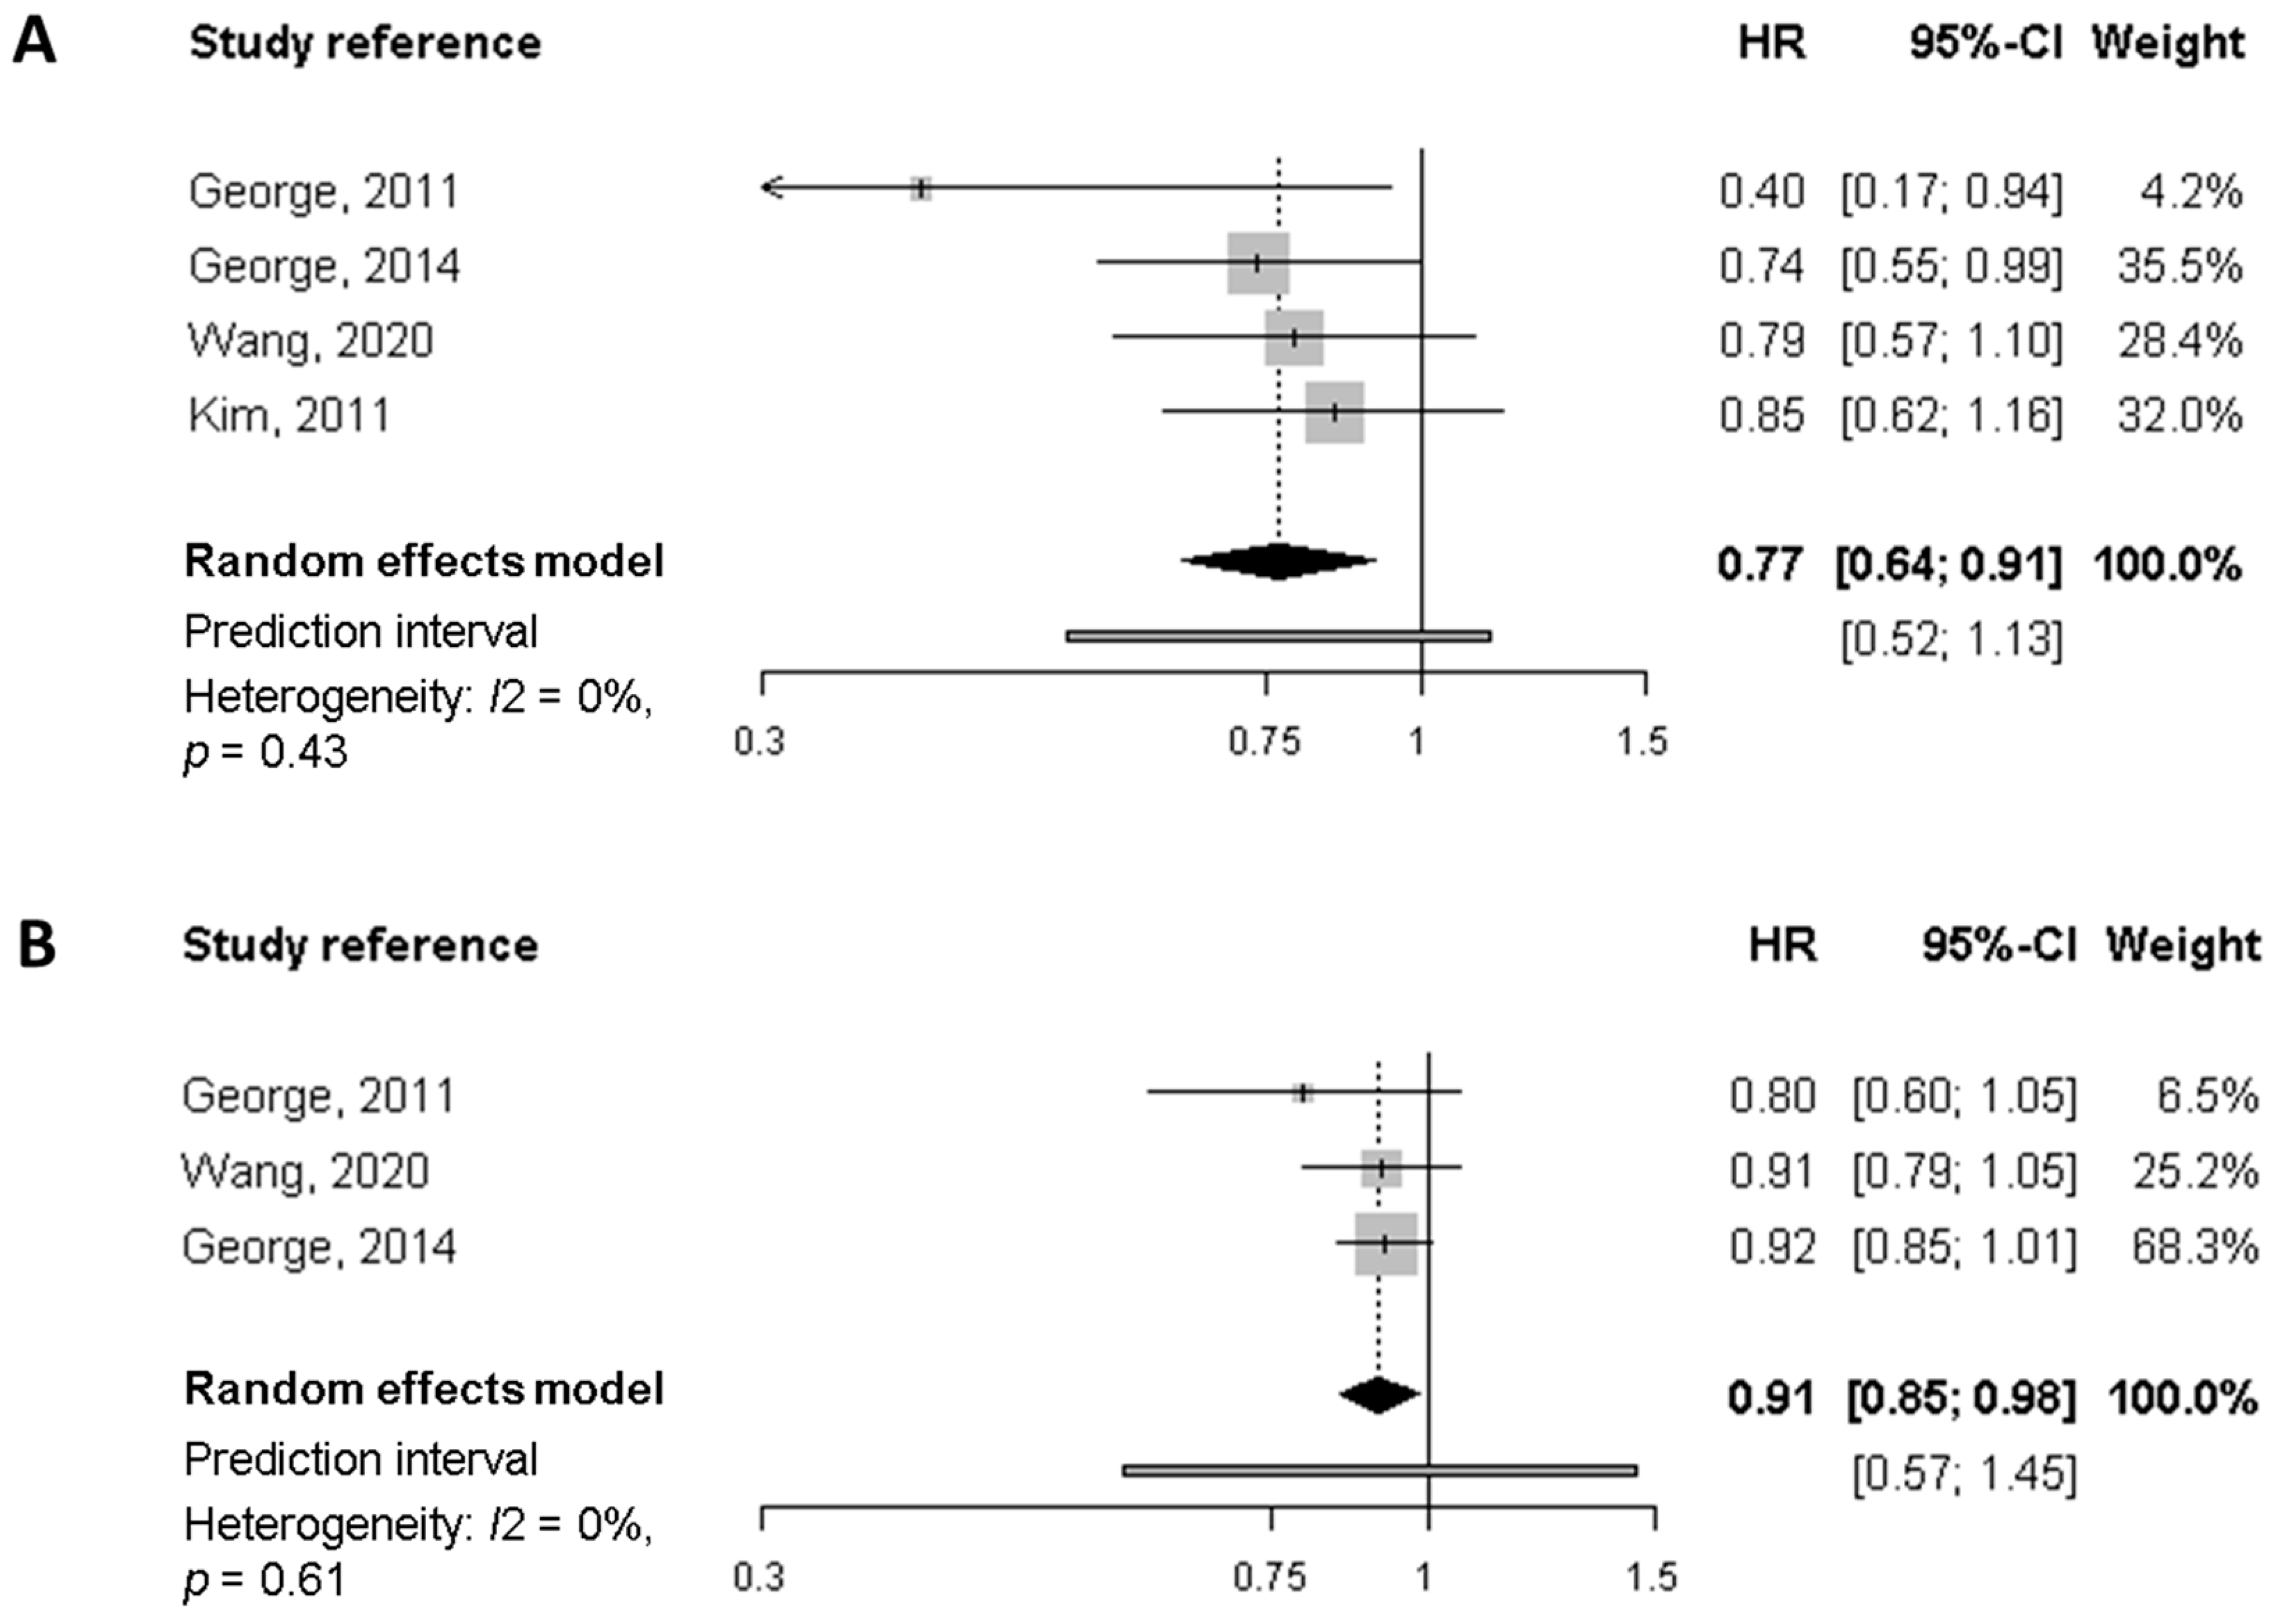
Meta-Analysis of Cohort Studies on Breast Cancer Survivors
3.2.2. Colorectal Cancer (CRC)
3.2.3. Other Cancers
3.3. Randomised Controlled Trials (RCT)
3.3.1. Randomised Controlled Trials on Breast Cancer Survivors
3.3.2. Randomised Controlled Trials on Other Cancers
4. Discussion
Study Strengths and Limitations
5. Conclusions and Final Remarks
Author Contributions
Funding
Institutional Review Board Statement
Informed Consent Statement
Data Availability Statement
Acknowledgments
Conflicts of Interest
Appendix A

| Study Reference | Selection (0–4) | Comparability (0–2) | Outcome (0–3) | Total Score (0–9) | |
|---|---|---|---|---|---|
| Several cancers | |||||
| Inoue-Choi, 2013 * | 4 | 2 | 3 | 9 | |
| Karavasiloglou, 2019 | 4 | 2 | 2 | 8 | |
| Breast cancer | |||||
| Kim, 2011 | 4 | 2 | 2 | 8 | |
| George, 2011 | 4 | 1 | 2 | 7 | |
| Vrieling, 2013 | 4 | 1 | 2 | 7 | |
| Inoue-Choi, 2013 | 4 | 2 | 3 | 9 | |
| Izano, 2013 | 4 | 2 | 2 | 8 | |
| George, 2014 | 4 | 2 | 2 | 8 | |
| McCullough, 2016 | 4 | 2 | 2 | 8 | |
| Jang, 2018 | 3 | 1 | 1 | 5 | |
| Sun, 2018 | 4 | 2 | 3 | 9 | |
| Zheng, 2018 | 4 | 2 | 3 | 9 | |
| Karavasiloglou, 2019 | 4 | 2 | 2 | 8 | |
| Wang, 2020 | 4 | 2 | 3 | 9 | |
| Wang, 2021 | 4 | 2 | 2 | 8 | |
| Colorectal cancer | |||||
| Inoue-Choi, 2013 | 4 | 2 | 3 | 9 | |
| Zhu, 2013 | 4 | 2 | 2 | 8 | |
| Pelser, 2014 | 4 | 2 | 2 | 8 | |
| Fung, 2014 | 4 | 2 | 3 | 9 | |
| Romaguera, 2015 | 4 | 2 | 1 | 7 | |
| Jacobs, 2016 | 4 | 2 | 2 | 8 | |
| Yuan, 2017 | 4 | 2 | 2 | 8 | |
| Ratjen, 2017 | 4 | 2 | 2 | 8 | |
| Sharma, 2018 | 4 | 2 | 2 | 8 | |
| Zheng, 2020 | 4 | 2 | 2 | 8 | |
| Tabung, 2020 | 4 | 2 | 2 | 8 | |
| Prostate cancer | |||||
| Kenfied, 2014 | 4 | 2 | 2 | 8 | |
| Yang M (1), 2015 | 4 | 2 | 3 | 9 | |
| Zucchetto, 2016 | 4 | 1 | 2 | 7 | |
| Head and Neck cancer | |||||
| Arthur, 2013 | 4 | 1 | 2 | 7 | |
| Crowder, 2019 | 4 | 1 | 1 | 6 | |
| Ovarian cancer | |||||
| Thomson, 2014 | 4 | 1 | 1 | 6 | |
| Hansen, 2020 | 4 | 1 | 2 | 7 | |
| Bladder cancer | |||||
| Westhoff, 2018 | 4 | 1 | 2 | 7 | |
| Multiple myeloma (MM) | |||||
| Lee, 2020 | 4 | 1 | 3 | 8 | |
| HR (95% CI) | |||||||
|---|---|---|---|---|---|---|---|
| Study Reference, Cohort | Diet Quality Index | Q1 | Q2 | Q3 | Q4 | Q5 | 10-Unit Increase |
| Kim, 2011 | AHEI | ||||||
| NHS | - | ||||||
| Overall mortality | 1.00 | 0.82 (0.61–1.10) | 0.83 (0.62–1.12) | 0.98 (0.73–1.32) | 0.85 (0.63–1.17) | - | |
| BC-specific mortality | 1.00 | 1.06 (0.68–1.66) | 1.12 (0.72–1.74) | 1.28 (0.83–1.98) | 1.53 (0.98–2.39) | - | |
| George, 2011 | HEI-2005 | ||||||
| HEAL | Mean | 50.10 | 62.90 | 70.80 | 79.00 | - | |
| Overall mortality | 1.00 | 0.39 (0.18–0.85) | 0.85 (0.43–1.71) | 0.40 (0.17–0.94) | - | 0.80 (0.60–1.05) | |
| BC-specific mortality | 1.00 | 0.65 (0.23–1.86) | 0.70 (0.24–2.06) | 0.12 (0.02–0.99) | - | 0.53 (0.28–0.99) | |
| George 2014 | HEI-2005 | ||||||
| WHI | Range (Midpoint) | 34–63 (48.5) | 63–71 (67) | 71–77 (74) | 77–91 (84) | - | |
| Overall mortality | 1.00 | 0.93 (0.71–1.22) | 0.86 (0.65–1.14) | 0.74 (0.55–0.99) | - | 0.92 (0.85–1.01) | |
| BC-specific mortality | 1.00 | 0.99 (0.66–1.50) | 0.93 (0.61–1.43) | 0.91 (0.60–1.40) | - | 0.97 (0.86–1.10) | |
| Wang 2020 | HEI-2015 | ||||||
| SBCSS | Range (Midpoint) | 38.0–58.7 (48.35) | 58.7–61.9 (60.3) | 61.9–65.8 (63.85) | 65.8–78.5 (72.15) | - | |
| Overall mortality | 1.00 | 1.08 (0.82–1.42) | 1.01 (0.76–1.36) | 0.79 (0.57–1.10) | - | 0.91 (0.79–1.05) | |
| BC-specific mortality | 1.00 | 1.10 (0.79–1.53) | 0.91 (0.63–1.31) | 0.86 (0.58–1.27) | - | 0.93 (0.79–1.11) | |
References
- Ligibel, J. Lifestyle Factors in Cancer Survivorship. J. Clin. Oncol. Off. J. Am. Soc. Clin. Oncol. 2012, 30, 3697–3704. [Google Scholar] [CrossRef] [PubMed]
- Ferlay, J.; Ervik, M.; Lam, F.; Colombet, M.; Mery, L.; Piñeros, M. Global Cancer Observatory: Cancer Today; International Agency for Research on Cancer: Lyon, France, 2020; Available online: http://gco.iarc.fr/today/home (accessed on 29 November 2021).
- Allemani, C.; Weir, H.K.; Carreira, H.; Harewood, R.; Spika, D.; Wang, X.-S.; Bannon, F.; Ahn, J.V.; Johnson, C.J.; Bonaventure, A.; et al. Global Surveillance of Cancer Survival 1995–2009: Analysis of Individual Data for 25,676,887 Patients from 279 Population-Based Registries in 67 Countries (CONCORD-2). Lancet Lond. Engl. 2015, 385, 977–1010. [Google Scholar] [CrossRef]
- WCRF/AICR World Cancer Research Fund/American Institute for Cancer Research. Continuous Update Project Expert Report 2018. Survivors of Breast Cancer and Other Cancers. 2018. Available online: https://www.wcrf.org/wp-content/uploads/2021/02/Cancer-Survivors.pdf (accessed on 12 November 2021).
- Schwedhelm, C.; Boeing, H.; Hoffmann, G.; Aleksandrova, K.; Schwingshackl, L. Effect of Diet on Mortality and Cancer Recurrence among Cancer Survivors: A Systematic Review and Meta-Analysis of Cohort Studies. Nutr. Rev. 2016, 74, 737–748. [Google Scholar] [CrossRef] [PubMed]
- Jochems, S.H.J.; Van Osch, F.H.M.; Bryan, R.T.; Wesselius, A.; van Schooten, F.J.; Cheng, K.K.; Zeegers, M.P. Impact of Dietary Patterns and the Main Food Groups on Mortality and Recurrence in Cancer Survivors: A Systematic Review of Current Epidemiological Literature. BMJ Open 2018, 8, e014530. [Google Scholar] [CrossRef]
- Rinninella, E.; Mele, M.C.; Cintoni, M.; Raoul, P.; Ianiro, G.; Salerno, L.; Pozzo, C.; Bria, E.; Muscaritoli, M.; Molfino, A.; et al. The Facts about Food after Cancer Diagnosis: A Systematic Review of Prospective Cohort Studies. Nutrients 2020, 12, 2345. [Google Scholar] [CrossRef]
- Keaver, L.; Houlihan, C.; O’Callaghan, N.; LaVertu, A.E.; Ding, X.; Zhang, F.F. Evidence-Based Nutrition Guidelines for Cancer Survivors in Europe: A Call for Action. Eur. J. Clin. Nutr. 2021. [Google Scholar] [CrossRef]
- WCRF/AICR World Cancer Research Fund/American Institute for Cancer Research. Diet, Nutrition, Physical Activity and Cancer: A Global Perspective. Continuous Update Project Expert Report 2018. 2018. Available online: https://www.wcrf.org/wp-content/uploads/2021/02/Summary-of-Third-Expert-Report-2018.pdf (accessed on 15 December 2021).
- Steck, S.E.; Murphy, E.A. Dietary Patterns and Cancer Risk. Nat. Rev. Cancer 2020, 20, 125–138. [Google Scholar] [CrossRef]
- Chlebowski, R.T.; Blackburn, G.L.; Thomson, C.A.; Nixon, D.W.; Shapiro, A.; Hoy, M.K.; Goodman, M.T.; Giuliano, A.E.; Karanja, N.; McAndrew, P.; et al. Dietary Fat Reduction and Breast Cancer Outcome: Interim Efficacy Results from the Women’s Intervention Nutrition Study. J. Natl. Cancer Inst. 2006, 98, 1767–1776. [Google Scholar] [CrossRef]
- Pierce, J.P.; Natarajan, L.; Caan, B.J.; Parker, B.A.; Greenberg, E.R.; Flatt, S.W.; Rock, C.L.; Kealey, S.; Al-Delaimy, W.K.; Bardwell, W.A.; et al. Influence of a Diet Very High in Vegetables, Fruit, and Fiber and Low in Fat on Prognosis Following Treatment for Breast Cancer: The Women’s Healthy Eating and Living (WHEL) Randomized Trial. JAMA 2007, 298, 289–298. [Google Scholar] [CrossRef]
- Nelson, N. Dietary Intervention Trial Reports No Effect on Survival after Breast Cancer. J. Natl. Cancer Inst. 2008, 100, 386–387. [Google Scholar] [CrossRef][Green Version]
- Bicego, D.; Brown, K.; Ruddick, M.; Storey, D.; Wong, C.; Harris, S.R. Effects of Exercise on Quality of Life in Women Living with Breast Cancer: A Systematic Review. Breast J. 2009, 15, 45–51. [Google Scholar] [CrossRef] [PubMed]
- Fong, D.Y.T.; Ho, J.W.C.; Hui, B.P.H.; Lee, A.M.; Macfarlane, D.J.; Leung, S.S.K.; Cerin, E.; Chan, W.Y.Y.; Leung, I.P.F.; Lam, S.H.S.; et al. Physical Activity for Cancer Survivors: Meta-Analysis of Randomised Controlled Trials. BMJ 2012, 344, e70. [Google Scholar] [CrossRef] [PubMed]
- Liberati, A.; Altman, D.G.; Tetzlaff, J.; Mulrow, C.; Gøtzsche, P.C.; Ioannidis, J.P.A.; Clarke, M.; Devereaux, P.J.; Kleijnen, J.; Moher, D. The PRISMA Statement for Reporting Systematic Reviews and Meta-Analyses of Studies That Evaluate Health Care Interventions: Explanation and Elaboration. J. Clin. Epidemiol. 2009, 62, e1–e34. [Google Scholar] [CrossRef]
- Wells, G.; Shea, B.; O’Connell, D.; Peterson, J.; Welch, V.; Losos, M. The Newcastle-Ottawa Scale (NOS) for Assessing the Quality If Nonrandomized Studies in Meta-Analyses. Available online: http://www.ohri.ca/programs/clinical_epidemiology/oxford.asp (accessed on 10 October 2021).
- Kim, E.H.J.; Willett, W.C.; Fung, T.; Rosner, B.; Holmes, M.D. Diet Quality Indices and Postmenopausal Breast Cancer Survival. Nutr. Cancer 2011, 63, 381–388. [Google Scholar] [CrossRef] [PubMed]
- George, S.M.; Irwin, M.L.; Smith, A.W.; Neuhouser, M.L.; Reedy, J.; McTiernan, A.; Alfano, C.M.; Bernstein, L.; Ulrich, C.M.; Baumgartner, K.B.; et al. Postdiagnosis Diet Quality, the Combination of Diet Quality and Recreational Physical Activity, and Prognosis after Early-Stage Breast Cancer. Cancer Causes Control CCC 2011, 22, 589–598. [Google Scholar] [CrossRef]
- George, S.M.; Ballard-Barbash, R.; Shikany, J.M.; Caan, B.J.; Freudenheim, J.L.; Kroenke, C.H.; Vitolins, M.Z.; Beresford, S.A.; Neuhouser, M.L. Better Postdiagnosis Diet Quality Is Associated with Reduced Risk of Death among Postmenopausal Women with Invasive Breast Cancer in the Women’s Health Initiative. Cancer Epidemiol. Biomark. Prev. Publ. Am. Assoc. Cancer Res. Cosponsored Am. Soc. Prev. Oncol. 2014, 23, 575–583. [Google Scholar] [CrossRef]
- Wang, F.; Cai, H.; Gu, K.; Shi, L.; Yu, D.; Zhang, M.; Zheng, W.; Zheng, Y.; Bao, P.; Shu, X.-O. Adherence to Dietary Recommendations among Long-Term Breast Cancer Survivors and Cancer Outcome Associations. Cancer Epidemiol. Biomark. Prev. Publ. Am. Assoc. Cancer Res. Cosponsored Am. Soc. Prev. Oncol. 2020, 29, 386–395. [Google Scholar] [CrossRef]
- Hartemink, N.; Boshuizen, H.C.; Nagelkerke, N.J.D.; Jacobs, M.A.M.; van Houwelingen, H.C. Combining Risk Estimates from Observational Studies with Different Exposure Cutpoints: A Meta-Analysis on Body Mass Index and Diabetes Type 2. Am. J. Epidemiol. 2006, 163, 1042–1052. [Google Scholar] [CrossRef]
- Deeks, J.J.; Higgins, J.P.; Altman, D.G. Analysing Data and Undertaking Meta-Analyses. In Cochrane Handbook for Systematic Reviews of Interventions; John Wiley & Sons, Ltd.: Hoboken, NJ, USA, 2008; pp. 243–296. ISBN 978-0-470-71218-4. [Google Scholar]
- Veroniki, A.A.; Jackson, D.; Viechtbauer, W.; Bender, R.; Bowden, J.; Knapp, G.; Kuss, O.; Higgins, J.P.T.; Langan, D.; Salanti, G. Methods to Estimate the Between-Study Variance and Its Uncertainty in Meta-Analysis. Res. Synth. Methods 2016, 7, 55–79. [Google Scholar] [CrossRef]
- Higgins, J.P.T.; Thompson, S.G.; Deeks, J.J.; Altman, D.G. Measuring Inconsistency in Meta-Analyses. BMJ 2003, 327, 557–560. [Google Scholar] [CrossRef]
- Nagashima, K.; Noma, H.; Furukawa, T.A. Prediction Intervals for Random-Effects Meta-Analysis: A Confidence Distribution Approach. Stat. Methods Med. Res. 2019, 28, 1689–1702. [Google Scholar] [CrossRef] [PubMed]
- Vrieling, A.; Buck, K.; Seibold, P.; Heinz, J.; Obi, N.; Flesch-Janys, D.; Chang-Claude, J. Dietary Patterns and Survival in German Postmenopausal Breast Cancer Survivors. Br. J. Cancer 2013, 108, 188–192. [Google Scholar] [CrossRef] [PubMed]
- Izano, M.A.; Fung, T.T.; Chiuve, S.S.; Hu, F.B.; Holmes, M.D. Are Diet Quality Scores after Breast Cancer Diagnosis Associated with Improved Breast Cancer Survival? Nutr. Cancer 2013, 65, 820–826. [Google Scholar] [CrossRef]
- Jang, H.; Chung, M.S.; Kang, S.S.; Park, Y. Association between the Dietary Inflammatory Index and Risk for Cancer Recurrence and Mortality among Patients with Breast Cancer. Nutrients 2018, 10, 1095. [Google Scholar] [CrossRef] [PubMed]
- Al-Ibrahim, A.A.; Jackson, R.T. Healthy Eating Index versus Alternate Healthy Index in Relation to Diabetes Status and Health Markers in U.S. Adults: NHANES 2007–2010. Nutr. J. 2019, 18, 26. [Google Scholar] [CrossRef]
- Karavasiloglou, N.; Pestoni, G.; Faeh, D.; Rohrmann, S. Post-Diagnostic Diet Quality and Mortality in Females with Self-Reported History of Breast or Gynecological Cancers: Results from the Third National Health and Nutrition Examination Survey (NHANES III). Nutrients 2019, 11, 2558. [Google Scholar] [CrossRef]
- Sun, Y.; Bao, W.; Liu, B.; Caan, B.J.; Lane, D.S.; Millen, A.E.; Simon, M.S.; Thomson, C.A.; Tinker, L.F.; Van Horn, L.V.; et al. Changes in Overall Diet Quality in Relation to Survival in Postmenopausal Women with Breast Cancer: Results from the Women’s Health Initiative. J. Acad. Nutr. Diet. 2018, 118, 1855–1863.e6. [Google Scholar] [CrossRef]
- Zheng, J.; Tabung, F.K.; Zhang, J.; Liese, A.D.; Shivappa, N.; Ockene, J.K.; Caan, B.; Kroenke, C.H.; Hébert, J.R.; Steck, S.E. Association between Post-Cancer Diagnosis Dietary Inflammatory Potential and Mortality among Invasive Breast Cancer Survivors in the Women’s Health Initiative. Cancer Epidemiol. Biomark. Prev. Publ. Am. Assoc. Cancer Res. Cosponsored Am. Soc. Prev. Oncol. 2018, 27, 454–463. [Google Scholar] [CrossRef]
- Wang, T.; Farvid, M.S.; Kang, J.H.; Holmes, M.D.; Rosner, B.A.; Tamimi, R.M.; Willett, W.C.; Eliassen, A.H. Diabetes Risk Reduction Diet and Survival After Breast Cancer Diagnosis. Cancer Res. 2021, 81, 4155–4162. [Google Scholar] [CrossRef]
- McCullough, M.L.; Gapstur, S.M.; Shah, R.; Campbell, P.T.; Wang, Y.; Doyle, C.; Gaudet, M.M. Pre- and Postdiagnostic Diet in Relation to Mortality among Breast Cancer Survivors in the CPS-II Nutrition Cohort. Cancer Causes Control CCC 2016, 27, 1303–1314. [Google Scholar] [CrossRef]
- Inoue-Choi, M.; Robien, K.; Lazovich, D. Adherence to the WCRF/AICR Guidelines for Cancer Prevention Is Associated with Lower Mortality among Older Female Cancer Survivors. Cancer Epidemiol. Biomark. Prev. Publ. Am. Assoc. Cancer Res. Cosponsored Am. Soc. Prev. Oncol. 2013, 22, 792–802. [Google Scholar] [CrossRef]
- Chiuve, S.E.; Fung, T.T.; Rimm, E.B.; Hu, F.B.; McCullough, M.L.; Wang, M.; Stampfer, M.J.; Willett, W.C. Alternative Dietary Indices Both Strongly Predict Risk of Chronic Disease. J. Nutr. 2012, 142, 1009–1018. [Google Scholar] [CrossRef]
- Spineli, L.M.; Pandis, N. Prediction Interval in Random-Effects Meta-Analysis. Am. J. Orthod. Dentofacial Orthop. 2020, 157, 586–588. [Google Scholar] [CrossRef]
- Zhu, Y.; Wu, H.; Wang, P.P.; Savas, S.; Woodrow, J.; Wish, T.; Jin, R.; Green, R.; Woods, M.; Roebothan, B.; et al. Dietary Patterns and Colorectal Cancer Recurrence and Survival: A Cohort Study. BMJ Open 2013, 3, e002270. [Google Scholar] [CrossRef]
- Sharma, I.; Roebothan, B.; Zhu, Y.; Woodrow, J.; Parfrey, P.S.; Mclaughlin, J.R.; Wang, P.P. Hypothesis and Data-Driven Dietary Patterns and Colorectal Cancer Survival: Findings from Newfoundland and Labrador Colorectal Cancer Cohort. Nutr. J. 2018, 17, 55. [Google Scholar] [CrossRef]
- Fung, T.T.; Kashambwa, R.; Sato, K.; Chiuve, S.E.; Fuchs, C.S.; Wu, K.; Giovannucci, E.; Ogino, S.; Hu, F.B.; Meyerhardt, J.A. Post Diagnosis Diet Quality and Colorectal Cancer Survival in Women. PLoS ONE 2014, 9, e115377. [Google Scholar] [CrossRef] [PubMed]
- Jacobs, S.; Harmon, B.E.; Ollberding, N.J.; Wilkens, L.R.; Monroe, K.R.; Kolonel, L.N.; Le Marchand, L.; Boushey, C.J.; Maskarinec, G. Among 4 Diet Quality Indexes, Only the Alternate Mediterranean Diet Score Is Associated with Better Colorectal Cancer Survival and Only in African American Women in the Multiethnic Cohort. J. Nutr. 2016, 146, 1746–1755. [Google Scholar] [CrossRef] [PubMed]
- Ratjen, I.; Schafmayer, C.; di Giuseppe, R.; Waniek, S.; Plachta-Danielzik, S.; Koch, M.; Nöthlings, U.; Hampe, J.; Schlesinger, S.; Lieb, W. Postdiagnostic Mediterranean and Healthy Nordic Dietary Patterns Are Inversely Associated with All-Cause Mortality in Long-Term Colorectal Cancer Survivors. J. Nutr. 2017, 147, 636–644. [Google Scholar] [CrossRef] [PubMed]
- Pelser, C.; Arem, H.; Pfeiffer, R.M.; Elena, J.W.; Alfano, C.M.; Hollenbeck, A.R.; Park, Y. Prediagnostic Lifestyle Factors and Survival after Colon and Rectal Cancer Diagnosis in the National Institutes of Health (NIH)-AARP Diet and Health Study. Cancer 2014, 120, 1540–1547. [Google Scholar] [CrossRef]
- Zheng, J.; Tabung, F.K.; Zhang, J.; Murphy, E.A.; Shivappa, N.; Ockene, J.K.; Caan, B.; Kroenke, C.H.; Hébert, J.R.; Steck, S.E. Post-Cancer Diagnosis Dietary Inflammatory Potential Is Associated with Survival among Women Diagnosed with Colorectal Cancer in the Women’s Health Initiative. Eur. J. Nutr. 2020, 59, 965–977. [Google Scholar] [CrossRef]
- Tabung, F.K.; Noonan, A.; Lee, D.H.; Song, M.; Clinton, S.K.; Spakowicz, D.; Wu, K.; Cheng, E.; Meyerhardt, J.A.; Fuchs, C.S.; et al. Post-Diagnosis Dietary Insulinemic Potential and Survival Outcomes among Colorectal Cancer Patients. BMC Cancer 2020, 20, 817. [Google Scholar] [CrossRef]
- Romaguera, D.; Ward, H.; Wark, P.A.; Vergnaud, A.-C.; Peeters, P.H.; van Gils, C.H.; Ferrari, P.; Fedirko, V.; Jenab, M.; Boutron-Ruault, M.-C.; et al. Pre-Diagnostic Concordance with the WCRF/AICR Guidelines and Survival in European Colorectal Cancer Patients: A Cohort Study. BMC Med. 2015, 13, 107. [Google Scholar] [CrossRef] [PubMed]
- Kenfield, S.A.; DuPre, N.; Richman, E.L.; Stampfer, M.J.; Chan, J.M.; Giovannucci, E.L. Mediterranean Diet and Prostate Cancer Risk and Mortality in the Health Professionals Follow-up Study. Eur. Urol. 2014, 65, 887–894. [Google Scholar] [CrossRef]
- Yang, M.; Kenfield, S.A.; Van Blarigan, E.L.; Batista, J.L.; Sesso, H.D.; Ma, J.; Stampfer, M.J.; Chavarro, J.E. Dietary Patterns after Prostate Cancer Diagnosis in Relation to Disease-Specific and Total Mortality. Cancer Prev. Res. 2015, 8, 545–551. [Google Scholar] [CrossRef]
- Zucchetto, A.; Gini, A.; Shivappa, N.; Hébert, J.R.; Stocco, C.; Dal Maso, L.; Birri, S.; Serraino, D.; Polesel, J. Dietary Inflammatory Index and Prostate Cancer Survival. Int. J. Cancer 2016, 139, 2398–2404. [Google Scholar] [CrossRef] [PubMed]
- Arthur, A.E.; Peterson, K.E.; Rozek, L.S.; Taylor, J.M.G.; Light, E.; Chepeha, D.B.; Hébert, J.R.; Terrell, J.E.; Wolf, G.T.; Duffy, S.A.; et al. Pretreatment Dietary Patterns, Weight Status, and Head and Neck Squamous Cell Carcinoma Prognosis. Am. J. Clin. Nutr. 2013, 97, 360–368. [Google Scholar] [CrossRef]
- Crowder, S.L.; Sarma, K.P.; Mondul, A.M.; Chen, Y.T.; Li, Z.; Pepino, M.Y.; Zarins, K.R.; Wolf, G.T.; Rozek, L.S.; Arthur, A.E. Pretreatment Dietary Patterns Are Associated with the Presence of Nutrition Impact Symptoms 1 Year after Diagnosis in Patients with Head and Neck Cancer. Cancer Epidemiol. Biomark. Prev. Publ. Am. Assoc. Cancer Res. Cosponsored Am. Soc. Prev. Oncol. 2019, 28, 1652–1659. [Google Scholar] [CrossRef]
- Thomson, C.A.; Crane, T.E.; Wertheim, B.C.; Neuhouser, M.L.; Li, W.; Snetselaar, L.G.; Basen-Engquist, K.M.; Zhou, Y.; Irwin, M.L. Diet Quality and Survival after Ovarian Cancer: Results from the Women’s Health Initiative. J. Natl. Cancer Inst. 2014, 106, dju314. [Google Scholar] [CrossRef] [PubMed]
- Hansen, J.M.; Nagle, C.M.; Ibiebele, T.I.; Grant, P.T.; Obermair, A.; Friedlander, M.L.; DeFazio, A.; Webb, P.M. Ovarian Cancer Prognosis and Lifestyle Study Group A Healthy Lifestyle and Survival among Women with Ovarian Cancer. Int. J. Cancer 2020, 147, 3361–3369. [Google Scholar] [CrossRef]
- Westhoff, E.; Wu, X.; Kiemeney, L.A.; Lerner, S.P.; Ye, Y.; Huang, M.; Dinney, C.P.; Vrieling, A.; Tu, H. Dietary Patterns and Risk of Recurrence and Progression in Non-Muscle-Invasive Bladder Cancer. Int. J. Cancer 2018, 142, 1797–1804. [Google Scholar] [CrossRef]
- Lee, D.H.; Fung, T.T.; Tabung, F.K.; Marinac, C.R.; Devore, E.E.; Rosner, B.A.; Ghobrial, I.M.; Colditz, G.A.; Giovannucci, E.L.; Birmann, B.M. Prediagnosis Dietary Pattern and Survival in Patients with Multiple Myeloma. Int. J. Cancer 2020, 147, 1823–1830. [Google Scholar] [CrossRef] [PubMed]
- Zick, S.M.; Colacino, J.; Cornellier, M.; Khabir, T.; Surnow, K.; Djuric, Z. Fatigue Reduction Diet in Breast Cancer Survivors: A Pilot Randomized Clinical Trial. Breast Cancer Res. Treat. 2017, 161, 299–310. [Google Scholar] [CrossRef]
- Bourke, L.; Thompson, G.; Gibson, D.J.; Daley, A.; Crank, H.; Adam, I.; Shorthouse, A.; Saxton, J. Pragmatic Lifestyle Intervention in Patients Recovering from Colon Cancer: A Randomized Controlled Pilot Study. Arch. Phys. Med. Rehabil. 2011, 92, 749–755. [Google Scholar] [CrossRef] [PubMed]
- Koutoukidis, D.A.; Beeken, R.J.; Manchanda, R.; Burnell, M.; Ziauddeen, N.; Michalopoulou, M.; Knobf, M.T.; Lanceley, A. Diet, Physical Activity, and Health-Related Outcomes of Endometrial Cancer Survivors in a Behavioral Lifestyle Program: The Diet and Exercise in Uterine Cancer Survivors (DEUS) Parallel Randomized Controlled Pilot Trial. Int. J. Gynecol. Cancer Off. J. Int. Gynecol. Cancer Soc. 2019, 29, 531–540. [Google Scholar] [CrossRef] [PubMed]
- Goodwin, P.J.; Segal, R.J.; Vallis, M.; Ligibel, J.A.; Pond, G.R.; Robidoux, A.; Blackburn, G.L.; Findlay, B.; Gralow, J.R.; Mukherjee, S.; et al. Randomized Trial of a Telephone-Based Weight Loss Intervention in Postmenopausal Women with Breast Cancer Receiving Letrozole: The LISA Trial. J. Clin. Oncol. Off. J. Am. Soc. Clin. Oncol. 2014, 32, 2231–2239. [Google Scholar] [CrossRef]
- Demark-Wahnefried, W.; Colditz, G.A.; Rock, C.L.; Sedjo, R.L.; Liu, J.; Wolin, K.Y.; Krontiras, H.; Byers, T.; Pakiz, B.; Parker, B.A.; et al. Quality of Life Outcomes from the Exercise and Nutrition Enhance Recovery and Good Health for You (ENERGY)-Randomized Weight Loss Trial among Breast Cancer Survivors. Breast Cancer Res. Treat. 2015, 154, 329–337. [Google Scholar] [CrossRef] [PubMed]
- Swisher, A.K.; Abraham, J.; Bonner, D.; Gilleland, D.; Hobbs, G.; Kurian, S.; Yanosik, M.A.; Vona-Davis, L. Exercise and Dietary Advice Intervention for Survivors of Triple-Negative Breast Cancer: Effects on Body Fat, Physical Function, Quality of Life, and Adipokine Profile. Support. Care Cancer Off. J. Multinatl. Assoc. Support. Care Cancer 2015, 23, 2995–3003. [Google Scholar] [CrossRef]
- Scott, E.; Daley, A.J.; Doll, H.; Woodroofe, N.; Coleman, R.E.; Mutrie, N.; Crank, H.; Powers, H.J.; Saxton, J.M. Effects of an Exercise and Hypocaloric Healthy Eating Program on Biomarkers Associated with Long-Term Prognosis after Early-Stage Breast Cancer: A Randomized Controlled Trial. Cancer Causes Control 2013, 24, 181–191. [Google Scholar] [CrossRef]
- Kwiatkowski, F.; Mouret-Reynier, M.-A.; Duclos, M.; Bridon, F.; Hanh, T.; Van Praagh-Doreau, I.; Travade, A.; Vasson, M.-P.; Jouvency, S.; Roques, C.; et al. Long-Term Improvement of Breast Cancer Survivors’ Quality of Life by a 2-Week Group Physical and Educational Intervention: 5-Year Update of the “PACThe” Trial. Br. J. Cancer 2017, 116, 1389–1393. [Google Scholar] [CrossRef]
- Ruiz-Vozmediano, J.; Löhnchen, S.; Jurado, L.; Recio, R.; Rodríguez-Carrillo, A.; López, M.; Mustieles, V.; Expósito, M.; Arroyo-Morales, M.; Fernández, M.F. Influence of a Multidisciplinary Program of Diet, Exercise, and Mindfulness on the Quality of Life of Stage IIA-IIB Breast Cancer Survivors. Integr. Cancer Ther. 2020, 19, 1534735420924757. [Google Scholar] [CrossRef]
- Chlebowski, R.T.; Aragaki, A.K.; Anderson, G.L.; Pan, K.; Neuhouser, M.L.; Manson, J.E.; Thomson, C.A.; Mossavar-Rahmani, Y.; Lane, D.S.; Johnson, K.C.; et al. Dietary Modification and Breast Cancer Mortality: Long-Term Follow-Up of the Women’s Health Initiative Randomized Trial. J. Clin. Oncol. Off. J. Am. Soc. Clin. Oncol. 2020, 38, 1419–1428. [Google Scholar] [CrossRef]
- Yun, Y.H.; Kim, Y.A.; Lee, M.K.; Sim, J.A.; Nam, B.-H.; Kim, S.; Lee, E.S.; Noh, D.-Y.; Lim, J.-Y.; Kim, S.; et al. A Randomized Controlled Trial of Physical Activity, Dietary Habit, and Distress Management with the Leadership and Coaching for Health (LEACH) Program for Disease-Free Cancer Survivors. BMC Cancer 2017, 17, 298. [Google Scholar] [CrossRef]
- Ho, M.; Ho, J.W.C.; Fong, D.Y.T.; Lee, C.F.; Macfarlane, D.J.; Cerin, E.; Lee, A.M.; Leung, S.; Chan, W.Y.Y.; Leung, I.P.F.; et al. Effects of Dietary and Physical Activity Interventions on Generic and Cancer-Specific Health-Related Quality of Life, Anxiety, and Depression in Colorectal Cancer Survivors: A Randomized Controlled Trial. J. Cancer Surviv. 2020, 14, 424–433. [Google Scholar] [CrossRef] [PubMed]
- Bonelli, L.; Puntoni, M.; Gatteschi, B.; Massa, P.; Missale, G.; Munizzi, F.; Turbino, L.; Villanacci, V.; De Censi, A.; Bruzzi, P. Antioxidant Supplement and Long-Term Reduction of Recurrent Adenomas of the Large Bowel. A Double-Blind Randomized Trial. J. Gastroenterol. 2013, 48, 698–705. [Google Scholar] [CrossRef]
- Parsons, J.K.; Zahrieh, D.; Mohler, J.L.; Paskett, E.; Hansel, D.E.; Kibel, A.S.; Liu, H.; Seisler, D.K.; Natarajan, L.; White, M.; et al. Effect of a Behavioral Intervention to Increase Vegetable Consumption on Cancer Progression Among Men With Early-Stage Prostate Cancer: The MEAL Randomized Clinical Trial. JAMA 2020, 323, 140–148. [Google Scholar] [CrossRef] [PubMed]
- George, S.M.; Neuhouser, M.L.; Mayne, S.T.; Irwin, M.L.; Albanes, D.; Gail, M.H.; Alfano, C.M.; Bernstein, L.; McTiernan, A.; Reedy, J.; et al. Postdiagnosis Diet Quality Is Inversely Related to a Biomarker of Inflammation among Breast Cancer Survivors. Cancer Epidemiol. Biomark. Prev. Publ. Am. Assoc. Cancer Res. Cosponsored Am. Soc. Prev. Oncol. 2010, 19, 2220–2228. [Google Scholar] [CrossRef] [PubMed]
- Bouvard, V.; Loomis, D.; Guyton, K.Z.; Grosse, Y.; Ghissassi, F.E.; Benbrahim-Tallaa, L.; Guha, N.; Mattock, H.; Straif, K. International Agency for Research on Cancer Monograph Working Group Carcinogenicity of Consumption of Red and Processed Meat. Lancet Oncol. 2015, 16, 1599–1600. [Google Scholar] [CrossRef]
- McMillan, D.C. The Systemic Inflammation-Based Glasgow Prognostic Score: A Decade of Experience in Patients with Cancer. Cancer Treat. Rev. 2013, 39, 534–540. [Google Scholar] [CrossRef]
- Agudo, A.; Cayssials, V.; Bonet, C.; Tjønneland, A.; Overvad, K.; Boutron-Ruault, M.-C.; Affret, A.; Fagherazzi, G.; Katzke, V.; Schübel, R.; et al. Inflammatory Potential of the Diet and Risk of Gastric Cancer in the European Prospective Investigation into Cancer and Nutrition (EPIC) Study. Am. J. Clin. Nutr. 2018, 107, 607–616. [Google Scholar] [CrossRef]
- Buckland, G.; Travier, N.; Arribas, L.; Del Barco, S.; Pernas, S.; Zamora, E.; Bellet, M.; Cirauqui, B.; Margelí, M.; Muñoz, M.; et al. Changes in Dietary Intake, Plasma Carotenoids and Erythrocyte Membrane Fatty Acids in Breast Cancer Survivors after a Lifestyle Intervention: Results from a Single-Arm Trial. J. Hum. Nutr. Diet. Off. J. Br. Diet. Assoc. 2019, 32, 468–479. [Google Scholar] [CrossRef]
- Guinter, M.A.; McLain, A.C.; Merchant, A.T.; Sandler, D.P.; Steck, S.E. A Dietary Pattern Based on Estrogen Metabolism Is Associated with Breast Cancer Risk in a Prospective Cohort of Postmenopausal Women. Int. J. Cancer 2018, 143, 580–590. [Google Scholar] [CrossRef] [PubMed]
- Tabung, F.K.; Wang, W.; Fung, T.T.; Hu, F.B.; Smith-Warner, S.A.; Chavarro, J.E.; Fuchs, C.S.; Willett, W.C.; Giovannucci, E.L. Development and Validation of Empirical Indices to Assess the Insulinemic Potential of Diet and Lifestyle. Br. J. Nutr. 2016, 116, 1787–1798. [Google Scholar] [CrossRef] [PubMed]
- Ligibel, J.A.; Alfano, C.M.; Hershman, D.; Ballard, R.M.; Bruinooge, S.S.; Courneya, K.S.; Daniels, E.C.; Demark-Wahnefried, W.; Frank, E.S.; Goodwin, P.J.; et al. Recommendations for Obesity Clinical Trials in Cancer Survivors: American Society of Clinical Oncology Statement. J. Clin. Oncol. 2015, 33, 3961–3967. [Google Scholar] [CrossRef] [PubMed]


| Author, Year | Country | Population, Cohort | Dietary Assessment | Dietary Patterns | Outcomes | Results—Multivariate Adjusted RR/HR(95% CI) | Observations |
|---|---|---|---|---|---|---|---|
| Several tumour sites | |||||||
| Inoue-Choi, 2013 | USA | IWHS, 2017 cancer cases: breast (n = 938), colorectal (n = 380), gynaecologic (n = 262) and other cancer (n = 437), mean age 78.9 years, mean follow-up 5.4 years. | Post-diagnostic 127-items FFQ. | WCRF/AICR guidelines scores. | All-cause mortality, cancer-specific mortality, CVD-specific mortality. | Q4 vs. Q1. All survivors: All-cause mortality: HR = 0.67 (0.49–0.90), p-trend = 0.03; Cancer-specific mortality HR = 0.63 (0.39–1.04), p-trend = 0.21; CVD-specific mortality: HR = 0.92 (0.57–1.47), p-trend = 0.40. Gynaecological cancers: All-cause mortality: HR = 0.96 (0.34–2.69), p-trend = 0.94; Gynaecological cancer-specific mortality: NA; CVD-specific mortality: HR = 1.05 (0.27–4.15), p-trend = 0.83. Other cancer: All-cause mortality: HR = 0.55 (0.30–1.01), p-trend = 0.12. | Gynaecology included cervical, endometrial, ovarian and other female genital organ cancers. ‘Other cancer’ category was not further defined. Models adjusted for age, total number of comorbid conditions (accumulated, 1986–2004), perceived general health and current smoking, cancer stage, cancer type, cancer treatment (surgery, chemotherapy), subsequent cancer diagnosis before 2004, current cancer treatment and person-years since cancer diagnosis. Mean time since cancer diagnosis is 8.6 years (SD = 4.8 years). |
| Karavasiloglou, 2019 | USA | 120 gynaecological cancers: ovarian (n = 19), cervical (n = 54), and uterine cancer (n = 47), NHANES III, mean follow-up 12.4 years. | Post-diagnostic 24-h dietary recall. | HEI and MDS. | All-cause mortality. | By 1-unit increase, HEI: HR = 0.92 (0.89–0.96). MDS: HR = 0.77 (0.57–1.04). Good (≥70) vs. Poor (<70) HEI: 0.20 (0.10–0.43). Adherers (5–9) vs. Non-adherers (0–4) MDS: HR = 0.49 (0.18–1.37). | Usual variables of adjustment; alcohol was not included in the adjustment of the MDS model (it is one of the MDS items). Information regarding disease severity or treatment was not available. Important: mean time between diagnosis and completion of the questionnaire is 10.4 years; therefore, these associations refer to long-term survivors. |
| Breast cancer (BC) | |||||||
| Kim, 2011 | USA | 2729 postmenopausal BC stage I-III), NHS study, follow-up 6 years. | Pre- and post-diagnosis FFQ every 4 years (initially 61-items, until 130-items). | Diet quality indices: AHEI, DQIR, RFS, aMED | All-cause mortality, BC-specific mortality and non-BC mortality, BC-recurrence | Q5 vs. Q1 (post-diagnostic diet): All-cause mortality: HEI, RR = 0.85 (0.63–1.17); DQIR, RR = 0.78 (0.58–1.07); RFS, RR = 1.03 (0.74–1.42); aMED, RR = 0.87 (0.64, 1.17). BC-specific mortality: RFS, RR = 1.54 (0.95–2.47) p-trend = 0.02. Distant recurrences: RFS, RR = 1.45 (0.94–2.23) p-trend = 0.001. Pre-diagnostic diet quality indices were not associated with outcomes. | For pre-diagnosis diet, diet quality indices based on a single dietary questionnaire were not associated with total mortality, breast cancer mortality, distant recurrences or non-breast cancer mortality (data not reported). Adjustment for relevant variables. |
| George, 2011 | Mexico, USA | HEAL Study; 670 local or regional BC survivors, follow-up 6 years. | Post-diagnostic 122-items self-administered FFQ 6 and 30-month. | HEI-2005. | All-cause and BC-specific mortality. | Q4 vs. Q1: all-cause mortality HR = 0.40 (0.17–0.94), BC-specific mortality HR = 0.12 (0.02–0.99). All-cause mortality in active-higher HEI-2005 vs. inactive-lowest HEI-2005: HR = 0.11 (0.04–0.36); BC-specific mortality in active-higher vs. inactive-lowest HEI-2005: HR = 0.09 (0.01–0.89). | Adjusted for energy, physical activity, race, stage and tamoxifen use. |
| Vrieling, 2013 | Germany | 2522 postmenopausal BC stage I–IV, median follow-up 5.5 years, MARIE study. | 1-year pre-diagnostic 176-item FFQ. | Dietary patterns: ‘healthy’ and ‘unhealthy’; defined by principal components and factor analysis. | Overall mortality, BC-specific and non-BC mortality; recurrence of breast cancer. | Q4 vs. Q1 ‘unhealthy’ pattern: HR = 3.69 (1.66–8.17) p-trend < 0.001 (non-BC mortality), HR = 1.34 (0.93–1.94) p-trend = 0.03 (overall mortality), HR = 0.99 (0.64–1.52) p-trend = 0.59 (BC-mortality). Within cases stage I-IIIa, ‘healthy’ pattern HR = 0.74 (0.47–1.15) p-trend = 0.02 (overall mortality), HR = 0.71 (0.48–1.06) p-trend = 0.02 (recurrence). | BMI and physical activity not included in multivariate models. |
| Inoue-Choi, 2013 | USA | IWHS, 938 BC cases. | Post-diagnostic 127-items FFQ. | WCRF/AICR guidelines scores. | all-cause mortality, BC-specific mortality, CVD-specific mortality | Q4 vs. Q1. All-cause mortality: HR = 0.61 (0.39–0.96), p-trend = 0.01. BC-specific mortality: HR = 0.88 (0.41–1.91), p-trend = 0.65. CVD-specific mortality: HR = 0.67 (0.33–1.37), p-trend = 0.10. | Models adjusted for age, total number of comorbid conditions (accumulated, 1986–2004), perceived general health and current smoking, cancer stage, cancer type, cancer treatment (surgery, chemotherapy), subsequent cancer diagnosis before 2004, current cancer treatment and person-years since cancer diagnosis. No data on cancer stage, mean age of cases and mean/median follow-up time. See note in ‘Several tumour sites’ section for this article. |
| Izano, 2013 | USA | NHS, 4103 BC cases stages I-III, median follow-up 9.3 years. | At least 12 months after diagnostic, FFQ | DASH, AHEI-2010. | Primary: BC-mortality; Secondary: distant BC recurrence, non-BC mortality, total mortality. | Q5 vs. Q1 dietary pattern; BC mortality, DASH RR = 0.85 (0.61–1.19) p-trend = 0.47; AHEI-2010 RR =1.07 (0.77–1.49) p-trend = 0.95. Non-BC mortality, DASH RR = 0.72 (0.53–0.99) p-trend = 0.03; AHEI-2010 RR = 0.57 (0.42–0.77) p-trend < 0.0001. | No association with BC recurrence (data not shown) in multivariate models. Results for total mortality (one of the secondary endpoints) not reported, only mentioned in methods. Adjustment: age at diagnosis, energy intake, BMI, smoking and physical activity. |
| George, 2014 | USA | 2317 postmenopausal women invasive BC (localised, regional, distant, unknown), (50–79 years), WHI Dietary Modification Trial (n = 1205) and Observational Study (n = 1112), follow-up 9.6 years. | Post-diagnostic, self-administered FFQ at baseline and at 3-year of follow-up. | HEI-2005 scores. | All-cause and cause-specific mortality. | Q4 vs. Q1 HEI score; all-cause mortality HR = 0.74 (0.55–0.99) p-trend = 0.04; non-BC mortality HR = 0.58 (0.38–0.87) p-trend = 0.01; BC mortality HR = 0.91 (0.60–1.40) p-trend = 0.63. | Multivariate model not adjusted for BMI and smoking status. Further adjustment for BMI did not modify HRs (data not reported). |
| McCullough, 2016 | USA | 4452 cases (40–93 years), CPS-II Nutrition Cohort, mean follow-up 9.8 years. | Pre- and post-diagnostic 68-item Block FFQ (baseline), 152-item Harvard FFQ twice during follow-up. | Dietary pattern scores based on ACS dietary guidelines. | All-cause mortality and deaths from BC, non-BC and CVD. | Highest vs. Lowest post-diagnostic dietary pattern: BC-mortality RR = 1.44 (0.90–2.30); CVD mortality RR = 0.81 (0.47–1.39); Non-BC mortality RR = 0.78 (0.56–1.07) p-trend = 0.03 & per 2-point increase RR = 0.88 (0.79–0.99). Pre-diagnostic diet score was not associated with all-cause mortality. | Adjustment for usual variables; alcohol not included in the final model since it did not change the estimated RRs. |
| Jang, 2018 | Korea | 511 cases (mean age 51.9 years), mean follow-up 69 months, Hanyang University Seoul Hospital. | Post-diagnostic 24-h diet recall. | DII (34 items). | BC recurrence and overall mortality. | Q4 vs. Q1; BC recurrence HR = 2.3 (1.17–4.71) p-trend = 0.019; overall mortality HR = 3.0 (1.08–8.83) p-trend = 0.041. | Not adjusted for physical activity, alcohol and smoking status. Associations were also significant among women < 50 y, premenopausal, BMI ≥ 25 kg/m2, HR+ tumours, tumour size > 2 cm and lymph node metastasis (strata of prognostic factors). |
| Sun, 2018 | USA | 2295 postmenopausal women (50–79 years at recruitment), invasive BC, 12 years follow-up, WHI study. | Pre- and post-diagnostic FFQ, HEI-2010 based on 12 components. | HEI-2010 score. | All-cause mortality, BC-mortality, non-BC mortality. | Compared with women with stable diet quality, women who decreased ≥15% HEI-2010, HR = 1.66 (1.09–2.52) for BC-mortality. Women who increased ≥15% HEI-2010 vs. stable diet quality HR = 1.00 (0.81–1.23) for all-cause mortality, HR = 0.98 (0.67–1.44) for BC-mortality and HR = 0.96 (0.74–1.23) for other causes. | Adjustment for relevant variables. |
| Zheng, 2018 | USA | 2150 postmenopausal women (age 50–79 years), 13.3 years follow-up, WHI. | 1.5 years post-diagnostic: FFQ 120-items plus other related questions. | E-DII (32 components). | All-cause, BC-specific, and CVD mortality. | Q1 vs. Q4 E-DII; HR = 0.96 (0.62–1.49) p-trend = 0.96 (BC mortality); HR = 0.82 (0.63–1.05) p-trend = 0.17 (all-cause mortality); HR = 0.44 (0.24–0.82) p-trend = 0.005 (CVD mortality). | Adjustment for usual variables except for alcohol (probably because alcohol is one of the DII’s items). Stratified analyses for hormonal receptors (ER, PR and combined ER-PR status) with no significant interactions. |
| Karavasiloglou, 2019 | USA | 110 women, NHANES III, mean follow-up 8.6 years. | Post-diagnostic 24-h dietary recall. | HEI, MDS. | All-cause mortality. | By 1-unit increase, HEI: HR = 0.97 (0.95–0.99); MDS: HR = 0.97 (0.82–1.16). Good (≥70) vs. Poor (<70) HEI: 0.49 (0.25–0.97). Adherers (5–9) vs. Non-adherers (0–4) MDS: HR = 0.78 (0.47–1.32). | Usual variables of adjustment; alcohol was not included in the adjustment of the MDS model (it is one of the MDS items). Information regarding disease severity or treatment was not available. See note in ‘Several tumour sites’ section for this article. |
| Wang, 2020 | China | 3450 cases stage I-IV, SBCSS, follow-up time 8 years. | Post-diagnostic: 93-item semi-quantitative FFQ at 5 years. | CHFP-2007, CHFP-2016, modified DASH, HEI-2015. | All-cause mortality, BC-specific mortality, BC-specific events. | Q1 vs. Q4 dietary pattern; all-cause mortality: CHFP-2007 HR = 0.66 (0.48–0.89), CHFP-2016 HR = 0.75 (0.55–1.01), DASH HR = 0.66 (0.49–0.91). BC-specific events: CHFP-2007 HR = 0.64 (0.44–0.93), CHFP-2016 HR = 0.67 (0.45–0.99), DASH HR = 0.60 (0.40–0.90). Similar association patterns observed for BC-specific mortality. | BC-specific events defined as recurrence or metastasis of BC and deaths from BC. Usual variables of adjustment except for alcohol (not included). Information on outcomes collected during the 10-year post-diagnosis by means on in-person survey. |
| Wang, 2021 | USA | 8482 BC cases stage I-III, median follow-up 14 years, NHS and NHSII. | Post-diagnostic semi-quantitative FFQ every 4 years. | DRRD (9 components). | All-cause mortality, BC-specific mortality. | Q5 vs. Q1 DRRD; BC-mortality: HR = 0.80 (0.65–0.97) p-trend = 0.02; all-cause mortality HR = 0.66 (0.58–0.76) p-trend < 0.0001. Compared with lower score (≤median) before & after diagnosis, women whose score improved from low to high: HR = 0.77 (0.62–0.95) for BC-specific mortality; HR = 0.85 (0.74–0.97) for overall mortality. | Multivariate model adjusted for key confounders. Included change in BMI from pre- to post-diagnostic in adjustments. |
| Colorectal cancer (CRC) | |||||||
| Inoue-Choi, 2013 | USA | IWHS, 380 CRC cases, older female survivors (no age specified). | Post-diagnostic 127-items FFQ. | WCRF/AICR guidelines scores. | All-cause mortality, CRC-specific mortality. | Q4 vs. Q1. All-cause mortality: HR = 1.19 (0.59–2.43), p-trend = 0.64. CRC-specific mortality: HR = 1.16 (0.33–4.12), p-trend = 0.84. CVD-specific mortality: HR = 2.61 (0.78–8.71), p-trend = 0.19. | Models adjusted for age, total number of comorbid conditions (accumulated, 1986–2004), perceived general health and current smoking, cancer stage, cancer type, cancer treatment (surgery, chemotherapy), subsequent cancer diagnosis before 2004, current cancer treatment and person-years since cancer diagnosis. No data on cancer stage, mean age of cases and mean/median follow-up time. See note in ‘Several tumour sites’ section for this article. |
| Zhu, 2013 | Canada | 529 invasive CRC, Newfoundland Familial Colorectal Cancer Registry, median follow-up 6.4 years. | Pre-diagnostic semi-quantitative 170-items FFQ (including vitamin and dietary supplements). Principal factor analysis (39 food groups). | Dietary patterns extracted: ‘processed meat pattern’, ‘prudent vegetable pattern’ and ‘high-sugar pattern’. | Disease-free survival (DFS) and overall survival (OS). | Q4 vs. Q1: processed meat pattern CRC HR = 1.82 (1.07–3.09), p-trend = 0.09 for DFS. Colon HR = 2.29 (1.19–4.40) & rectum HR = 0.97 (0.38–2.45) for DFS. Colon HR = 2.13 (1.03–4.43) for OS. | Physical activity, alcohol and smoking status not included in the adjustment. |
| Pelser, 2014 | USA | NIH-AARP Diet and Health study, 4213 colon and 1514 rectal cancer cases, 5 years follow-up. | Pre-diagnostic 124-item FFQ. | HEI-2005. | All-cause, CRC-mortality and CVD-mortality. | Q5 vs. Q1; Colon cancer: all-cause mortality: RR = 0.95 (0.78–1.16), p-trend = 0.22; CRC-mortality RR = 0.99 (0.77–1.27), p-trend = 0.41; CVD-mortality RR = 0.45 (0.23–0.87), p-trend = 0.01. Rectal cancer: all-cause mortality: RR = 0.60 (0.42–0.86), p-trend = 0.04; CRC-mortality RR = 0.64 (0.41–0.99), p-trend = 0.05; CVD-mortality RR = 0.28 (0.06–1.43). | Variables of adjustment usually used except for socioeconomic status. |
| Fung, 2014 | USA | 1201 stage I–III CRC cases (women only), median follow-up 11.2 years, NHS. | Post-diagnostic: FFQ at least 6 months after diagnostic; principal component analysis. | AHEI-2010, aMED and DASH and 2 derived dietary patterns: western and prudent diet. | Overall and CRC-specific mortality. | Q5 vs. Q1; AHEI-2010: Overall mortality: HR = 0.71 (0.52–0.98), p-trend = 0.01; CRC mortality: HR = 0.72 (0.43–1.21), p-trend = 0.07. | No other diet quality score or dietary pattern was associated with overall or CRC-specific mortality. |
| Romaguera, 2015 | Europe (10 countries) | EPIC, 3292 CRC cases, mean follow-up 4.2 years. | Pre-diagnostic country-specific validated dietary questionnaires and standardised EPIC Nutrient Data Base. | WCRF/AICR guidelines. Score range 0–6 in men, 0–7 in women; higher scores: greater adherence. | CRC-specific and overall mortality. | CRC-specific mortality: 2nd, 3rd and 4th concordance with recommendations vs. lowest concordance: HR2nd = 0.87 (0.72–1.06), HR3rd = 0.74 (0.61–0.90), HR4th = 0.70 (0.56–0.89); p-trend < 0.0001. Similar results for overall survival (p-trend 0.004). | Adjusted by usual variables including smoking. Body fatness, PA and alcohol were part of the WCRF score, so these were not included in the adjustment. |
| Jacobs, 2016 | USA | MEC study, 4204 cases (men and women aged 45–75 years), stage: localised, regional, distant or unknown, mean follow-up 6.0 years. | Pre-diagnostic FFQ (>180 food items). | 4 diet quality indexes: HEI-2010, AHEI-2010, aMED and DASH. | CRC-specific and all-cause mortality. | African-American women: aMED, CRC-specific mortality: HR1SD = 0.86 (0.77–0.96); aMED, all-cause mortality: HR1SD = 0.88 (0.81–0.96). No significant for men in either case. HEI-2010, AHEI-2010, and DASH no significantly associated with CRC-specific or all-cause mortality. | Usual variables of adjustment used except for alcohol since it is part of some scores. |
| Yuan, 2017 | USA | 2006 cases from 2 cohorts: NHS, and HPFS, 12.7 years median follow-up | Post-diagnostic FFQ every 4 years | Two dietary insulin (DI) scores: DI-index and DI-load. | CRC-specific mortality and overall mortality. | Q5 vs. Q1. CRC-specific mortality: DI-load HR = 1.82 (1.20–2.75), p-trend = 0.006 & DI-index HR = 1.66 (1.10–2.50), p-trend = 0.004. Overall mortality: HR = 1.33 (1.03–1.72), p-trend = 0.03 for DI-load & HR = 1.32 (1.02–1.71), p-trend = 0.02 for DI-index. In BMI ≥ 25 HR = 2.32 (1.21–4.46) for higher DI-index; BMI ≥ 25 kg vs. BMI < 25 (p-interaction = 0.01). | Usual variables of adjustment used (BMI, PA, alcohol, smoking status). |
| Ratjen, 2017 | Northern Germany | 1404 CRC cases, median follow-up 7 years, median age 69 years, 56% men, PopGen biobank. | Post-diagnostic, 112-item semi-quantitative FFQ. | Two a priori-defined dietary patterns: MMDS and HNFI. | All-cause mortality. | MMDS: HRQ4-Q1 = 0.48 (0.32–0.74) & HR1-point increment = 0.88 (0.81–0.96), p-trend = 0.003. HNFI: HRQ4-Q1 = 0.63 (0.39–1.04) and HR1-point increment = 0.90 (0.82–0.99), p-trend = 0.04. | Usual variables of adjustment used. No information available for CRC-specific mortality. |
| Sharma, 2018 | Canada | 532 CRC (mean age 60 years), mean follow-up 6.27 years, Newfoundland Familial Colorectal Cancer Registry (NFCCR). | Pre-diagnostic 169-item FFQ. | Cluster Analysis (CA), Principal Component Analysis (PCA), altMED, RFS and DII scores. | Overall mortality (OM) and combined Mortality, Recurrence or Metastasis (cMRM). | For cMRM: PCA-processed meats HR = 1.82 (1.07–3.09); CA-meat & dairy products HR = 2.19 (1.03–4.67); CA-total grains, sugar, soft drinks HR = 1.95 (1.13–3.37). For OM: Poor adherence aMED HR = 1.62 (1.04–2.56). No association with OM/cMRM with prudent vegetable, high sugar pattern, RFS and DII. | Usual variables of adjustment used. |
| Zheng, 2020 | USA | WHI, 463 CRC cases postmenopausal women (aged 50–79 years), 11.6 years follow-up | Post-diagnostic FFQ (number of items not reported). | E-DII (31 components); DII calculated from diet plus supplements and from diet only. | All-cause, total cancer, and CRC-specific mortality. | T1 vs.T3: E-DII (diet + supplements) HR = 0.49 (0.31–0.79) for all-cause mortality; HR = 0.57 (0.29–1.10) for total cancer mortality; HR = 0.58 (0.28–1.22) for CRC-specific mortality. E-DII (diet only) HR = 0.72 (0.46–1.12) for all-cause mortality. | Most pro-inflammatory E-DII (T3) as ref. E-DII score from diet plus supplements and from diet only were both examined. Models not adjusted for alcohol consumption probably because alcohol is one of the items of DII. |
| Tabung, 2020 | USA | 1718 stage I–III CRC, NHS and HPFS cohorts, follow-up 9.9 years. | Pre- and post-diagnostic FFQ (number of items not reported). | EDIH score. | CRC-specific mortality and all-cause mortality. | Q5 vs. Q1; Pre-diagnostic EDIH: HR = 1.66 (1.03–2.69) for CRC-mortality & HR = 1.24 (0.97–1.58) for all-cause mortality. Higher EDIH pre- & post-diagnostic HR = 1.51 (0.98–2.32) for CRC-mortality & HR = 1.31 (1.04, 1.64) for all-cause mortality. | Usual variables of adjustment used. |
| Prostate cancer (PC) | |||||||
| Kenfied, 2014 | USA | 4538 non-metastatic PC, HPFS, median follow-up (8.9 years for lethal and 9.1 years for fatal outcomes). | Post-diagnostic 130-items FFQ. | Med-Diet adherence. | PC-specific and overall mortality. | High vs. low adherence: HR = 0.98 (0.75–1.29) for lethal disease; HE = 1.01 (0.75–1.38) for fatal disease; HR = 0.78 (0.67–0.90), p-trend = 0.0007 for overall survival. | Assessed traditional and alternative Mediterranean diet pattern. Usual variables of adjustment used. |
| Yang M, 2015 | USA | 926 cases non-metastatic PC, PHS I or II, follow-up median 13.8 years. | Post-diagnostic FFQ (number of items not reported). | Prudent and Western pattern. | PC-specific and overall mortality. | Q4 vs. Q1: Western HR = 2.53 (1.00–6.42), p-trend = 0.02 for PC-mortality & HR = 1.67 (1.16–2.42), p-trend = 0.01 for all-cause mortality. Prudent HR = 0.64 (0.44–0.93) p-trend = 0.02 for all cause-mortality. | Usual variables of adjustment used. |
| Zucchetto, 2016 | Italy | 726 cases (median age 66 years), median follow-up 12.7 years, cohort study from a case-control study. | Pre-diagnostic 78-items + common Italian recipes FFQ. | DII (31 items). | All-cause and PC-specific survival. | T3 vs.T1: DII HR = 1.25 (0.86–1.83) for all-cause mortality. Heterogeneity to Gleason score p < 0.01. Gleason score 7–10 Pca, DII HR= 2.78 (1.41–5.48) for all-cause & HR = 4.01 (1.25–12.86) for PC-specific mortality. | Model adjusted for area of residence, calendar period of diagnosis, age at diagnosis, education, smoking habits, abdominal obesity, alcohol intake and energy intake. |
| Head and Neck cancer | |||||||
| Arthur, 2013 | USA | 542 cases head and neck squamous cell carcinoma (HNSCC); mean age 59 years, mean follow-up ~6 years. | Pre-treatment self-administered, semi quantitative Harvard FFQ (131-item); principal component analysis. | Two dietary patterns: whole-foods pattern, western pattern. | Recurrence and all-cause survival. | Most adherence to the whole-foods pattern HRQ5vsQ1= 0.56 (0.34–0.92), p-trend = 0.01. | Limitation: the heterogeneous nature of the study population regarding tumour site. Multivariate models adjusted for age, sex, tumour site, cancer stage, treatment, ACE-27 comorbidities, smoking, BMI and total energy intake. |
| Crowder, 2019 | USA | 336 cases, University of Michigan Head and Neck Specialised Program of Research Excellence, follow-up 1 year. | Pre-treatment self-administered 2007 Harvard FFQ. | Principal component analysis, 2 dietary patterns: prudent and western. | Nutrition impact symptoms (NIS) 1-year post-diagnostic: difficulty chewing, dysphagia-liquids, dysphagia-solids foods, mucositis. | Prudent pattern: difficulty chewing OR = 0.44 (0.21–0.93), p-trend = 0.03; dysphagia liquids OR = 0.38 (0.18–0.79), p-trend = 0.009; dysphagia solid foods OR = 0.46 (0.22–0.96), p-trend = 0.03; mucositis OR = 0.48 (0.24–0.96), p-trend = 0.03, NIS summary score OR = 0.45 (0.22–0.94), p-trend = 0.03. | NIS were measured using the UM Head and Neck Quality of Life questionnaire. Final multivariable models not adjusted for PA or alcohol. |
| Ovarian cancer (OC) | |||||||
| Thomson, 2014 | USA | 636 cases (postmenopausal, mean age 63 years), WHI, follow-up time not found or not clear. | Pre-diagnostic FFQ (number of items unknown). | HEI-2005 score. | Overall and OC-specific mortality. | For all-cause mortality: HEI-2005 HRT3-T1 = 0.73 (0.55–0.97), p-trend = 0.03. For OC-mortality: HEI-2005 HRT3-T1 = 0.75 (0.55–1.01), p-trend = 0.06. Women with waist ≤88 cm and no history of diabetes: HR = 0.73 (0.54–0.98). | No adjustments for smoking status, alcohol and BMI. |
| Hansen, 2020 | Australia | OPAL study, 958 cases before diagnosis (n = 678) median follow-up 3.9 years and post-diagnosis (n = 512), median follow-up 3.5 years. | Collected at baseline, 12 and 24 months using a validated semi quantitative FFQ. | Pre- and post-diagnostic Healthy lifestyle index (HLI): including smoking status, physical activity, BMI, alcohol, diet quality score. | Overall survival. | HLI pre-diagnostic: HR most vs. least healthy HR = 0.79 (0.59–1.04). HLI Post-diagnosis most vs. least healthy HR = 0.61 (0.40–0.93). Diet quality score Pre-diagnostic HRT3-T1 = 0.99 (0.76–1.31) p-trend = 0.9. Post-diagnostic diet quality score HRT3-T1 (best quality vs. worst) = 1.01 (0.63–1.60), p-trend = 0.9. | Pre-diagnostic models: adjusted for age, education and comorbidities. Post-diagnostic models: adjusted for age, education, comorbidities, stage of disease at diagnosis, histological subgroup and residual disease remaining after surgery. Diet quality score based on WCRF/AICR guidelines (excluding alcohol). |
| Bladder cancer | |||||||
| Westhoff, 2018 | USA | 595 non-muscle-invasive cancer (non-Hispanic white), University of Texas M.D. Anderson Cancer Center, Scott Department of Urology, median follow-up 65.7 months. | Pre-diagnostic semi-quantitative 181-items FFQ, exploratory factor analysis (included 135 items). | 4 dietary patterns derived: fruits and vegetables, western, low-fat, and Tex-Mex. | Recurrence or progression to muscle-invasive bladder cancer or metastatic tumours. | T3 vs. T1; Recurrence, Western HR = 1.48 (1.06–2.06), p-trend = 0.03. Progression, Western HR = 1.56 (0.91–2.65) p-trend = 0.10. No significant associations with risk of recurrence or progression found for the other patterns. | Models adjusted for age, sex, education, income, BMI, smoking status and intensity, total energy intake, grade, tumour multiplicity, concomitant carcinoma in situ and treatment. |
| Multiple myeloma | |||||||
| Lee, 2020 | USA | 423 cases (mean age 70–72 years women-men), NHS and HPFS, follow-up median 3.5 years. | Pre-diagnostic 130-items FFQ. | AHEI-2010, aMED, DASH, Prudent, Western and EDIR/EDIP/EDIH. | Multiple myeloma-specific mortality, all-cause mortality. | 1-SD increase; Specific mortality: AHEI-2010 HR = 0.76 (0.67–0.87), p < 0.001; aMED HR = 0.85 (0.75–0.97), p = 0.01; DASH HR = 0.85 (0.76–0.95), p = 0.006; Prudent pattern HR = 0.76 (0.66–0.87), p < 0.001; Western pattern HR = 1.24 (1.07–1.44), p = 0.005; EDIR HR = 1.16 (1.02–1.33), p = 0.03; EDIH HR = 1.17 (1.01–1.35), p = 0.03. Similar results for all-cause mortality. | No adjustments for smoking status, alcohol and physical activity. |
| Author, Year | Country | Population (Clinical Features, Sample Size, Age, Follow-Up) | Intervention Description | Outcome (Primary, Secondary) | QoL Assessment | Results: Effect Parameter (CI or p-Value) | Observations |
|---|---|---|---|---|---|---|---|
| Several cancers | |||||||
| Yun, 2017 | South Korea | Cancer survivors who had completed primary cancer treatment within the last 18–24 months. 248 participants randomised: 88 allocated to usual care, 166 to intervention. | LEACH program: first 1-h health education workshop (physical activity, dietary habits, and distress management) and a 3-h leadership workshop. Next individual coaching by telephone for a 24-week period; overall 16 sessions of tele-coaching were conducted: 30 min per week for 12 sessions, 30 min per 2 weeks for 2 sessions and 30 min per month for 2 sessions. Total duration: 1 year. | Primary: changes in physical activity, diet and in PTGI. Secondary: quality of life (QoL). | HADS, EORTC QLQ-C30. | Assessment at 12-month, adjusted means intervention group vs. control group (p-value): PTGI: 66.3 vs. 61.2 (p = 0.065). HADS: 5.2 vs. 5.7 (p = 0.23). EORTC (global health): 69.0 vs. 66.0 (p = 0.27). EORTC (fatigue): 34.8 vs. 41.9 (p = 0.01). | Included in situ, localised or regional with a favourable prognosis of cancers of the breast, stomach, colon and lung. The assessment at 12-months was carried out over 72 subjects (control group) and 134 (intervention group). |
| Breast cancer (BC) | |||||||
| Scott, 2013 | UK | 90 women with early stage cancer (stage I–III), treated within the previous 3–18 months; mean age 56 years. 47 intervention, 43 controls; completed assessment at 6-month: 41 and 48. | 6-month lifestyle intervention: exercise + hypocaloric healthy eating program: 3 supervised exercise sessions/week and individualised dietary advice + weekly nutrition seminars. Diet sessions: information on portion sizes from common foods and healthy eating plan. Goal: to reduce 600 kcal of daily calorie intake of their calculated energy requirements. | Primary: body weight, body composition. Secondary: quality of life (QoL). | FACT-B assessed at baseline and at 6-month. | FACT-B QoL: significant improvement in the intervention group: >6 points (p = 0.004) in FACT-B score and >2 points (p = 0.007) in the breast cancer subscale. Moreover, reduction in the intervention group of waist circumference (p < 0.001) and waist-to-hip ratio (p < 0.005). | |
| Goodwin, 2014 | USA and Canada | LISA Study. Multicentre randomised trial in postmenopausal women with tumours stage T1-3N0-3M0, BMI ≥ 24. Lifestyle intervention (up to 24 mo) diet + physical activity counselling, evaluating secondary outcomes. Groups: (n = 167) mail-based intervention and (n = 171) individual lifestyle intervention (LI). | Both arms received information on healthy lifestyle at baseline and at 1-year. Individualised LI: 2-year telephone-based intervention on the diabetes prevention program. Goal: 10% weight loss to a BMI not less than 21; calorie reduction to attain 500–1000 kcal daily deficit, and reduction in fat to 20% of kcal, and increased intake of fruits, vegetables, and grains; gradual increase in moderate-intensity aerobic physical activity to 150–200 min/week. | Primary: disease-free survival. Secondary: overall survival, distant-disease-free survival, weight loss, quality of life (QoL). | QoL: EORTC QLQ-C30 (physical condition and overall QoL score); SF-36 (PCS and MCS); Fatigue Symptom Inventory; Breast Symptom Checklist. | Weight: mean weight loss was significantly (p < 0.001) greater in the LI arm vs. comparison arm: 5.3% vs. 0.7% at 6 months, 3.6% vs. 0.4% at 24 months. QoL: mean change in SFS6-PCS from baseline, LI arm vs. comparison arm: 4.2 vs. 2.3 at 6 months, 4.4 vs. 2.9 at 12 months, 4.1 vs. 4.4 at 24 months; p = 0.005. No significant changes in SF36-MCS. EORTC QLQ-C30 physical condition score (p < 0.001). No significant improvement in EORTC QLQ-C30 Quality of Life Score (p = 0.062). All p-values are adjusted for time period of assessment. | Accrual was terminated at 338 of 2150 planned patients because of loss of funding. Therefore, only intermediate (24-month) secondary outcomes are presented. |
| Swisher, 2015 | USA | Survivors triple-negative BC (stage I–III), BMI > 25, age < 80 years, average time at enrolment in the study after diagnosis 4–5 years. 28 women enrolled: 20 allocated to control group, 18 to the intervention. | Moderate-intensity aerobic exercise (150 min per week, for 12 weeks) and diet counselling, compared to usual care. Dietary counselling based on 2 individual sessions with the study dietitian; goal: to decrease dietary fat intake by 200 kcal per week. | Primary outcome: weight loss. Secondary: physical function, quality of life (QoL). | FACT-B. | Weight: subject in the intervention lost more body fat (2.4% loss vs. 0.4% gain, p < 0.05) than the control group. QoL (FACT-B): improvements in physical well-being (p < 0.05) and BC-specific items (p < 0.05). | Assessment based upon women who completed the trial (12 weeks): 18 in the intervention group and 10 from the control group. |
| Demark-Wahnefried, 2015 | USA | The ENERGY trial: single-blinded randomised phase 3 trial. Participants: women diagnosed within the previous 5 years on cancer stage-I-III, aged > 21 years and BMI 25–45. Intensive intervention (n = 344) or less intensive intervention (control arm) (n = 348). | Intervention: group-based, semi-structured weight loss program + telephone counselling and tailored newsletters, according to ACS guidelines. 4 months, 1 h group session/week + 1 session/week for 2 months and 1 session/week during 6–12 months + personalised guidance in between the sessions. + mailed newsletter on a quarterly basis from 6–24 months (individually tailored). Control group received two contacts: at baseline and at 6 months. | Primary outcome: quality of life (QoL). | SF-36; refined Impact of Cancer Scale (IOCv2); BCPT Symptom Scales; CES-D. | Assessment at 12 and 24-month. Non-significant changes for SF36 vitality subscale score (p-values 0.509 and 0.185). Improvement (p = 0.051) of SF-36 physical function at 12 months and no significant change at 24 months (p = 0.185); Greater positive impact of cancer (p = 0.046) at 12 months. Depressive symptoms (CES-D) increased at 24 moths (p = 0.03). | The SF36 only included specific scales for vitality and physical functioning; the IOCv2 measures impact of cancer on QoL; the BCPT Symptom Scales measures side effects of medical interventions; the CES-D measures depressive symptoms. Unexpected findings related to depressive symptoms. |
| Kwiatkowski, 2017 | France | PACThe trial. Patients enrolled within 9 months after chemotherapy or radiotherapy completion. 251 participants randomised: 117 intervention, 115 control group. | 2-week intervention in hydrothermal centres including APANE (adapted physical activity and nutritional education). Energy intake: 1200 kcal/day. Diet program based on Four-Group Point Method. Control group: individual standard recommendations at home. | Primary outcome: long-term (6-month to 5-years) quality of life. | SF36 (global score). | Effect-sizes (difference between means of the two groups divided by the common standard deviation) for the SF36 score at different time periods: 6 months 0.63 (0.37, 0.89); 1 year 0.29 (0.03, 0.55); 2 years 0.27 (−0.01, 0.56). Effect-size over the whole follow-up period 0.33 (0.23, 0.43), p < 0.01. | Secondary endpoints: anxiety/depression (HAD), sleep (adapted from Leeds sleep evaluation questionnaire), physical/sedentary activity scores. |
| Zick, 2017 | USA | Pilot study, 30 breast cancer patients stage 0-IIIa (15 intervention, 15 control group) | FRD: rich in fruits, vegetables, whole grains, and omega-3 fatty acid-rich foods. 3-months, phone counselling. Control: 8 sessions general health topics excluding diet). | Primary outcome: fatigue. Secondary: sleep quality. | BFI, PSQI | Adjusted means (difference between baseline and 3-months). BFI decreased by 2.4 in the FRD group vs. controls (p = 0.01). PSQI score decreased by 2.5 t in FRD group and increased by 0.9 in the control group (p = 0.03). | Intention-to-treat (ITT) analysis. Dietary assessment: at baseline and 3 months by means of day food records and 24-h recalls. |
| Chlebowski, 2020 | USA | WHI-DM trial. 3374 breast cancer survivors (1299 intervention, 2075 controls) median follow-up 19.6-year. | Low-fat dietary pattern: the goals were to reduce fat intake to 20% of energy and increase vegetable, fruit, and grain intake. Intervention period: 8.5-years. | Overall mortality, breast cancer specific mortality. | - | Mortality: HR 0.85 (0.74–0.96), p = 0.01. Breast cancer mortality: HR 0.79 (0.64–0.97), p = 0.02. | Intention-to-treat, secondary analysis (the primary outcome was recurrence). Lack of breast cancer therapy information. |
| Ruiz-Vozmediano, 2020 | Spain | 72 women stage IIA-IIB with treatment completed within previous 12 months. Randomised to intervention (n = 36) and control group (n = 36), completion of treatment 12 mo earlier. Follow-up: 6 month after intervention. | Intervention (6-month); diet: three 5-h workshops on healthy eating patterns and information on risk factors and prevention; exercise: 7-week period, 60-min class, 3/week, and mindfulness program (4-week, 2/week, 90 min. Control group: usual care. | Primary outcome: quality of life (QoL). Secondary outcome: change in weight. | EORTC QLQ-C30, 5 functional domains: physical, role, cognitive, emotional, and social. | Comparison of means (intervention vs. control at 6-month: significant improvements in physical functioning (p = 0.027), role functioning (p = 0.028), dyspnoea symptoms (p = 0.066). No significant changes in global health and fatigue. | only 15 patients completed at least 75% of program sessions. |
| Colorectal cancer (CRC) | |||||||
| Bourke, 2011 | UK | Pilot trial; 18 colon cancer survivors, mean age 69 years, Dukes stage A-C, recruited months post-surgery; 9 intervention, 9 controls. | Intervention: 12-week program of home-based exercise sessions and dietary advice (n = 9); controls: standard care. | Exercise and dietary behaviours, fatigue and quality of life (QoL). | FACT-F (fatigue) and FACT-C (CRC-specific QoL). | Intervention vs. control: improved fatigue (FACT-F score) p = 0.005 and no change in QoL (FACT-C score) p = 0.80. | |
| Bonelli, 2013 | Italy | Double-blind, phase III, randomised, placebo-controlled trial. 411 post-polypectomy (within 6 months from enrolment). 200 intervention, 211 placebo group. Median follow-up 4 years. | Active compound (200 μg selenium, 30 mg zinc, 2 mg vitamin A, 180 mg vitamin C, 30 mg vitamin E) vs. placebo; daily, 5 years. | Primary: recurrent adenomas or incident colorectal cancer. Secondary: advanced adenoma. | - | Recurrent adenomas (intervention vs. placebo): HR = 0.61 (0.41–0.92); for small tubular adenomas HR = 0.61 (0.37–0.99); advanced adenomas HR = 0.50 (0.24–1.01). | Intention-to-treat analysis in 330 (out of 411) participants with follow-up colonoscopy (164 intervention and 166 placebo group). |
| Ho, 2020 | China | 223 colorectal cancer survivors (82 women), mean age 65 years. 4 groups: Group A (Diet + PA), Group B (Diet only), Group C (PA only), Group D (control group). | Intervention: ‘Moving Bright, Eating Smart’. Reduce red/processed meat to <5 servings/week (<2 servings of processed meat) and to limit refined grains to 2 servings/day. Overall 12-month, with decreasing frequency on contacts along the year. Control: usual care. | Quality of life (QoL); assessment at 6, 12, 18, and 24 months. | SF-12 (health-related QoL), SF-6D utility index, FACT-C (CRC-health related QoL), FACT-G (excluding disease-specific items), HADS (anxiety and depression). | Mean difference between groups, dietary intervention vs. not receiving diet intervention: At 12-mont, SF-6D utility index scores 0.042 (0.003–0.081) and FACT-G total score 3.09 (0.13–6.04). At 24-month, SF-12 PCS scores (2.57 (0.69–4.45) and the FACT-G total scores 3.14 (0.23–6.04). Overall, reduction in HADS-depression 0.71 (1.28–0.14). | Intention-to-treat principle. Results on physical activity intervention available, but no results on combined intervention. |
| Prostate cancer | |||||||
| Parsons, 2020 | US | Men’s Eating and Living (MEAL) study, 478 men, 50–80 years, with biopsy-proven prostate adenocarcinoma early-stage (cT2a or less and PSA < 10 ng/mL). Intervention (n = 237), controls (n = 241). | MEAL intervention: counselling behavioural intervention by telephone promoting consumption of 7 or more vegetable servings daily; duration 24 months. Control group: written information about diet and prostate cancer. | Primary: time to progression (by biopsy and PSA changes). Secondary: health related quality of life (QoL). | Several functional and health prostate cancer- related QoL scores. | No significant difference in time to progression (intervention vs. control: adjusted HR 0.97 (0.76–1.25), p = 0.84. | Results on QoL no reported. |
| Endometrial cancer | |||||||
| Koutoukidis, 2019 | UK | DEUS pilot trial: parallel, randomised, controlled pilot trial; 54 survivors stage I-IVA endometrial cancer; allocation to either intervention (n = 26) or usual care (n = 28). | Intervention: the ‘Shape-Up following cancer treatment’; 8 weeks, group-based weekly 1.5 h sessions on healthy eating and physical activity based on Social Cognitive Theory and Control Theory. Control group: usual care. | Diet, physical activity, body composition, and health-related quality of life (QoL) | EORTC Core 30 and Endometrial Cancer Module (QLQ-EN24) | Change (mean) from baseline to 8 weeks: EORTC QLQ-C30, 5.0 (−3.4–13.3), p = 0.24; at 24 weeks 8.9 (0.9–16.8), p = 0.029. | Intention-to-treat analysis in participants with complete data at 24 weeks (24 intervention, 25 controls) |
Publisher’s Note: MDPI stays neutral with regard to jurisdictional claims in published maps and institutional affiliations. |
© 2022 by the authors. Licensee MDPI, Basel, Switzerland. This article is an open access article distributed under the terms and conditions of the Creative Commons Attribution (CC BY) license (https://creativecommons.org/licenses/by/4.0/).
Share and Cite
Castro-Espin, C.; Agudo, A. The Role of Diet in Prognosis among Cancer Survivors: A Systematic Review and Meta-Analysis of Dietary Patterns and Diet Interventions. Nutrients 2022, 14, 348. https://doi.org/10.3390/nu14020348
Castro-Espin C, Agudo A. The Role of Diet in Prognosis among Cancer Survivors: A Systematic Review and Meta-Analysis of Dietary Patterns and Diet Interventions. Nutrients. 2022; 14(2):348. https://doi.org/10.3390/nu14020348
Chicago/Turabian StyleCastro-Espin, Carlota, and Antonio Agudo. 2022. "The Role of Diet in Prognosis among Cancer Survivors: A Systematic Review and Meta-Analysis of Dietary Patterns and Diet Interventions" Nutrients 14, no. 2: 348. https://doi.org/10.3390/nu14020348
APA StyleCastro-Espin, C., & Agudo, A. (2022). The Role of Diet in Prognosis among Cancer Survivors: A Systematic Review and Meta-Analysis of Dietary Patterns and Diet Interventions. Nutrients, 14(2), 348. https://doi.org/10.3390/nu14020348