Article

Metabolic, Affective and Neurocognitive Characterization of Metabolic Syndrome Patients with and without Food Addiction. Implications for Weight Progression

by
Lucía Camacho-Barcia
1,†,
Lucero Munguía
1,†,
Ignacio Lucas
1,
Rafael de la Torre
2,3,4,
Jordi Salas-Salvadó
2,5,6,7,
Xavier Pintó
2,8,9,
Dolores Corella
2,10,
Roser Granero
2,11,
Susana Jiménez-Murcia
1,2,9,
Inmaculada González-Monje
2,10,
Virginia Esteve-Luque
8,
Aida Cuenca-Royo
2,3,
Carlos Gómez-Martínez
2,5,6,
Indira Paz-Graniel
2,5,6,
Laura Forcano
2,3 and
Fernando Fernández-Aranda
1,2,9,*
1
Department of Psychiatry, University Hospital of Bellvitge-IDIBELL, Hospitalet de Llobregat, 08907 Barcelona, Spain
2
CIBER Physiology of Obesity and Nutrition (CIBEROBN), Carlos III Health Institute, 28029 Madrid, Spain
3
Integrative Pharmacology and Neurosciences Systems, Institut Hospital del Mar d’Investigacions Mèdiques (IMIM), 08003 Barcelona, Spain
4
Department of Experimental and Health Sciences (CEXS-UPF), Universitat Pompeu Fabra, 08002 Barcelona, Spain
5
Universitat Rovira i Virgili, Department of Biochemistry and Biotechnology, Human Nutrition Unit, Reus, 43201 Tarragona, Spain
6
Institut d’Investigació Pere Virgili (IISPV), Reus, 43204 Tarragona, Spain
7
The Sant Joan University Hospital, Human Nutrition Unit, 43201 Reus, Spain
8
Lipids and Vascular Risk Unit, Internal Medicine, University Hospital of Bellvitge-IDIBELL, Hospitalet de Llobregat, 08907 Barcelona, Spain
9
Department of Clinical Sciences, School of Medicine and Health Sciences, University of Barcelona, Hospitalet de Llobregat, 08907 Barcelona, Spain
10
Department of Preventive Medicine, University of Valencia, 46010 Valencia, Spain
11
Department of Psychobiology and Methodology, Autonomous University of Barcelona, 08193 Barcelona, Spain
*
Author to whom correspondence should be addressed.
These authors contributed equally to this.
Nutrients 2021, 13(8), 2779; https://doi.org/10.3390/nu13082779
Submission received: 14 July 2021 / Revised: 6 August 2021 / Accepted: 11 August 2021 / Published: 13 August 2021
(This article belongs to the Special Issue Nutrition and Cognition in Health and Disease)

Abstract

:
According to the food addiction (FA) model, the consumption of certain types of food could be potentially addictive and can lead to changes in intake regulation. We aimed to describe metabolic parameters, dietary characteristics, and affective and neurocognitive vulnerabilities of individuals with and without FA, and to explore its influences on weight loss progression. The sample included 448 adults (55–75 years) with overweight/obesity and metabolic syndrome from the PREDIMED-Plus cognition sub-study. Cognitive and psychopathological assessments, as well as dietary, biochemical, and metabolic measurements, were assessed at baseline. Weight progression was evaluated after a 3-year follow up. The presence of FA was associated with higher depressive symptomatology, neurocognitive decline, low quality of life, high body mass index (BMI), and high waist circumference, but not with metabolic comorbidities. No differences were observed in the dietary characteristics except for the saturated and monounsaturated fatty acids consumption. After three years, the presence of FA at baseline resulted in a significantly higher weight regain. FA is associated with worse psychological and neurocognitive state and higher weight regain in adults with metabolic syndrome. This condition could be an indicator of bad prognosis in the search for a successful weight loss process.

1. Introduction

According to the food addiction (FA) model, the consumption of certain types of food (sugary, salty, fatty, and processed) could be potentially addictive, presenting similarities with substance use disorders (SUD) by activating brain reward systems [1]. It has been suggested that the continuous intake of these high palatable foods can lead to changes in the food intake regulation [2], and could explain people’s difficulty to attach to other healthy dietary patterns [3] and overeating.
It has been found a higher prevalence of FA in individuals with obesity (18–24%) [4,5,6,7], than in normal-weight population (2–12%) [8,9,10,11,12].
Even though the prevalence of FA has been widely studied, its association with the obesity-related comorbidities remains unclear. In a sample of individuals eligible for obesity surgery with a body mass index (BMI) of ≥35 kg/m2, FA was not associated with metabolic comorbidities such as type 2 diabetes (T2D), hypertension, or non-alcoholic fatty liver disease [13]. Nonetheless, there is no available information about this association among an elder population with overweight and class 1 obesity. Evidence regarding the association between metabolic biochemical parameters and FA is also scarce. A previous study has shown that fasting plasma glucose levels were lower in patients with FA. However, the levels of serum insulin, homeostasis model assessment of insulin resistance (HOMA-IR), glycated hemoglobin (HbA1c), and the lipid serum profile were comparable in participants with and without FA [14].
FA may also affect food choice and calorie intake. It has been previously reported that higher FA scores were associated with higher energy intake [15], and that individuals with FA had higher dietary fat intake compared to those without FA [1] and higher BMI [16].
Besides the influence of FA in biological processes, it has been also related with other psychiatric disorders, such as eating disorders [4,17,18,19,20,21], anxiety [22], and behavioral addictions [23], being suggested as a transdiagnostic construct that underlines different conditions [24,25]. Particularly, higher depressive symptomatology has been found in the population with FA [18,22,24,26], presenting a positive association between both. Additionally, FA has been associated with impairments in quality of life, involving psychological, physical, and social aspects in both clinical [27] and non-clinical populations [28,29].
FA in individuals with obesity has also been related to impaired executive functions, such as decision making or attentional capacity [30] and cognitive impairment [31]. However, as far as we know, no study has measured the neurocognitive state related to FA in an advanced age population with metabolic syndrome.
The aims of the present study are threefold: (i) to describe metabolic parameters and dietary characteristics of individuals with and without FA, (ii) to describe affective and neurocognitive underlying vulnerabilities of individuals with and without FA, and (iii) to explore whether FA status, presence (FA+)/absence (FA−), influences weight loss progression. After reviewing the existing evidence, we hypothesize that those individuals with FA will present the worst metabolic state, more depressive symptomatology, and worse neurocognitive performance, as well as showing a worse weight loss progression in contrast with those without FA.

2. Materials and Methods

2.1. Study Design and Population

The PREDIMED-Plus (PREvención con DIeta MEDiterránea Plus) is a 6-year ongoing, multicenter, randomized parallel-group, intervention study with the primary objective of assessing the effects of an intensive lifestyle intervention with an energy-reduced Mediterranean diet (MedDiet), physical activity promotion, and behavioral support on primary prevention of cardiovascular disease (CVD) events. The PREDIMED-Plus study total cohort includes 6874 participants, recruited in 23 different Spanish centers, and randomly assigned to either an intensive weight loss intervention group, based on an energy-restricted MedDiet with physical activity promotion and behavioral support, or to a control group, advised to follow an ad libitum MedDiet without any other indication. The sample included men aged between 55 and 75 years and women between 60 and 75 years old, with overweight or obesity that met at least three components of metabolic syndrome at the moment of enrolment. The cohort description in detail has been previously portrayed [32] and the protocol is available in http://predimedplus.com/ (accessed on 13 August 2021). The trial was registered in 2014 at the International Standard Randomized Controlled Trial (ISRCT) with number ISRCT89898870. According to the ethical standards of the Declaration of Helsinki by the Research Ethics Committees, all the participating institutions approved the study protocol and procedures (PR240/13; H1509263926814; 2013/5276/I; 13-07-25/7proj2). All participants provided written informed consent. The current analysis was performed in a subsample of the original population, including n = 448 individuals from the PREDIMED-Plus cognition subprogram recruited in four different centers: Universitat Rovira i Virgili (Tarragona, Spain), Universidad de Valencia (Valencia, Spain), Institut Hospital del Mar d’Investigacions Mèdiques-IMIM (Barcelona, Spain), and Bellvitge University Hospital-IDIBELL (Barcelona, Spain).

2.2. Dietary Assessment

Dietary information was collected by trained dietitians at baseline and yearly thereafter during the follow-up visits. Total energy, macro, and micronutrients intake were assessed by a semi-quantitative 143-item food frequency questionnaire (FFQ) and estimated using Spanish food composition tables [33,34].

2.3. Biochemical, Anthropometric and Blood Pressure Measurements

Trained personnel assessed duplicated weight, height, and waist circumference at baseline, and subsequently at each of the follow-up visits. Body mass index (BMI, kg/m2) was later calculated using this information. Fasting blood samples were collected in order to perform biochemical analyses. Biochemical measurements included fasting plasma glucose, HbAc1 and insulin, albumin, transaminase enzymes, and lipid profile (total cholesterol, HDL-c, LDL-c and triglycerides). Blood pressure was measured 3 times using a validated semiautomatic oscillometer (Omron HEM-705CP). HOMA-IR was estimated with the formula: fasting glucose levels [mg/dL] × fasting insulin levels [µU/mL]/405,13 [35].

2.4. Psychometric Measures

Psychometric assessment was conducted by self-report questionnaires.
Yale Food Addiction Scale (YFAS) [3] has been validated in Spanish population [5]. It is a 25-item self-report questionnaire for measuring addictive eating behaviors, based on the Diagnostic and Statistical Manual of Mental Disorders (DSM-IV-TR) [36] criteria for substance dependence, adapted to the context of food consumption. Two scoring options are used to indicate the experience of addictive eating behavior: a dimensional (Likert scale) and a binary score. FA is diagnosed when at least three symptoms and a clinically significant impairment or distress are present within the previous 12 months. The internal consistency of the YFAS in our sample was α = 0.914.
The Beck Depression Inventory–II (BDI-II) [37] has been validated in Spanish general population [38]. It is a self-report questionnaire of 21 items that assess the severity of depressive symptoms in adults and adolescents, reflecting the diagnostic criteria for major depressive disorder listed in the DSM-5 [39]. Scores for each item range from 0 to 3, being the total score the sum of all responses. The standardized cut-offs are follows: 0–13 indicates minimal depression, 14–19 mild depression, 20–28 moderate depression, 29–63 severe depression. The internal consistency of the BDI-II in our sample was α = 0.873.
Short Form-36 Health Survey (SF-36) [40] has been validated in Spanish population [41]. It is a self-report questionnaire of 36 items in its short form. It is a generic measure of health status, through eight subscales: physical functioning, physical role, bodily pain, general health, vitality, social functioning, emotional role, and mental health. The higher the score, the better general quality of life. The internal consistency of the SF-36 in our sample was α = 0.933.

2.5. Cognitive Assessment

Montreal Cognitive Assessment (MoCA) [42] is a neurocognitive screening tool to detect mild cognitive impairment. It takes 7 to 10 min to be administered by healthcare professionals. The test assesses multiple cognitive functions, including short-term memory, visuospatial abilities, executive functioning, phonemic fluency, attention, concentration, working memory, language, and orientation. The test score ranges from 0 to 30, with higher scores indicating better performance. If the years of education are below 12, one point should be added to the final score. The test has been validated previously in Spanish population [43].

2.6. Statistical Analysis

Statistical analysis was carried with Stata17 for Windows [44]. For this analysis, we used the PREDIMED-Plus sub-cognition study database of January 14th, 2021.
Comparison between the groups were done with the chi-squared test (χ2) categorical variables and the T-test for independent groups for quantitative variables. Effect size was measured with the standardized Cohen’s d coefficient for mean differences and Cohen’s h for proportion differences (effect size was considered null for |d| < 0.20 or |h| < 0.20, low-poor |d| > 0.20 or |h| > 0.20, moderate–medium for |d| > 0.50 or |h| > 0.50, and large–high for |d| > 0.80 or |h| > 0.80) [45,46] In addition, Finner’s method was used to control the increase in the Type-I error due to the application of multiple null-hypothesis significance tests (this is a stepwise multiple test procedure aimed to adjust p-values controlling the familywise error rate, FWER) [47]. Missing data was handled by a multiple imputation (MI) procedure implemented in Stata17, which provides unbiased estimate parameters and their respective standard errors using Rubin’s combination rules and making no assumption about the missing-data mechanism [48,49].
The evolution of the BMI during the study was analyzed with 2×4 mixed analysis of variance (ANOVA), defining the group as the between-subjects factor (FA− versus FA+) and the time as the within-subjects factor (baseline, 1-yr, 2-yr, and 3-yr of the follow-up).

3. Results

3.1. Descriptive for the Sample

Table 1 displays the distribution for the total sample and the comparison for the patients with FA− and FA+. Among the total sample, the distribution of sex was 217 men (48.4%) versus 231 women (51.6%). Most participants were born in Europe (98.2%), were married, or lived with a stable partner (78.3%), achieved primary education levels (53.6%), and were retired (64.3%). Regarding the group of weight, the greatest likelihood was being in the obesity-I level (48.7%). Regarding comparison between the groups with the FA negative versus positive screening scores, differences only were found for the group of weight: FA+ associated with higher obesity levels.

3.2. Comparison of Metabolic and Dietary Measures

Table 2 contains the results of the comparison between the groups for metabolic and dietary measures. The patients within the FA+ condition reported a higher mean for weight, BMI, and waist circumference. No differences were observed in the lipid profile, in the parameters of glucose metabolism, liver function, blood pressure values. and physical activity total energy expenditure. Regarding dietary information, participants with FA had a higher intake of monounsaturated fatty acids (MUFAs) (grams and percentage estimates), saturated fatty acids (SFAs) (grams and percentage estimates), and grams per day of trans fatty acids.

3.3. Comparison of Psychological and Neuropsychological Measures

Table 3 contains the results of the comparison between the groups for the BDI, SF-36, and the MoCa scores. The presence of FA+ was associated with worse psychological state, except for the SF-36 physical pain domain.

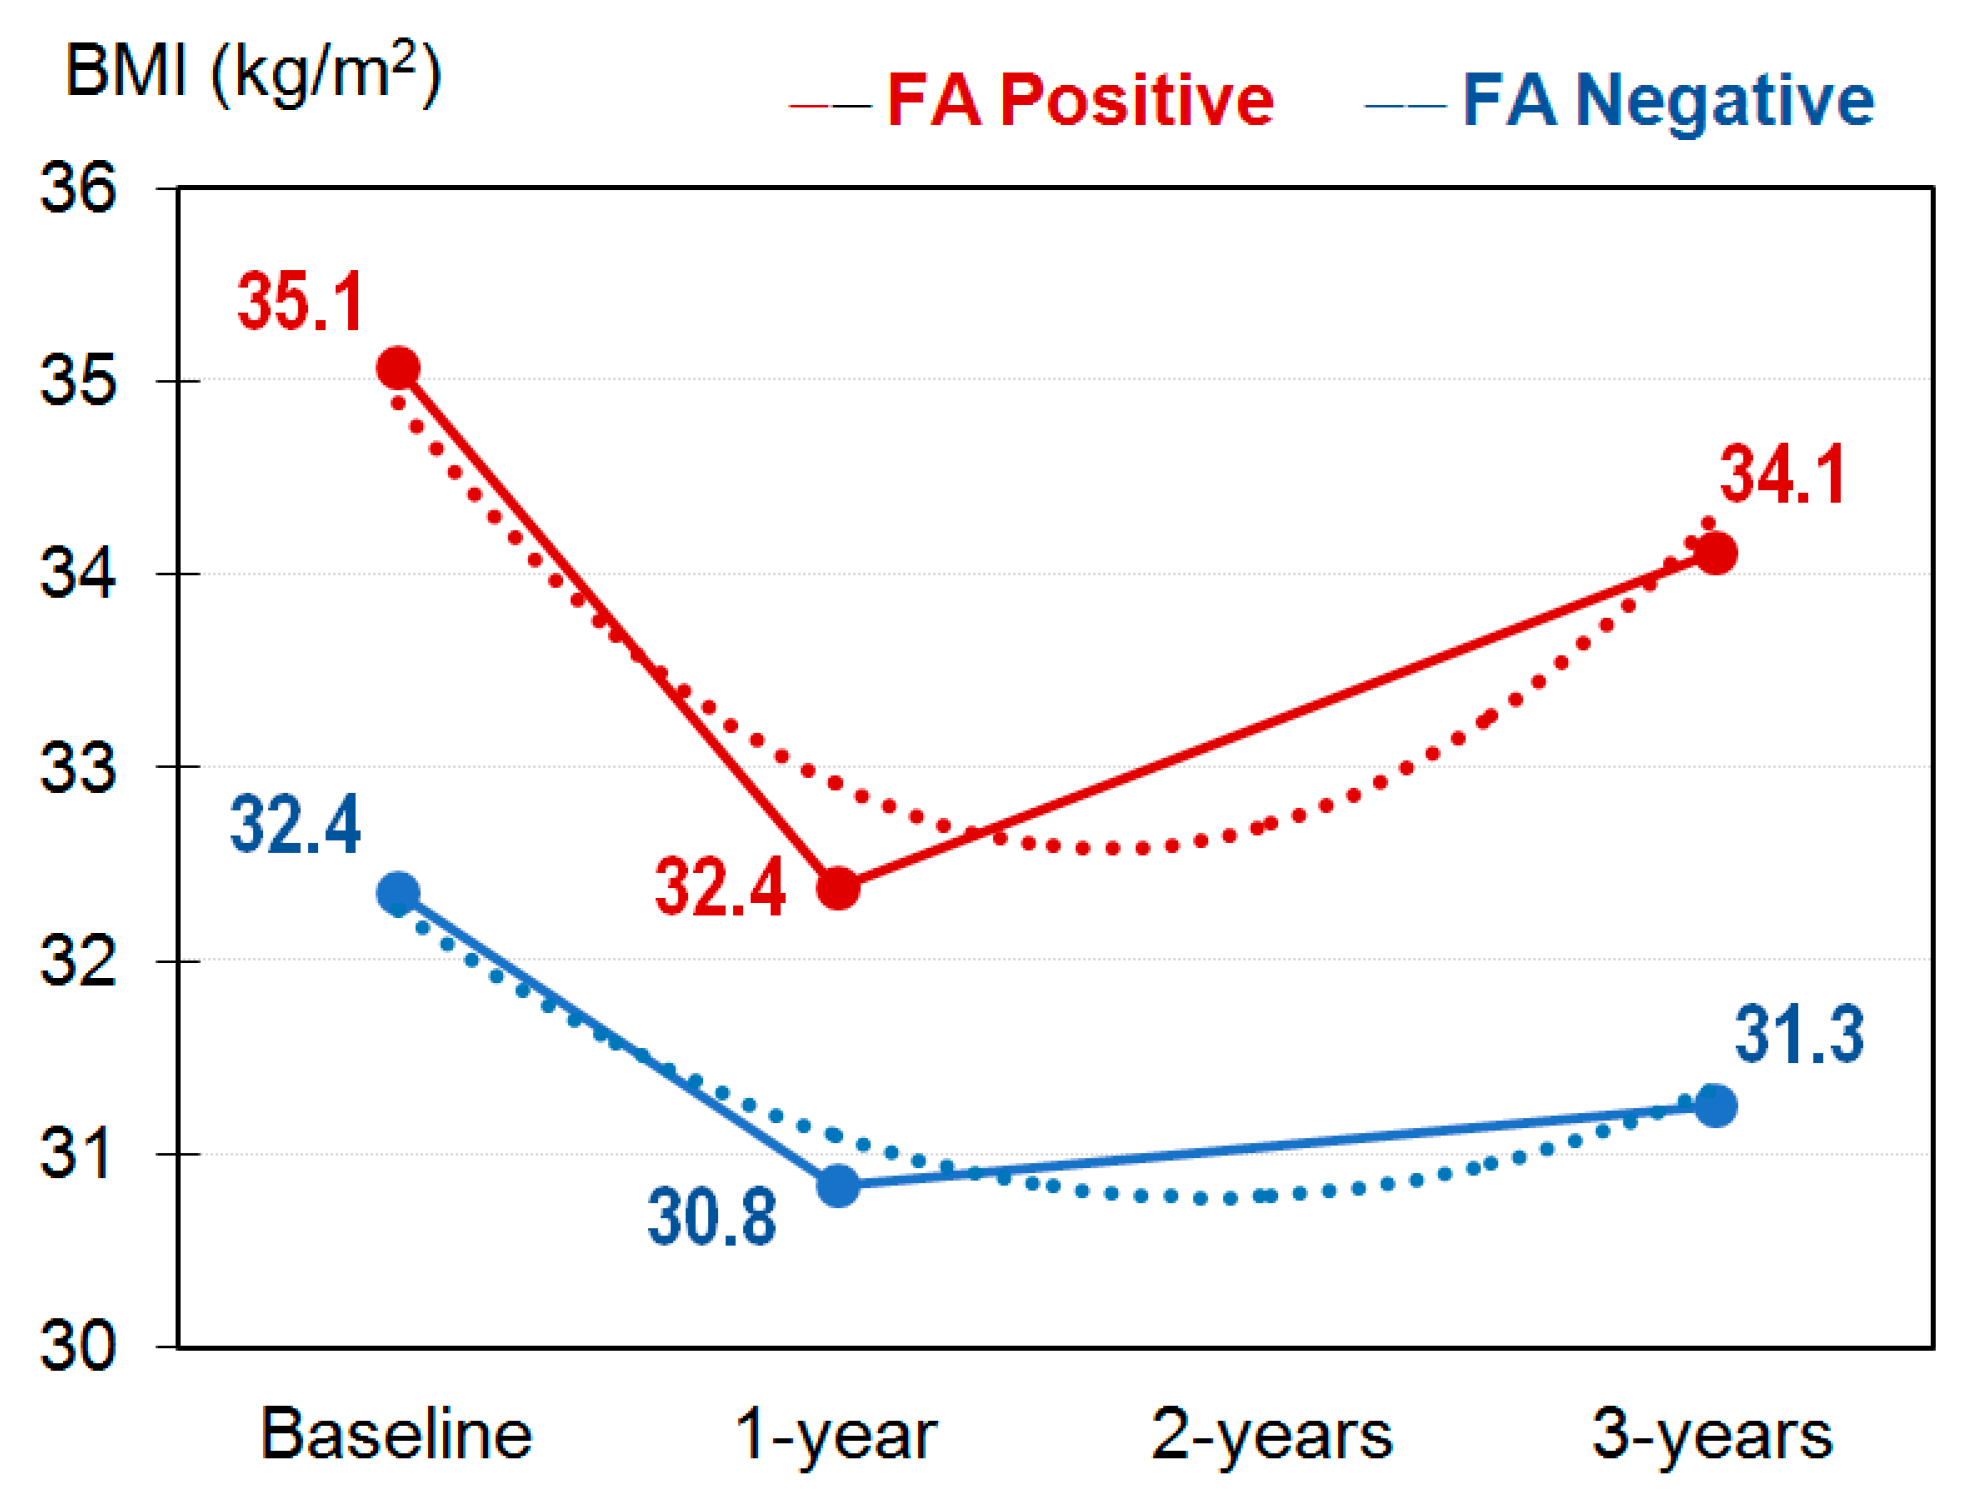
3.4. Evolution of the BMI during the Study

Figure 1 shows the line graph with the means registered for the BMI at the beginning of the study and during the three years of the follow-up. Table S1 (Supplementary Material) contains the complete results of the 2×3 ANOVA. A significant interaction group-by-time was found (F (df = 2.431) = 4.18, p = 0.021, η2 = 0.010), suggesting that the progression of the BMI during the study was different in each FA condition. Concretely, polynomial contrasts evidenced a quadratic trend within the FA− condition (p = 0.004, η2 = 0.020), while no linear-quartic trend emerged within the FA+ condition. Contrasts for the factor group (FA+ versus FA− comparisons) also achieved significant results, with higher mean scores among patients with FA+ at baseline (p = 0.001, η2 = 0.034) and at three years of the follow-up (p = 0.001, η2 = 0.033).

4. Discussion

The present study aimed to describe metabolic parameters and dietary characteristics, as well as affective and neurocognitive underlying vulnerabilities, of individuals with and without food addiction, and to explore whether FA status (presence/absence) influences weight loss progression, in a metabolic syndrome at high cardiovascular risk population.
The prevalence of FA in our sample reached 5.8%, underneath the number of the general population that has been reported to be about 8% [50]. However, information of the prevalence of FA among the elderly population is scarce. Data from the Nurses’ Health Studies (NHS) cohort, a sample of women aged between 60 and 88 years old, showed that the number of cases of FA reached 2.7%. This prevalence was strongly linked with age, reaching 6% in the age range of 60–65 years, and continually decreased till 1.4% in ages between 75 and 88 [51]. The decline in the prevalence of FA diagnosis while increasing in age could be associated with several physiological alterations related to the ageing process, including changes in the taste and smell senses [52] that could be affecting the motivation for palatable food, as well as changes in the physiology of several endocrinal factors such as ghrelin, cholecystokinin, and leptin that may result in a relevant decrease in appetite and food intake [53].
As our first aim, we explored the metabolic status and the presence of comorbidities. In our study, the diagnosis of FA was associated with higher total weight, BMI, and higher rates of morbid obesity (BMI ≥ 35 kg/m2). Previous findings have reported similar associations [51,54,55]. Yet, in our study, no link was observed between the presence of FA and obesity-related comorbidities. This lack of association may be due to the general characteristics of the study population, individuals with overweight or obesity that met at least three components of metabolic syndrome at the moment of enrolment, and therefore at high cardiovascular risk. Nonetheless, we did observe a significant difference in the waist circumference values, an indicator of abdominal obesity and a predictor of metabolic disorders such as T2D and CVD [56].
It is worth mentioning that, even though the presence of FA could be considered a contributor factor in the weight gain and latter development of obesity, the fat mass accumulation and the obesity-related comorbidities are affected by several other influences, such as the dietary pattern, the metabolic state, genetics, and epigenetics, among others [57].
Regarding the dietary characteristics of our sample, we were not able to identify any differences in-between the macronutrient dietary profile and the total calorie intake of the FA and non-FA participant groups. Nevertheless, we did observe significant differences in the fatty acid distribution, specifically in the saturated and monounsaturated fatty acid consumption, as well as in the trans fatty acid intake. The same differences were described in previous findings, where individuals with obesity and FA exhibited a significantly higher consumption of fat subcomponents: saturated, monosaturated, polyunsaturated, and trans fats [58]. Food with a high content of fat, especially saturated and trans fatty acids, are highly palatable and more likely to be excessively consumed and to be associated with compulsive overeating [59].
In relation to our second aim, higher depressive symptomatology was found in those patients presenting FA. The presence of depression among metabolic syndrome patients have already been mentioned in the literature [60,61,62,63], as well as the association between FA and depression [18,22,24,26]. A possible common feature between both comorbidities could be the use of the eating behavior as a way to regulate negative emotional states that may lead to overeating [64], as well as to changes in the food intake regulation [2], establishing a continuous feedback between each other [10]. Depression has been associated with higher daily caloric intake [64], and high adipose mass has been associated with several metabolic disturbances that are implicated in the control of emotions and mood [65,66]. This may explain the increase of depression in our sample, from minimal depression in those without FA, to mild depression in those with FA, according to the standardized cut-offs [37].
In a similar way, according to what it was hypothesized, those patients with FA presented higher impairments in all the assessed parameters of quality of life than those without FA, except for the one related to physical pain. Impairments in quality of life have been already mentioned in the literature in populations that present FA [27,28,29], but just a few studies have explored the influence of FA over the quality of life in contrast with the other metabolic parameters. Its findings are in concordance with the ones of the present study, being that the metabolic disturbances seem not to be enough to imply detriments in quality of life [14], but the presence of FA does. As has been mentioned in the literature, addictive processes, both behavior- and substance use-related, decreases quality of life [67].
Regarding the neurocognitive assessment, our results showed that FA+ group presented lower scores in a general cognitive state test than the group without FA, pointing out that FA was related to a more pronounced cognitive decline in an older adult population with metabolic syndrome. Fast food intake in elderly population has been already associated with higher incidence of mild cognitive impairment [68], as well as the preference for processed foods with poorer cognitive performance and impaired executive functioning in this population [69]. In contrast, higher adherence to the Mediterranean diet has been associated with a reduced risk for developing mild cognitive impairment in nondemented elderly participants [70]. Our results may suggest that the presence of FA patterns could be associated with an increased risk of cognitive decline within this population.
Finally, one of the most relevant contributions of this study is the longitudinal assessment of the effect of FA on the evolution of weight at three years. Our results indicate that the presence of FA at baseline resulted in a significant higher weight regain after three years, when following a Mediterranean diet. These findings are consistent with prior research that observed an association between the presence of FA and worse results while seeking a weight loss [71,72,73]. Previous results from our group showed that among individuals with obesity seeking bariatric surgery, the presence of FA at baseline predicted poorer weight loss achievement after a dietary and lifestyle intervention before the surgical intervention [6].
These findings may suggest that the presence of FA could be an indicator of bad prognosis on the search for a successful weight loss process, influencing the final outcome in the treatments. Nonetheless, there is also evidence that the FA symptoms can diminish after a weight reduction [74,75]. Therefore, taking all this into account, even though the presence of FA could be considered a disadvantage at the moment of reaching a successful result, implementing additional and specialized support to these individuals during the treatment may be a good strategy for obtaining better results [25].

Limits and Strengths

Our study has some limitations that should be considered. The study cohort, a Mediterranean older adult population with metabolic syndrome at high cardiovascular risk, is not representative of the general population, and therefore our results cannot be extrapolated. As in any observational study, the possibility of residual or unmeasured confounding could not be eliminated. Additionally, even though FFQs are suitable tools for epidemiological studies’ dietary assessment, being a subjective method, we cannot disregard some errors in the estimation of the dietary information.
Despite its limitations, this study adds a characterization of a population that has not been previously thoroughly described, a senior population with food addiction symptomatology.

5. Conclusions

As general a conclusion, the results of this study indicated that the presence of FA is associated with higher depressive symptomatology, worse neurocognitive state, and lower quality of life than with metabolic parameters. Additionally, those participants with FA had higher weight regain than those without FA after three years of follow-up. All these factors may be indicators of worse prognosis for metabolic syndrome patients that also present FA, for which the present results may be helpful in order to establish better treatment approaches. It is possible to suggest that the population with FA could benefit from both a diet-based treatment as well as a specific one targeting the addictive process, which could improve the psychological, social, and neurological functioning of the patients.

Supplementary Materials

The following are available online at https://www.mdpi.com/article/10.3390/nu13082779/s1, Table S1: Evolution of BMI (kg/m2) during the study: Mixed 2 × 3 ANOVA.

Author Contributions

Conceptualization F.F.-A., L.C.-B. and L.M.; formal statistical analysis, R.G.; writing—original draft preparation, F.F.-A., L.C.-B., L.M. and I.L.; writing—review and editing, F.F.-A., L.C.-B., L.M., V.E.-L.; writing—review: R.d.l.T., J.S.-S., X.P., S.J.-M., I.G.-M., V.E.-L., A.C.-R., C.G.-M., I.P.-G., and L.F.; supervision D.C. All authors contributed substantially to the data recollection, interpretation of data and all authors have read and agreed to the published version of the manuscript.

Funding

This work was supported by the official Spanish Institutions for funding scientific biomedical research, CIBER Fisiopatología de la Obesidad y Nutrición (CIBEROBN) and Instituto de Salud Carlos III (ISCIII), through the Fondo de Investigación para la Salud (FIS), which is co-funded by the European Regional Development Fund (six coordinated FIS projects leaded by JS-S and JVi, including the following projects: PI13/00673, PI13/00492, PI13/00272, PI13/01123, PI13/00462, PI13/00233, PI13/02184, PI13/00728, PI13/01090, PI13/01056, PI14/01722, PI14/00636, PI14/00618, PI14/00696, PI14/01206, PI14/01919, PI14/00853, PI14/01374, PI14/00972, PI14/00728, PI14/01471, PI16/00473, PI16/00662, PI16/01873, PI16/01094, PI16/00501, PI16/00533, PI16/00381, PI16/00366, PI16/01522, PI16/01120, PI17/00764, PI17/01183, PI17/00855, PI17/01347, PI17/00525, PI17/01827, PI17/00532, PI17/00215, PI17/01441, PI17/00508, PI17/01732, PI17/00926, PI19/00957, PI19/00386, PI19/00309, PI19/01032, PI19/00576, PI19/00017, PI19/01226, PI19/00781, PI19/01560, PI19/01332, PI20/01802, PI20/00138, PI20/01532, PI20/00456, PI20/00339, PI20/00557, PI20/00886, PI20/01158); the Especial Action Project entitled: Implementación y evaluación de una intervención intensiva sobre la actividad física Cohorte PREDIMED-Plus grant to JS-S; the Recercaixa (number 2013ACUP00194) grant to JS-S; grants from the Consejería de Salud de la Junta de Andalucía (PI0458/2013, PS0358/2016, PI0137/2018); the PROMETEO/2017/017 grant from the Generalitat Valenciana; the SEMERGEN grant; None of the funding sources took part in the design, collection, analysis, interpretation of the data, or writing the report, or in the decision to submit the manuscript for publication. None of the funding sources took part in the design, collection, analysis, or interpretation of the data or in the decision to submit the manuscript for publication. We thank CERCA Programme/Generalitat de Catalunya for institutional support and partial support was also provided by SLT006/17/00246, funded by the Department of Health of the Generalitat de Catalunya by the calls “Acció instrumental de programes de recerca orientats en l’àmbit de la recerca i la innovació en salut” and “Pla estratègic de recerca i innovació en salut (PERIS)”. This research was also partially funded by EU-H2020 Grants (Eat2beNICE/ H2020-SFS-2016-2; Ref 728018; and PRIME/ H2020-SC1-BHC-2018-2020; Ref: 847879). IP-G receives a grant from the Spanish Ministry of Education, Culture and Sports (FPU 17/01925). C.G.-M. receives a predoctoral grant from the University of Rovira i Virgili (2020PMF-PIPF-37); J.S-S. is partially supported by ICREA under the ICREA Academia program.

Institutional Review Board Statement

According to the ethical standards of the Declaration of Helsinki by the Research Ethics Committees, all the participating institutions approved the study protocol and procedures (PR240/13; H1509263926814; 2013/5276/I; 13-07-25/7proj2).

Informed Consent Statement

All participants provided written informed consent.

Data Availability Statement

Due to signed consent agreements regarding data sharing, there are restrictions on data availability for the PREDIMED-Plus trial. These only allow access to external researchers for studies following the project purposes. Requestors wishing to access the PREDIMED-Plus trial data used in this study can make a request to the PREDIMED-Plus trial Steering Committee chair: [email protected]. The request will then be passed to members of the PREDIMED-Plus Steering Committee for deliberation.

Acknowledgments

We thank all the volunteers for the participation and personnel for the contribution in the PREDIMED-Plus trial. CIBEROBN, CIBERESP, and CIBERDEM are initiatives of Instituto de Salud Carlos III (ISCIII), Madrid, Spain. The authors also thank the PREDIMED-Plus Biobank Network as a part of the National Biobank Platform of the ISCIII for storing and managing the PREDIMED-Plus biological samples.

Conflicts of Interest

X.P. reports personal fees from Almirall, Amgen, Astra-Zeneca, Ferrer, Merck, Rubió, Sanofi, Servier and Viatris outside the submitted work. FF-A reports consultation fees from Novo Nordisk and editor-in-Chief honoraria from Wiley. None of the remaining authors had any potential conflict of interest. J.S-S. serves on the board of the International Nut and Dried Fruit Council and received grant support through this institution. He also served on the Executive Committee of the Instituto Danone, Spain, and on the Scientific Committee of the Danone International Institute. He has received research support from the Patrimonio Comunal Olivarero, Spain, and Borges S.A., Spain. He receives consulting fees or travel expenses from Eroski Foundation, the Instituto Danone, Spain, Mundipharma and Abbot Laboratories. The rest of authors declare no conflict of interest.

References

  1. Schulte, E.M.; Avena, N.M.; Gearhardt, A.N. Which foods may be addictive? The roles of processing, fat content, and glycemic load. PLoS ONE 2015, 10, e0117959. [Google Scholar] [CrossRef] [PubMed]
  2. Jauch-Chara, K.; Oltmanns, K.M. Obesity—A neuropsychological disease? Systematic review and neuropsychological model. Prog. Neurobiol. 2014, 114, 84–101. [Google Scholar] [CrossRef] [PubMed]
  3. Gearhardt, A.N.; Corbin, W.R.; Brownell, K.D. Preliminary validation of the Yale Food Addiction Scale. Appetite 2009, 52, 430–436. [Google Scholar] [CrossRef] [Green Version]
  4. Gearhardt, A.N.; White, M.A.; Masheb, R.M.; Morgan, P.T.; Crosby, R.D.; Grilo, C.M. An examination of the food addiction construct in obese patients with binge eating disorder. Int. J. Eat. Disord. 2012, 45, 657–663. [Google Scholar] [CrossRef] [Green Version]
  5. Granero, R.; Hilker, I.; Agüera, Z.; Jiménez-Murcia, S.; Sauchelli, S.; Islam, M.A.; Fagundo, A.B.; Sánchez, I.; Riesco, N.; Dieguez, C.; et al. Food addiction in a Spanish sample of eating disorders: DSM-5 diagnostic subtype differentiation and validation data. Eur. Eat. Disord. Rev. 2014, 22, 389–396. [Google Scholar] [CrossRef]
  6. Guerrero Pérez, F.; Sánchez-González, J.; Sánchez, I.; Jiménez-Murcia, S.; Granero, R.; Simó-Servat, A.; Ruiz, A.; Virgili, N.; López-Urdiales, R.; Montserrat-Gil de Bernabe, M.; et al. Food addiction and preoperative weight loss achievement in patients seeking bariatric surgery. Eur. Eat. Disord. Rev. 2018, 26, 645–656. [Google Scholar] [CrossRef]
  7. Müller, A.; Leukefeld, C.; Hase, C.; Gruner-Labitzke, K.; Mall, J.W.; Köhler, H.; de Zwaan, M. Food addiction and other addictive behaviours in bariatric surgery candidates. Eur. Eat. Disord. Rev. 2018, 26, 585–596. [Google Scholar] [CrossRef]
  8. Aloi, M.; Rania, M.; Rodríguez Muñoz, R.C.; Jiménez Murcia, S.; Fernández-Aranda, F.; De Fazio, P.; Segura-Garcia, C. Validation of the Italian version of the Yale Food Addiction Scale 2.0 (I-YFAS 2.0) in a sample of undergraduate students. Eat. Weight. Disord. 2017, 22, 527–533. [Google Scholar] [CrossRef] [PubMed]
  9. Gearhardt, A.N.; Grilo, C.M.; DiLeone, R.J.; Brownell, K.D.; Potenza, M.N. Can food be addictive? Public health and policy implications. Addiction 2011, 106, 1208–1212. [Google Scholar] [CrossRef] [PubMed] [Green Version]
  10. Jiménez-Murcia, S.; Agüera, Z.; Paslakis, G.; Munguia, L.; Granero, R.; Sánchez-González, J.; Sánchez, I.; Riesco, N.; Gearhardt, A.N.; Dieguez, C.; et al. Food addiction in eating disorders and obesity: Analysis of clusters and implications for treatment. Nutrients 2019, 11, 2633. [Google Scholar] [CrossRef] [Green Version]
  11. Meule, A.; Müller, A.; Gearhardt, A.N.; Blechert, J. German version of the Yale Food Addiction Scale 2.0: Prevalence and correlates of ‘food addiction’ in students and obese individuals. Appetite 2017, 115, 54–61. [Google Scholar] [CrossRef] [PubMed] [Green Version]
  12. Schulte, E.M.; Gearhardt, A.N. Associations of Food Addiction in a Sample Recruited to Be Nationally Representative of the United States. Eur. Eat. Disord. Rev. 2018, 26, 112–119. [Google Scholar] [CrossRef]
  13. Som, M.; Val-Laillet, D.; Constant, A.; Moirand, R.; Thibault, R. Prevalence of food addiction (FA) diagnosed by the yale food addiction scale version 2.0 (YFAS 2.0): Prospective study in a referral centre for obesity surgery. Clin. Nutr. 2018, 37, S264. [Google Scholar] [CrossRef]
  14. Kiyici, S.; Koca, N.; Sigirli, D.; Aslan, B.B.; Guclu, M.; Kisakol, G. Food Addiction Correlates with Psychosocial Functioning More Than Metabolic Parameters in Patients with Obesity. Metab. Syndr. Relat. Disord. 2020, 18, 161–167. [Google Scholar] [CrossRef] [PubMed]
  15. Ayaz, A.; Nergiz-Unal, R.; Dedebayraktar, D.; Akyol, A.; Pekcan, A.G.; Besler, H.T.; Buyuktuncer, Z. How does food addiction influence dietary intake profile? PLoS ONE 2018, 13, e0195541. [Google Scholar] [CrossRef] [Green Version]
  16. Mallorquí-Bagué, N.; Lozano-Madrid, M.; Vintró-Alcaraz, C.; Forcano, L.; Díaz-López, A.; Galera, A.; Fernández-Carrión, R.; Granero, R.; Jiménez-Murcia, S.; Corella, D.; et al. Effects of a psychosocial intervention at one-year follow-up in a PREDIMED-plus sample with obesity and metabolic syndrome. Sci. Rep. 2021, 11, 9144. [Google Scholar] [CrossRef]
  17. De Vries, S.-K.; Meule, A. Food Addiction and Bulimia Nervosa: New Data Based on the Yale Food Addiction Scale 2.0. Eur. Eat. Disord. Rev. 2016, 24, 518–522. [Google Scholar] [CrossRef] [PubMed] [Green Version]
  18. Granero, R.; Jiménez-Murcia, S.; Gerhardt, A.N.; Agüera, Z.; Aymamí, N.; Gómez-Peña, M.; Lozano-Madrid, M.; Mallorquí-Bagué, N.; Mestre-Bach, G.; Neto-Antao, M.I.; et al. Validation of the Spanish version of the Yale Food Addiction Scale 2.0 (YFAS 2.0) and clinical correlates in a sample of eating disorder, gambling disorder, and healthy control participants. Front. Psychiatry 2018, 9, 208. [Google Scholar] [CrossRef]
  19. Meule, A.; von Rezori, V.; Blechert, J. Food Addiction and Bulimia Nervosa. Eur. Eat. Disord. Rev. 2014, 22, 331–337. [Google Scholar] [CrossRef]
  20. Smith, D.G.; Robbins, T.W. The neurobiological underpinnings of obesity and binge eating: A rationale for adopting the food addiction model. Biol. Psychiatry 2013, 73, 804–810. [Google Scholar] [CrossRef]
  21. Penzenstadler, L.; Soares, C.; Karila, L.; Khazaal, Y. Systematic Review of Food Addiction as Measured with the Yale Food Addiction Scale: Implications for the Food Addiction Construct. Curr. Neuropharmacol. 2018, 17, 526–538. [Google Scholar] [CrossRef] [PubMed]
  22. Burrows, T.; Kay-Lambkin, F.; Pursey, K.; Skinner, J.; Dayas, C. Food addiction and associations with mental health symptoms: A systematic review with meta-analysis. J. Hum. Nutr. Diet. 2018, 31, 544–572. [Google Scholar] [CrossRef] [PubMed]
  23. Jiménez-Murcia, S.; Granero, R.; Wolz, I.; Baño, M.; Mestre-Bach, G.; Steward, T.; Agüera, Z.; Hinney, A.; Diéguez, C.; Casanueva, F.F.; et al. Food addiction in gambling disorder: Frequency and clinical outcomes. Front. Psychol. 2017, 8, 473. [Google Scholar] [CrossRef] [PubMed] [Green Version]
  24. Piccinni, A.; Marazziti, D.; Cargioli, C.; Mauri, M.; Stallone, T. Food addiction: Is it a nosological category or a psychopathological dimension? Preliminary results of an Italian study. Horm. Mol. Biol. Clin. Investig. 2018, 36. [Google Scholar] [CrossRef]
  25. Fernandez-Aranda, F.; Karwautz, A.; Treasure, J. Food addiction: A transdiagnostic construct of increasing interest. Eur. Eat. Disord. Rev. 2018, 26, 536–540. [Google Scholar] [CrossRef]
  26. Burrows, T.; Hides, L.; Brown, R.; Dayas, C.; Kay-Lambkin, F. Differences in Dietary Preferences, Personality and Mental Health in Australian Adults with and without Food Addiction. Nutrients 2017, 9, 285. [Google Scholar] [CrossRef] [Green Version]
  27. Oliveira, E.; Kim, H.S.; Lacroix, E.; de Fátima Vasques, M.; Durante, C.R.; Pereira, D.; Cabral, J.R.; Bernstein, P.S.; Garcia, X.; Ritchie, E.V.; et al. The Clinical Utility of Food Addiction: Characteristics and Psychosocial Impairments in a Treatment-Seeking Sample. Nutrients 2020, 12, 3388. [Google Scholar] [CrossRef]
  28. Nunes-Neto, P.R.; Köhler, C.A.; Schuch, F.B.; Solmi, M.; Quevedo, J.; Maes, M.; Murru, A.; Vieta, E.; McIntyre, R.S.; McElroy, S.L.; et al. Food addiction: Prevalence, psychopathological correlates and associations with quality of life in a large sample. J. Psychiatr. Res. 2018, 96, 145–152. [Google Scholar] [CrossRef] [Green Version]
  29. Zhao, Z.; Ma, Y.; Han, Y.; Liu, Y.; Yang, K.; Zhen, S.; Wen, D. Psychosocial Correlates of Food Addiction and Its Association with Quality of Life in a Non-Clinical Adolescent Sample. Nutrients 2018, 10, 837. [Google Scholar] [CrossRef] [PubMed] [Green Version]
  30. Steward, T.; Mestre-Bach, G.; Vintró-Alcaraz, C.; Lozano-Madrid, M.; Agüera, Z.; Fernández-Formoso, J.A.; Granero, R.; Jiménez-Murcia, S.; Vilarrasa, N.; García-Ruiz-de-Gordejuela, A.; et al. Food addiction and impaired executive functions in women with obesity. Eur. Eat. Disord. Rev. 2018, 26, 574–584. [Google Scholar] [CrossRef]
  31. Lacroix, E.; von Ranson, K.M. Prevalence of social, cognitive, and emotional impairment among individuals with food addiction. Eat. Weight Disord. 2020, 26, 1253–1258. [Google Scholar] [CrossRef] [PubMed]
  32. Martínez-González, M.A.; Buil-Cosiales, P.; Corella, D.; Bulló, M.; Fitó, M.; Vioque, J.; Romaguera, D.; Alfredo Martínez, J.; Wärnberg, J.; López-Miranda, J.; et al. Cohort profile: Design and methods of the PREDIMED-Plus randomized trial. Int. J. Epidemiol. 2019, 48, 387–388o. [Google Scholar] [CrossRef] [Green Version]
  33. Mataix, J. Tablas de Composición de Alimentos, 4th ed.; Universidad de Granada: Granada, Spain, 2003. [Google Scholar]
  34. Moreiras, O.; Carvajal, A.; Cabrera, L. Tablas de Composición de Alimentos [Food Composition Tables], 9th ed.; Ediciones Pirámide: Madrid, Spain, 2005. [Google Scholar]
  35. Matthews, D.R.; Hosker, J.P.; Rudenski, A.S.; Naylor, B.A.; Treacher, D.F.; Turner, R.C. Homeostasis model assessment: Insulin resistance and β-cell function from fasting plasma glucose and insulin concentrations in man. Diabetologia 1985, 28, 412–419. [Google Scholar] [CrossRef] [PubMed] [Green Version]
  36. American Psychiatric Association. Diagnostic and Statistical Manual of Mental Disorders, Fourth Edition, Text Revision (DSM-IV-TR®); American Psychiatric Association Publishing: Arlington, VA, USA, 2010; ISBN 0890426651, 9780890426654. [Google Scholar]
  37. Beck, A.T.; Steer, R.A.; Brown, G.K. Manual for the Beck Depression Inventory-II; Psychological Corporation: San Antonio, TX, USA, 1996; Volume 1, p. 82. [Google Scholar]
  38. Sanz, J.; Perdigón, A.L.; Vázquez, C. Adaptación española del Inventario para la Depresión de Beck-II (BDI-II): 2. Propiedades psicométricas en población general|Revista de psicología. Clínica Salud 2003, 14, 249–280. [Google Scholar]
  39. American Psychiatric Association. Diagnostic and Statistical Manual of Dsm-5TM, 5th ed.; American Psychiatric Association: Arlington, VA, USA, 2013; ISBN 978-0-89042-554-1. [Google Scholar]
  40. Ware, J.J.; Sherbourne, C. The MOS 36-item short-form health survey (SF-36). I. Conceptual framework and item selection—PubMed. Med. Care 1992, 30, 473–483. [Google Scholar] [CrossRef]
  41. Alonso, J.; Prieto, L.; Anto, J. La versión española del SF-36 Health Survey (Cuestionario de Salud SF-36): Un instrumento para la medida de los resultados clínicos. Med. Clin. 1995, 104, 771–776. [Google Scholar]
  42. Nasreddine, Z.S.; Phillips, N.A.; Bédirian, V.; Charbonneau, S.; Whitehead, V.; Collin, I.; Cummings, J.L.; Chertkow, H. The Montreal Cognitive Assessment, MoCA: A brief screening tool for mild cognitive impairment. J. Am. Geriatr. Soc. 2005, 53, 695–699. [Google Scholar] [CrossRef]
  43. Ojeda del Pozo, N.; del Pino Sáez, R.; Ibarretxe Bilbao, N.; Schretlen, D.J.; Peña Lasa, J. Test de evaluación cognitiva de Montreal: Normalización y estandarización de la prueba en población española. Rev. Neurol. 2016, 63, 488. [Google Scholar] [CrossRef]
  44. Stata-Corp Stata Statistical Software: Release 17 2021. Available online: www.stata.com (accessed on 13 August 2021).
  45. Cohen, J. Statistical Power Analysis for the Behavioral Sciences, 2nd ed.; Lawrence Erlbaum Associates: Hillsdale, NJ, USA, 1988. [Google Scholar]
  46. Kelley, K.; Preacher, K.J. On effect size. Psychol. Methods 2012, 17, 137–152. [Google Scholar] [CrossRef]
  47. Finner, H.; Roters, M. On the false discovery rate and expected type I errors. Biometr. J. 2001, 43, 985–1005. [Google Scholar] [CrossRef]
  48. Rubin, D.B. Multiple Imputation for Nonresponse in Surveys; John Wiley & Sons, Inc.: New York, NY, USA, 1987. [Google Scholar]
  49. Rubin, D.B. Multiple Imputation after 18+ Years. J. Am. Stat. Assoc. 1996, 91, 473–489. [Google Scholar] [CrossRef]
  50. Hauck, C.; Weiß, A.; Schulte, E.M.; Meule, A.; Ellrott, T. Prevalence of “Food Addiction” as Measured with the Yale Food Addiction Scale 2.0 in a Representative German Sample and Its Association with Sex, Age and Weight Categories. Obes. Facts 2017, 10, 12–24. [Google Scholar] [CrossRef]
  51. Flint, A.J.; Gearhardt, A.N.; Corbin, W.R.; Brownell, K.D.; Field, A.E.; Rimm, E.B. Food-addiction scale measurement in 2 cohorts of middle-aged and older women. Am. J. Clin. Nutr. 2014, 99, 578–586. [Google Scholar] [CrossRef]
  52. Shlisky, J.; Bloom, D.E.; Beaudreault, A.R.; Tucker, K.L.; Keller, H.H.; Freund-Levi, Y.; Fielding, R.A.; Cheng, F.W.; Jensen, G.L.; Wu, D.; et al. Nutritional considerations for healthy aging and reduction in age-related chronic disease. Adv. Nutr. 2017, 8, 17–26. [Google Scholar] [CrossRef] [Green Version]
  53. Van den Beld, A.W.; Kaufman, J.M.; Zillikens, M.C.; Lamberts, S.W.J.; Egan, J.M.; van der Lely, A.J. The physiology of endocrine systems with ageing. Lancet Diabetes Endocrinol. 2018, 6, 647–658. [Google Scholar] [CrossRef] [Green Version]
  54. Gearhardt, A.N.; Boswell, R.G.; White, M.A. The association of “food addiction” with disordered eating and body mass index. Eat. Behav. 2014, 15, 427–433. [Google Scholar] [CrossRef] [Green Version]
  55. Pedram, P.; Wadden, D.; Amini, P.; Gulliver, W.; Randell, E.; Cahill, F.; Vasdev, S.; Goodridge, A.; Carter, J.C.; Zhai, G.; et al. Food Addiction: Its Prevalence and Significant Association with Obesity in the General Population. PLoS ONE 2013, 8, e74832. [Google Scholar] [CrossRef] [Green Version]
  56. Siren, R.; Eriksson, J.G.; Vanhanen, H. Waist circumference a good indicator of future risk for type 2 diabetes and cardiovascular disease. BMC Public Health 2012, 12, 1–6. [Google Scholar] [CrossRef] [PubMed]
  57. Hruby, A.; Hu, F.B. The Epidemiology of Obesity: A Big Picture. Pharmacoeconomics 2015, 33, 673–689. [Google Scholar] [CrossRef] [PubMed]
  58. Pedram, P.; Sun, G. Hormonal and dietary characteristics in obese human subjects with and without food addiction. Nutrients 2015, 7, 223–238. [Google Scholar] [CrossRef] [PubMed] [Green Version]
  59. Sarkar, S.; Kochhar, K.P.; Khan, N.A. Fat addiction: Psychological and physiological trajectory. Nutrients 2019, 11, 2785. [Google Scholar] [CrossRef] [Green Version]
  60. Heiskanen, T.H.; Niskanen, L.K.; Hintikka, J.J.; Koivumaa-Honkanen, H.T.; Honkalampi, K.M.; Haatainen, K.M.; Viinamäki, H.T. Metabolic Syndrome and Depression: A Cross-Sectional Analysis. J. Clin. Psychiatry 2006, 67, 1422–1427. [Google Scholar] [CrossRef]
  61. Skilton, M.R.; Moulin, P.; Terra, J.L.; Bonnet, F. Associations between Anxiety, Depression, and the Metabolic Syndrome. Biol. Psychiatry 2007, 62, 1251–1257. [Google Scholar] [CrossRef] [PubMed]
  62. Dunbar, J.A.; Reddy, P.; Davis-Lameloise, N.; Philpot, B.; Laatikainen, T.; Kilkkinen, A.; Bunker, S.J.; Best, J.D.; Vartiainen, E.; Lo, S.K.; et al. Depression: An important comorbidity with metabolic syndrome in a general population. Diabetes Care 2008, 31, 2368–2373. [Google Scholar] [CrossRef] [Green Version]
  63. Koponen, H.; Jokelainen, J.; Keinänen-Kiukaanniemi, S.; Kumpusalo, E.; Vanhala, M. Metabolic Syndrome Predisposes to Depressive Symptoms: A Population-Based 7-Year Follow-Up Study. J. Clin. Psychiatry 2008, 69, 178. [Google Scholar] [CrossRef]
  64. Simon, G.E.; Ludman, E.J.; Linde, J.A.; Operskalski, B.H.; Ichikawa, L.; Rohde, P.; Finch, E.A.; Jeffery, R.W. Association between obesity and depression in middle-aged women. Gen. Hosp. Psychiatry 2008, 30, 32–39. [Google Scholar] [CrossRef] [Green Version]
  65. Hryhorczuk, C.; Sharma, S.; Fulton, S.E. Metabolic disturbances connecting obesity and depression. Front. Neurosci. 2013, 7, 177. [Google Scholar] [CrossRef] [PubMed] [Green Version]
  66. Munguía, L.; Jiménez-Murcia, S.; Granero, R.; Baenas, I.; Agüera, Z.; Sánchez, I.; Codina, E.; del Pino-Gutiérrez, A.; Testa, G.; Treasure, J.; et al. Emotional regulation in eating disorders and gambling disorder: A transdiagnostic approach. J. Behav. Addict. 2021. [Google Scholar] [CrossRef] [PubMed]
  67. Beranuy, M.; Machimbarrena, J.M.; Vega-Osés, M.A.; Carbonell, X.; Griffiths, M.D.; Pontes, H.M.; González-Cabrera, J. Spanish Validation of the Internet Gaming Disorder Scale–Short Form (IGDS9-SF): Prevalence and Relationship with Online Gambling and Quality of Life. Int. J. Environ. Res. Public Health 2020, 17, 1562. [Google Scholar] [CrossRef] [PubMed] [Green Version]
  68. Feng, T.; Feng, Z.; Jiang, L.; Yu, Q.; Liu, K. Associations of health behaviors, food preferences, and obesity patterns with the incidence of mild cognitive impairment in the middle-aged and elderly population: An 18-year cohort study. J. Affect. Disord. 2020, 275, 180–186. [Google Scholar] [CrossRef]
  69. Torres, S.J.; Lautenschlager, N.T.; Wattanapenpaiboon, N.; Greenop, K.R.; Beer, C.; Flicker, L.; Alfonso, H.; Nowson, C.A. Dietary patterns are associated with cognition among older people with mild cognitive impairment. Nutrients 2012, 4, 1542–1551. [Google Scholar] [CrossRef] [Green Version]
  70. Scarmeas, N.; Stern, Y.; Mayeux, R.; Manly, J.J.; Schupf, N.; Luchsinger, J.A. Mediterranean Diet and Mild Cognitive Impairment. Arch. Neurol. 2009, 66, 216–225. [Google Scholar] [CrossRef] [PubMed] [Green Version]
  71. Burmeister, J.M.; Hinman, N.; Koball, A.; Hoffmann, D.A.; Carels, R.A. Food addiction in adults seeking weight loss treatment. Implications for psychosocial health and weight loss. Appetite 2013, 60, 103–110. [Google Scholar] [CrossRef] [PubMed]
  72. Sawamoto, R.; Nozaki, T.; Nishihara, T.; Furukawa, T.; Hata, T.; Komaki, G.; Sudo, N. Predictors of successful long-term weight loss maintenance: A two-year follow-up. Biopsychosoc. Med. 2017, 11, 1–10. [Google Scholar] [CrossRef]
  73. Gordon, E.L.; Merlo, L.J.; Durning, P.E.; Perri, M.G. Longitudinal Changes in Food Addiction Symptoms and Body Weight among Adults in a Behavioral Weight-Loss Program. Nutrients 2020, 12, 3687. [Google Scholar] [CrossRef] [PubMed]
  74. Murray, S.M.; Tweardy, S.; Geliebter, A.; Avena, N.M. A Longitudinal Preliminary Study of Addiction-Like Responses to Food and Alcohol Consumption Among Individuals Undergoing Weight Loss Surgery. Obes. Surg. 2019, 29, 2700–2703. [Google Scholar] [CrossRef]
  75. Sevinçer, G.M.; Konuk, N.; Bozkurt, S.; Coşkun, H. Food addiction and the outcome of bariatric surgery at 1-year: Prospective observational study. Psychiatry Res. 2016, 244, 159–164. [Google Scholar] [CrossRef] [PubMed]
Figure 1. Evolution of the BMI (kg/m2) during the study. Note. Dash line: polynomial quadratic trend. Sample size: n = 434.
Nutrients 13 02779 g001
Table 1. Descriptive for the sample at baseline.
Total Sample (n = 448)FA Negative (n = 422)FA Positive (n = 26)
n%n%n%χ2dfp
SexMale21748.4%20849.3%934.6%2.1110.146
Female23151.6%21450.7%1765.4%
OriginEurope44098.2%41598.3%2596.2%0.6710.414
South America81.8%71.7%13.8%
Civil statusSingle173.8%163.8%13.8%4.1430.247
Married35178.3%33378.9%1869.2%
Divorced-separated306.7%296.9%13.8%
Widowed5011.2%4410.4%623.1%
SchoolUniversity (high)429.4%389.0%415.4%1.3930.708
University (grade)378.3%358.3%27.7%
Secondary12928.8%12329.1%623.1%
Primary24053.6%22653.6%1453.8%
EmploymentUnemployed8017.9%7618.0%415.4%1.4840.831
Work at home4610.3%4310.2%311.5%
Retired28864.3%27164.2%1765.4%
Unemployed (incomes)214.7%194.5%27.7%
Unemployed (no-incomes)132.9%133.1%00.0%
Group weightOver-weight12327.5%12228.9%13.8%14.6430.002 *
Obesity I (BMI 30-35)21848.7%20648.8%1246.2%
Obesity II (BMI 35–40)10323.0%9021.3%1350.0%
Obesity III (BMI >40)40.9%40.9%00.0%
MeanSDMeanSDMeanSDFdfp
Age, years-old65.254.6365.224.6365.734.640.301.4460.582
Note. SD: standard deviation. df: degrees of freedom. * Bold: significant comparison.
Table 2. Comparison of metabolic and dietary measures.
FA Negative (n = 422)FA Positive (n = 26)
MeanSDMeanSDp|d|
Total cholesterol, mg/dL207.7040.10215.0036.630.3660.19
Triglycerides, mg/dL160.8177.69155.0881.020.7160.07
LDL cholesterol, mg/dL125.6533.69128.5832.470.6660.09
HDL cholesterol, mg/dL51.1112.9555.4610.020.0930.38
Albumin, g/dL4.430.504.520.240.4010.21
Glucose, mg/dL116.8130.18110.8118.530.3170.24
Insulin, mIU/ml18.688.6418.368.370.8550.04
HOMA-IR5.453.085.132.660.6070.11
HbA1c, %6.130.766.100.810.8490.04
Alanine aminotransferase, U/L26.9512.6023.2011.100.1390.32
Aspartate aminotransferase, U/L24.128.4522.856.810.4540.17
Systolic blood pressure, mm Hg140.7515.03139.6913.210.7250.07
Diastolic blood pressure, mmHg79.939.5079.739.760.9180.02
Physical activity total energy expenditure, MET·min/week849.05801.20769.23832.430.6230.10
Weight, kg85.4213.3991.2914.500.031 *0.42
BMI, kg/m232.383.3935.063.07<0.001 *0.83
Waist circumference, cm107.5310.15111.8811.020.035 *0.41
Total energy intake, kcal/day2398.66573.702527.12815.430.2820.18
Carbohydrate, g/d241.4078.35245.1292.330.8160.04
Carbohydrate, %39.936.5338.487.040.2760.21
Protein, g/d100.5720.83104.9726.460.3040.19
Protein, %17.102.9017.202.870.8690.03
Total fat, g/d107.6628.71119.4746.040.0520.31
Total fat, %40.526.1242.555.660.0990.35
SFAs, g27.699.2131.6512.890.039 *0.35
SFAs, %10.331.9211.151.990.034 *0.42
MUFAs, g/d55.2814.9863.5325.870.010 *0.39
MUFAs, %20.914.2022.703.750.035 *0.45
PUFAs, g/d18.126.5819.588.190.2800.20
PUFAs, %6.801.806.931.410.7100.08
Trans fatty acids, g/d0.650.410.870.500.009 *0.48
Prevalencen%n%p|h|
Hypertension 31775.1%2388.5%0.1230.35
Diabetes12128.7%623.1%0.5390.13
Hypercholesterolemia21651.2%1350.0%0.9070.02
Note. SD: standard deviation, MET, metabolic equivalent of task, SFA: saturated fatty acids, MUFA: monounsaturated fatty acids, PUFA: polyunsaturated fatty acids. * Bold: significant comparison. Bold: effect size into the range mild–moderate to high–large.
Table 3. Comparison of psychological measures.
FA Negative (n = 422)FA Positive (n = 26)
MeanSDMeanSDp|d|
BDI total score7.976.4214.929.38<0.001 *0.87
SF-36 total score78.3416.3563.4618.33<0.001 *0.86
SF-36 physical function75.8418.9863.2718.050.001 *0.68
SF-36 physical role77.8633.3348.0841.79<0.001 *0.79
SF-36 physical pain70.4322.5462.3121.410.0750.37
SF-36 general health76.2116.7866.9217.270.007 *0.55
SF-36 vitality62.7320.2846.1522.06<0.001 *0.78
SF-36 social function92.4814.2984.7319.110.009 *0.46
SF-36 emotional role87.9228.1967.9642.690.001 *0.55
SF-36 mental health75.1018.8364.3117.890.005 *0.59
MoCA total23.584.3121.426.540.017 *0.39
* Bold: significant comparison. Bold: effect size into the range mild–moderate to high–large.
Publisher’s Note: MDPI stays neutral with regard to jurisdictional claims in published maps and institutional affiliations.

