Article

Two Dimensions of Nutritional Value: Nutri-Score and NOVA

1
Scientific Support Unit (i+12), Hospital Universitario 12 de Octubre, 28041 Madrid, Spain
2
Clinical Research Support Network ISCIII, 28040 Madrid, Spain
3
Faculty of Biological Sciences, Universidad Complutense de Madrid (UCM), 28040 Madrid, Spain
4
Consorcio de Investigación Biomédica en Red de Epidemiología y Salud Pública (CIBEResp), 28029 Madrid, Spain
5
Faculty of Statistics, Universidad Complutense de Madrid (UCM), 28040 Madrid, Spain
6
Faculty of Medicine, Universidad Complutense de Madrid (UCM), 28040 Madrid, Spain
*
Author to whom correspondence should be addressed.
Nutrients 2021, 13(8), 2783; https://doi.org/10.3390/nu13082783
Submission received: 20 June 2021 / Revised: 11 August 2021 / Accepted: 12 August 2021 / Published: 13 August 2021
(This article belongs to the Section Nutrition and Public Health)

Abstract

:
Front-of-pack labels can improve the ability of consumers to identify which foods are healthier, making them a useful public health tool. Nutri-Score is a front-of-pack labelling system adopted by several European countries. This system ranks foods according to their nutritional quality, but does not consider other dimensions such as the degree of food processing. The aim of this study is to compare the nutritional quality (as assessed by Nutri-Score) and the ultra-processing (as assessed by the NOVA classification) of foods in the Open Food Facts database. A simple correspondence analysis was carried out to study the relationship between the two systems. Ultra-processed foods (NOVA 4) were found in all Nutri-Score categories, ranging from 26.08% in nutritional category A, 51.48% in category B, 59.09% in category C, 67.39% in category D to up to 83.69% in nutritional category E. Given the negative effect that the consumption of ultra-processed foods has on different aspects of health, front-of-pack labelling with Nutri-Score should at least be accompanied by complementary labelling indicating the level of processing, such as the NOVA classification.

1. Introduction

One of the main objectives of public health in developed countries is to prevent the growth of the most prevalent chronic non-communicable diseases (NCDs). NCDs now account for more than one-half of the global burden of disease. In recent decades, dietary habits have changed, and these changes have been paralleled to an increase in NCDs [1,2,3]. Those diseases are highly related to the excessive or unbalanced consumption of certain foods and/or nutrients [4,5,6]. Spain, despite following a Mediterranean diet with beneficial health effects [7,8], has to deal with nutritional problems that have a substantial human, social and economic cost.
To achieve an improvement in nutritional status and avoid chronic nutrition-related diseases, international organisations have recommended several strategies. Nutritional labelling is one of the tools proposed by public health policies to promote healthy dietary choices, which is regulated by the European Union. This is a cost-effective tool for communicating nutritional information to consumers at the point of sale, allowing them to better understand the food they buy and consume [9]. Although food labelling is mandatory in most countries, the application of nutrition labelling differs from country to country. In November 2018, the Spanish Ministry of Health announced the official adoption of the front-of-pack nutrition label Nutri-Score [10]. This type of front-of-pack labelling was also adopted in France and Belgium and is under discussion to be adopted by other European countries. The implementation of new labels is due to the fact that the current nutritional information on food packaging is difficult to read and understand for consumers, and most of them do not use this information during their purchases [11,12]. This new front labelling is a coloured logo associated with letters that describe nutritional quality. Nutri-Score divides foods into five categories ranging from A (most healthy) to E (least healthy) depending on their nutritional quality. This labelling system takes into account the nutrient composition as the excessive intake of some nutrients has negative effects on health [13,14,15,16,17,18]. Theoretically, Nutri-Score allows consumers at the time of purchase to easily assess the nutritional quality of foods and also encourages manufacturing companies to improve the nutritional composition of their food products [19].
In the last few years, some attention has been paid to the growing importance of food processing. NOVA [20,21] is a food classification system that divides foods according to the degree of processing, rather than in terms of nutrients. Processed foods, according to the NOVA classification, are products made from unprocessed or minimally processed foods with added oil, sugar, salt or other common culinary ingredients. The term “ultra-processed food” was introduced by NOVA. This term is intended to identify industrially formulated products made from substances extracted from food or synthesised in laboratories. Ultra-processed foods are usually products with a lower nutritional quality [22,23,24,25]. Recently, it has been shown that the consumption of ultra-processed foods leads to NCDs such as obesity, hypertension, dyslipidaemia or cancer [26,27,28,29,30]. In addition, some studies reported results on the negative effect of ultra-processed food consumption on all-cause mortality [31,32,33,34,35]. Based on this, the NOVA system, proposed by Monteiro et al. [20,21], is widely used worldwide as a method to classify foods according to their degree of processing and to predict the risk of developing NCDs [36,37]. As both the consumption of ultra-processed foods and the prevalence of NCDs continue to increase, there is a need to provide more detailed nutrition information on food labels. In this way, a label that addresses the degree of food processing could be useful for public health and complementary to existing labels.
The aim of this study is to compare the classification of foods on the Spanish market from the Open Food Facts database using the Nutri-Score and NOVA systems and detect ultra-processed products that are misclassified by the Nutri-Score system.

2. Materials and Methods

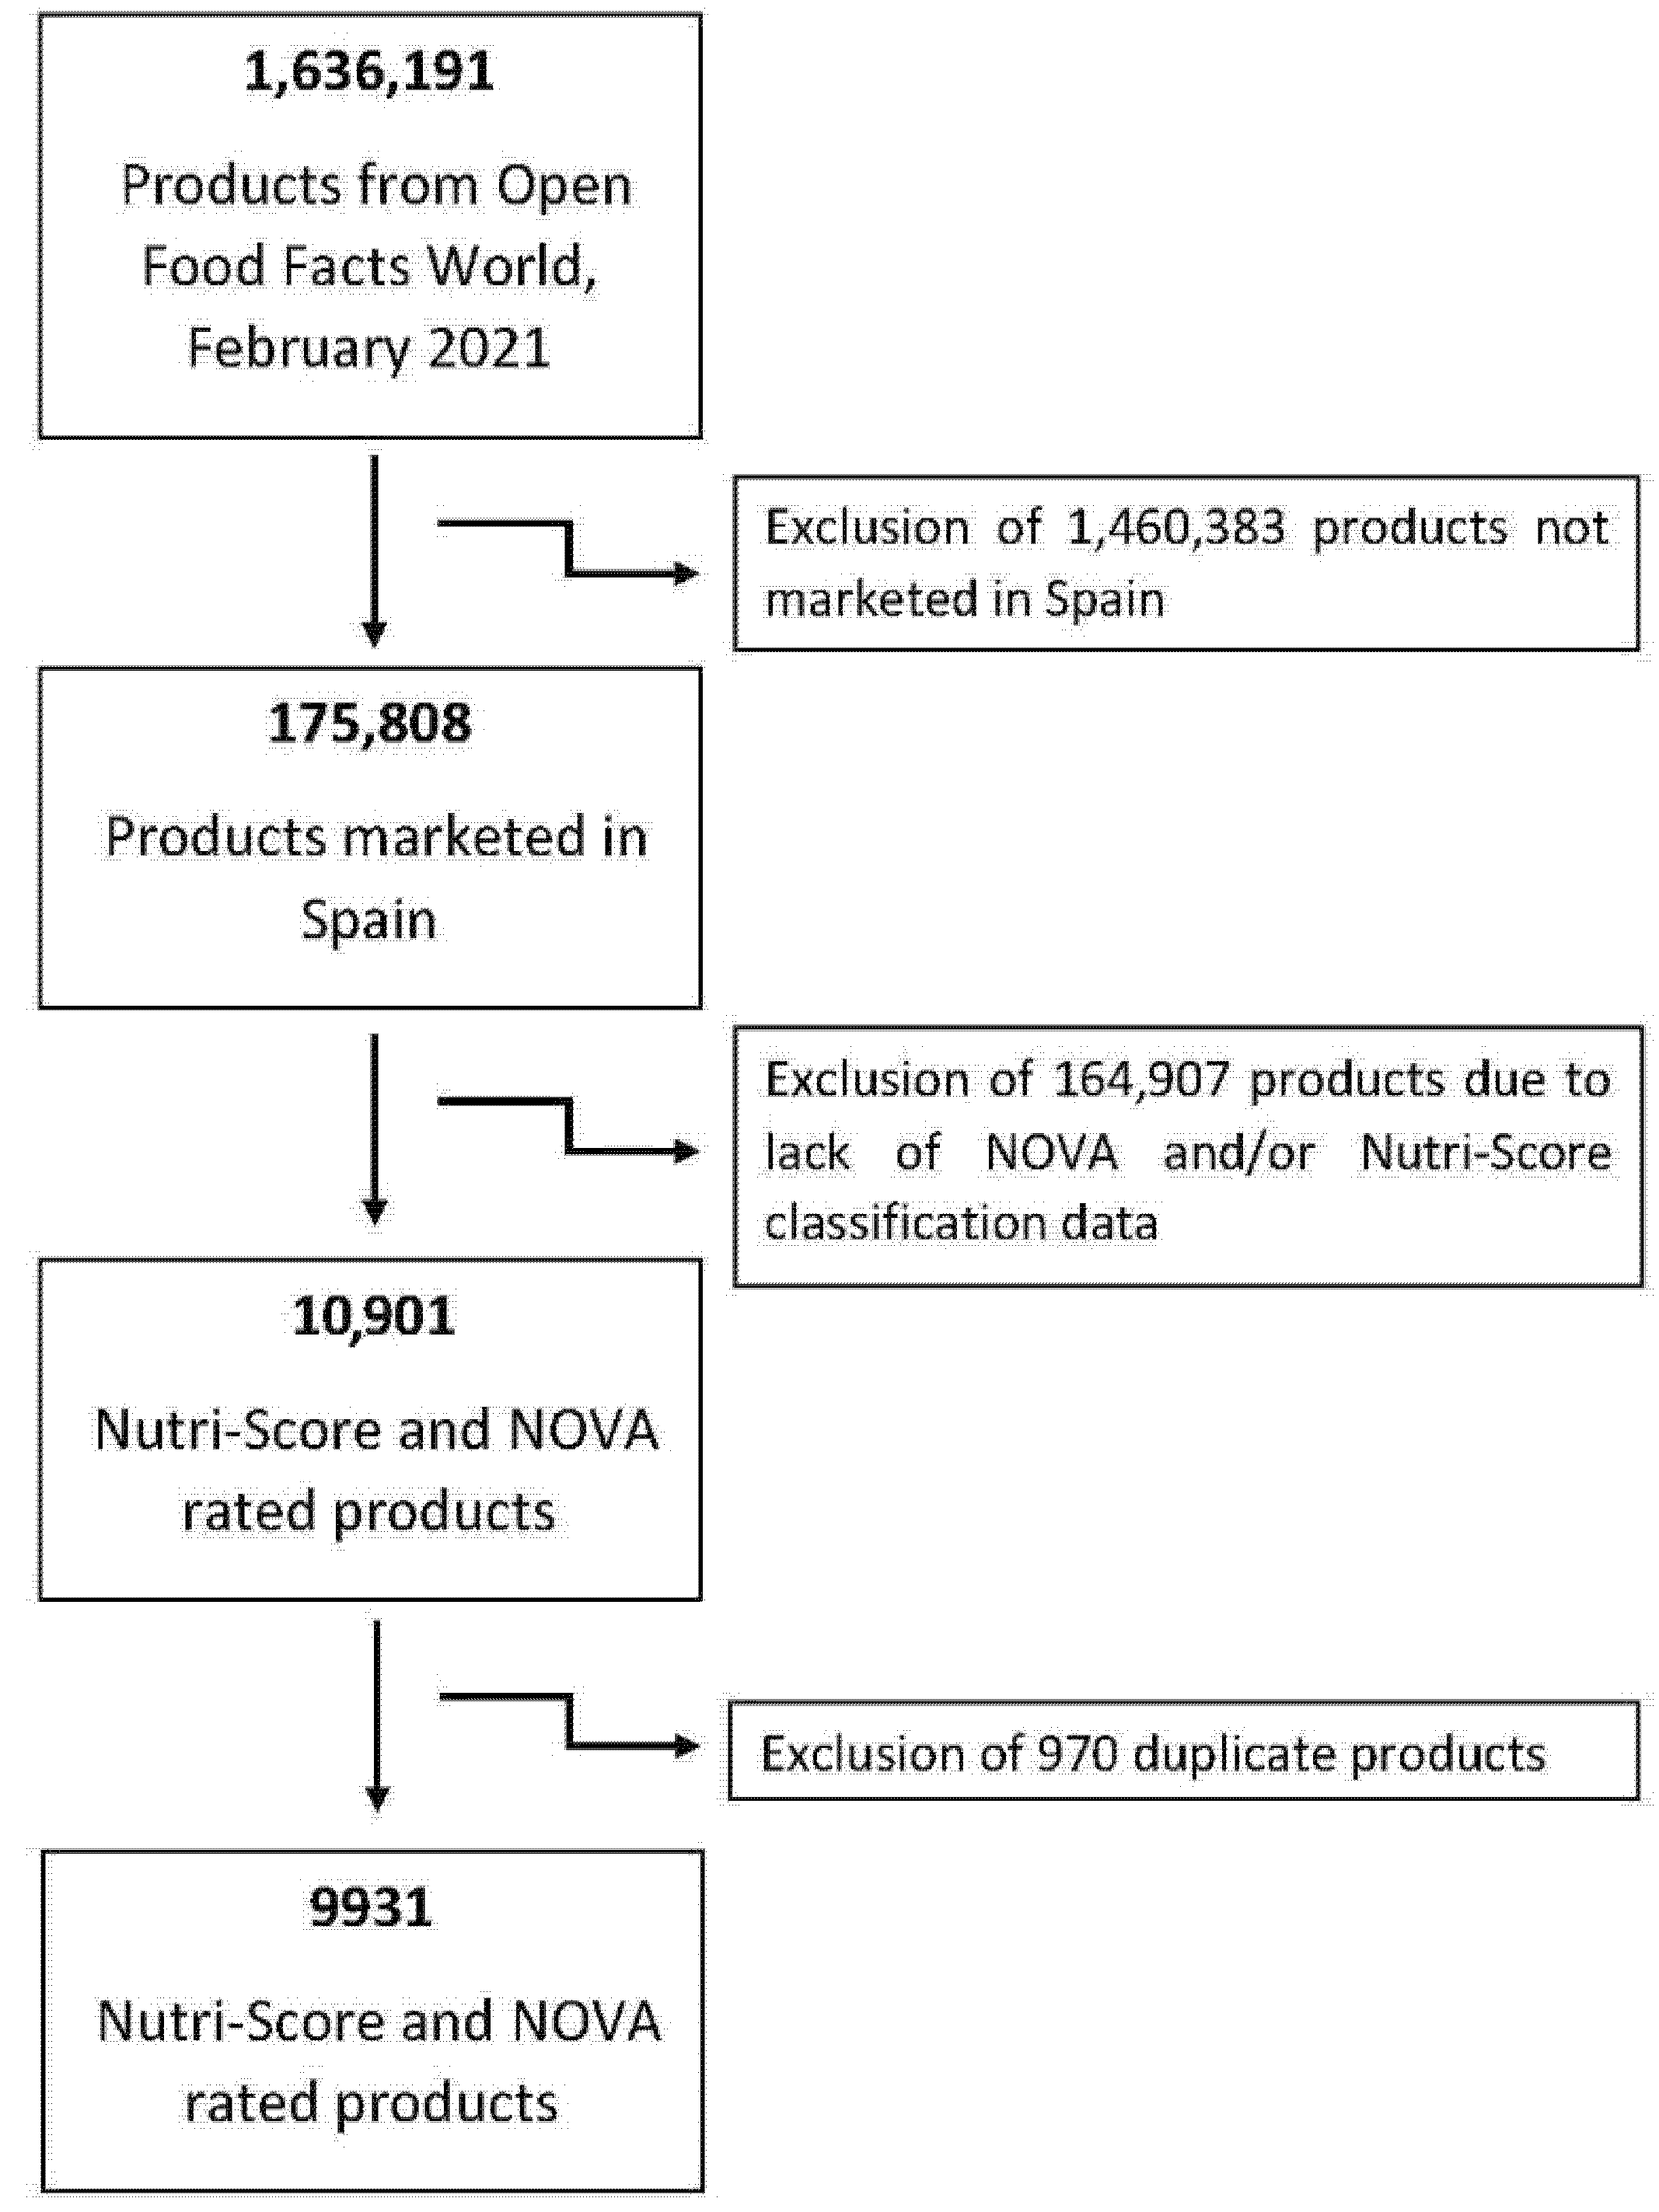
2.1. Open Food Facts Database

The Open Food Facts database was used to obtain the ranking of foods using the NOVA and Nutri-Score systems (https://world.openfoodfacts.org/, accessed on 24 February 2021). Open Food Facts is a collaborative project of food products traded worldwide. This database has an Open Database License (ODBL) and contains nutritional data (ingredients, allergens, nutritional properties and all the information that can be found on product labels) on hundreds of thousands of products. For this study, data were collected from the Open Food Facts database on 24 February 2021. Duplicates (or different presentations, for example, packs “×4” or “×6”) for products of the same composition and brand were eliminated. All products currently marketed in Spain with Nutri-Score and NOVA classification were included (n = 9931, see flow chart in Figure 1).

2.2. Nutrient Quality Classification System of Foods—Nutri-Score

The nutritional quality of the food was established using Nutri-Score [10]. Nutri-Score is a front-of-pack nutrition label that translates the nutritional quality of a product into a five-letter code (A, B, C, D and E), each letter corresponding to a different colour. The algorithm on which Nutri-Score is based is on a continuous and discrete scale ranging from +40 (least healthy) to −15 (most healthy). Energy, total sugar, saturated fat and sodium score negative points, while fruit and vegetables, nuts and legumes, protein and fibre score positive points. The total sum of the score is divided into five groups (group A includes scores between −15 and −1, group B includes scores between 0 and 2, group C includes scores between 3 and 10, group D includes scores between 11 and 18, and group E includes scores between 19 and 40).

2.3. Degree of Processing Classification System of Foods—NOVA

The degree of food processing was established using the NOVA classification [20,21]. NOVA establishes four groups: group 1 collects unprocessed or minimally processed foods; group 2 describes processed culinary ingredients; group 3 comprises processed foods; group 4 includes all ultra-processed foods. The differences between the NOVA 4 and NOVA 3 groups are based on the type and amount of components and additives included, and the use of whole grains or refined foods. Ultra-processed foods (NOVA 4) are considered industrial preparations made from food-derived or laboratory-synthesised substances (flavourings, colourants and other common additives) that usually contain little or no whole foods.

2.4. Statistical Analysis

All statistical analyses were performed with SAS© software (SAS Institute Inc., Cary, NC, USA), Version 9.4 of the SAS System for Windows. Descriptive data were expressed as absolute or relative frequencies for categorical variables and continuous variables were presented as median and interquartile range (IQR). The relationship between the two categorical variables that classify foods (NOVA and Nutri-Score) was described by simple correspondence analysis. This relationship was represented by a ternary diagram. The ternary diagram is a triangular graph that visualises in a two-dimensional way the relationships between Nutri-Score (represented by dots in the diagram) and the percentage of ultra-processed foods according to the NOVA classification (represented on each of the three axes).

3. Results

Of the 9931 foods included in the study, according to Nutri-Score, the most frequent category was D with 25.96% followed by C with 23.03% of the total. According to the NOVA classification, the group with the highest frequency was ultra-processed foods (NOVA 4) with 56.45% (Figure 2). Of all foods classified as NOVA 4 in the database, 75.50% were classified as medium–low nutritional quality (C, D and E) by Nutri-Score.
All Nutri-Score groups included a considerable percentage of ultra-processed foods (NOVA 4), ranging from 26.08% in nutritional category A (the category of highest nutritional quality) to 83.69% in nutritional category E (the category of lowest nutritional quality) (Table 1).
In the ternary diagram (Figure 3), the NOVA 2 group is not shown because it only accounted for 1% of the total data. The axes of the diagram correspond to the percentage of foods belonging to NOVA 1, NOVA 3 and NOVA 4 (these percentages are also shown in Table 1). The dots represented inside the triangle correspond to the five Nutri-Score rankings (A, B, C, D and E) according to the amount of products they included from each of the different NOVA groups. As an example of interpretation, using the Nutri-Score category A represented with dashed lines in Figure 3, 40.34% of the foods classified in this category belong to unprocessed or minimally processed foods (NOVA 1), 33.52% correspond to processed foods (NOVA 3) and 26.08% to ultra-processed foods (NOVA 4). This interpretation can be performed in the same way for the rest of the dots in the diagram. As can be seen in the diagram, Nutri-Score categories B, C and D have a similar percentage of NOVA 3 and NOVA 4. In addition, NOVA 1 values are related in categories B, C, D and E.
As shown in the ternary diagram, even the Nutri-Score A category (highest nutritional quality category) included ultra-processed foods (26.08%). The main ultra-processed food groups included in the Nutri-Score A classification were: dairy products (21.92%), ready meals and canned dishes (18.72%), vegetarian/vegan ready meals (14.63%), flavoured plant-based drinks (10.68%) and pastries and cookies (8.06%) (Table 2).
When studying the Nutri-Score as a continuous score, as can be seen in Figure 4, the score underpinning Nutri-Score (the lower the score, the better the nutritional quality and, conversely, the higher the score, the lower the nutritional quality) is lower for unprocessed or minimally processed foods (NOVA 1), while for ultra-processed foods (NOVA 4) it is higher. Even so, the median values for the ultra-processed food group are quite low (11 (3 to 17)) on a scale where the upper limit is 40 points, and the categories indicating worse nutritional quality (D and E) range from 11 points to 40.

4. Discussion

Ultra-processed foods are products of lower nutritional quality [22,23,24,25], so most of these products should be classified in Nutri-Score as class C, D or E. In this study, we found that only 75.50% of ultra-processed foods (NOVA 4) are rated as medium–low nutritional quality (C, D and E) in Nutri-Score. These data are in line with those provided by another study where the authors found that 79.00% of ultra-processed foods were classified as medium–low nutritional quality by Nutri-Score [38]. It is noteworthy that all Nutri-Score categories include ultra-processed foods, from 26.08% in the highest nutritional quality category (A) to more than 50% in the rest of the categories from B onwards. Although the proportion of ultra-processed foods is in ascending order in the different Nutri-Score categories, this is quite shocking, as in the Nutri-Score B, C, D and E classifications, at least one out of two foods are ultra-processed (NOVA 4). Consequently, the Nutri-Score system fails to identify all unhealthy foods that can be rated well nutritionally, although they are highly processed and contain many additives. Several studies [39,40] found clear evidence that front-of-pack labels can improve the ability of consumers to identify which foods are healthier, making them a useful tool for public health. However, for these systems to be effective, labels must provide clear and complete information. The Nutri-Score front-of-pack label has several contradictions, since it does not cover all the health dimensions of the food, as we have seen in this study with the degree of food processing. No logo can include all dimensions in a single indicator. Nutri-Score only reports to consumers the overall nutritional quality of foods based on the nutrients they contain. This labelling system allows food to be compared without taking into account the other dimensions of food health, which prevents unhealthy foods from being correctly differentiated. Focusing on the degree of food processing, two products with the same Nutri-Score class can be either an ultra-processed food, or an unprocessed or minimally processed food according to the NOVA classification. If all the necessary information is not available, the consumer may interpret that both foods are equally good because their nutritional quality through Nutri-Score is the same. For example, we find in the Open Food Facts database that a natural yoghurt with just whole milk and active cultures as ingredients is classified as category A or B in the Nutri-Score. On the other hand, most fruit-flavoured yoghurts (e.g., strawberry yoghurts) with added sugar, flavourings and colourings are also classified as category A or B in the Nutri-Score. This leads to an interchangeable choice between the two types of yogurts, whereas the plain yoghurt is an unprocessed or minimally processed food, and the fruit-flavoured yoghurt is an ultra-processed yoghurt with sugar and other additives. The first one is clearly a healthier choice. The same applies to other products such as legume ready meals of different brands, which are high in additives and ultra-processed foods but are classified as category A or B in Nutri-Score, as well as natural pulses or canned pulses, which are unprocessed or minimally processed foods.
It should be noted that the Nutri-Score A category contained a limited but significant number of unhealthy foods (more than a quarter of the foods labelled as A). The main ultra-processed foods included in this category were dairy products or ready meals containing added sugars and additives [41,42]. In addition, most of these foods were plant-based, which is generally considered healthy by consumers [43], so special care should be taken when selecting this type of food.
Food processing has an impact on the food matrix and affects the functionality of foods [44], making them unhealthy foods despite satisfying the nutritional properties estimated from their nutrient content. This can be seen in the data obtained in Figure 4, where foods classified as NOVA 4 had relatively low Nutri-Score values (11 [3,4,5,6,7,8,9,10,11,12,13,14,15,16,17]). These foods may contain nutrients that are rated positively, but the Nutri-Score does not take into account the level of processing they have undergone and the added additives that make them unhealthy. The weight of processing seems to be even greater than the nutrient content, as we eat complex food matrices and not nutrients. Thus, enteral and parenteral nutrient solutions, even if balanced with all known nutrients, cannot compensate for the physiological effect of the food.
Traditionally, the Spanish lifestyle has been based on the Mediterranean diet [45]. However, it is also known that in recent years the Spanish population has been moving away from the traditional dietary pattern towards a less healthy diet [46], which has led to nutritional problems that have an economic and social impact. In this study, we observed that more than a third of the foods on the Spanish market that we studied (3435 out of 9931) correspond to unhealthy foods (foods classified as D and E, and NOVA 4). The increase in the Spanish market of unhealthy foods (generally with aggressive advertising), in addition to the nutritional transition from local and traditional foods to industrial and globalised foods that Europe is experiencing, may be possible causes of these current nutritional problems. Knowing the existing evidence of the negative effect that the consumption of ultra-processed foods has on the different aspects of health [26,36,47] and the WHO recommendations to reduce the consumption of this type of food as much as possible, the front-of-pack labelling with Nutri-Score should at least be accompanied by other complementary labelling indicating the level of processing. Several tools are now available that focus on food processing [48], such as the SIGA classification [44,49], which classifies foods based on the NOVA classification and degree of processing, in addition to other factors. The application of these classifications in a label would allow consumers to know that they are choosing an ultra-processed food, and once the consumer knows this information, they could interpret the nutritional quality of the product through the Nutri-Score. This information not only affects ultra-processed foods, but it could also improve the choice of unprocessed foods.
This study includes information on 9931 products present in the Spanish market from the Open Food Facts (2021) database. It includes foods of all types, not just generic foods, so we consider it to be a representative sample of the variability and quantity of the food supply in the stores of Mediterranean countries such as Spain.

5. Conclusions

Food processing and the nutritional quality of food cover different but complementary dimensions. All Nutri-Score categories include ultra-processed foods (at least 26% ultra-processed foods). Therefore, the information provided by Nutri-Score is incomplete and fails to identify all unhealthy foods. For this reason, labels that indicate the degree of food processing by applying the SIGA or NOVA classification should complement it to enable consumers to make better choices. Furthermore, any front-of-pack food labelling must be accompanied by an educational campaign aimed to raise awareness and guide the consumer to make healthier food choices.

Author Contributions

Conceptualization, D.L.P. and C.R.F.; methodology, D.L.P. and C.R.F.; software, C.R.F.; validation, D.L.P. and C.R.F.; formal analysis, C.R.F.; investigation, C.R.F.; resources, D.L.P.; data curation, C.R.F.; writing—original draft preparation, C.R.F.; writing—review and editing, C.R.F., D.L.P. and A.G.d.l.C.; visualization, A.G.d.l.C.; supervision, A.G.d.l.C.; project administration, A.G.d.l.C.; funding acquisition, A.G.d.l.C. All authors have read and agreed to the published version of the manuscript.

Funding

This research received no external funding and the APC was funded by Research Institute Hospital 12 de Octubre (i+12).

Institutional Review Board Statement

Not applicable.

Informed Consent Statement

Not applicable.

Data Availability Statement

The data used in this study are available in Open Food Facts (https://world.openfoodfacts.org/, accessed on 24 February 2021), an open collaborative database of food products marketed worldwide, licensed under the Open Database License (ODBL).

Acknowledgments

The authors would like to thank all the collaborators of the Scientific Support Unit of the Research Institute Hospital 12 de Octubre for their participation in the study.

Conflicts of Interest

The authors declare no conflict of interest. The funders had no role in the design of the study; in the collection, analyses, or interpretation of data; in the writing of the manuscript, or in the decision to publish the results.

References

  1. Mendis, S.; Davis, S.; Norrving, B. Organizational Update: The World Health Organization Global Status Report on Noncommunicable Diseases 2014; One More Landmark Step in the Combat against Stroke and Vascular Disease. Stroke 2015, 46, e121–e122. [Google Scholar] [CrossRef] [PubMed]
  2. FAO; IFAD; UNICEF; WFP; WHO. The State of Food Security and Nutrition in the World 2021; Food & Agriculture Organization: Rome, Italy, 2021; ISBN 9789251343258. Available online: http://www.fao.org/documents/card/es/c/cb4474en/ (accessed on 8 August 2021).
  3. United Nations Political Declaration of the High-Level Meeting of the General Assembly on the Prevention and Control of Non-Communicable Diseases. 2011. Available online: https://digitallibrary.un.org/record/710899/ (accessed on 11 May 2021).
  4. Hawkes, C. Food Policies for Healthy Populations and Healthy Economies. BMJ 2012, 344, e2801. [Google Scholar] [CrossRef]
  5. Stuckler, D.; McKee, M.; Ebrahim, S.; Basu, S. Manufacturing Epidemics: The Role of Global Producers in Increased Consumption of Unhealthy Commodities Including Processed Foods, Alcohol, and Tobacco. PLoS Med. 2012, 9, e1001235. [Google Scholar] [CrossRef] [PubMed] [Green Version]
  6. Cena, H.; Calder, P.C. Defining a Healthy Diet: Evidence for the Role of Contemporary Dietary Patterns in Health and Disease. Nutrients 2020, 12, 334. [Google Scholar] [CrossRef] [PubMed] [Green Version]
  7. Willett, W.C.; Sacks, F.; Trichopoulou, A.; Drescher, G.; Ferro-Luzzi, A.; Helsing, E.; Trichopoulos, D. Mediterranean Diet Pyramid: A Cultural Model for Healthy Eating. Am. J. Clin. Nutr. 1995, 61, 1402S–1406S. [Google Scholar] [CrossRef]
  8. Sofi, F.; Macchi, C.; Abbate, R.; Gensini, G.F.; Casini, A. Mediterranean Diet and Health Status: An Updated Meta-Analysis and a Proposal for a Literature-Based Adherence Score. Public Health Nutr. 2014, 17, 2769–2782. [Google Scholar] [CrossRef] [Green Version]
  9. Buyuktuncer, Z.; Ayaz, A.; Dedebayraktar, D.; Inan-Eroglu, E.; Ellahi, B.; Besler, H.T. Promoting a Healthy Diet in Young Adults: The Role of Nutrition Labelling. Nutrients 2018, 10, 1335. [Google Scholar] [CrossRef] [PubMed] [Green Version]
  10. Galan, P.; Babio, N. Nutri-Score: El logotipo frontal de información nutricional útil para la salud pública de España que se apoya sobre bases científicas. Nutr. Hosp. 2019, 10, 1213–1222. [Google Scholar]
  11. Cowburn, G.; Stockley, L. Consumer Understanding and Use of Nutrition Labelling: A Systematic Review. Public Health Nutr. 2005, 8, 21–28. [Google Scholar] [CrossRef] [Green Version]
  12. Campos, S.; Doxey, J.; Hammond, D. Nutrition Labels on Pre-Packaged Foods: A Systematic Review. Public Health Nutr. 2011, 14, 1496–1506. [Google Scholar] [CrossRef] [Green Version]
  13. Deschasaux, M.; Huybrechts, I.; Julia, C.; Hercberg, S.; Egnell, M.; Srour, B.; Kesse-Guyot, E.; Latino-Martel, P.; Biessy, C.; Casagrande, C.; et al. Association between Nutritional Profiles of Foods Underlying Nutri-Score Front-of-Pack Labels and Mortality: EPIC Cohort Study in 10 European Countries. BMJ 2020, 370, m3173. [Google Scholar] [CrossRef] [PubMed]
  14. Dehghan, M.; Mente, A.; Zhang, X.; Swaminathan, S.; Li, W.; Mohan, V.; Iqbal, R.; Kumar, R.; Wentzel-Viljoen, E.; Rosengren, A.; et al. Associations of Fats and Carbohydrate Intake with Cardiovascular Disease and Mortality in 18 Countries from Five Continents (PURE): A Prospective Cohort Study. Lancet 2017, 390, 2050–2062. [Google Scholar] [CrossRef] [Green Version]
  15. Yang, Q.; Zhang, Z.; Gregg, E.W.; Flanders, W.D.; Merritt, R.; Hu, F.B. Added Sugar Intake and Cardiovascular Diseases Mortality among US Adults. JAMA Intern. Med. 2014, 174, 516–524. [Google Scholar] [CrossRef] [Green Version]
  16. Mozaffarian, D.; Fahimi, S.; Singh, G.M.; Micha, R.; Khatibzadeh, S.; Engell, R.E.; Lim, S.; Danaei, G.; Ezzati, M.; Powles, J.; et al. Global Sodium Consumption and Death from Cardiovascular Causes. N. Engl. J. Med. 2014, 371, 624–634. [Google Scholar] [CrossRef] [PubMed] [Green Version]
  17. Graudal, N.; Jürgens, G.; Baslund, B.; Alderman, M.H. Compared with Usual Sodium Intake, Low- and Excessive-Sodium Diets Are Associated with Increased Mortality: A Meta-Analysis. Am. J. Hypertens. 2014, 27, 1129–1137. [Google Scholar] [CrossRef] [PubMed] [Green Version]
  18. Julia, C.; Fézeu, L.K.; Ducrot, P.; Méjean, C.; Péneau, S.; Touvier, M.; Hercberg, S.; Kesse-Guyot, E. The Nutrient Profile of Foods Consumed Using the British Food Standards Agency Nutrient Profiling System Is Associated with Metabolic Syndrome in the SU.VI.MAX Cohort. J. Nutr. 2015, 145, 2355–2361. [Google Scholar] [CrossRef] [PubMed]
  19. Egnell, M.; Ducrot, P.; Touvier, M.; Allès, B.; Hercberg, S.; Kesse-Guyot, E.; Julia, C. Objective Understanding of Nutri-Score Front-Of-Package Nutrition Label According to Individual Characteristics of Subjects: Comparisons with Other Format Labels. PLoS ONE 2018, 13, e0202095. [Google Scholar] [CrossRef] [Green Version]
  20. Monteiro, C.A.; Cannon, G.; Levy, R.; Moubarac, J.-C.; Jaime, P.; Martins, A.P.; Canella, D.; Louzada, M.; Parra, D. NOVA. The Star Shines Bright. World Nutr. 2016, 7, 28–38. [Google Scholar]
  21. Monteiro, C.A.; Cannon, G.; Levy, R.B.; Moubarac, J.-C.; Louzada, M.L.; Rauber, F.; Khandpur, N.; Cediel, G.; Neri, D.; Martinez-Steele, E.; et al. Ultra-Processed Foods: What They Are and How to Identify Them. Public Health Nutr. 2019, 22, 936–941. [Google Scholar] [CrossRef]
  22. Luiten, C.M.; Steenhuis, I.H.; Eyles, H.; Ni Mhurchu, C.; Waterlander, W.E. Ultra-Processed Foods Have the Worst Nutrient Profile, yet They Are the Most Available Packaged Products in a Sample of New Zealand Supermarkets—CORRIGENDUM. Public Health Nutr. 2016, 19, 539. [Google Scholar] [CrossRef] [Green Version]
  23. Moubarac, J.-C.; Batal, M.; Louzada, M.L.; Martinez Steele, E.; Monteiro, C.A. Consumption of Ultra-Processed Foods Predicts Diet Quality in Canada. Appetite 2017, 108, 512–520. [Google Scholar] [CrossRef]
  24. da Costa Louzada, M.L.; Ricardo, C.Z.; Steele, E.M.; Levy, R.B.; Cannon, G.; Monteiro, C.A. The Share of Ultra-Processed Foods Determines the Overall Nutritional Quality of Diets in Brazil. Public Health Nutr. 2018, 21, 94–102. [Google Scholar] [CrossRef] [PubMed] [Green Version]
  25. Parra, D.C.; da Costa-Louzada, M.L.; Moubarac, J.-C.; Bertazzi-Levy, R.; Khandpur, N.; Cediel, G.; Monteiro, C.A. Association between Ultra-Processed Food Consumption and the Nutrient Profile of the Colombian Diet in 2005. Salud Publica Mex. 2019, 61, 147–154. [Google Scholar] [CrossRef] [PubMed] [Green Version]
  26. Lane, M.M.; Davis, J.A.; Beattie, S.; Gómez-Donoso, C.; Loughman, A.; O’Neil, A.; Jacka, F.; Berk, M.; Page, R.; Marx, W.; et al. Ultraprocessed Food and Chronic Noncommunicable Diseases: A Systematic Review and Meta-Analysis of 43 Observational Studies. Obes. Rev. 2021, 22, e13146. [Google Scholar] [CrossRef] [PubMed]
  27. Rauber, F.; da Costa Louzada, M.L.; Steele, E.M.; Millett, C.; Monteiro, C.A.; Levy, R.B. Ultra-Processed Food Consumption and Chronic Non-Communicable Diseases-Related Dietary Nutrient Profile in the UK (2008–2014). Nutrients 2018, 10, 587. [Google Scholar] [CrossRef] [Green Version]
  28. de Deus Mendonça, R.; Pimenta, A.M.; Gea, A.; de la Fuente-Arrillaga, C.; Martinez-Gonzalez, M.A.; Lopes, A.C.S.; Bes-Rastrollo, M. Ultraprocessed Food Consumption and Risk of Overweight and Obesity: The University of Navarra Follow-Up (SUN) Cohort Study. Am. J. Clin. Nutr. 2016, 104, 1433–1440. [Google Scholar] [CrossRef]
  29. de Deus Mendonça, R.; Lopes, A.C.S.; Pimenta, A.M.; Gea, A.; Martinez-Gonzalez, M.A.; Bes-Rastrollo, M. Ultra-Processed Food Consumption and the Incidence of Hypertension in a Mediterranean Cohort: The Seguimiento Universidad de Navarra Project. Am. J. Hypertens. 2017, 30, 358–366. [Google Scholar] [CrossRef] [Green Version]
  30. Fiolet, T.; Srour, B.; Sellem, L.; Kesse-Guyot, E.; Allès, B.; Méjean, C.; Deschasaux, M.; Fassier, P.; Latino-Martel, P.; Beslay, M.; et al. Consumption of Ultra-Processed Foods and Cancer Risk: Results from NutriNet-Santé Prospective Cohort. BMJ 2018, 360, k322. [Google Scholar] [CrossRef] [Green Version]
  31. Kim, H.; Hu, E.A.; Rebholz, C.M. Ultra-Processed Food Intake and Mortality in the USA: Results from the Third National Health and Nutrition Examination Survey (NHANES III, 1988-1994). Public Health Nutr. 2019, 22, 1777–1785. [Google Scholar] [CrossRef]
  32. Bonaccio, M.; Di Castelnuovo, A.; Costanzo, S.; De Curtis, A.; Persichillo, M.; Sofi, F.; Cerletti, C.; Donati, M.B.; de Gaetano, G.; Iacoviello, L. Ultra-Processed Food Consumption Is Associated with Increased Risk of All-Cause and Cardiovascular Mortality in the Moli-Sani Study. Am. J. Clin. Nutr. 2021, 113, 446–455. [Google Scholar] [CrossRef]
  33. Rico-Campà, A.; Martínez-González, M.A.; Alvarez-Alvarez, I.; de Deus Mendonça, R.; de la Fuente-Arrillaga, C.; Gómez-Donoso, C.; Bes-Rastrollo, M. Association between Consumption of Ultra-Processed Foods and All Cause Mortality: SUN Prospective Cohort Study. BMJ 2019, 365, l1949. [Google Scholar] [CrossRef] [PubMed] [Green Version]
  34. Blanco-Rojo, R.; Sandoval-Insausti, H.; López-Garcia, E.; Graciani, A.; Ordovás, J.M.; Banegas, J.R.; Rodríguez-Artalejo, F.; Guallar-Castillón, P. Consumption of Ultra-Processed Foods and Mortality: A National Prospective Cohort in Spain. Mayo Clin. Proc. 2019, 94, 2178–2188. [Google Scholar] [CrossRef] [PubMed] [Green Version]
  35. Romero Ferreiro, C.; Martín-Arriscado Arroba, C.; Cancelas Navia, P.; Lora Pablos, D.; Gómez de la Cámara, A. Ultra-Processed Food Intake and All-Cause Mortality: DRECE Cohort Study. Public Health Nutr. 2021, 1–28. [Google Scholar] [CrossRef]
  36. Lawrence, M.A.; Baker, P.I. Ultra-Processed Food and Adverse Health Outcomes. BMJ 2019, 365, l2289. [Google Scholar] [CrossRef] [PubMed]
  37. Elizabeth, L.; Machado, P.; Zinöcker, M.; Baker, P.; Lawrence, M. Ultra-Processed Foods and Health Outcomes: A Narrative Review. Nutrients 2020, 12, 1955. [Google Scholar] [CrossRef]
  38. Galan, P.; Kesse-Guyot, E.; Touvier, M.; Deschasaux, M.; Srour, B.; Chazelas, E.; Baudry, J.; Fialon, M.; Julia, C.; Hercberg, S. Nutri-Score y ultra-procesamiento: Dos dimensiones diferentes, complementarias y no contradictorias. Nutr. Hosp. Organo Soc. Española Nutr. Parenter. Enter. 2021, 38, 201–206. [Google Scholar]
  39. Egnell, M.; Talati, Z.; Hercberg, S.; Pettigrew, S.; Julia, C. Objective Understanding of Front-of-Package Nutrition Labels: An International Comparative Experimental Study across 12 Countries. Nutrients 2018, 10, 1542. [Google Scholar] [CrossRef] [Green Version]
  40. Khandpur, N.; Sato, P.D.M.; Mais, L.A.; Martins, A.P.B.; Spinillo, C.G.; Garcia, M.T.; Rojas, C.F.U.; Jaime, P.C. Are Front-of-Package Warning Labels More Effective at Communicating Nutrition Information than Traffic-Light Labels? A Randomized Controlled Experiment in a Brazilian Sample. Nutrients 2018, 10, 688. [Google Scholar] [CrossRef] [Green Version]
  41. Moore, J.B.; Horti, A.; Fielding, B.A. Evaluation of the Nutrient Content of Yogurts: A Comprehensive Survey of Yogurt Products in the Major UK Supermarkets. BMJ Open 2018, 8, e021387. [Google Scholar] [CrossRef] [Green Version]
  42. Fardet, A. Minimally Processed Foods Are More Satiating and Less Hyperglycemic than Ultra-Processed Foods: A Preliminary Study with 98 Ready-to-Eat Foods. Food Funct. 2016, 7, 2338–2346. [Google Scholar] [CrossRef]
  43. Rosenfeld, D.L.; Burrow, A.L. Vegetarian on Purpose: Understanding the Motivations of Plant-Based Dieters. Appetite 2017, 116, 456–463. [Google Scholar] [CrossRef]
  44. Davidou, S.; Christodoulou, A.; Fardet, A.; Frank, K. The Holistico-Reductionist Siga Classification According to the Degree of Food Processing: An Evaluation of Ultra-Processed Foods in French Supermarkets. Food Funct. 2020, 11, 2026–2039. [Google Scholar] [CrossRef]
  45. Moreiras-Varela, O. The Mediterranean Diet in Spain. Eur. J. Clin. Nutr. 1989, 43 (Suppl. S2), 83–87. [Google Scholar]
  46. León-Muñoz, L.M.; Guallar-Castillón, P.; Graciani, A.; López-García, E.; Mesas, A.E.; Aguilera, M.T.; Banegas, J.R.; Rodríguez-Artalejo, F. Adherence to the Mediterranean Diet Pattern Has Declined in Spanish Adults. J. Nutr. 2012, 142, 1843–1850. [Google Scholar] [CrossRef] [PubMed] [Green Version]
  47. Chen, X.; Zhang, Z.; Yang, H.; Qiu, P.; Wang, H.; Wang, F.; Zhao, Q.; Fang, J.; Nie, J. Consumption of Ultra-Processed Foods and Health Outcomes: A Systematic Review of Epidemiological Studies. Nutr. J. 2020, 19, 86. [Google Scholar] [CrossRef] [PubMed]
  48. Sadler, C.R.; Grassby, T.; Hart, K.; Raats, M.; Sokolović, M.; Timotijevic, L. Processed Food Classification: Conceptualisation and Challenges. Trends Food Sci. Technol. 2021, 112, 149–162. [Google Scholar] [CrossRef]
  49. Davidou, S.; Christodoulou, A.; Frank, K.; Fardet, A. A Study of Ultra-Processing Marker Profiles in 22,028 Packaged Ultra-Processed Foods Using the Siga Classification. J. Food Compos. Anal. 2021, 99, 103848. [Google Scholar] [CrossRef]
Figure 1. Flowchart of the total amount of foods included in the study.
Nutrients 13 02783 g001
Figure 2. Distribution of foods according to Nutri-Score and NOVA classification groups. Nutri-Score groups (A, B, C, D, E). NOVA groups (1, 2, 3, 4). Numbers represent the percentage of total food included in the study (n = 9931).
Nutrients 13 02783 g002
Figure 3. Ternary diagram representing the Nutri-Score categories in accordance with their positions on each of the three axes. Each axis represents the percentage of NOVA groups 1, 3 and 4. NOVA 2 is not shown as it only represented 1% of the data. The dashed lines indicate the coordinates of the different NOVA groups leading to the point where Nutri-Score category A is located (as an example for interpretation).
Nutrients 13 02783 g003
Figure 4. Boxplot showing the Nutri-Score values according to the different food processing categories (NOVA classification). NOVA 2 is not shown as it only represented 1% of the data. The box boundaries represent the interquartile range (IQR) and the line inside the box shows the median value. The black horizontal lines represent the score boundaries of each of the Nutri-Score categories.
Nutrients 13 02783 g004
Table 1. Cross-frequency table between Nutri-Score and NOVA classification. Relative frequencies were calculated by rows.
Nutri-ScoreNOVA 1 *NOVA 2NOVA 3 *NOVA 4 *
A846 (40.34%)1 (0.06%)703 (33.52%)547 (26.08%)
B218 (13.67%)0 (0.00%)556 (34.85%)821 (51.48%)
C142 (6.21%)47 (2.07%)746 (32.63%)1351 (59.09%)
D61 (2.34%)18 (0.73%)762 (29.54%)1738 (67.39%)
E17 (1.23%)17 (1.26%)190 (13.82%)1150 (83.69%)
* These percentages have been represented in the ternary diagram (Figure 3).
Table 2. Relative contribution of ultra-processed food groups (NOVA 4) in the Nutri-Score A classification.
Ultra-Processed Foods (NOVA 4) Classified as Nutri-Score A by Food GroupsN = 547
Dairy products21.92%
  Dairy desserts a31.19%
  Flavoured yoghurts28.44%
  Skimmed and sweetened40.37%
Ready meals and canned dishes18.72%
Vegetarian/vegan ready meals14.63%
Flavoured plant-based drinks10.68%
Pastries and cookies b8.06%
Ultra-processed breads7.88%
Milkshakes and juice boxes6.04%
0% jams and marmalades4.85%
Protein products c3.12%
Sauces and dressings2.70%
Ultra-processed cheese1.40%
a Includes custard, flan or other fermented milk products; b Includes biscuits with sweeteners, wholemeal biscuits or cereal bars; c Includes protein shakes or yoghurts in different flavours.
Publisher’s Note: MDPI stays neutral with regard to jurisdictional claims in published maps and institutional affiliations.

