A 2 Week Cross-over Intervention with a Low Carbohydrate, High Fat Diet Compared to a High Carbohydrate Diet Attenuates Exercise-Induced Cortisol Response, but Not the Reduction of Exercise Capacity, in Recreational Athletes

 , , and
Abstract
1. Introduction
2. Materials and Methods
2.1. Participants
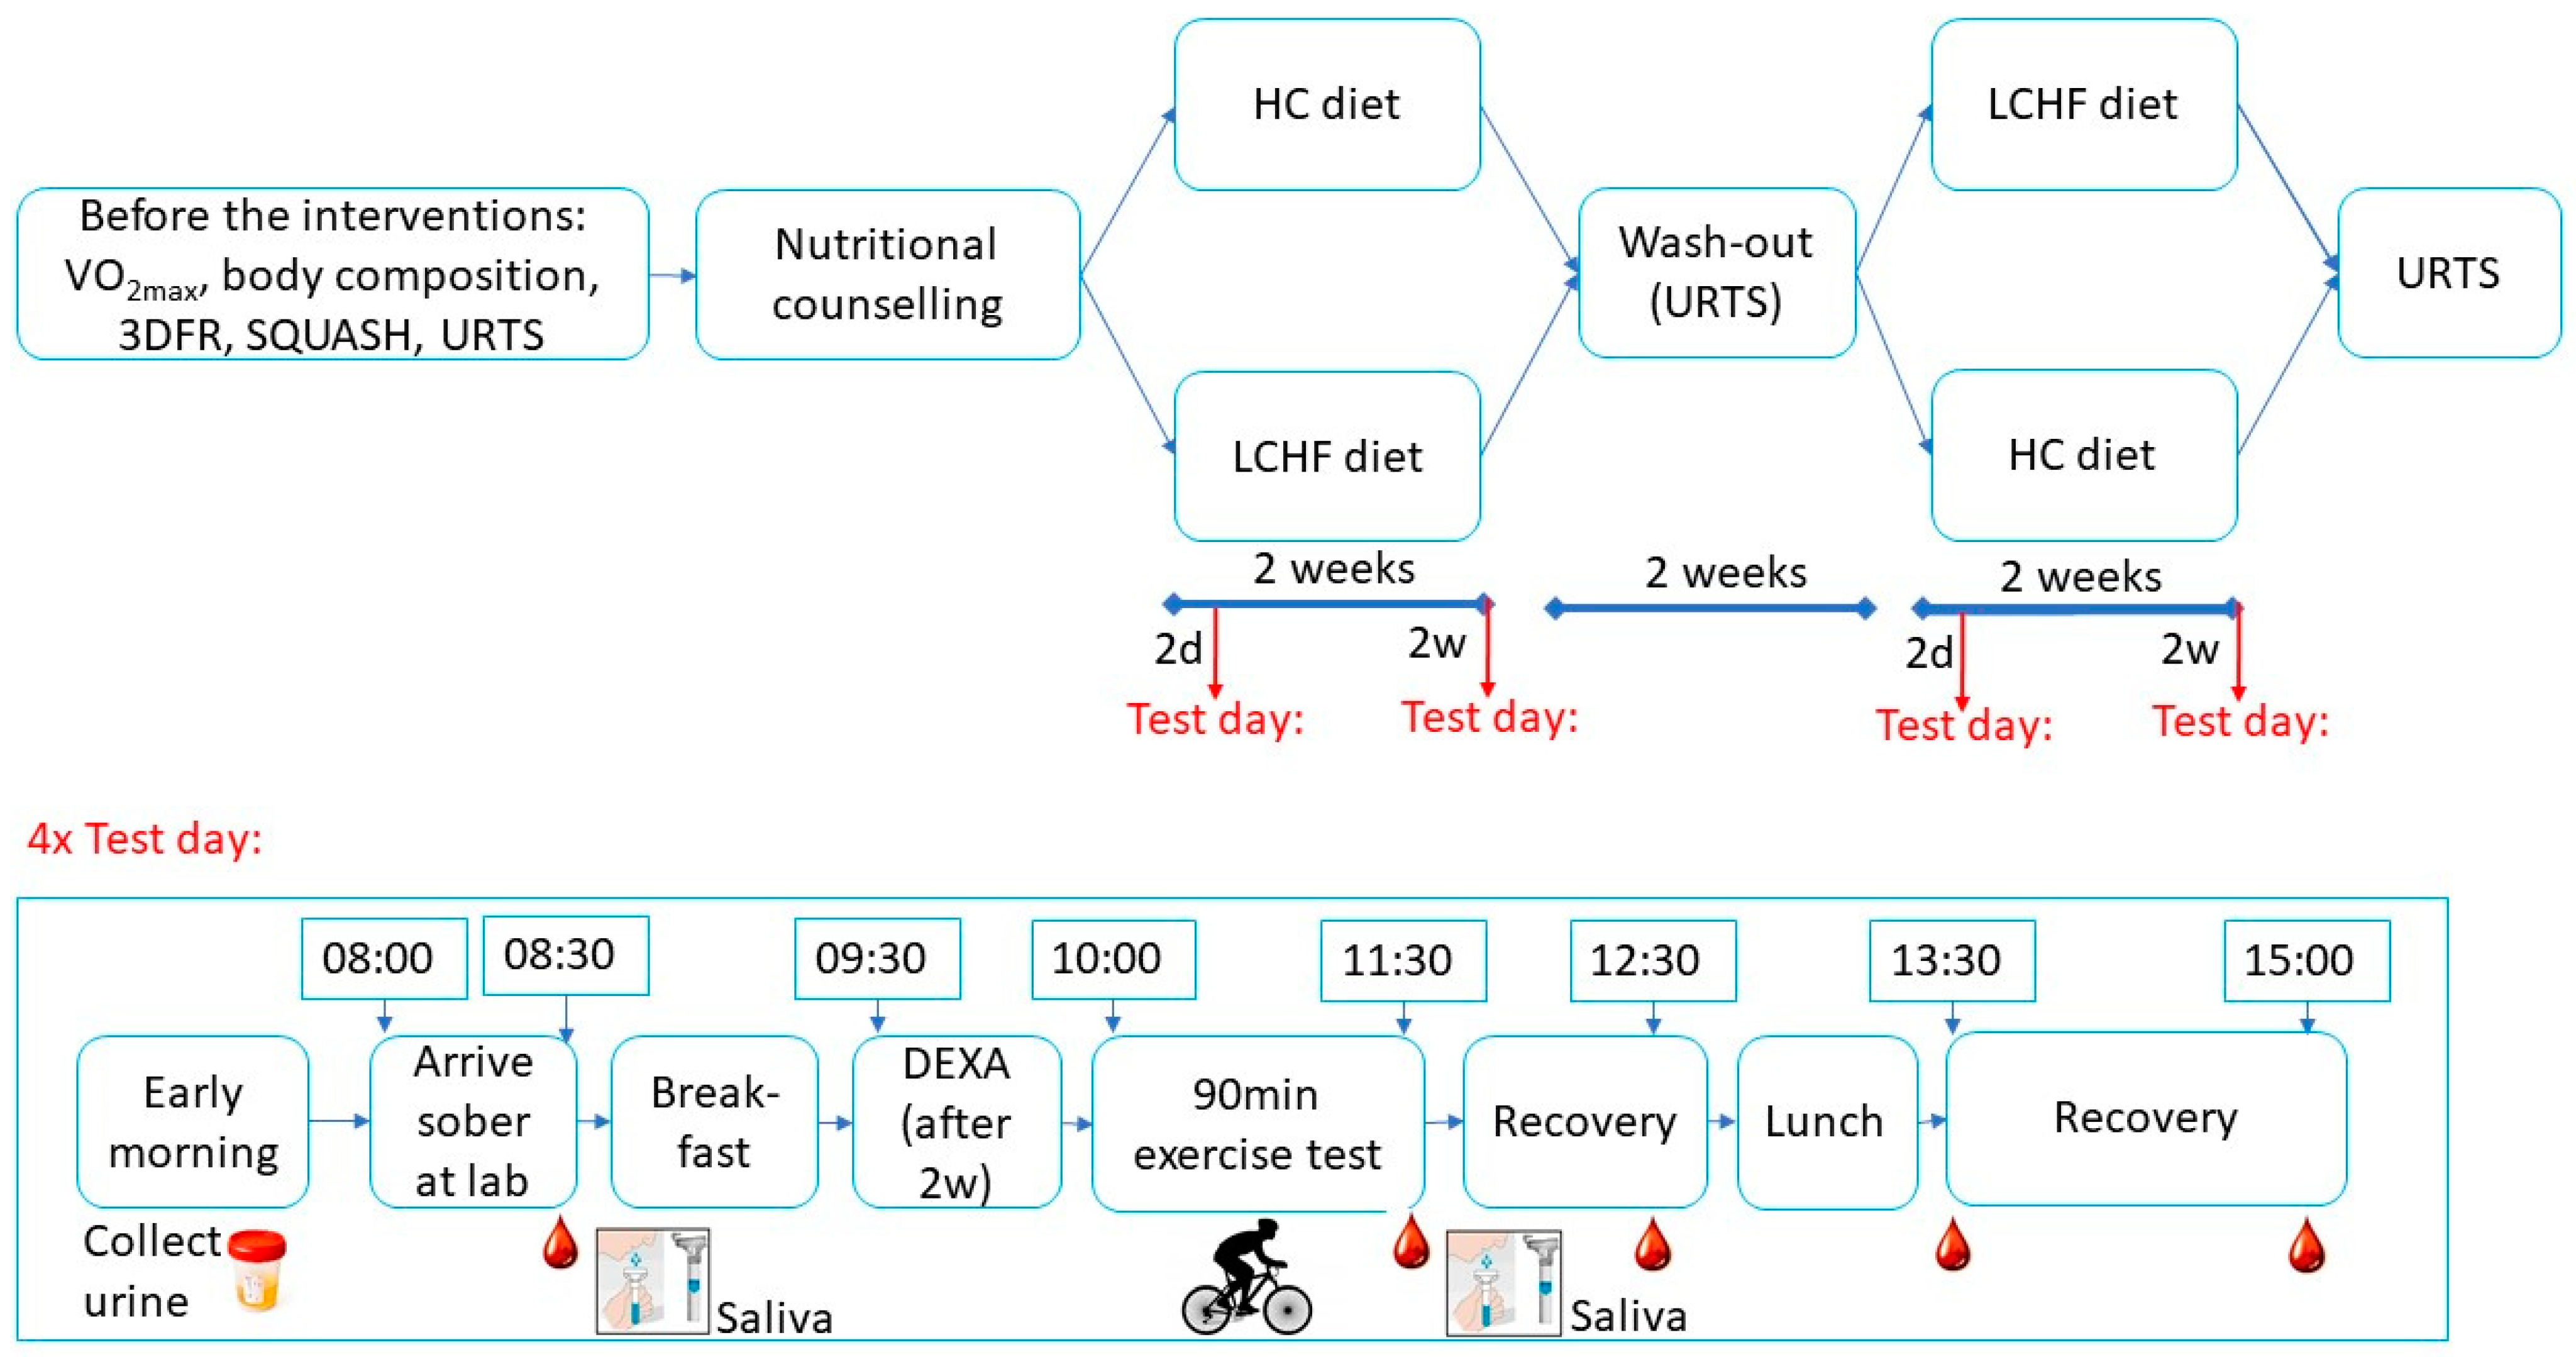
2.2. Study Design
2.3. Maximal Aerobic Capacity and Body Composition
2.4. Dietary Intervention and Physical Activity
2.5. Nutritional Counselling
2.6. Exercise Test Days
2.7. Blood Sampling and Analysis
2.8. Saliva Sampling and Analysis
2.9. URTS Questionnaires
2.10. Statistical Analysis
3. Results
3.1. Participant Characteristics
3.2. Dietary Intake and Blood and Urine Ketone Levels
3.3. Body Composition
3.4. Work output, Respiratory Exchange Ratio and Perceived Exertion
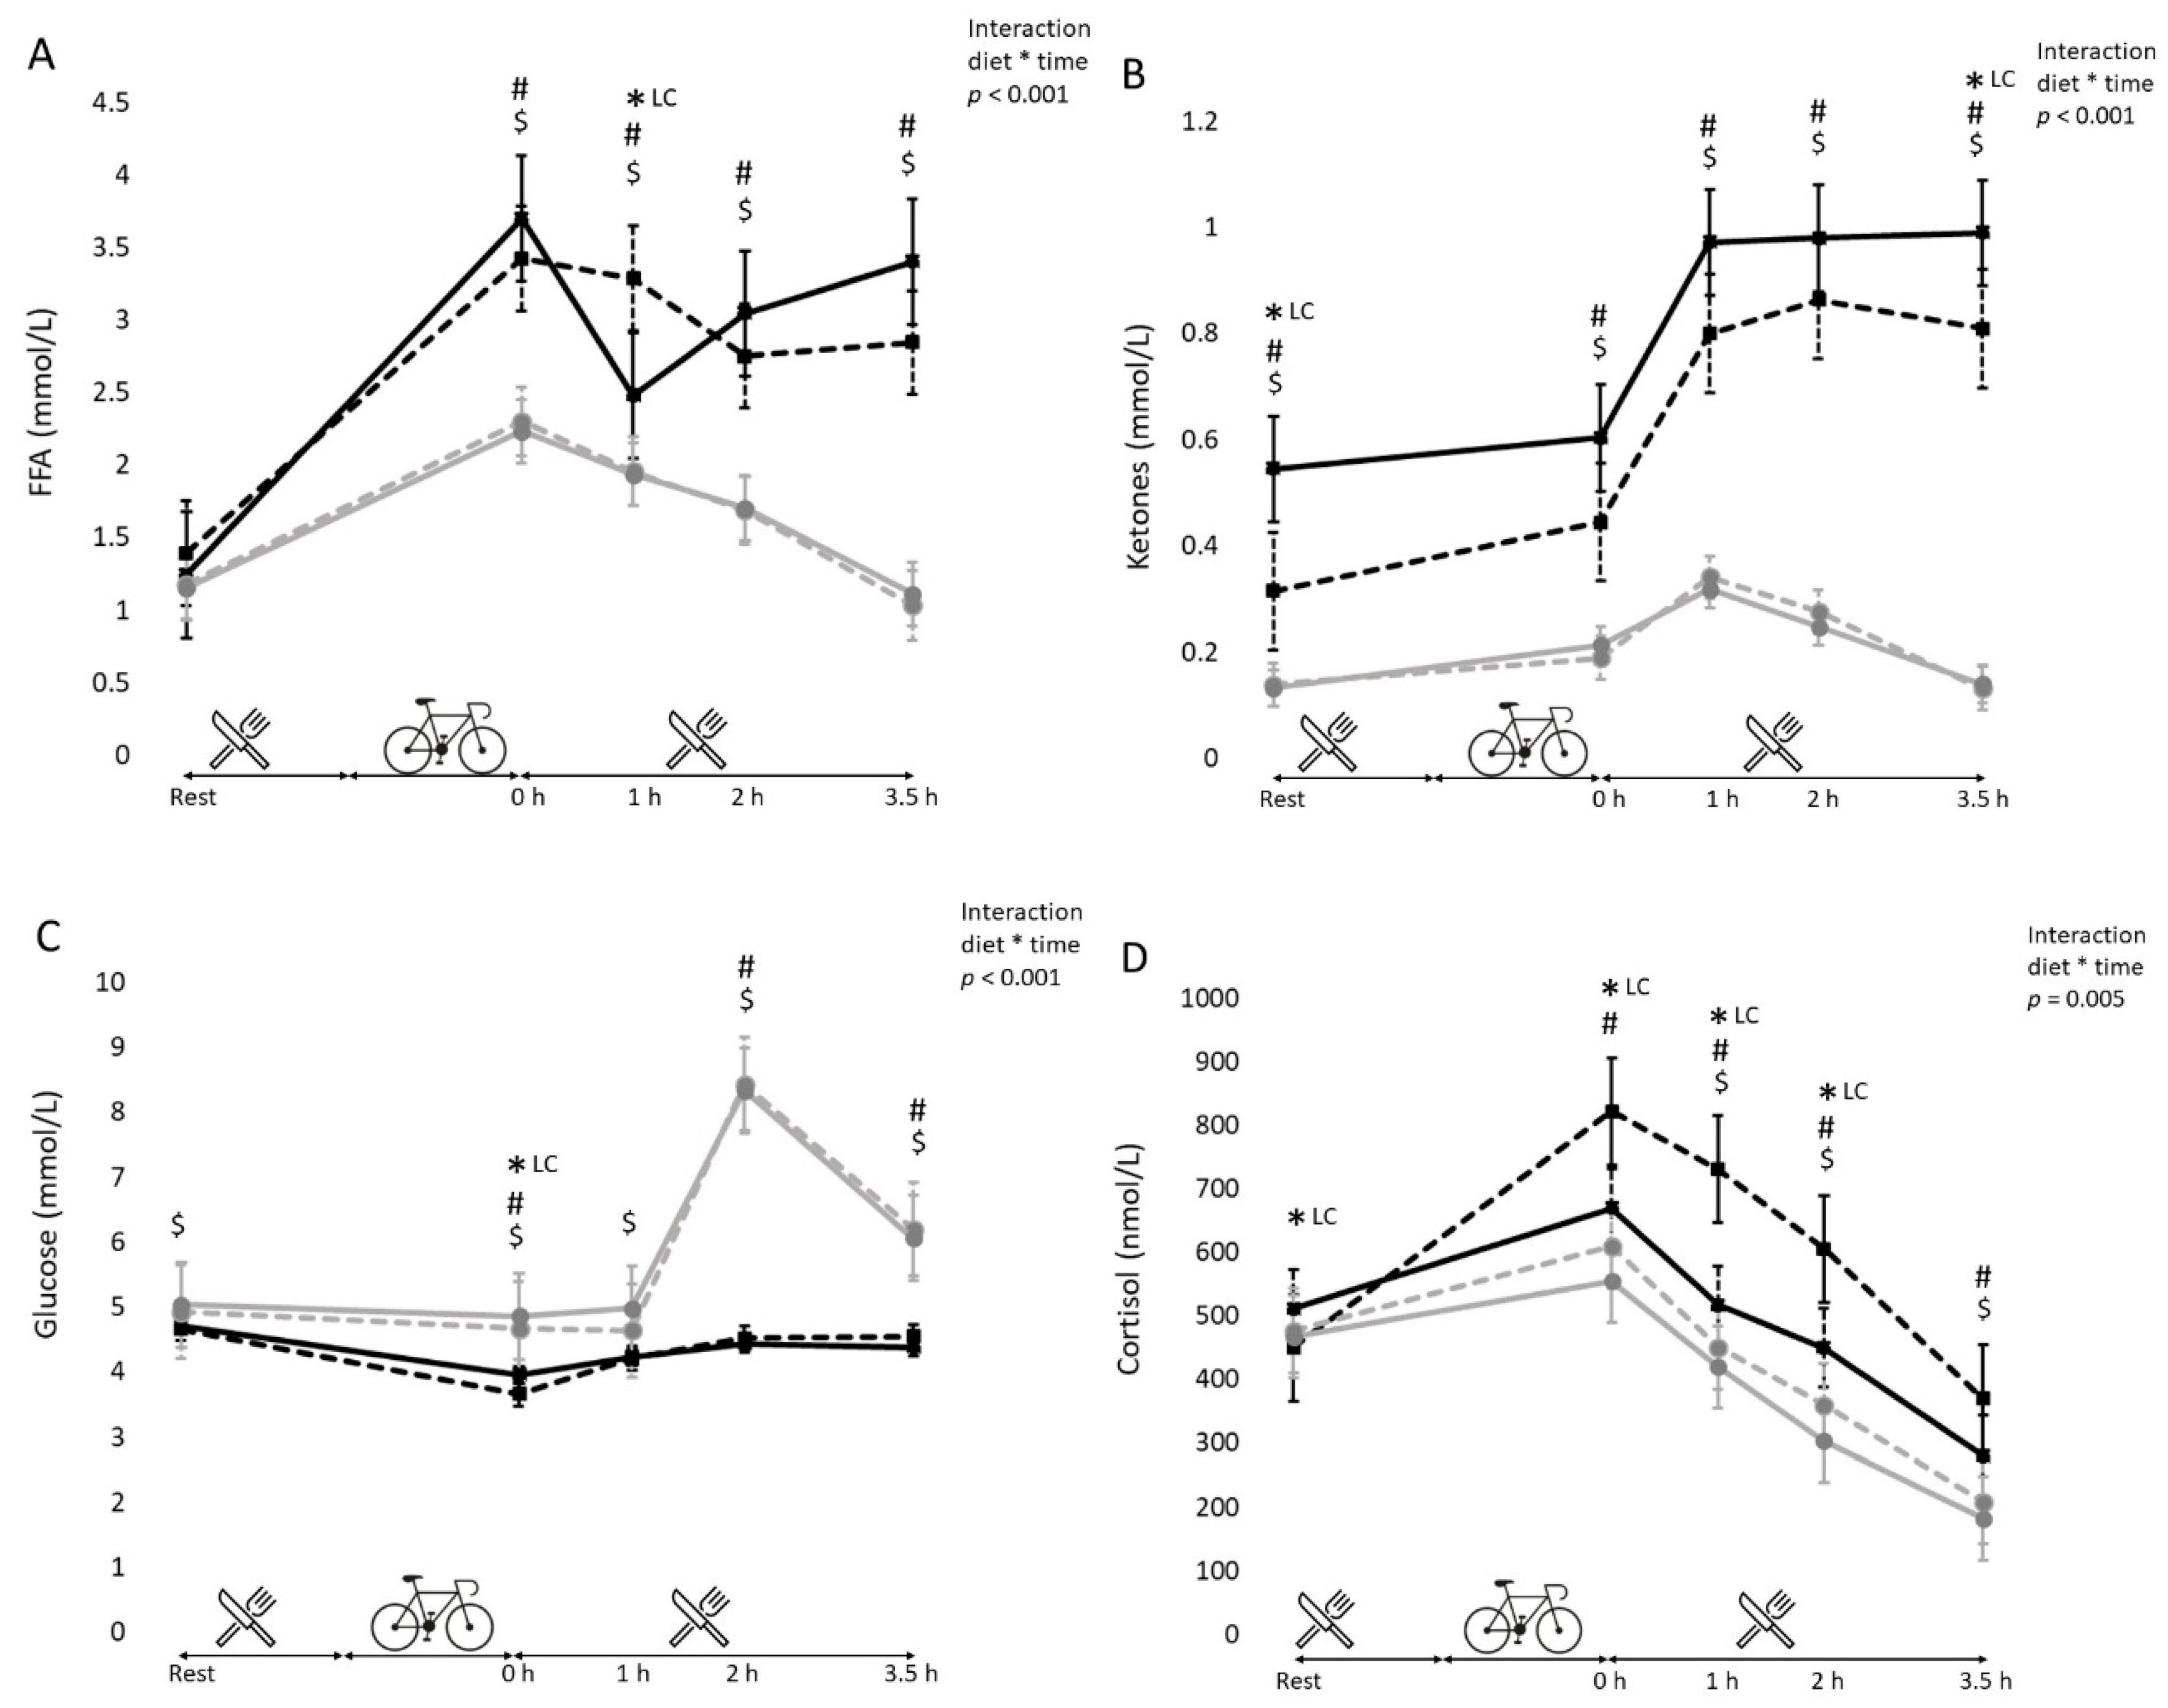
3.5. Blood Metabolites (Free Fatty Acids, Glucose, Cortisol and Ketone Bodies)
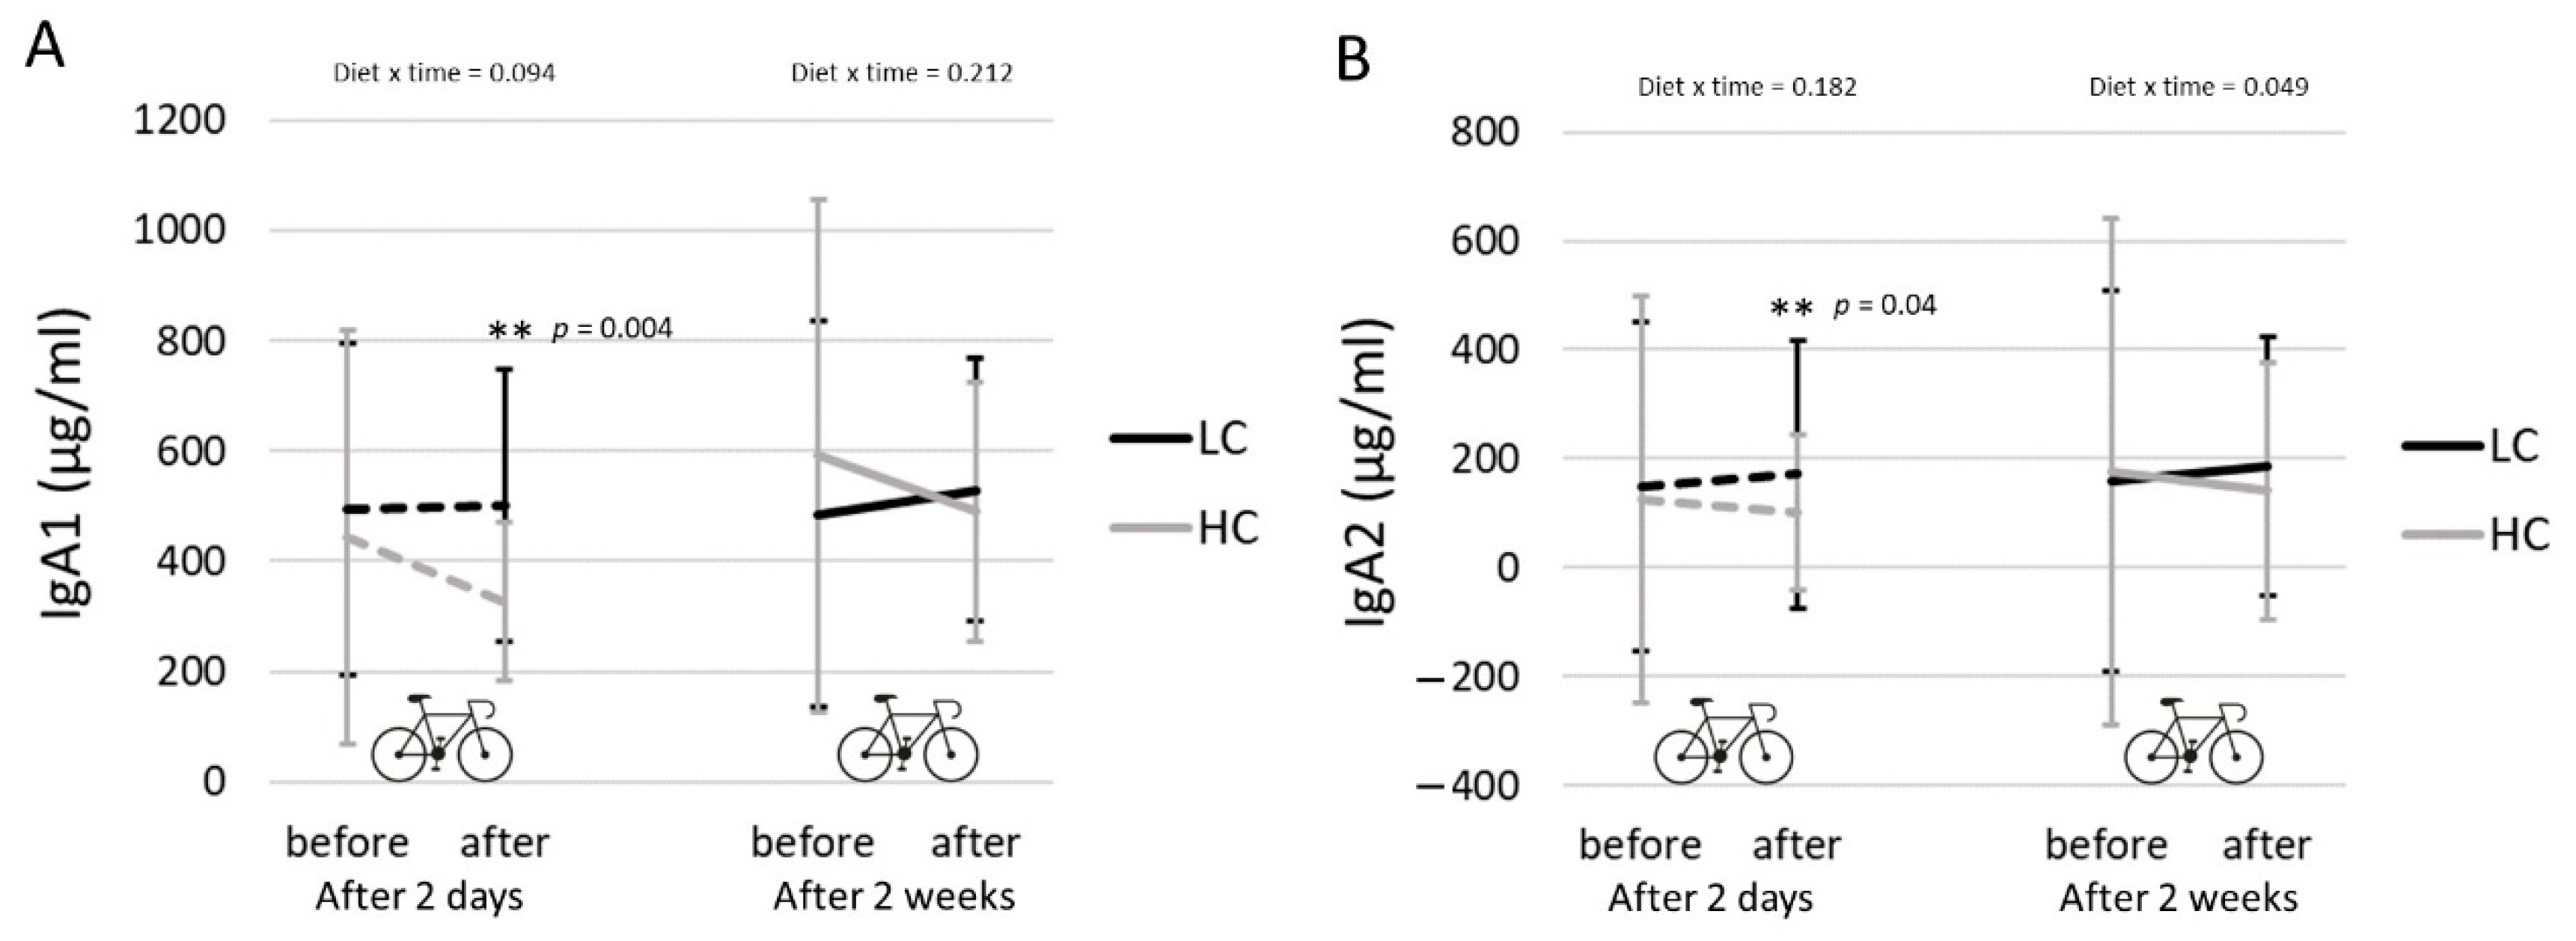
3.6. Salivary IgA
3.7. URTS
4. Discussion
Author Contributions
Funding
Declaration
Institutional Review Board Statement
Informed Consent Statement
Data Availability Statement
Conflicts of Interest
References
- Burke, L.M. Ketogenic low-CHO, high-fat diet: The future of elite endurance sport? J. Physiol. 2020. [Google Scholar] [CrossRef]
- Bartlett, J.D.; Hwa Joo, C.; Jeong, T.S.; Louhelainen, J.; Cochran, A.J.; Gibala, M.J.; Morton, J.P. Matched work high-intensity interval and continuous running induce similar increases in PGC-1alpha mRNA, AMPK, p38, and p53 phosphorylation in human skeletal muscle. J. Appl. Physiol. 2012, 112, 1135–1143. [Google Scholar] [CrossRef]
- Cochran, A.J.; Little, J.P.; Tarnopolsky, M.A.; Gibala, M.J. Carbohydrate feeding during recovery alters the skeletal muscle metabolic response to repeated sessions of high-intensity interval exercise in humans. J. Appl. Physiol. 2010, 108, 628–636. [Google Scholar] [CrossRef] [PubMed]
- Sanders, M.J.; Grondin, P.O.; Hegarty, B.D.; Snowden, M.A.; Carling, D. Investigating the mechanism for AMP activation of the AMP-activated protein kinase cascade. Biochem. J. 2007, 403, 139–148. [Google Scholar] [CrossRef] [PubMed]
- Wojtaszewski, J.F.; MacDonald, C.; Nielsen, J.N.; Hellsten, Y.; Hardie, D.G.; Kemp, B.E.; Richter, E.A. Regulation of 5’AMP-activated protein kinase activity and substrate utilization in exercising human skeletal muscle. Am. J. Physiol. Endocrinol. Metab. 2003, 284, E813–E822. [Google Scholar] [CrossRef] [PubMed]
- Burke, L.M.; Angus, D.J.; Cox, G.R.; Cummings, N.K.; Febbraio, M.A.; Gawthorn, K.; Hargreaves, M. Effect of fat adaptation and carbohydrate restoration on metabolism and performance during prolonged cycling. J. Appl. Physiol. 2000, 89, 2413–2421. [Google Scholar] [CrossRef] [PubMed]
- Burke, L.M.; Sharma, A.P.; Heikura, I.A.; Forbes, S.F.; Holloway, M.; McKay, A.K.; Bone, J.L.; Leckey, J.J.; Welvaert, M.; Ross, M.L. Crisis of confidence averted: Impairment of exercise economy and performance in elite race walkers by ketogenic low carbohydrate, high fat (LCHF) diet is reproducible. PLoS ONE 2020, 15, e0234027. [Google Scholar] [CrossRef]
- Cox, G.R.; Clark, S.A.; Cox, A.J.; Halson, S.L.; Hargreaves, M.; Hawley, J.A.; Burke, L.M. Daily training with high carbohydrate availability increases exogenous carbohydrate oxidation during endurance cycling. J. Appl. Physiol. 2010, 109, 126–134. [Google Scholar] [CrossRef] [PubMed]
- Stellingwerff, T.; Spriet, L.L.; Watt, M.J.; Kimber, N.E.; Hargreaves, M.; Hawley, J.A.; Burke, L.M. Decreased PDH activation and glycogenolysis during exercise following fat adaptation with carbohydrate restoration. Am. J. Physiol. Endocrinol. Metab. 2006, 290, E380–E388. [Google Scholar] [CrossRef] [PubMed]
- Hulston, C.J.; Venables, M.C.; Mann, C.H.; Martin, C.; Philp, A.; Baar, K.; Jeukendrup, A.E. Training with low muscle glycogen enhances fat metabolism in well-trained cyclists. Med. Sci. Sports Exerc. 2010, 42, 2046–2055. [Google Scholar] [CrossRef] [PubMed]
- Yeo, W.K.; Paton, C.D.; Garnham, A.P.; Burke, L.M.; Carey, A.L.; Hawley, J.A. Skeletal muscle adaptation and performance responses to once a day versus twice every second day endurance training regimens. J. Appl. Physiol. 2008, 105, 1462–1470. [Google Scholar] [CrossRef] [PubMed]
- Gleeson, M. Can nutrition limit exercise-induced immunodepression? Nutr. Rev. 2006, 64, 119–131. [Google Scholar] [CrossRef] [PubMed]
- Gleeson, M. Mucosal immune responses and risk of respiratory illness in elite athletes. Exerc. Immunol. Rev. 2000, 6, 5–42. [Google Scholar] [PubMed]
- Costa, R.J.; Jones, G.E.; Lamb, K.L.; Coleman, R.; Williams, J.H. The effects of a high carbohydrate diet on cortisol and salivary immunoglobulin A (s-IgA) during a period of increase exercise workload amongst Olympic and Ironman triathletes. Int. J. Sports Med. 2005, 26, 880–885. [Google Scholar] [CrossRef]
- McKay, A.K.A.; Pyne, D.B.; Peeling, P.; Sharma, A.P.; Ross, M.L.R.; Burke, L.M. The impact of chronic carbohydrate manipulation on mucosal immunity in elite endurance athletes. J. Sports Sci. 2019, 37, 553–559. [Google Scholar] [CrossRef]
- Shaw, D.M.; Merien, F.; Braakhuis, A.; Keaney, L.; Dulson, D.K. Adaptation to a ketogenic diet modulates adaptive and mucosal immune markers in trained male endurance athletes. Scand. J. Med. Sci. Sports 2020, 31, 140–152. [Google Scholar] [CrossRef]
- Goedecke, J.H.; Christie, C.; Wilson, G.; Dennis, S.C.; Noakes, T.D.; Hopkins, W.G.; Lambert, E.V. Metabolic adaptations to a high-fat diet in endurance cyclists. Metabolism 1999, 48, 1509–1517. [Google Scholar] [CrossRef]
- Burke, L.M.; Whitfield, J.; Heikura, I.A.; Ross, M.L.R.; Tee, N.; Forbes, S.F.; Hall, R.; McKay, A.K.A.; Wallett, A.M.; Sharma, A.P. Adaptation to a low carbohydrate high fat diet is rapid but impairs endurance exercise metabolism and performance despite enhanced glycogen availability. J. Physiol. 2020. [Google Scholar] [CrossRef]
- Schoffelen, P.; den Hoed, M.; van Breda, E.; Plasqui, G. Test-retest variability of VO2max using total-capture indirect calorimetry reveals linear relationship of VO2 and Power. Scand. J. Med. Sci. Sports 2019, 29, 213–222. [Google Scholar] [CrossRef]
- Ackland, T.R.; Lohman, T.G.; Sundgot-Borgen, J.; Maughan, R.J.; Meyer, N.L.; Stewart, A.D.; Müller, W. Current status of body composition assessment in sport: Review and position statement on behalf of the ad hoc research working group on body composition health and performance, under the auspices of the I.O.C. Medical Commission. Sports Med. 2012, 42, 227–249. [Google Scholar] [CrossRef]
- Meijboom, S.; van Houts-Streppel, M.T.; Perenboom, C.; Siebelink, E.; van de Wiel, A.M.; Geelen, A.; de Vries, J.H.M. Evaluation of dietary intake assessed by the Dutch self-administered web-based dietary 24-h recall tool (Compl-eat) against interviewer-administered telephone-based 24-h recalls. J. Nutr. Sci. 2017, 6, e49. [Google Scholar] [CrossRef] [PubMed]
- Wendel-Vos, G.C.; Schuit, A.J.; Saris, W.H.; Kromhout, D. Reproducibility and relative validity of the short questionnaire to assess health-enhancing physical activity. J. Clin. Epidemiol. 2003, 56, 1163–1169. [Google Scholar] [CrossRef]
- Salimetrics, S. Saliva Collection and Handling Advice. Available online: https://www.salimetrics.com/assets/documents/Saliva_Collection_Handbook.pdf (accessed on 20 May 2018).
- Wilms, E.; Jonkers, D.; Savelkoul, H.F.J.; Elizalde, M.; Tischmann, L.; de Vos, P.; Troost, F.J. The Impact of Pectin Supplementation on Intestinal Barrier Function in Healthy Young Adults and Healthy Elderly. Nutrients 2019, 11, 1554. [Google Scholar] [CrossRef] [PubMed]
- Barrett, B.; Brown, R.L.; Mundt, M.P.; Thomas, G.R.; Barlow, S.K.; Highstrom, A.D.; Bahrainian, M. Validation of a short form Wisconsin Upper Respiratory Symptom Survey (WURSS-21). Health Qual. Life Outcomes 2009, 7, 76. [Google Scholar] [CrossRef] [PubMed]
- Volek, J.S.; Freidenreich, D.J.; Saenz, C.; Kunces, L.J.; Creighton, B.C.; Bartley, J.M.; Phinney, S.D. Metabolic characteristics of keto-adapted ultra-endurance runners. Metabolism 2016, 65, 100–110. [Google Scholar] [CrossRef]
- Klein, S.; Coyle, E.F.; Wolfe, R.R. Fat metabolism during low-intensity exercise in endurance-trained and untrained men. Am. J. Physiol. 1994, 267, E934–E940. [Google Scholar] [CrossRef]
- Hall, K.D.; Chen, K.Y.; Guo, J.; Lam, Y.Y.; Leibel, R.L.; Mayer, L.E.; Ravussin, E. Energy expenditure and body composition changes after an isocaloric ketogenic diet in overweight and obese men. Am. J. Clin. Nutr. 2016, 104, 324–333. [Google Scholar] [CrossRef]
- Yeo, W.K.; Carey, A.L.; Burke, L.; Spriet, L.L.; Hawley, J.A. Fat adaptation in well-trained athletes: Effects on cell metabolism. Appl. Physiol. Nutr. Metab. 2011, 36, 12–22. [Google Scholar] [CrossRef]
- Frayn, K.N. Calculation of substrate oxidation rates in vivo from gaseous exchange. J. Appl. Physiol. Respir. Environ. Exerc. Physiol. 1983, 55, 628–634. [Google Scholar] [CrossRef]
- Mielgo Ayuso, J.; Zourdos, M.C.; Urdampilleta, A.; Calleja González, J.; Seco, J.; Córdova, A. Relationship of long-term macronutrients intake on anabolic-catabolic hormones in female elite volleyball players. Nutr. Hosp. 2017, 34, 1155–1162. [Google Scholar] [CrossRef]
- Bergström, J.; Hermansen, L.; Saltin, B. Diet, muscle glycogen and physical performance. Acta Phys. Scand. 1967, 71, 140–150. [Google Scholar] [CrossRef] [PubMed]
- Pitsiladis, Y.P.; Maughan, R.J. The effects of exercise and diet manipulation on the capacity to perform prolonged exercise in the heat and in the cold in trained humans. J. Physiol. 1999, 517 Pt 3, 919–930. [Google Scholar] [CrossRef]
- Starling, R.D.; Trappe, T.A.; Parcell, A.C.; Kerr, C.G.; Fink, W.J.; Costill, D.L. Effects of diet on muscle triglyceride and endurance performance. J. Appl. Physiol. 1997, 82, 1185–1189. [Google Scholar] [CrossRef] [PubMed]
- Bishop, N.C.; Walsh, N.P.; Haines, D.L.; Richards, E.E.; Gleeson, M. Pre-exercise carbohydrate status and immune responses to prolonged cycling: II. Effect on plasma cytokine concentration. Int. J. Sport Nutr. Exerc. Metab. 2001, 11, 503–512. [Google Scholar] [CrossRef] [PubMed]
- Gleeson, M.; Blannin, A.K.; Walsh, N.P.; Bishop, N.C.; Clark, A.M. Effect of low- and high-carbohydrate diets on the plasma glutamine and circulating leukocyte responses to exercise. Int. J. Sport Nutr. 1998, 8, 49–59. [Google Scholar] [CrossRef]
- Mortatti, A.L.; Moreira, A.; Aoki, M.S.; Crewther, B.T.; Castagna, C.; de Arruda, A.F.; Filho, J.M. Effect of competition on salivary cortisol, immunoglobulin A, and upper respiratory tract infections in elite young soccer players. J. Strength Cond. Res. 2012, 26, 1396–1401. [Google Scholar] [CrossRef]
- Campbell, J.P.; Turner, J.E. Debunking the Myth of Exercise-Induced Immune Suppression: Redefining the Impact of Exercise on Immunological Health Across the Lifespan. Front. Immunol. 2018, 9, 648. [Google Scholar] [CrossRef]
- Davison, G.; Kehaya, C.; Wyn Jones, A. Nutritional and Physical Activity Interventions to Improve Immunity. Am. J. Lifestyle Med. 2016, 10, 152–169. [Google Scholar] [CrossRef]
- Gunzer, W.; Konrad, M.; Pail, E. Exercise-induced immunodepression in endurance athletes and nutritional intervention with carbohydrate, protein and fat-what is possible, what is not? Nutrients 2012, 4, 1187–1212. [Google Scholar] [CrossRef]
- Vargas, S.; Romance, R.; Petro, J.L.; Bonilla, D.A.; Galancho, I.; Espinar, S.; Benitez-Porres, J. Efficacy of ketogenic diet on body composition during resistance training in trained men: A randomized controlled trial. J. Int. Soc. Sports Nutr. 2018, 15, 31. [Google Scholar] [CrossRef]
- Volek, J.S.; Sharman, M.J.; Love, D.M.; Avery, N.G.; Gomez, A.L.; Scheett, T.P.; Kraemer, W.J. Body composition and hormonal responses to a carbohydrate-restricted diet. Metabolism 2002, 51, 864–870. [Google Scholar] [CrossRef]
- Kreitzman, S.N.; Coxon, A.Y.; Szaz, K.F. Glycogen storage: Illusions of easy weight loss, excessive weight regain, and distortions in estimates of body composition. Am. J. Clin. Nutr. 1992, 56 (Suppl. 1), 292s–293s. [Google Scholar] [CrossRef]
- Bingham, S.A. Limitations of the various methods for collecting dietary intake data. Ann. Nutr. Metab. 1991, 35, 117–127. [Google Scholar] [CrossRef]
- Mielgo-Ayuso, J.; Calleja-González, J.; Refoyo, I.; León-Guereño, P.; Cordova, A.; Del Coso, J. Exercise-Induced Muscle Damage and Cardiac Stress During a Marathon Could be Associated with Dietary Intake During the Week Before the Race. Nutrients 2020, 12, 316. [Google Scholar] [CrossRef]


| Participants (n = 14) | |
|---|---|
| Age (years) | 32.9 ± 8.2 |
| Body composition | |
| Height (cm) | 181.7 ± 4.7 |
| Weight (kg) | 76.4 ± 5.4 |
| BMI (kg/m2) | 23.1 ± 1.4 |
| Lean mass (kg) | 61.9 ± 3.4 |
| Lean mass (%) | 81.3 ± 4.4 |
| BMC (kg) | 3.2 ± 0.25 |
| BMC (%) | 4.2 ± 0.32 |
| Body fat (kg) | 11.2 ± 4.0 |
| Body fat (%) | 14.5 ± 4.6 |
| Total training (hours/week) | 5.6 ± 1.1 |
| Maximal exercise performance | |
| VO2max (ml/kg/min) | 57.3 ± 5.8 |
| Max heart rate (bpm) | 187 ± 9 |
| Max Power (Watt) | 346 ± 46 |
| Max Power/kg body weight | 4.5 ± 0.5 |
| Habitual | LCHF Diet | HC Diet | p Value | |
|---|---|---|---|---|
| Energy (kCal) | 2961 ± 528 | 3104 ± 297 | 3075 ± 298 | 0.221 |
| Protein (g/day) | 116 ± 22 | 124 ± 12 | 112 ± 11 | <0.001 |
| Protein (En%) | 16 ± 3 | 16 ± 1 | 15 ± 0 | <0.001 |
| Carbohydrate (g/day) | 318 ± 72 | 64 ± 6 | 373 ± 38 | <0.001 |
| Carbohydrate (En%) | 43.4 ± 5.3 | 8 ± 0 | 49 ± 0 | <0.001 |
| Total Fat (g/day) | 122 ± 29 | 254 ± 25 | 116 ± 11 | <0.001 |
| Total Fat (En%) | 36 ± 6 | 73 ± 1 | 33 ± 0 | <0.001 |
| Saturated Fat (g/day) | 43 ± 13 | 68 ± 6 | 32 ± 3 | <0.001 |
| Saturated Fat (En%) | 13.1 ± 3.2 | 19.7 ± 0.3 | 9.3 ± 0.3 | <0.001 |
| Monounsaturated Fat (g/day) | 46 ± 13 | 127 ± 13 | 35 ± 3 | <0.001 |
| Monounsaturated Fat (En%) | 13.9 ± 3.3 | 36.8 ± 1.1 | 10.3 ± 0.2 | <0.001 |
| Polyunsaturated Fat (g/day) | 22 ± 7 | 39 ± 5 | 41 ± 5 | 0.002 |
| Polyunsaturated Fat (En%) | 6.6 ± 1.8 | 11.4 ± 0.4 | 12.1 ± 0.2 | <0.001 |
| Cholesterol (mg/day) | 354 ± 242 | 699 ± 57 | 165 ± 18 | <0.001 |
| Dietary Fiber (g/day) | 31 ± 6 | 28 ± 3 | 41 ± 4 | <0.001 |
| Dietary Fiber (En%) | 2 ± 0 | 5 ± 1 | 9 ± 2 | <0.001 |
| Fasting serum βHB (mmol/L) | 0.27 ± 0.13 | 0.07 ± 0.04 | <0.001 | |
| Urine ketone levels (g/L) | 0.26 ± 0.25 | 0.00 ± 0.00 | <0.001 |
| LCHF | HC | Intervention | ||||||
|---|---|---|---|---|---|---|---|---|
| Time Effect | Time Effect | after 2d | after 2w | |||||
| after 2 Days | after 2 Weeks | p-Value | after 2 Days | after 2 Weeks | p-Value | p-Value | p-Value | |
| Work (AUC in kJ) | 939 ± 163 | 1003 ± 129 | 0.030 | 1042 ± 151 | 1043 ± 141 | 0.974 | 0.004 | 0.016 |
| RER (rest) | 0.76 ± 0.03 | 0.77 ± 0.06 | 0.282 | 0.86 ± 0.05 | 0.87 ± 0.05 | 0.564 | <0.001 | <0.001 |
| RER (at t60) | 0.82 ± 0.03 | 0.82 ± 0.03 | 0.681 | 0.90 ± 0.04 | 0.91 ± 0.04 | 0.612 | <0.001 | <0.001 |
| HR (in bpm; at t60) | 165 ± 13 | 170 ± 11 | 0.014 | 164 ± 18 | 165 ± 13 | 0.633 | 0.652 | 0.001 |
| RPE score | 18.0 ± 1.4 | 17.3 ± 1.7 | 0.151 | 15.5 ± 2.7 | 16.1 ± 2.0 | 0.300 | 0.001 | 0.053 |
Publisher’s Note: MDPI stays neutral with regard to jurisdictional claims in published maps and institutional affiliations. |
© 2021 by the authors. Licensee MDPI, Basel, Switzerland. This article is an open access article distributed under the terms and conditions of the Creative Commons Attribution (CC BY) license (http://creativecommons.org/licenses/by/4.0/).
Share and Cite
Terink, R.; Witkamp, R.F.; Hopman, M.T.E.; Siebelink, E.; Savelkoul, H.F.J.; Mensink, M. A 2 Week Cross-over Intervention with a Low Carbohydrate, High Fat Diet Compared to a High Carbohydrate Diet Attenuates Exercise-Induced Cortisol Response, but Not the Reduction of Exercise Capacity, in Recreational Athletes. Nutrients 2021, 13, 157. https://doi.org/10.3390/nu13010157
Terink R, Witkamp RF, Hopman MTE, Siebelink E, Savelkoul HFJ, Mensink M. A 2 Week Cross-over Intervention with a Low Carbohydrate, High Fat Diet Compared to a High Carbohydrate Diet Attenuates Exercise-Induced Cortisol Response, but Not the Reduction of Exercise Capacity, in Recreational Athletes. Nutrients. 2021; 13(1):157. https://doi.org/10.3390/nu13010157
Chicago/Turabian StyleTerink, Rieneke, Renger F. Witkamp, Maria T. E. Hopman, Els Siebelink, Huub F. J. Savelkoul, and Marco Mensink. 2021. "A 2 Week Cross-over Intervention with a Low Carbohydrate, High Fat Diet Compared to a High Carbohydrate Diet Attenuates Exercise-Induced Cortisol Response, but Not the Reduction of Exercise Capacity, in Recreational Athletes" Nutrients 13, no. 1: 157. https://doi.org/10.3390/nu13010157
APA StyleTerink, R., Witkamp, R. F., Hopman, M. T. E., Siebelink, E., Savelkoul, H. F. J., & Mensink, M. (2021). A 2 Week Cross-over Intervention with a Low Carbohydrate, High Fat Diet Compared to a High Carbohydrate Diet Attenuates Exercise-Induced Cortisol Response, but Not the Reduction of Exercise Capacity, in Recreational Athletes. Nutrients, 13(1), 157. https://doi.org/10.3390/nu13010157