
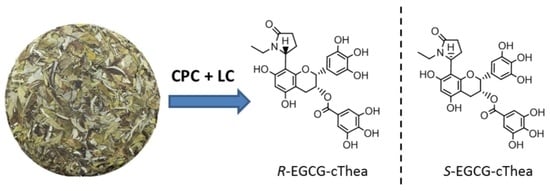
Isolation of N-Ethyl-2-pyrrolidinone-Substituted Flavanols from White Tea Using Centrifugal Countercurrent Chromatography Off-Line ESI-MS Profiling and Semi-Preparative Liquid Chromatography

 ,
,  , ,
, ,
Abstract
:
1. Introduction
2. Results and Discussion
2.1. LC-ESI-MS/MS Analysis of Polyphenols in Stored White Tea
2.2. Evaluation and Prediction of Compound Specific Partition Ratio (K) Values by LC-ESI-MS Analysis of White Tea Extract
2.3. Isolation of R-EGCG-cThea and S-EGCG-cThea from White Tea
2.3.1. Extraction and Liquid/Liquid Partitioning
2.3.2. Semi-Preparative CPC Fractionation and HPLC-Purification of R- and S-EGCG-cThea
2.4. Comparison of LC-ESI-MS Based Prediction Versus CPC Experimental KD-VALUES
2.5. Comparing Chromatographic Performance of CPC-1 and CPC-2
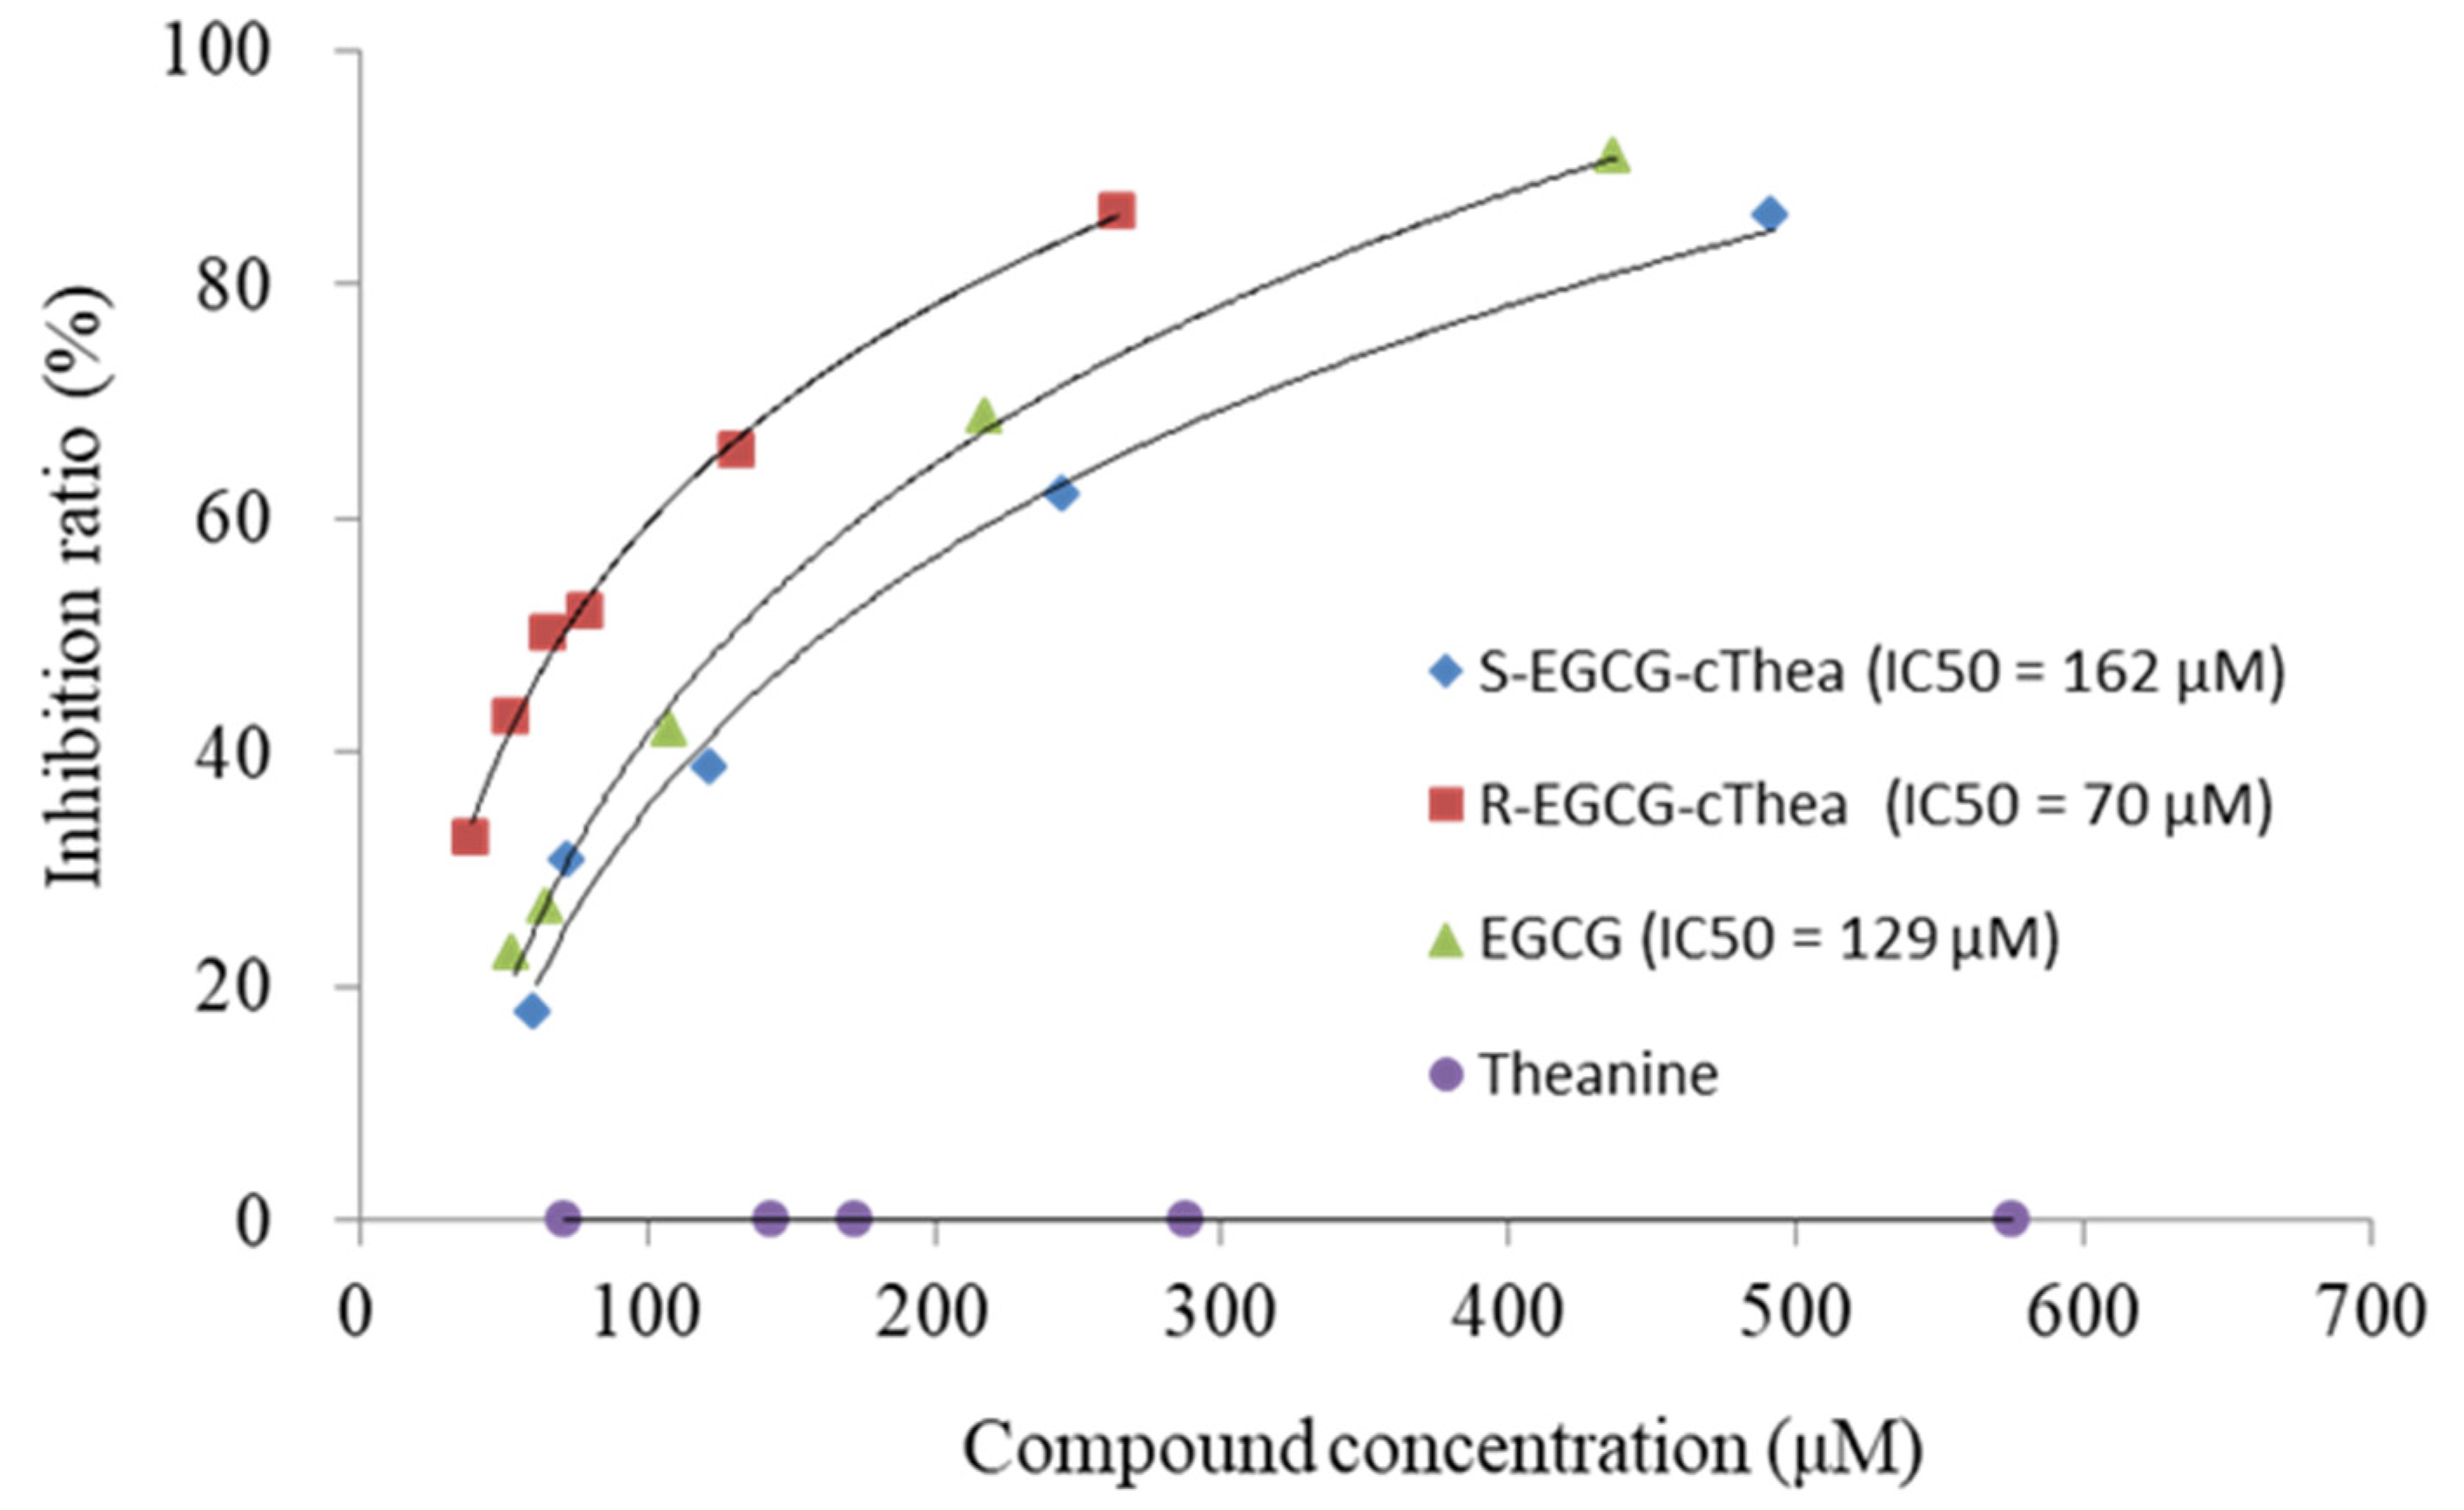
2.6. Inhibition Effect of R-EGCG-cThea and S-EGCG-cThea on α-Glucosidase
3. Materials and Methods
3.1. Chemicals
3.2. Preparation of Sample Extract
3.3. Evaluation of Partition Ratio (KD) Values Using LC-ESI-MS
3.4. CPC Isolation of the Mixture R- and S-EGCG-cThea from White Tea
3.5. Off-Line ESI-MS/MS Injection Analysis for CPC Molecular Weight Metabolite Profiling
3.6. Further Isolation of Stereomeric R-EGCG-cThea and S-EGCG-cThea by Semi-Preparative Chromatography
3.7. α-Glucosidase Inhibition Assay of R-EGCG-cThea and S-EGCG-cThea
4. Conclusions
Supplementary Materials
Author Contributions
Funding
Institutional Review Board Statement
Informed Consent Statement
Data Availability Statement
Acknowledgments
Conflicts of Interest
Sample Availability
References
- Zhang, L.; Ho, C.T.; Zhou, J.; Santos, J.S.; Armstrong, L.; Granato, D. Chemistry and biological activities of processed Camellia sinensis teas: A comprehensive review. Compr. Rev. Food Sci. Food Safety 2019, 18, 1474–1495. [Google Scholar] [CrossRef] [Green Version]
- Chen, G.; Chen, R.; Chen, D.; Ye, H.; Hu, B.; Zeng, X.; Liu, Z. Tea polysaccharides as potential therapeutic options for metabolic diseases. J. Agric. Food Chem. 2019, 67, 5350–5360. [Google Scholar] [CrossRef]
- Dai, W.; Xie, D.; Lu, M.; Li, P.; Lv, H.; Yang, C.; Peng, Q.; Zhu, Y.; Guo, L.; Zhang, Y.; et al. Characterization of white tea metabolome: Comparison against green and black tea by a nontargeted metabolomics approach. Food Res. Int. 2017, 96, 40–45. [Google Scholar] [CrossRef]
- Yang, C.; Hu, Z.; Lu, M.; Li, P.; Tan, J.; Chen, M.; Lv, H.; Zhu, Y.; Zhang, Y.; Guo, L.; et al. Application of metabolomics profiling in the analysis of metabolites and taste quality in different subtypes of white tea. Food Res. Int. 2018, 106, 909–919. [Google Scholar] [CrossRef] [PubMed]
- Qi, D.; Miao, A.; Cao, J.; Wang, W.; Chen, W.; Pang, S.; He, X.; Ma, C. Study on the effects of rapid aging technology on the aroma quality of white tea using GC-MS combined with chemometrics: In comparison with natural aged and fresh white tea. Food Chem. 2018, 265, 189–199. [Google Scholar] [CrossRef] [PubMed]
- Zhu, Y.; Kang, S.; Yan, H.; Lv, H.P.; Zhang, Y.; Lin, Z. Enantiomeric distributions of volatile lactones and terpenoids in white teas stored for different durations. Food Chem. 2020, 320, 126632. [Google Scholar] [CrossRef]
- Ning, J.-M.; Ding, D.; Song, Y.-S.; Zhang, Z.-Z.; Luo, X.; Wan, X.-C. Chemical constituents analysis of white tea of different qualities and different storage times. Eur. Food Res. Technol. 2016, 242, 2093–2104. [Google Scholar] [CrossRef]
- Dai, W.; Tan, J.; Lu, M.; Zhu, Y.; Li, P.; Peng, Q.; Guo, L.; Zhang, Y.; Xie, D.; Hu, Z.; et al. Metabolomics investigation reveals that 8-C N-ethyl-2-pyrrolidinone-substituted flavan-3-ols are potential marker compounds of stored white teas. J. Agric. Food Chem. 2018, 66, 7209–7218. [Google Scholar] [CrossRef]
- Xie, D.; Dai, W.; Lu, M.; Tan, J.; Zhang, Y.; Chen, M.; Lin, Z. Nontargeted metabolomics predicts the storage duration of white teas with 8-C N-ethyl-2-pyrrolidinone-substituted flavan-3-ols as marker compounds. Food Res. Int. 2019, 125, 108635. [Google Scholar] [CrossRef] [PubMed]
- Meng, Q.; Li, S.; Huang, J.; Wei, C.-C.; Wan, X.; Sang, S.; Ho, C.-T. Importance of the nucleophilic property of tea polyphenols. J. Agric. Food Chem. 2019, 67, 5379–5383. [Google Scholar] [CrossRef] [PubMed]
- Li, X.; Liu, G.J.; Zhang, W.; Zhou, Y.L.; Ling, T.J.; Wan, X.C.; Bao, G.H. Novel flavoalkaloids from white tea with inhibitory activity against the formation of advanced glycation end products. J. Agric. Food Chem. 2018, 66, 4621–4629. [Google Scholar] [CrossRef] [PubMed]
- Xu, S.; Wang, J.J.; Wei, Y.; Deng, W.W.; Wan, X.; Bao, G.H.; Xie, Z.; Ling, T.J.; Ning, J. Metabolomics based on UHPLC-orbitrap-MS and global natural product social molecular networking reveals effects of time scale and environment of storage on the metabolites and taste quality of raw Pu-erh tea. J. Agric. Food Chem. 2019, 67, 12084–12093. [Google Scholar] [CrossRef] [PubMed]
- Cheng, J.; Wu, F.H.; Wang, P.; Ke, J.P.; Wan, X.C.; Qiu, M.H.; Bao, G.H. Flavoalkaloids with a pyrrolidinone ring from Chinese ancient cultivated tea Xi-Gui. J. Agric. Food Chem. 2018, 66, 7948–7957. [Google Scholar] [CrossRef] [PubMed]
- Zhou, J.; Wu, Y.; Long, P.; Ho, C.-T.; Wang, Y.; Kan, Z.; Cao, L.; Zhang, L.; Wan, X. LC-MS-based metabolomics reveals the chemical changes of polyphenols during high-temperature roasting of large-leaf yellow tea. J. Agric. Food Chem. 2018, 67, 5405–5412. [Google Scholar] [CrossRef]
- Wang, W.; Zhang, L.; Wang, S.; Shi, S.; Jiang, Y.; Li, N.; Tu, P. 8-C N-ethyl-2-pyrrolidinone substituted flavan-3-ols as the marker compounds of Chinese dark teas formed in the post-fermentation process provide significant antioxidative activity. Food Chem. 2014, 152, 539–545. [Google Scholar] [CrossRef] [PubMed]
- Meng, X.H.; Zhu, H.T.; Yan, H.; Wang, D.; Yang, C.R.; Zhang, Y.J. C-8 N-Ethyl-2-pyrrolidinone-substituted flavan-3-ols from the leaves of Camellia sinensis var. pubilimba. J. Agric. Food Chem. 2018, 66, 7150–7155. [Google Scholar] [CrossRef]
- Dai, W.; Lou, N.; Xie, D.; Hu, Z.; Song, H.; Lu, M.; Shang, D.; Wu, W.; Peng, J.; Yin, P.; et al. N-Ethyl-2-pyrrolidinone-substituted flavan-3-ols with anti-inflammatory activity in lipopolysaccharide-stimulated macrophages are storage-related marker compounds for green tea. J. Agric. Food Chem. 2020, 68, 12164–12172. [Google Scholar] [CrossRef]
- Destandau, E.; Toribio, A.; Lafosse, M.; Pecher, V.; Lamy, C.; Andre, P. Centrifugal partition chromatography directly interfaced with mass spectrometry for the fast screening and fractionation of major xanthones in Garcina mangostana. J. Chromatogr. A 2009, 1216, 1390–1394. [Google Scholar] [CrossRef]
- Kumar, N.S.; Rajapaksha, M. Separation of catechin constituents from five tea cultivars using high-speed counter-current chromatography. J. Chromatogr. A 2005, 1083, 223–228. [Google Scholar] [CrossRef]
- El-Shahawi, M.S.; Hamza, A.; Bahaffi, S.O.; Al-Sibaai, A.A.; Abduljabbar, T.N. Analysis of some selected catechins and caffeine in green tea by high performance liquid chromatography. Food Chem. 2012, 134, 2268–2275. [Google Scholar] [CrossRef]
- Degenhardt, A.; Engelhardt, U.H.; Lakenbrink, C.; Winterhalter, P. Preparative separation of polyphenols from tea by high-speed countercurrent chromatography. J. Agric. Food Chem. 2000, 48, 3425–3430. [Google Scholar] [CrossRef] [PubMed]
- Choi, S.J.; Hong, Y.D.; Lee, B.; Park, J.S.; Jeong, H.W.; Kim, W.G.; Shin, S.S.; Yoon, K.D. Separation of polyphenols and caffeine from the acetone extract of fermented tea leaves (Camellia sinensis) using high-performance countercurrent chromatography. Molecules 2015, 20, 13216–13225. [Google Scholar] [CrossRef] [Green Version]
- Jerz, G.; Elnakady, Y.A.; Braun, A.; Jaeckel, K.; Sasse, F.; Al Ghamdi, A.A.; Omar, M.O.M.; Winterhalter, P. Preparative mass-spectrometry profiling of bioactive metabolites in Saudi-Arabian propolis fractionated by high-speed countercurrent chromatography and off-line atmospheric pressure chemical ionization mass-spectrometry injection. J. Chromatogr. A 2014, 1347, 17–29. [Google Scholar] [CrossRef] [PubMed]
- Tran, T.M.T.; Thanh, B.N.; Moussa-Ayoub, T.E.; Rohn, S.; Jerz, G. Profiling of polar metabolites in fruits of Opuntia stricta var. dillenii by ion-pair high-performance countercurrent chromatography and off-line electrospray mass-spectrometry injection. J. Chromatogr. A 2019, 1601, 274–287. [Google Scholar] [CrossRef]
- Grecco, S.D.; Letsyo, E.; Tempone, A.G.; Lago, J.H.G.; Jerz, G. Electrospray mass-spectrometry guided target isolation of neolignans from Nectandra leucantha (Lauraceae) by high performance- and spiral-coil countercurrent chromatography. J. Chromatogr. A 2019, 1608, 460422. [Google Scholar] [CrossRef] [PubMed]
- Ito, Y. Golden rules and pitfalls in selecting optimum conditions for high-speed counter-current chromatography. J. Chromatogr. A 2005, 1065, 145–168. [Google Scholar] [CrossRef]
- Berthod, A.; Friesen, J.B.; Inui, T.; Pauli, G.F. Elution-extrusion countercurrent chromatography: Theory and concepts in metabolic analysis. Anal. Chem. 2007, 79, 3371–3382. [Google Scholar] [CrossRef] [Green Version]
- Abbott, T.P.; Kleiman, R. Solvent selection guide for counter-current chromatography. J. Chromatogr. A 1991, 538, 109–118. [Google Scholar] [CrossRef]
- Dolan, J.W. Peak tailing and resolution. Lc Gc N. Am. 2002, 20, 430–437. [Google Scholar]
- Xu, P.; Chen, L.; Wang, Y. Effect of storage time on antioxidant activity and inhibition on α-Amylase and α-Glucosidase of white tea. Food Sci. Nutr. 2019, 7, 636–644. [Google Scholar] [CrossRef] [Green Version]
- Ardiana, L.; Sauriasari, R.; Elya, B. Antidiabetic activity studies of white tea (Camellia sinensis (L.) O. Kuntze) ethanolic extracts in streptozotocin-nicotinamide induced diabetic rats. Pharmacogn. J. 2017, 10, 186–189. [Google Scholar] [CrossRef] [Green Version]
- Deng, S.; Xia, L.; Xiao, H. Screening of α-glucosidase inhibitors from green tea extracts using immobilized enzymes affinity capture combined with UHPLC-QTOF MS analysis. Chem. Commun. 2014, 50, 2582–2584. [Google Scholar] [CrossRef] [PubMed]

| CPC-1 | Corrected SF | 84.5% | CPC-2 | Corrected SF | 76.0% | |||||
|---|---|---|---|---|---|---|---|---|---|---|
| Target Compounds ESI-MS (+Mode) m/z: [M + H]+ | Solv. System 1 KD-Prediction (LC-MS) Cf. Details in Supplementary Material, Figure S1 | Exp. Peak Range Fractions Retention Vol. ~[mL] Peak Width [mL] | KD Range ΔKD Width W | CPC-1 Mean Value KD | ΔKD = pred. KD − exp. KD CPC-1 | Solv. System 2 KD-Prediction (LC-MS) Cf. Details in Supplementary Material, Figure S1 | Exp. Peak Range Fractions Retention Vol. ~[mL] Peak Width [mL] | KD Range ΔKD Width W | CPC-2 Mean Value KD | ΔKD = pred. KD − exp. KD CPC-2 |
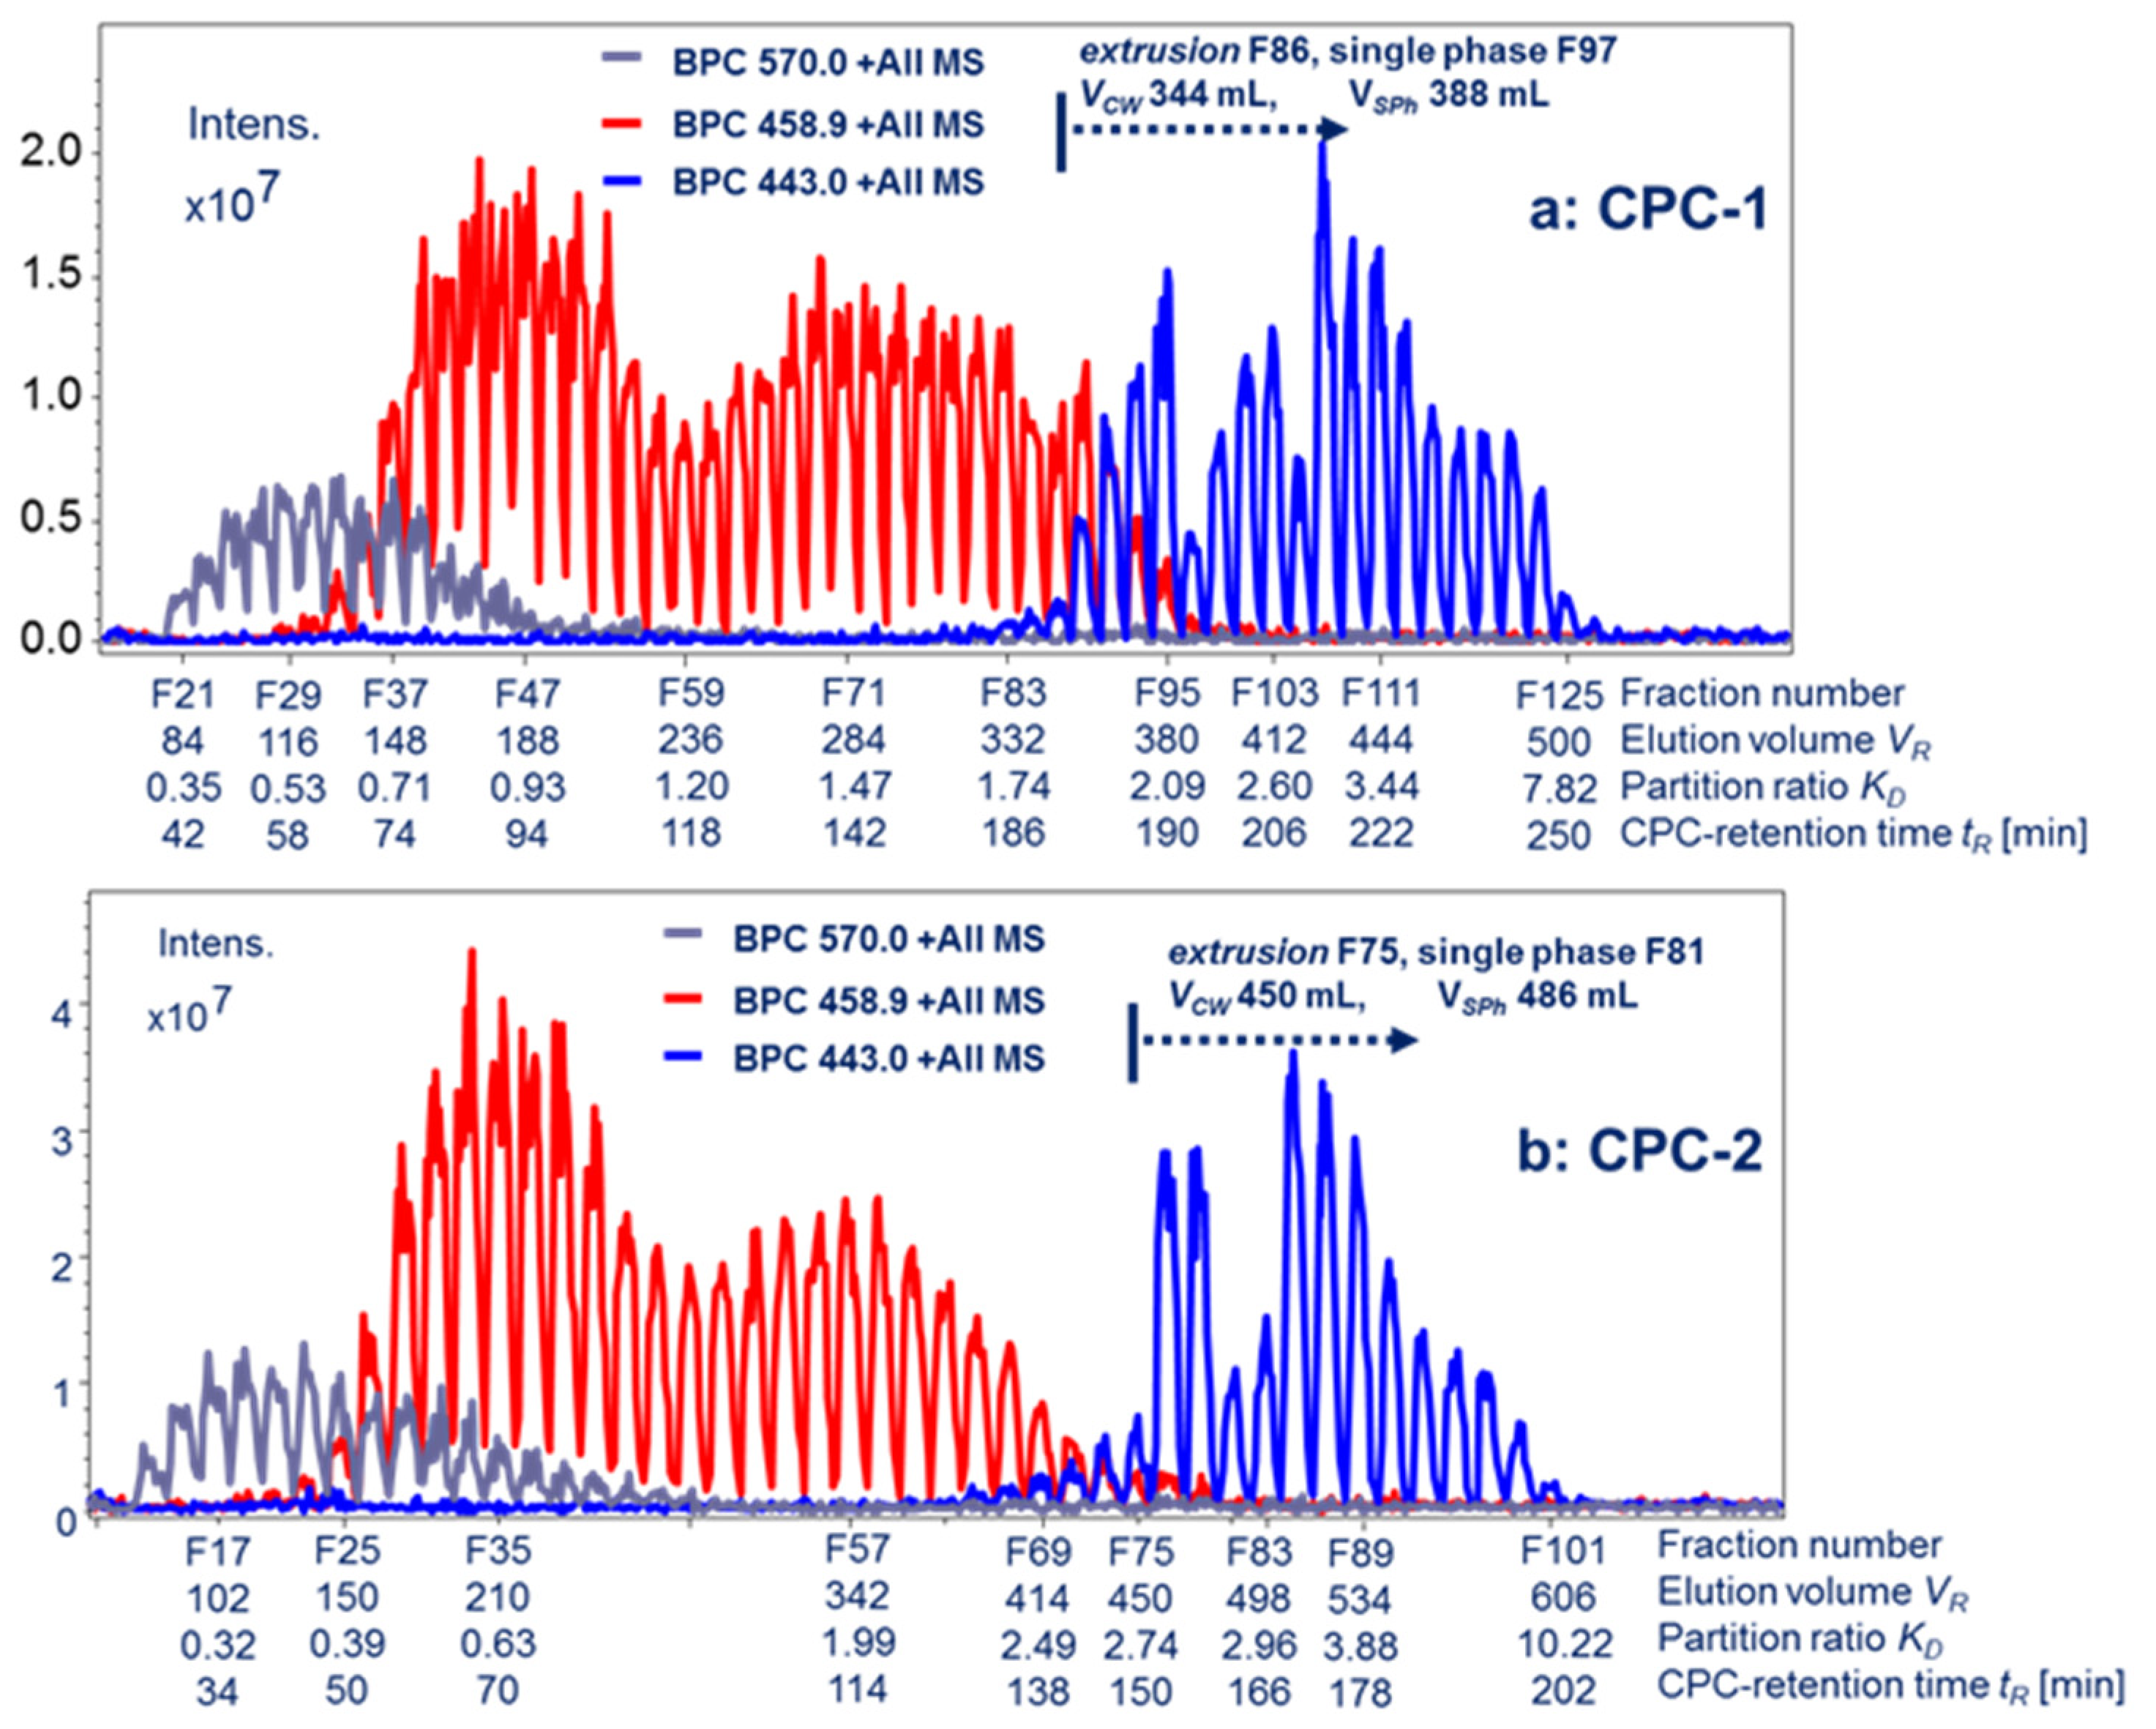
| m/z 570 570 R-/S-EGCG-cThea | 0.41 | F21–F47 84–188 104 | 0.35–0.93 0.58 | 0.64 | −0.23 | 0.72 | F13–F47 66–282 216 | 0.15–1.57 1.42 | 0.86 | −0.14 |
| m/z 459 Epigallocatechin-Gallate 459-EGCG | 0.88 | F29–F59 * 116–236 120 | 0.53–1.20 0.67 | 0.86 | +0.02 | 0.95 | F23–F47 * 138–282 144 | 0.35–1.57 1.22 | 0.96 | −0.01 |
| m/z 459 Gallocatechin-Gallate 459-GCG | 1.57 | F59–F95 * 236–380 144 | 1.20–2.20 1.00 | 1.70 | −0.13 | 1.92 | F47–F75 * 282–450 168 | 1.57–2.74 1.17 | 2.15 | −0.23 |
| m/z 443 Epicatechin-Gallate 443-ECG | 3.13 | F83–F125 332–500 168 | 1.74–7.82 6.08 | 4.78 | −1.65 | 3.06 | F69–F101 414–606 192 | 2.49–10.22 7.73 | 6.35 | −3.29 |
| Fractionated Compound Pairs | CPC-1 α-Value | CPC-2 α-Value | Δα [CPC-1 − CPC-2] | CPC-1 Resolution Factor RS | CPC-2 Resolution Factor RS | ΔRS [CPC-1 − CPC-2] |
|---|---|---|---|---|---|---|
| 570 R-/S-EGCG-cThea/459-EGCG | 1.34 | 1.11 | +0.23 | 0.35 | 0.08 | +0.27 |
| 570 R-/S-EGCG-cThea/459-GCG | 2.65 | 2.50 | +0.15 | 1.34 | 1.00 | +0.34 |
| 570 R-/S-EGCG-cThea/443-ECG | 7.47 | 7.38 | +0.09 | 1.24 | 1.20 | +0.04 |
| 459-EGCG/459-GCG | 1.98 | 2.24 | −0.26 | 1.00 | 1.00 | +0.02 |
| 459-EGCG/443-ECG | 5.58 | 6.61 | −1.03 | 1.17 | 1.20 | −0.03 |
| 459-GCG/443-ECG | 2.81 | 2.95 | −0.14 | 0.87 | 0.94 | −0.07 |
Publisher’s Note: MDPI stays neutral with regard to jurisdictional claims in published maps and institutional affiliations. |
© 2021 by the authors. Licensee MDPI, Basel, Switzerland. This article is an open access article distributed under the terms and conditions of the Creative Commons Attribution (CC BY) license (https://creativecommons.org/licenses/by/4.0/).
Share and Cite
Dai, W.; Ramos-Jerz, M.; Xie, D.; Peng, J.; Winterhalter, P.; Jerz, G.; Lin, Z. Isolation of N-Ethyl-2-pyrrolidinone-Substituted Flavanols from White Tea Using Centrifugal Countercurrent Chromatography Off-Line ESI-MS Profiling and Semi-Preparative Liquid Chromatography. Molecules 2021, 26, 7284. https://doi.org/10.3390/molecules26237284
Dai W, Ramos-Jerz M, Xie D, Peng J, Winterhalter P, Jerz G, Lin Z. Isolation of N-Ethyl-2-pyrrolidinone-Substituted Flavanols from White Tea Using Centrifugal Countercurrent Chromatography Off-Line ESI-MS Profiling and Semi-Preparative Liquid Chromatography. Molecules. 2021; 26(23):7284. https://doi.org/10.3390/molecules26237284
Chicago/Turabian StyleDai, Weidong, Maria Ramos-Jerz, Dongchao Xie, Jiakun Peng, Peter Winterhalter, Gerold Jerz, and Zhi Lin. 2021. "Isolation of N-Ethyl-2-pyrrolidinone-Substituted Flavanols from White Tea Using Centrifugal Countercurrent Chromatography Off-Line ESI-MS Profiling and Semi-Preparative Liquid Chromatography" Molecules 26, no. 23: 7284. https://doi.org/10.3390/molecules26237284
APA StyleDai, W., Ramos-Jerz, M., Xie, D., Peng, J., Winterhalter, P., Jerz, G., & Lin, Z. (2021). Isolation of N-Ethyl-2-pyrrolidinone-Substituted Flavanols from White Tea Using Centrifugal Countercurrent Chromatography Off-Line ESI-MS Profiling and Semi-Preparative Liquid Chromatography. Molecules, 26(23), 7284. https://doi.org/10.3390/molecules26237284