1. Introduction
Continuous, real-time and non-invasive monitoring of vital signs through wearable devices represents one of the most appealing challenges posed by the modern medicine, healthcare and occupational health [
1,
2]. Regarding modern medicine and healthcare, the use of unobtrusive, lightweight and comfortable wearable devices for collecting physiological signals constitutes a key aspect for improving both the monitoring in clinical settings and a remote/home monitoring of the patients [
3]. In clinical settings, a continuous monitoring becomes challenging in all those wards hospitalizing patients which require particular care because they have to be connected to bulky, portable, monitoring devices and every movement around the hospital becomes thus difficult [
3,
4]. Outside the clinic, wearable devices have gained increased attention for the remote monitoring of the patients and healthcare, due to their intrinsic comfortably, ease of use and reduced costs [
3,
5,
6,
7]. Moreover, the use of wearables to monitor physiological parameters has gained attention in occupational health as well, due to the increased attention to the workers’ health and safety by monitoring their condition in the era of Industry 4.0 [
8]. Indeed, the monitoring of physiological parameters is beneficial to assessing physiological status, and the activities and fatigue levels of workers (e.g., muscle-skeletal and cardiovascular disorders) to improving their health, well-being and safety and thus meeting the guidelines defined by ergonomics [
6,
9,
10].
In these scenarios, respiratory rate (RR) and heart rate (HR) have gained broad interest, since they are strictly related to different physiological and pathological conditions of the patients/workers (e.g., early detection of critical events) and to different environmental stressors [
6,
11,
12]. These vital signs can be monitored using many approaches [
9,
13].
In this work, we present a prototype of a novel wearable device for simultaneous monitoring of the cardio-respiratory parameters (i.e., RR and HR). The proposed system uses different sensors with respect to what has been reported in the literature and used in commercial devices, since it is based on four conductive textiles (for RR monitoring) and an IMU (for monitoring HR). These sensors were embedded within a highly integrated, lightweight, comfortable and low-cost wearable device. We have tested the feasibility of the proposed device in three different scenarios to mimic conditions that can be experienced in the above-described fields. Specifically, we enrolled eight healthy volunteers and we monitored their cardio-respiratory activity, in terms of RR and HR estimation, in three different scenarios: (i) sitting (e.g., it can simulate the occupational settings of a computer worker), (ii) standing and (iii) supine position (e.g., they can simulate clinical and remote applications). This work is organized into the following sections: (i) in
Section 2 we focus on the related works; (ii) in
Section 3 and
Section 4 we describe the proposed wearable system (WS) and the experimental protocol used to assess its feasibility in monitoring RR and HR; (iii) in
Section 5 we describe the techniques of data analysis used to estimate RR and HR starting from the raw data recorded by the WS; (iv)
Section 6 reports the results in terms of both RR and HR; (v)
Section 7 deals with the discussion of the obtained results and the conclusion.
2. Related Works
The state of the art of wearable systems for RR monitoring consists of techniques based on the cyclic expansion and contraction of the rib cage during the breathing activity. Most of these systems directly measure the expansion of the rib cage by means of electrical elements that change their impedance with strain (i.e., resistive and piezoresistive sensors, capacitive sensors and inductive sensors) and fiber optic sensors [
14,
15,
16,
17,
18,
19,
20]. Fiber optic sensors (e.g., fiber Bragg grating sensors) have some advantages over their electrical counterparts related to their metrological properties (high sensitivity, good accuracy and short response time), immunity from electromagnetic interference and small size, and they are most often used in this field [
17,
21,
22,
23,
24]. However, the interrogation systems are usually bulky and only recently have there been commercially available portable systems, but these remain quite expensive solutions (from around 3.000 USD to 40.000 USD). When the application does not require the use of the system in a harsh environment in terms of electromagnetic field (e.g., patients monitoring during magnetic resonance scan [
23,
24]), the resistive, capacitive and inductive sensors may be valid alternatives due to the low prices of both the sensors and the front-end electronics, and the possibility to collect the data by wireless transmission protocol [
25,
26]. Among others, resistive sensors represent a convenient solution to implement reliable, accurate and low-cost assessments of breathing activity and RR [
9,
27]. In addition, they can be manufactured as "smart textiles"; thus, it is possible to design highly integrated solutions maximizing the comfort and minimizing the encumbrance of the system itself [
28,
29]. A commercially available solution for RR monitoring is the SS5LB by BIOPAC systems Inc., which transduces the chest wall deformations using a strain gauge. To allow the collection of the transduced signal, an additional component has to be purchased, increasing both the complexity and costs. Moreover, the device cannot be used in unstructured and unsupervised environments [
30]. As regards HR, many techniques have been proposed to develop wearable devices. They are mainly based on electrocardiography (ECG), photoplethysmography (PPG) and the monitoring of the local mechanical vibrations provided by the heartbeat to the chest wall, in terms of accelerations (seismocardiography, SCG) [
21,
31] or local angular rotations (gyrocardiography, GCG) [
32,
33]. Specifically, monitoring the cardiac activity using chest wall induced vibrations is an appealing solution for developing highly integrated wearable systems due to the recent technological advancements that have been made in micro-electromechanical systems (MEMSs) for motion tracking that integrate tri-axial accelerometers and gyroscopes into a miniaturized inertial measurement unit (IMU) [
31]. Available commercial devices for monitoring HR based on a PPG sensor proposed by Polar. Different devices have been developed to match the needs of subjects (i.e., humans and animals) when monitoring their HRs during physical activities [
34,
35]. One of the limitations of these devices which is crucial for the application of interest is the inability to simultaneously monitor RR and HR. There are several solutions for monitoring RR and HR by wearable systems; however, the state of the art of wearable systems for simultaneous monitoring of these two parameters consists only of a few works. In [
36,
37] the system was based on electrodes placed in contact with the subject’s skin to monitor both ECG and breathing-induced variations of chest wall impedance during the cyclic respiration. In [
22] fiber optic sensors were used for the mentioned purpose. In [
38] a piezoelectric sensor was adopted to monitor SCG and breathing activity. In [
26] a wearable belt embedding a capacitive sensor and two conductive textiles used as electrodes for a single lead ECG were used to monitor RR and HR simultaneously. Although this system is compliant with the scenarios presented in this study, it is characterized by a high price and having no feature to cope with sensor damage or data loss due to the sensor’s failure.
7. Discussion and Conclusions
In this study, we presented a prototype of an unobtrusive and multiparametric wearable system for continuous monitoring of RR and HR. The feasibility of the system has been assessed in different static positions (i.e., sitting, standing and supine), simulating clinical and remote/home monitoring scenarios, and an occupational setting—specifically, a computer worker sitting at a desk. Continuously monitoring those parameters can provide useful information on the health status of an individual, including insights on upcoming potentially critical conditions, and can improve workers’ conditions in terms of health, well-being and safety [
1,
2,
3]. Indeed, although HR is a well established parameter for evaluating an individual’s critical critical state, RR is mostly neglected. Indeed, RR is directly affected by the effort made (e.g., physical activity, load handling), the surrounding environment and the psycho-physical state. Thus, a system capable of jointly monitoring breathing activity and cardiac activity may be beneficial to providing comprehensive assessments of the mentioned conditions [
3,
12,
45].
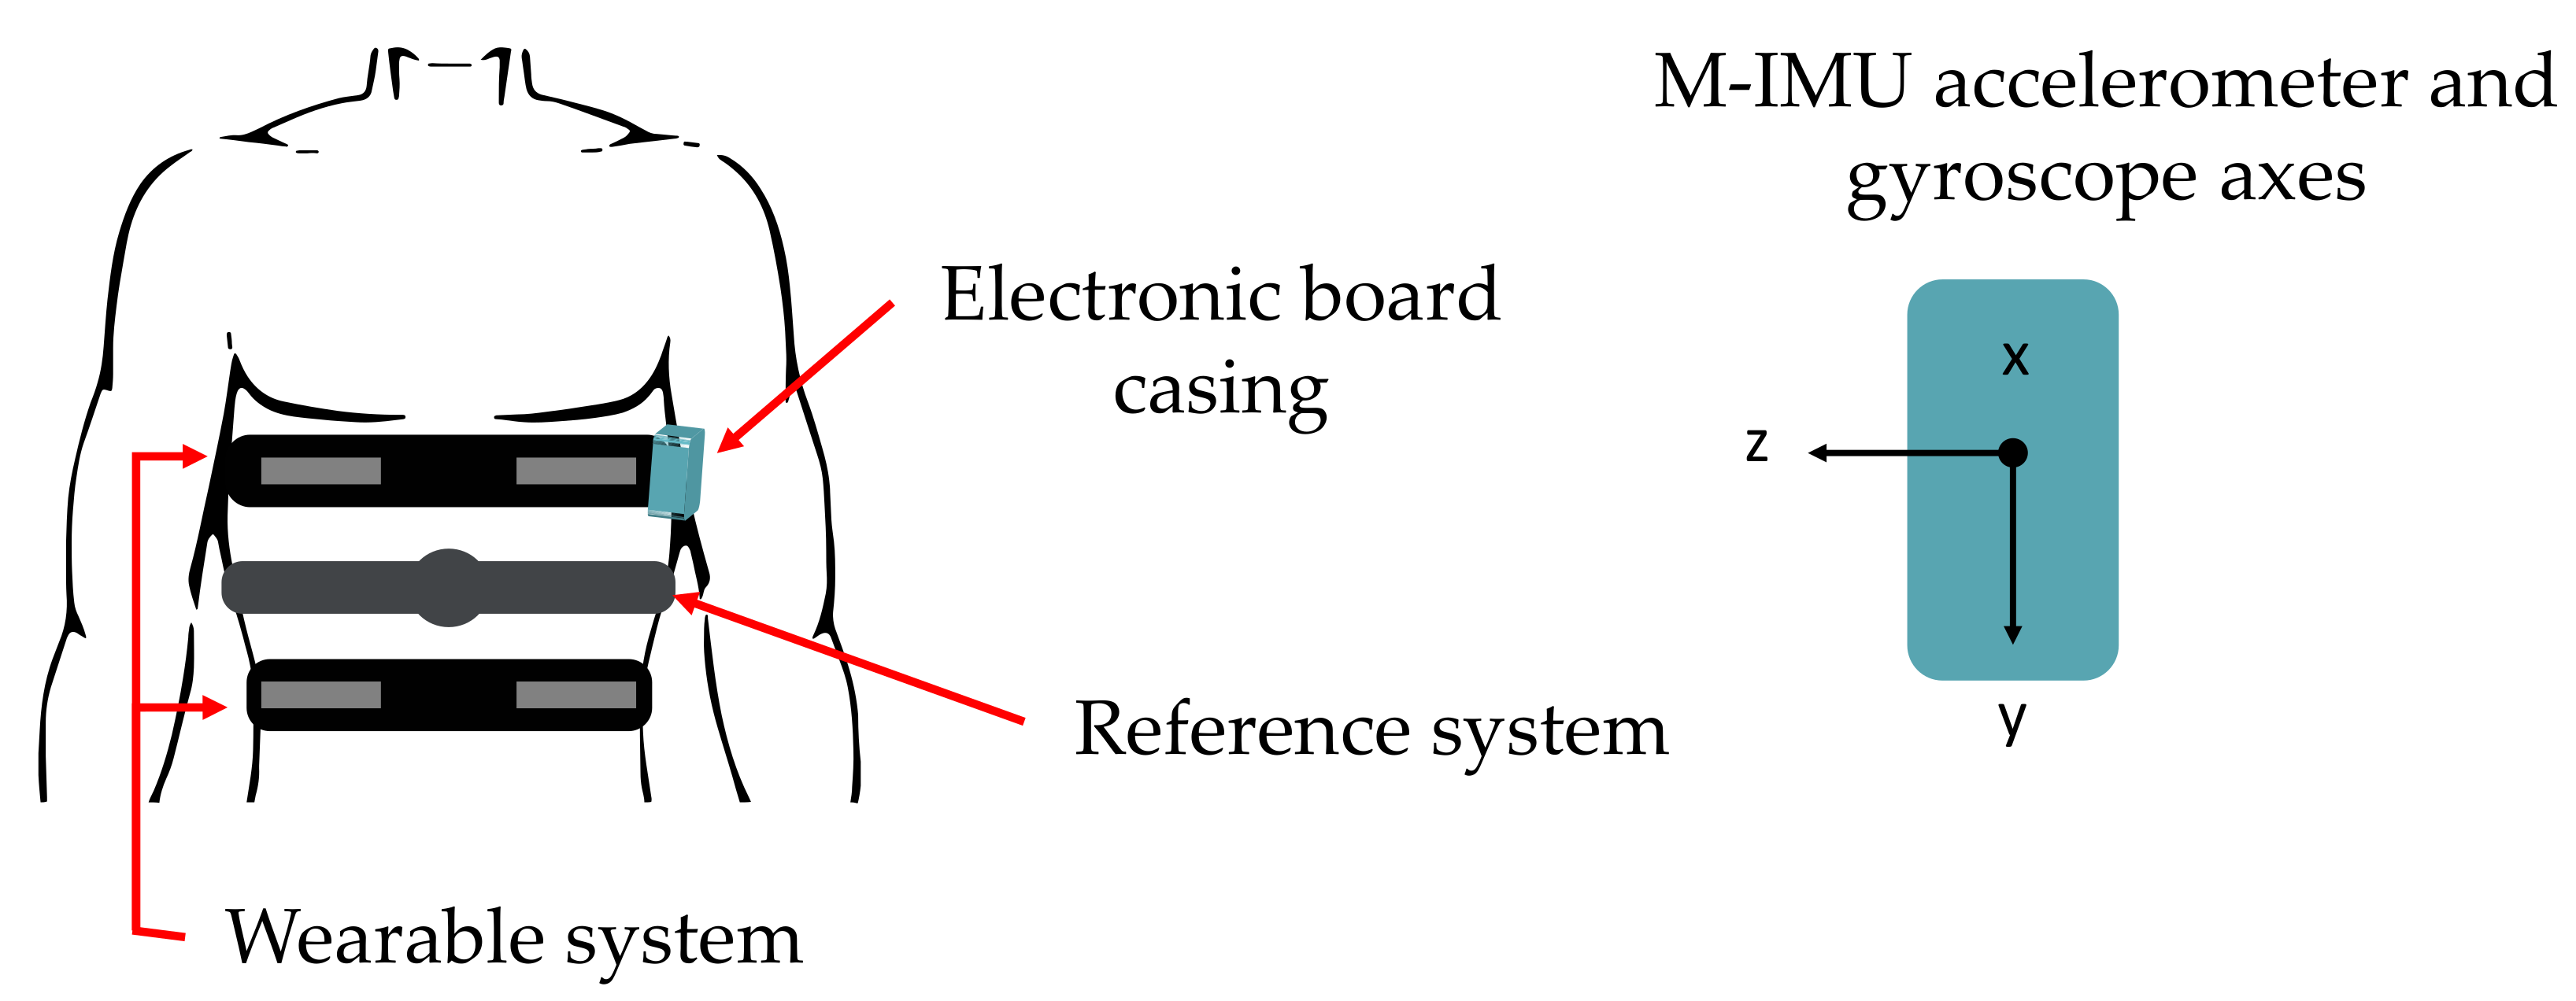
As shown in
Figure 1, the proposed wearable system embeds four conductive textiles sewed into two elastic bands located on the chest wall of the user (pulmonary rib cage and abdomen) for RR monitoring and an inertial measurement unit (IMU) integrated within a custom and compact PCB (located on the left side of pulmonary rib cage) for retrieving HR in terms of SCG and GCG.
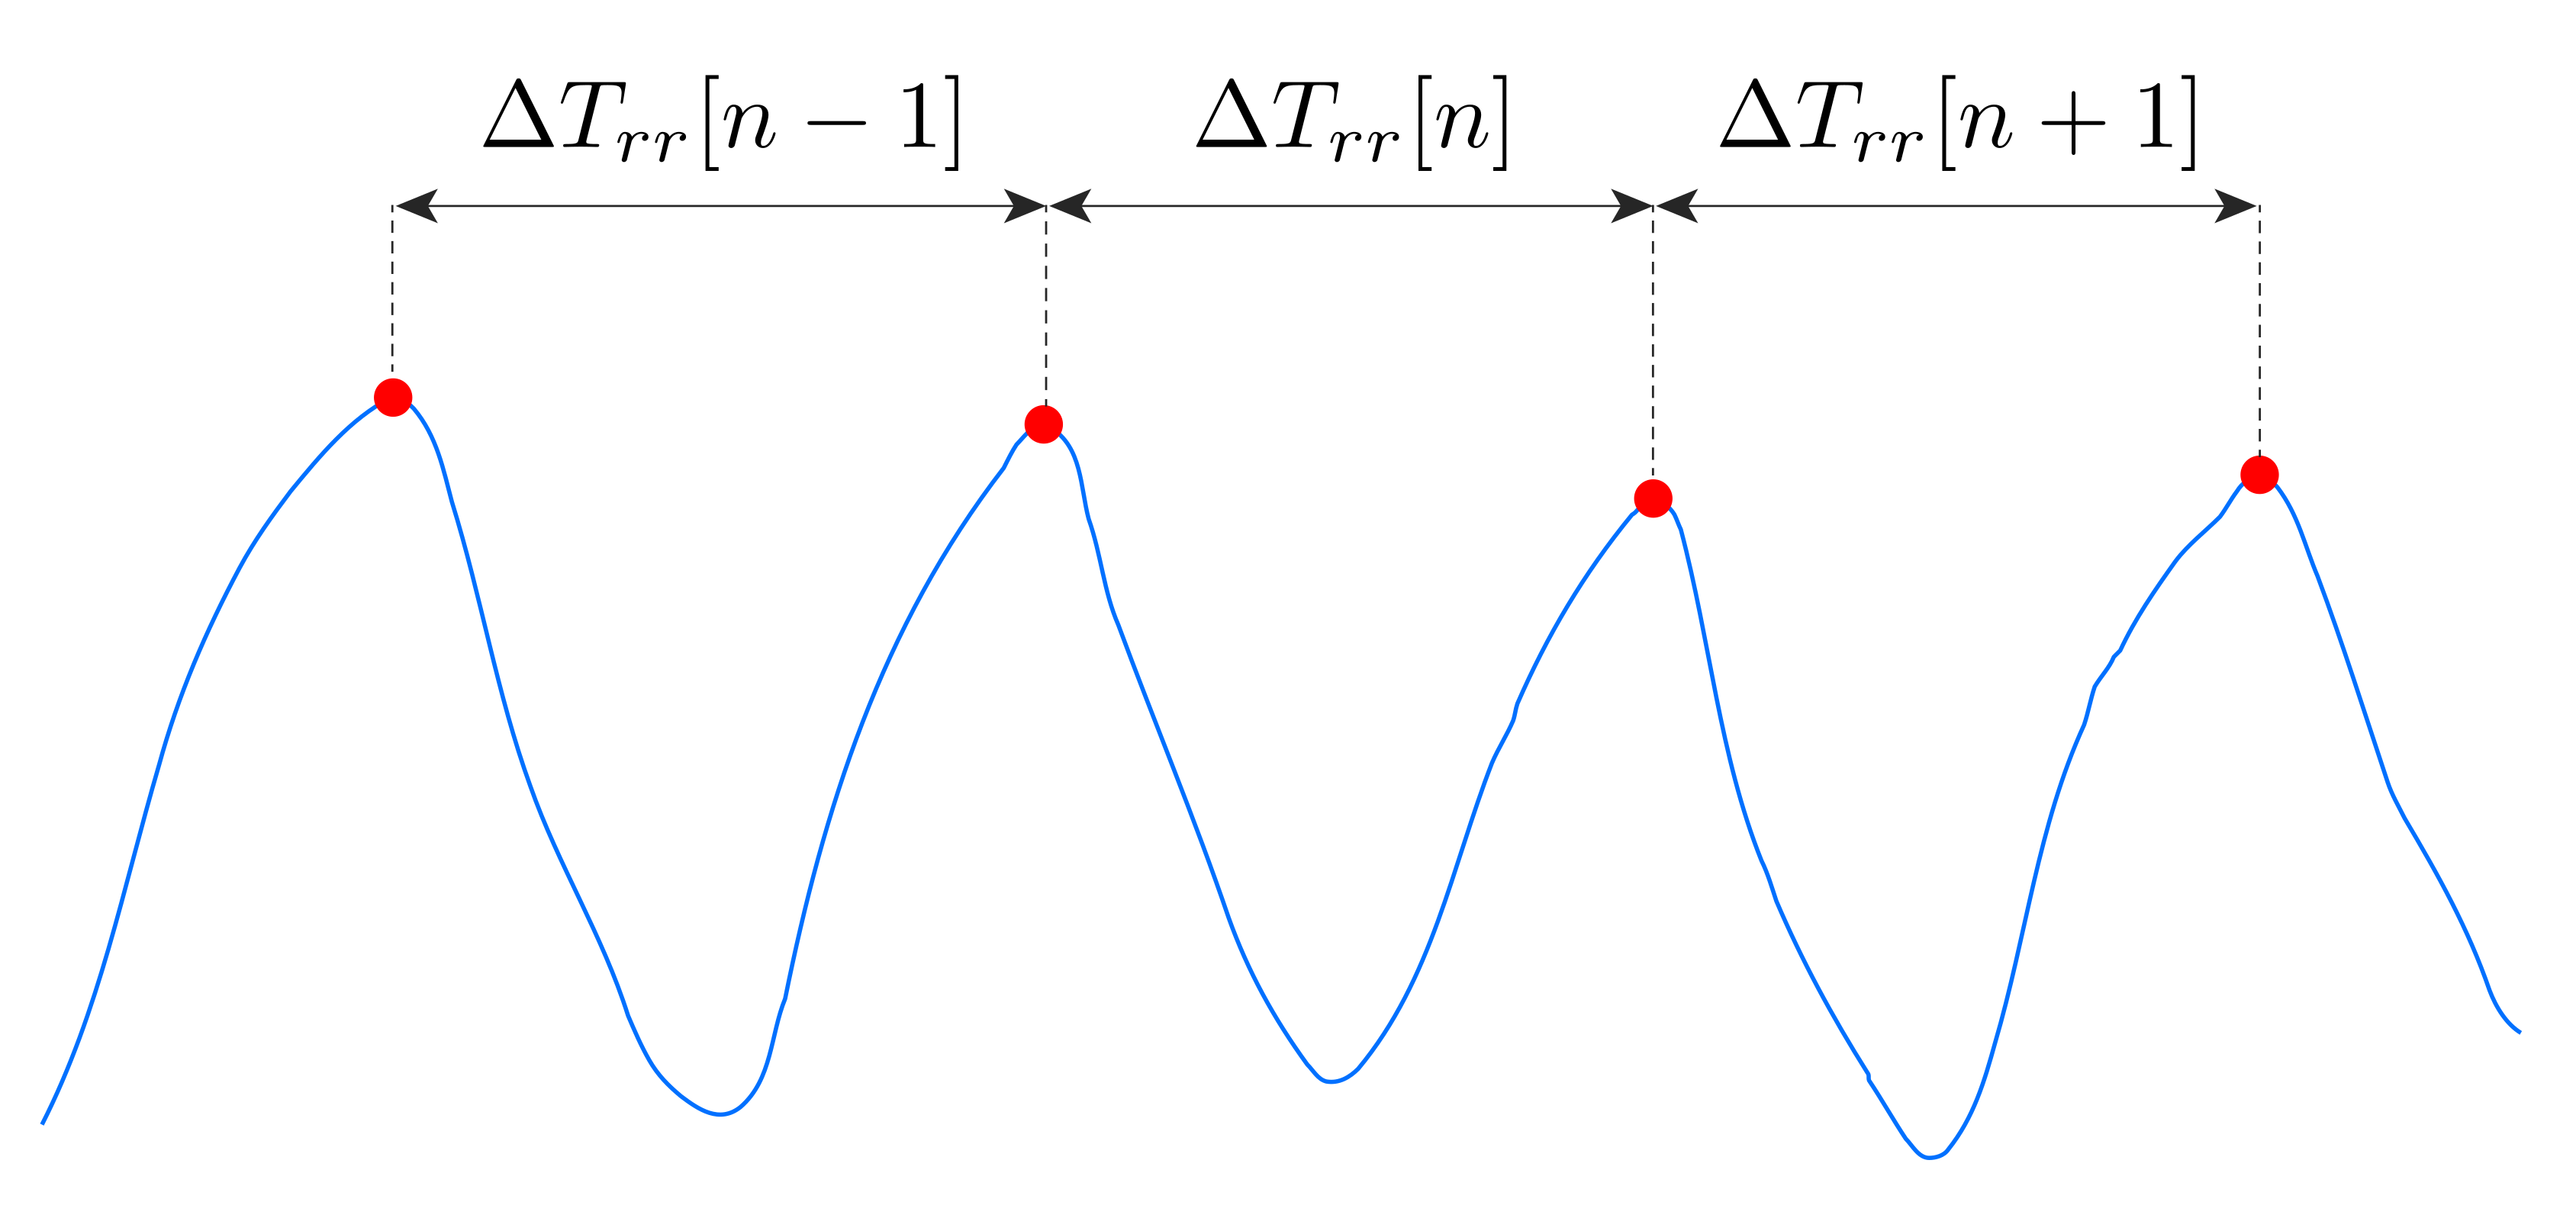
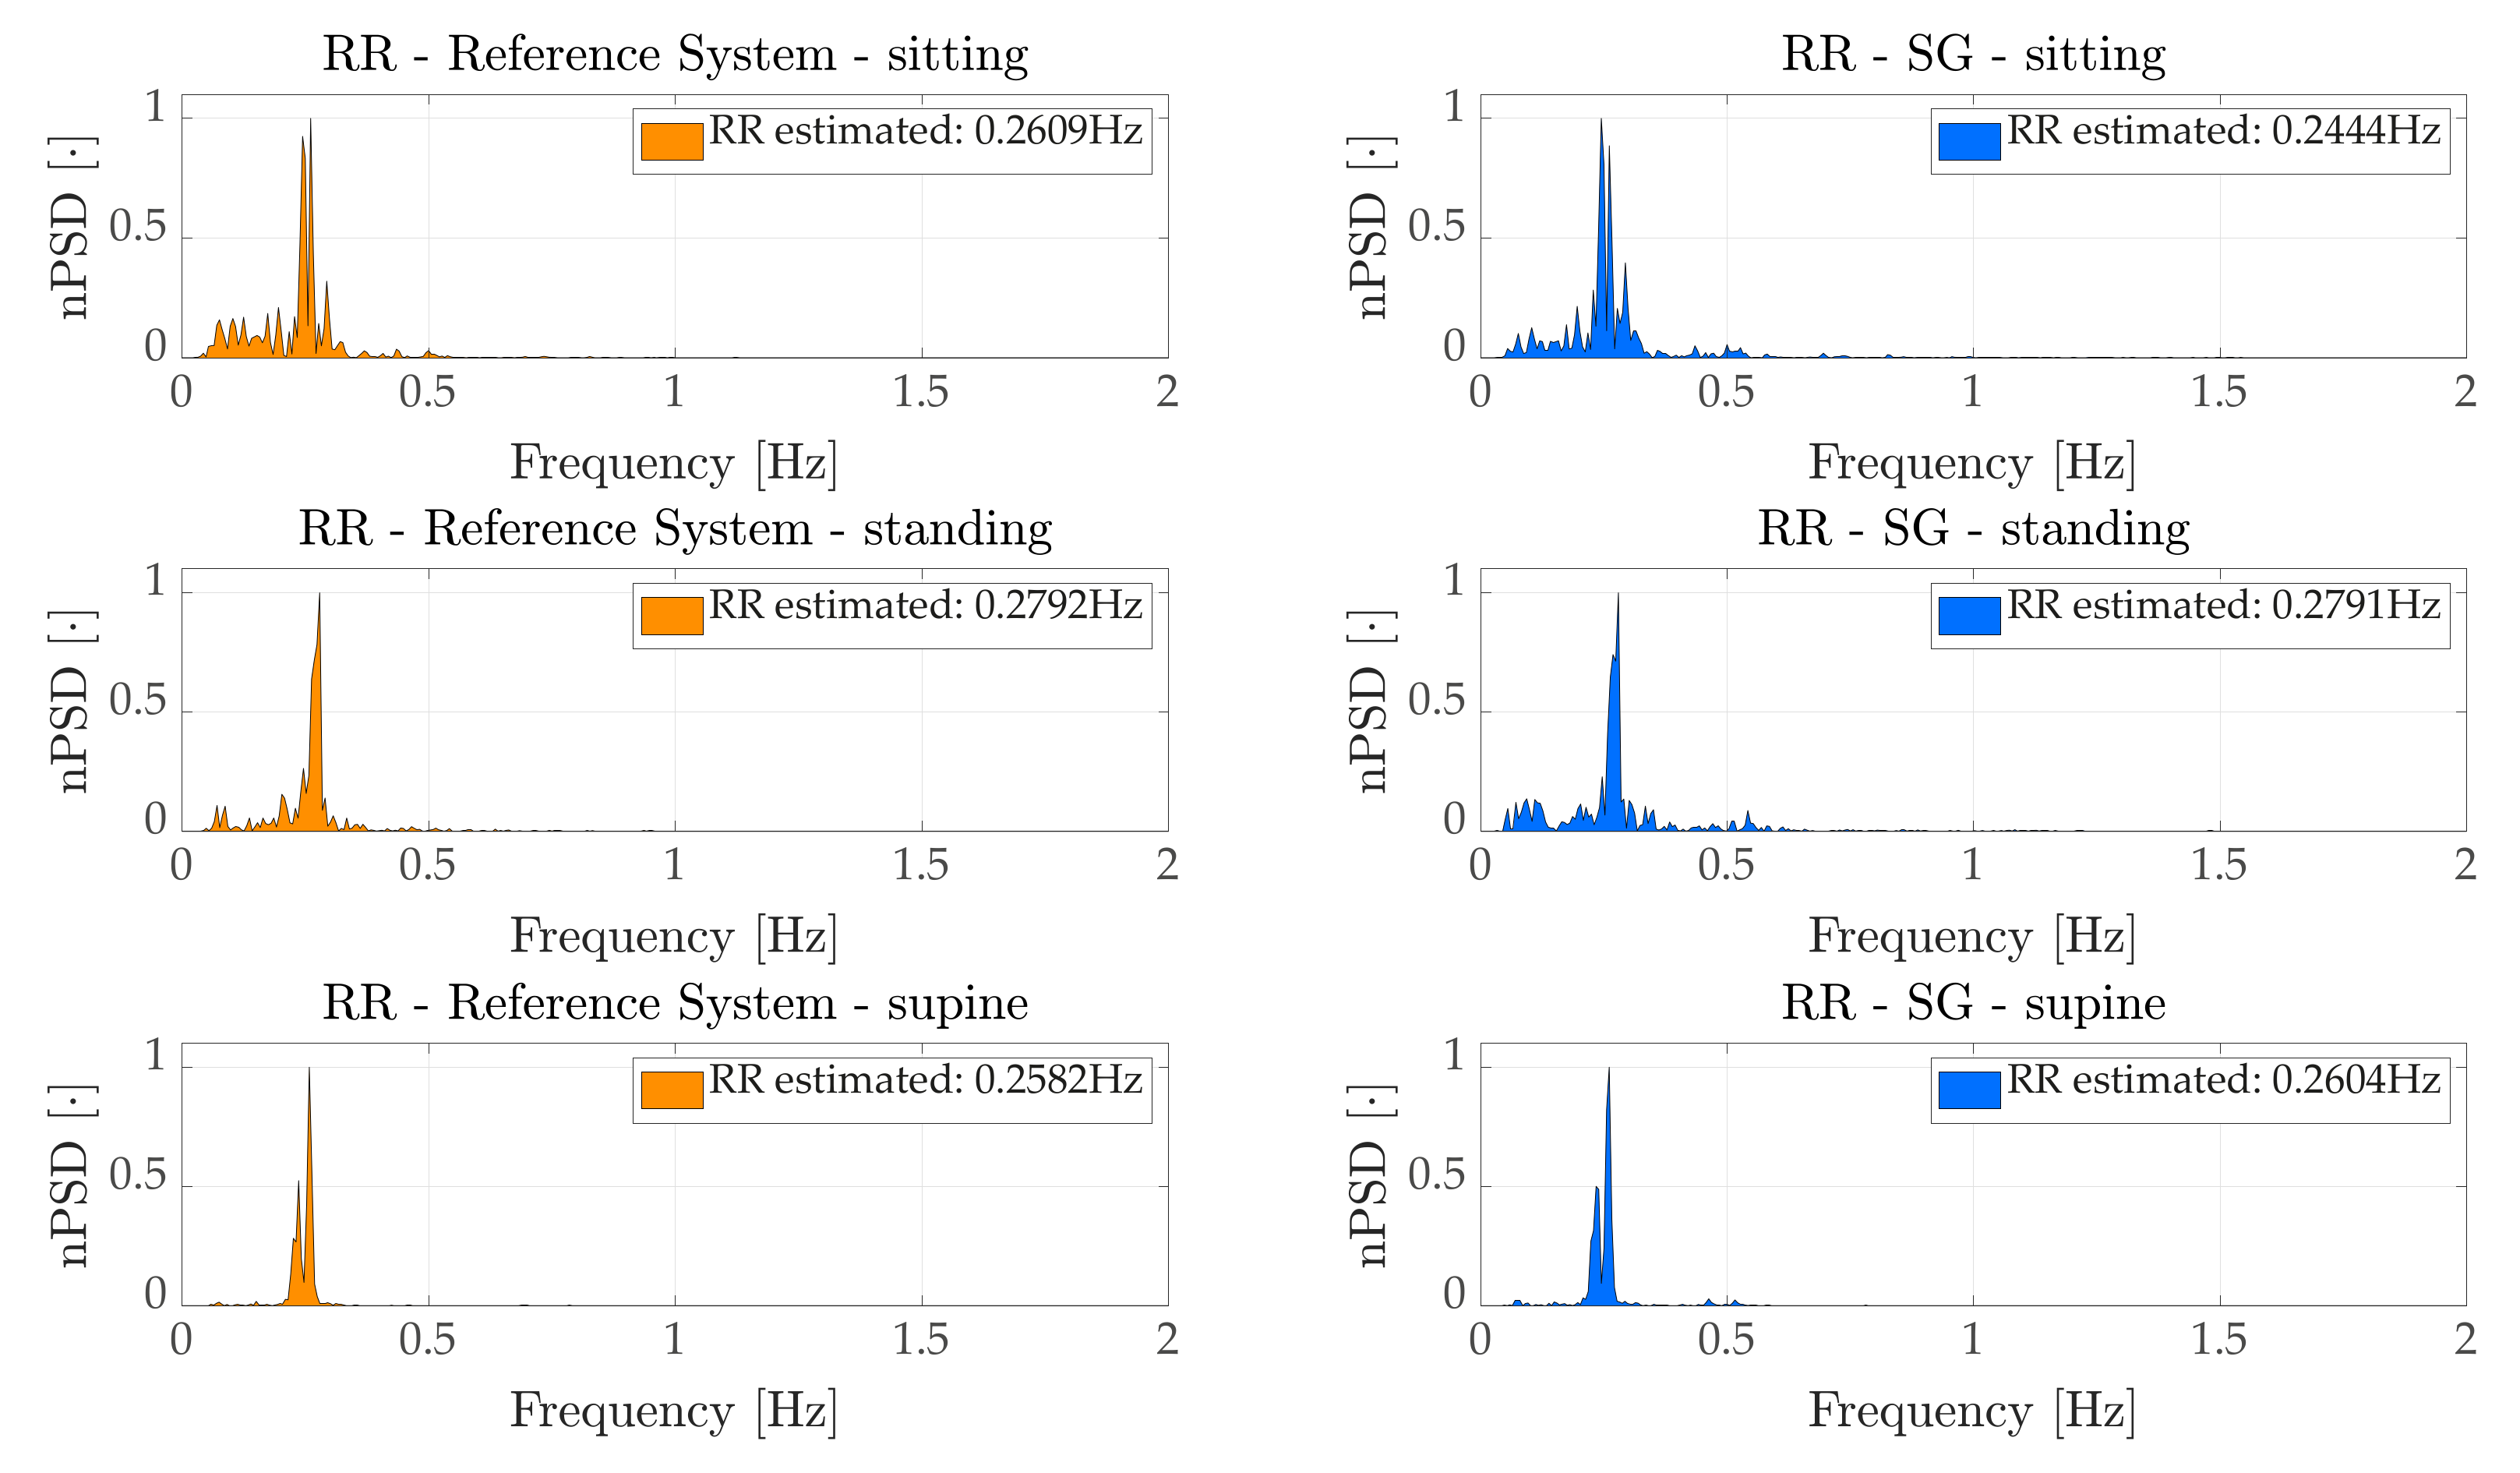
Concerning the breathing activity, we monitored both average RR, by means of a frequency domain analysis (
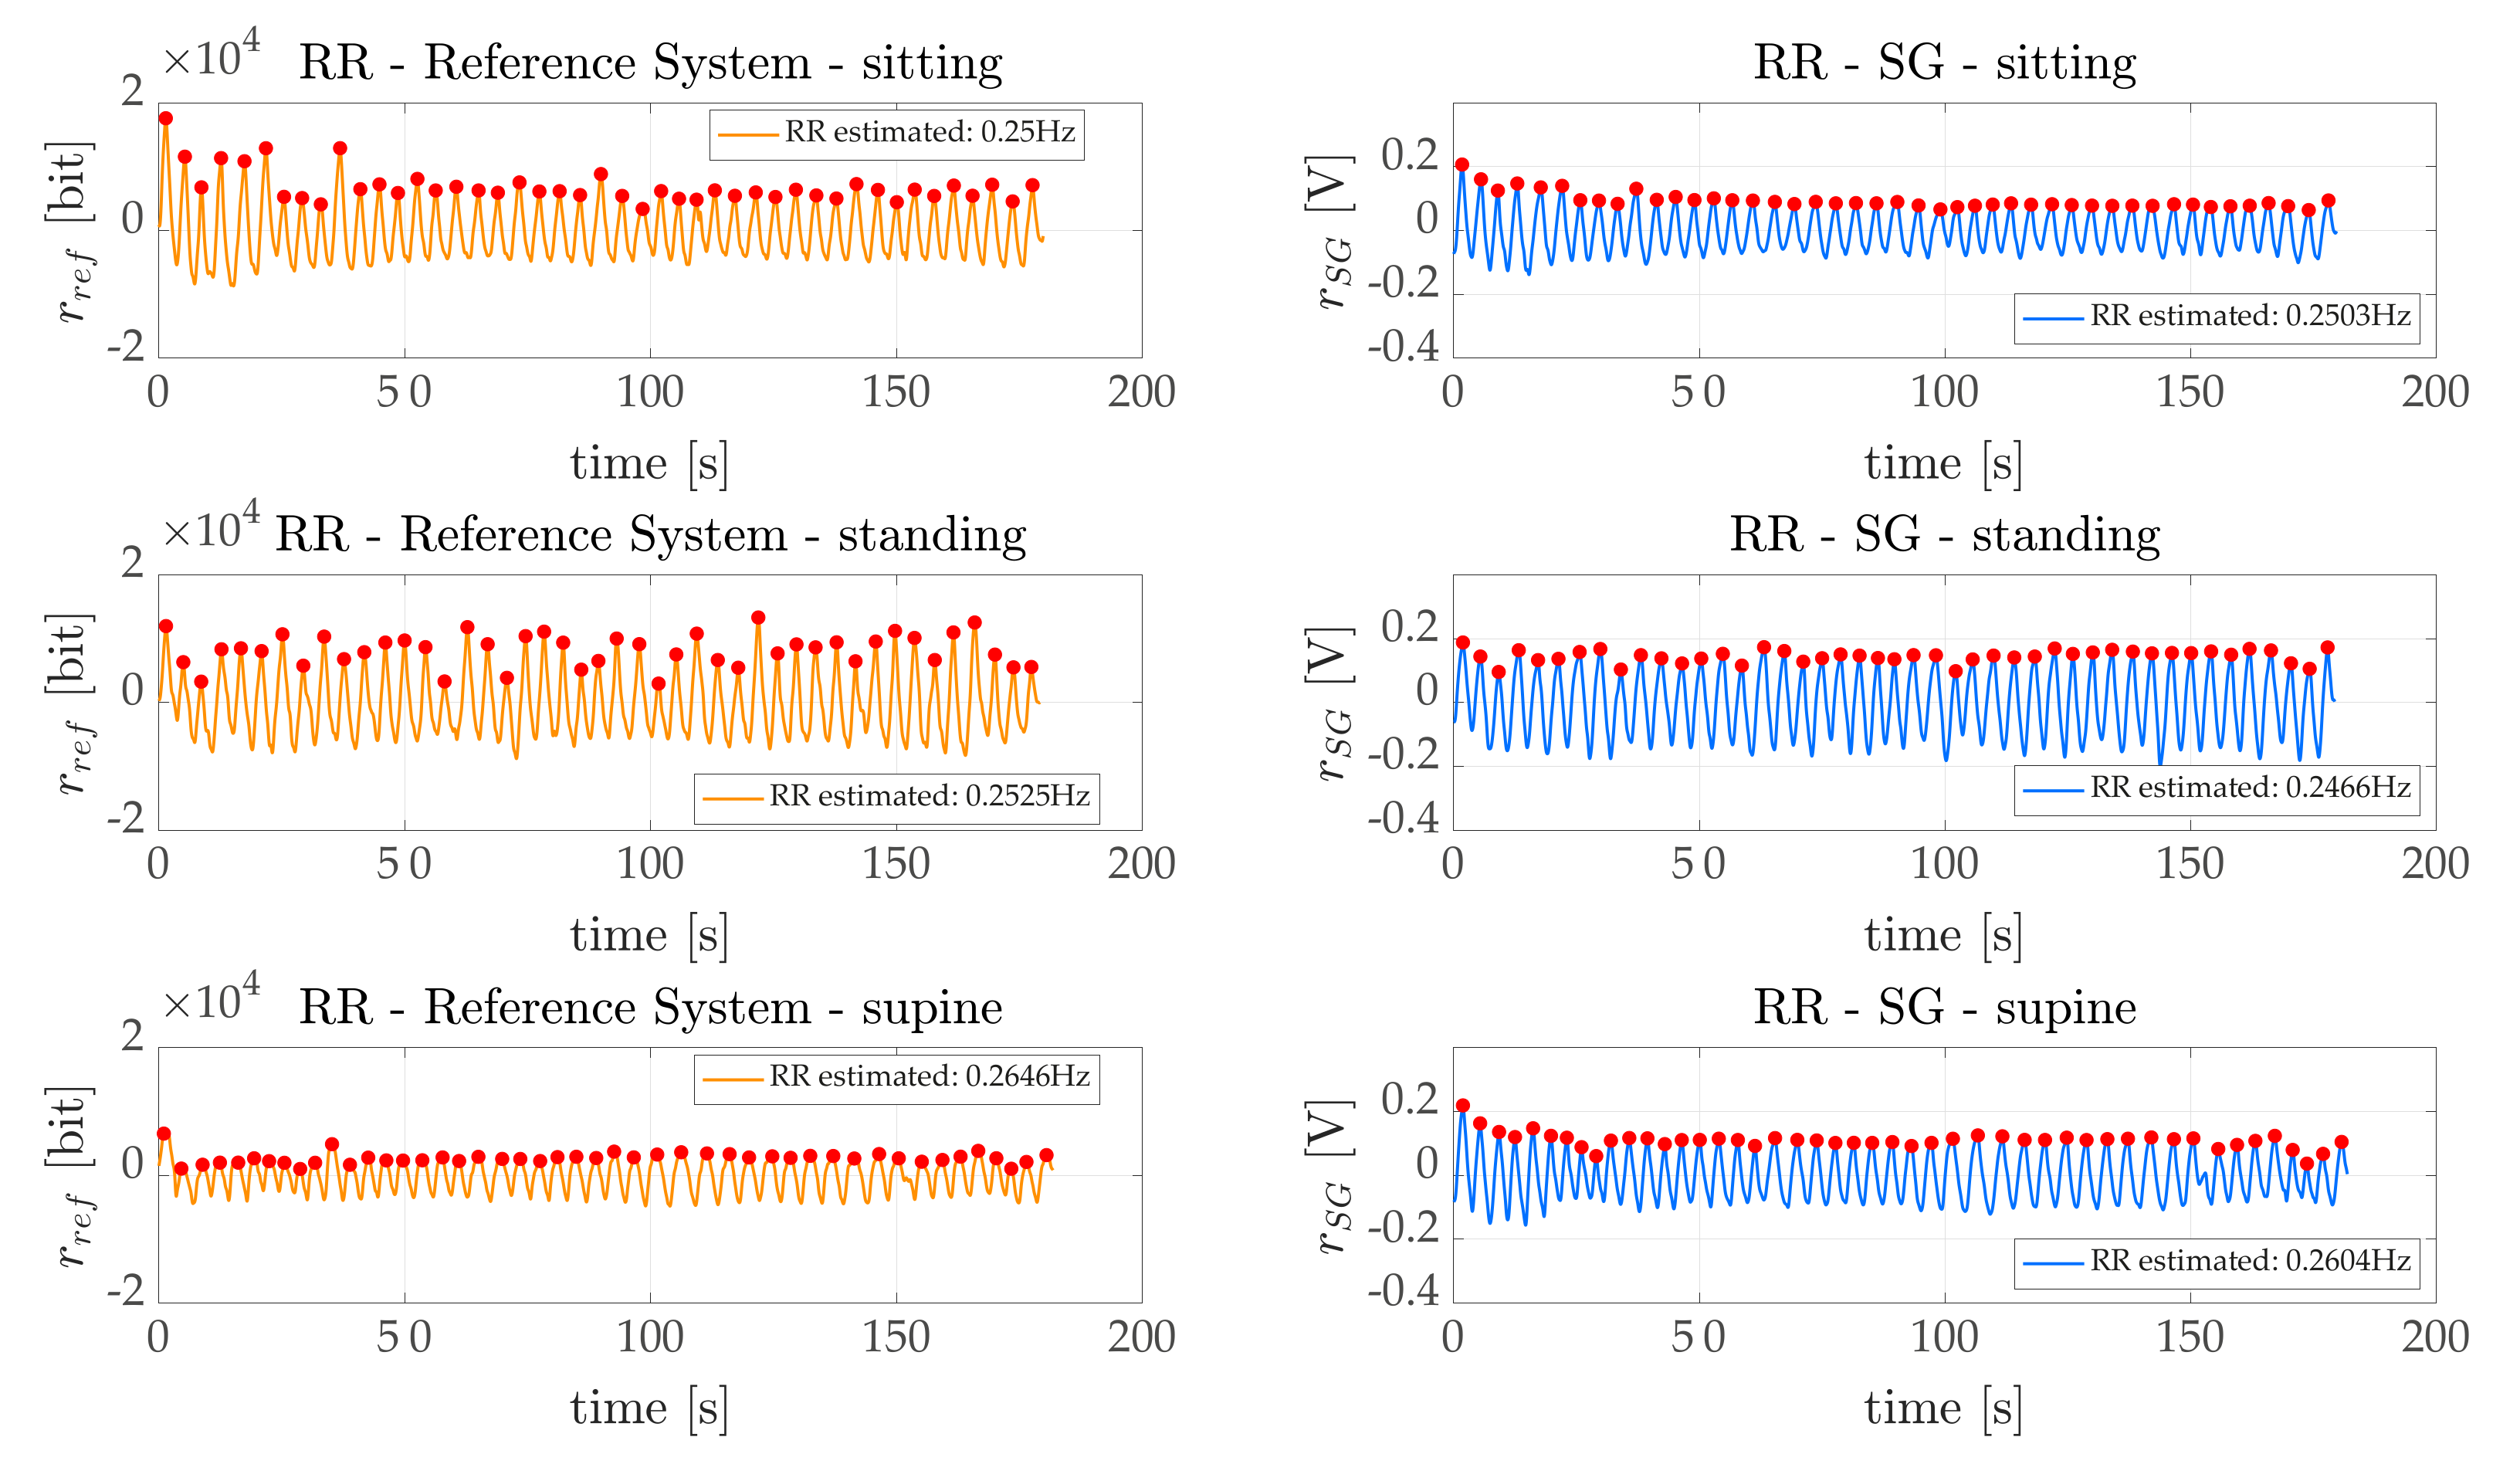
Section 5.1.1), and RR breath-by-breath, through a time domain analysis (
Section 5.1.2). In both cases we considered
band-pass filtered using a zero phase shift filter and we compared the estimated RR with the one estimated by the reference system (
). According to
Section 6.1.1, the average RR estimated by the proposed
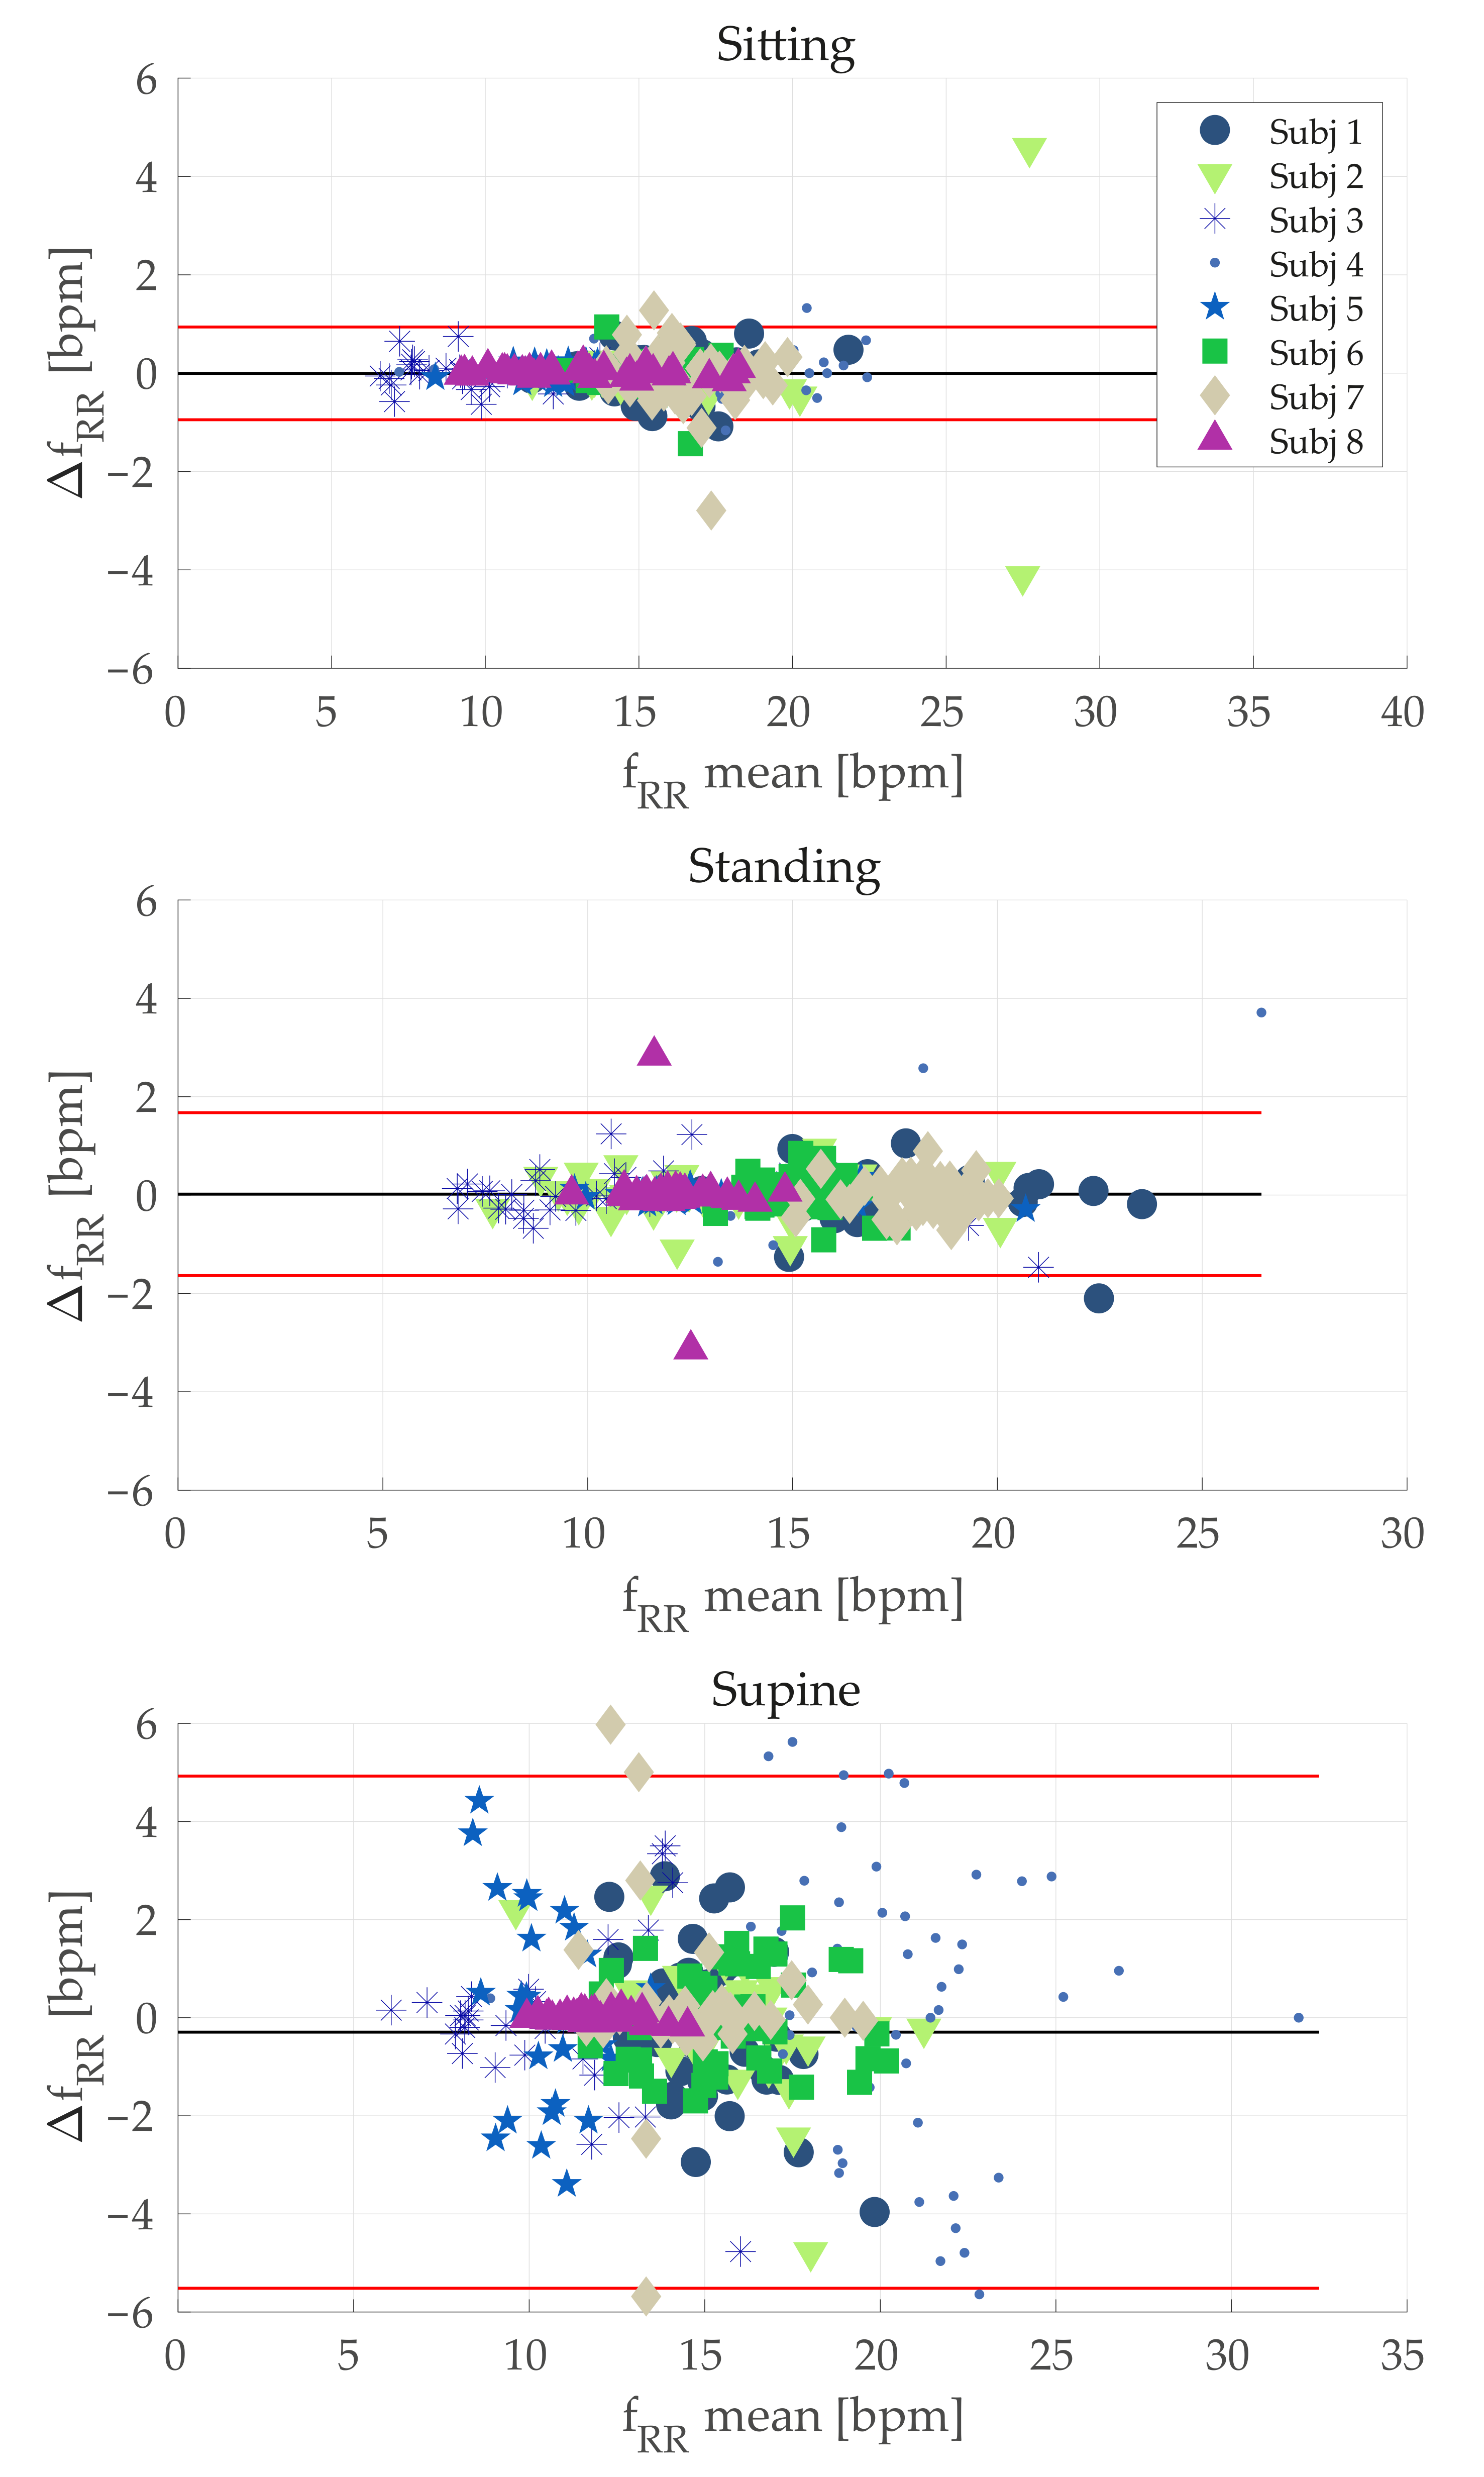
WS can be considered as reliable, since the errors obtained were, on average, fractions of the breath-per-minute in sitting and standing tasks. The average error was ~3 bpm when considering the supine task, which corresponds to an average percentage error of ~9%. Such results were confirmed in the time domain analysis (
Section 6.1.2). Indeed, the
obtained for sitting and standing are fractions of the breaths per minute. Additionally, in the worst case scenario (represented by the supine task) acceptable errors were obtained (~1.5 bpm, corresponding to a
of ~9.5%). The same behavior was obtained considering Bland–Altman analysis (see
Table 6 and
Figure 6). Although the MOD value was acceptable in all the cases, the LOAs were high especially for the supine position. A possible explanation for the worse results obtained during supine task may lie in an undesired interaction between the elastic bands with the support used let subjects lay down. Probably, in this configuration the elastic band stretched, thereby worsening the signals recorded by conductive sensors. The use of bands with the rear part being stiff instead of being elastic might solve this issue. However, this is just a speculation and future investigations will be devoted to study such aspects.
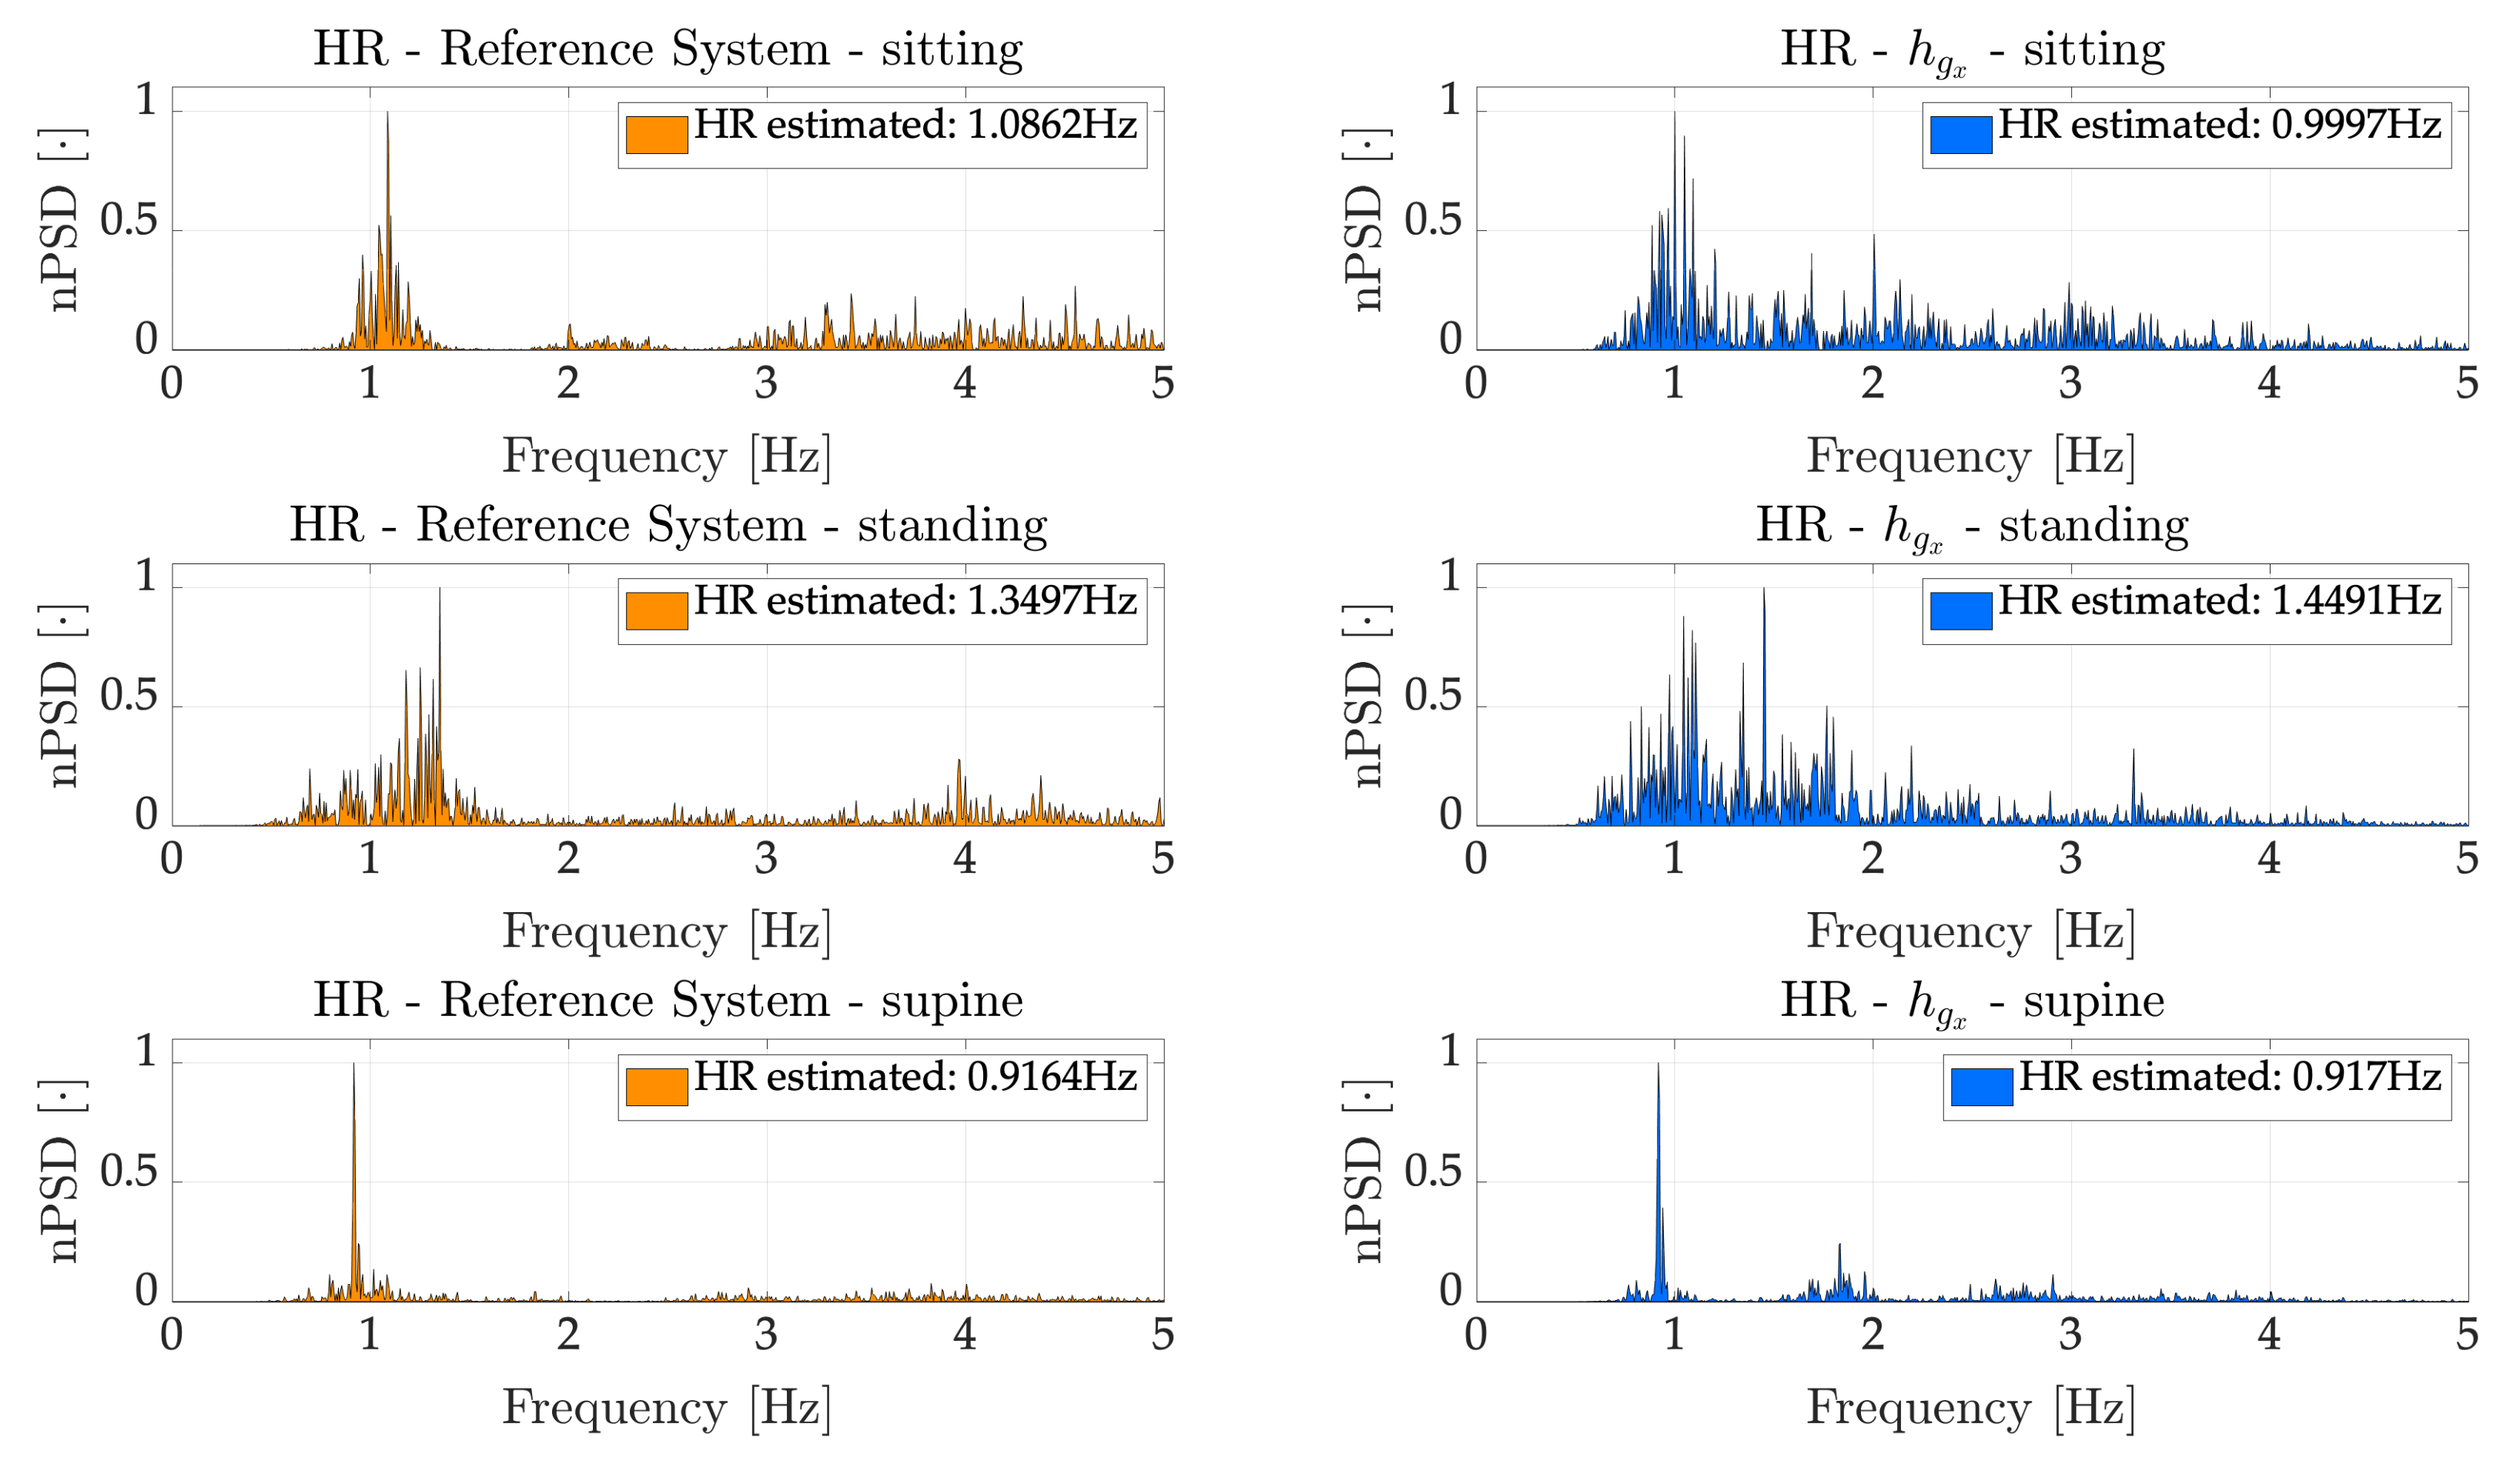
As regards HR, we considered the signals recorded by IMU. Firstly, we employed the Hilbert Transform to enhance the contribute of the heartbeat on the recorded signals, as already used in similar applications [
43,
44]. This technique allowed us to obtain the heartbeat envelope relative to the
x-axis of the accelerometer (
) and the
x-axis of the gyroscope (
). Considering such signals, we implemented a frequency domain analysis to estimate an average HR during the entire duration of the trials. Afterwards, we estimated the average HR on 30 s time windows to better assess the capabilities of the proposed device. In both cases, the results were compared with respect the ECG recorded by the reference system. Regarding the average HR, estimated considering the entire duration of the trials,
and
returned similar results in sitting and supine tasks, while
(average error of 3.81 bpm, corresponding to a percentage error of 5.75%) prominently outperformed
(average error of 13.82 bpm, corresponding to a percentage error of 23.26%) considering the standing task. This is likely due to the higher sensitivity of the accelerometer to the body motions, which are higher in standing being the subjects less constrained than in sitting and supine. As expected, the best results were obtained in the supine scenario (average error of 0.29 bpm and percentage error of 0.46% considering
, while 0.37 bpm and 0.59% considering
), where most of the movements detected by the IMU are due to heartbeat, once the respiration has been filtered out. Considering the average HR on a 30 s time window, we considered only
, on the basis the better results obtained in the above-mentioned frequency domain analysis, which allowed obtaining error (averaged along subjects) of ~3.5 bpm (~5.5%), ~4.5 bpm (~3.2%) and ~16 bpm (~18.9%) in sitting, supine and standing tasks respectively.
A few studies have investigated to simultaneously monitor breathing and cardiac activities, and the proposed system show error in line with the systems reported in literature [
22,
36,
37,
38]. Results presented in [
22] show errors smaller than ~2% and ~6%; however, fiber Bragg grating sensors were used, which require more expensive and bulky systems to retrieve the signals, and above all, the HR were estimated during apnea. In [
36], where the authors used a belt embedding textile electrodes for recording ECG and breathing activity through impedance variation of the chest wall. They showed errors of ~2% concerning RR estimation and better results in terms of HR estimation. Despite the very good results obtained, the main drawback of this solution lays in the contact required between the electrodes and the skin of the subjects and the need to continue guarantee a low impedance at the contact points. A similar approach was proposed by [
37]; however, no performance comparisons with a reference system were presented. In [
38] the system proposed is based on a single piezoelectric sensors which allowed the authors to obtain errors of (in average) ~10% and ~6% for RR and HR respectively. To conclude the comparison, the main advantage of our solution lays in the ease of use, simple and low cost electronics required and high wearability and comfort, which does not require direct contact with the skin or further adjustments of the sensors after they are worn by the user. Moreover, because of the presence of IMU within the device, it is possible to exploit their sensitivity on body motion artifacts to further improve the estimation of RR, similarly to [
20,
46].
The present work is mainly focused on the design of the device and the technology, rather than implementing or assessing robust and efficient algorithms to remove motion artifact from recorded signals during the everyday life. However, we reckon that the problem of motion artifact removal should be taken into account since in a real-life scenario, movements of the subjects can occur. To overcome this concern, different solutions have been proposed for both RR [
20,
28,
47,
48] and regarding HR [
33,
41,
49,
50,
51]. Future works will be devoted to defining a tailored approach on our system, by combining the two different sensor technologies embedded (i.e., textile strain sensors and an M-IMU) to develop a sensor-fusion algorithm to remove motion artifacts occurring during real life.
Future works will be devoted to further improve the proposed system to enhance its capabilities of HR and RR estimation. Indeed, in its present version, the sensors are sewed on two elastic bands which, despite being comfortable for an ease removal, introduce an additional compliance thus reducing the sensitivity of the conductive sensors. This contingency does not allow them to reliably catch the SCG activity. Therefore, as a future work we are planning on sewing the sensors directly onto an elastic t-shirt (i.e., sportswear) to reduce as much as possible additional compliant elements between the sensors and the user, aiming at investigating whether conductive sensors allow also reliably and robustly monitoring HR, as much as they do with respect RR. Moreover, this may lead to a lower system complexity, to slightly improve its cost and to provide a more comfortable system. In addition, we will test the improved system on a larger population, including females and pathological subjects, to evaluate its potential use also in clinical settings. Since we tested the device on only male subjects, we can just speculate that the use of the proposed device might not be of any discomfort on female subjects. Taking into account what most women wear during sport activities (i.e., sport bras), the use of the upper band of the proposed device should not be of relevant discomfort, since they also allow being regulated in length thanks to the provided Velcro. We are convinced that with the improved device this potential discomfort will be avoided. In addition, the respiratory movements will be hardly detected by the upper band due to the presence of the breast. However, this hurdle will be overcome thanks to the presence of the second band. Moreover, we will evaluate the system performances during different daily living activities which result to be more challenging but represent a typical use of the proposed system. Finally, it is worth noting that we used basic data analysis techniques; therefore, more sophisticated analyses (e.g., based on machine learning methods) may allow improving the estimation of respiratory and cardiac parameters.


 ,
, 


