Surface Analysis of 3D (SLM) Co–Cr–W Dental Metallic Materials

 ,
, 


Abstract
Featured Application
Abstract
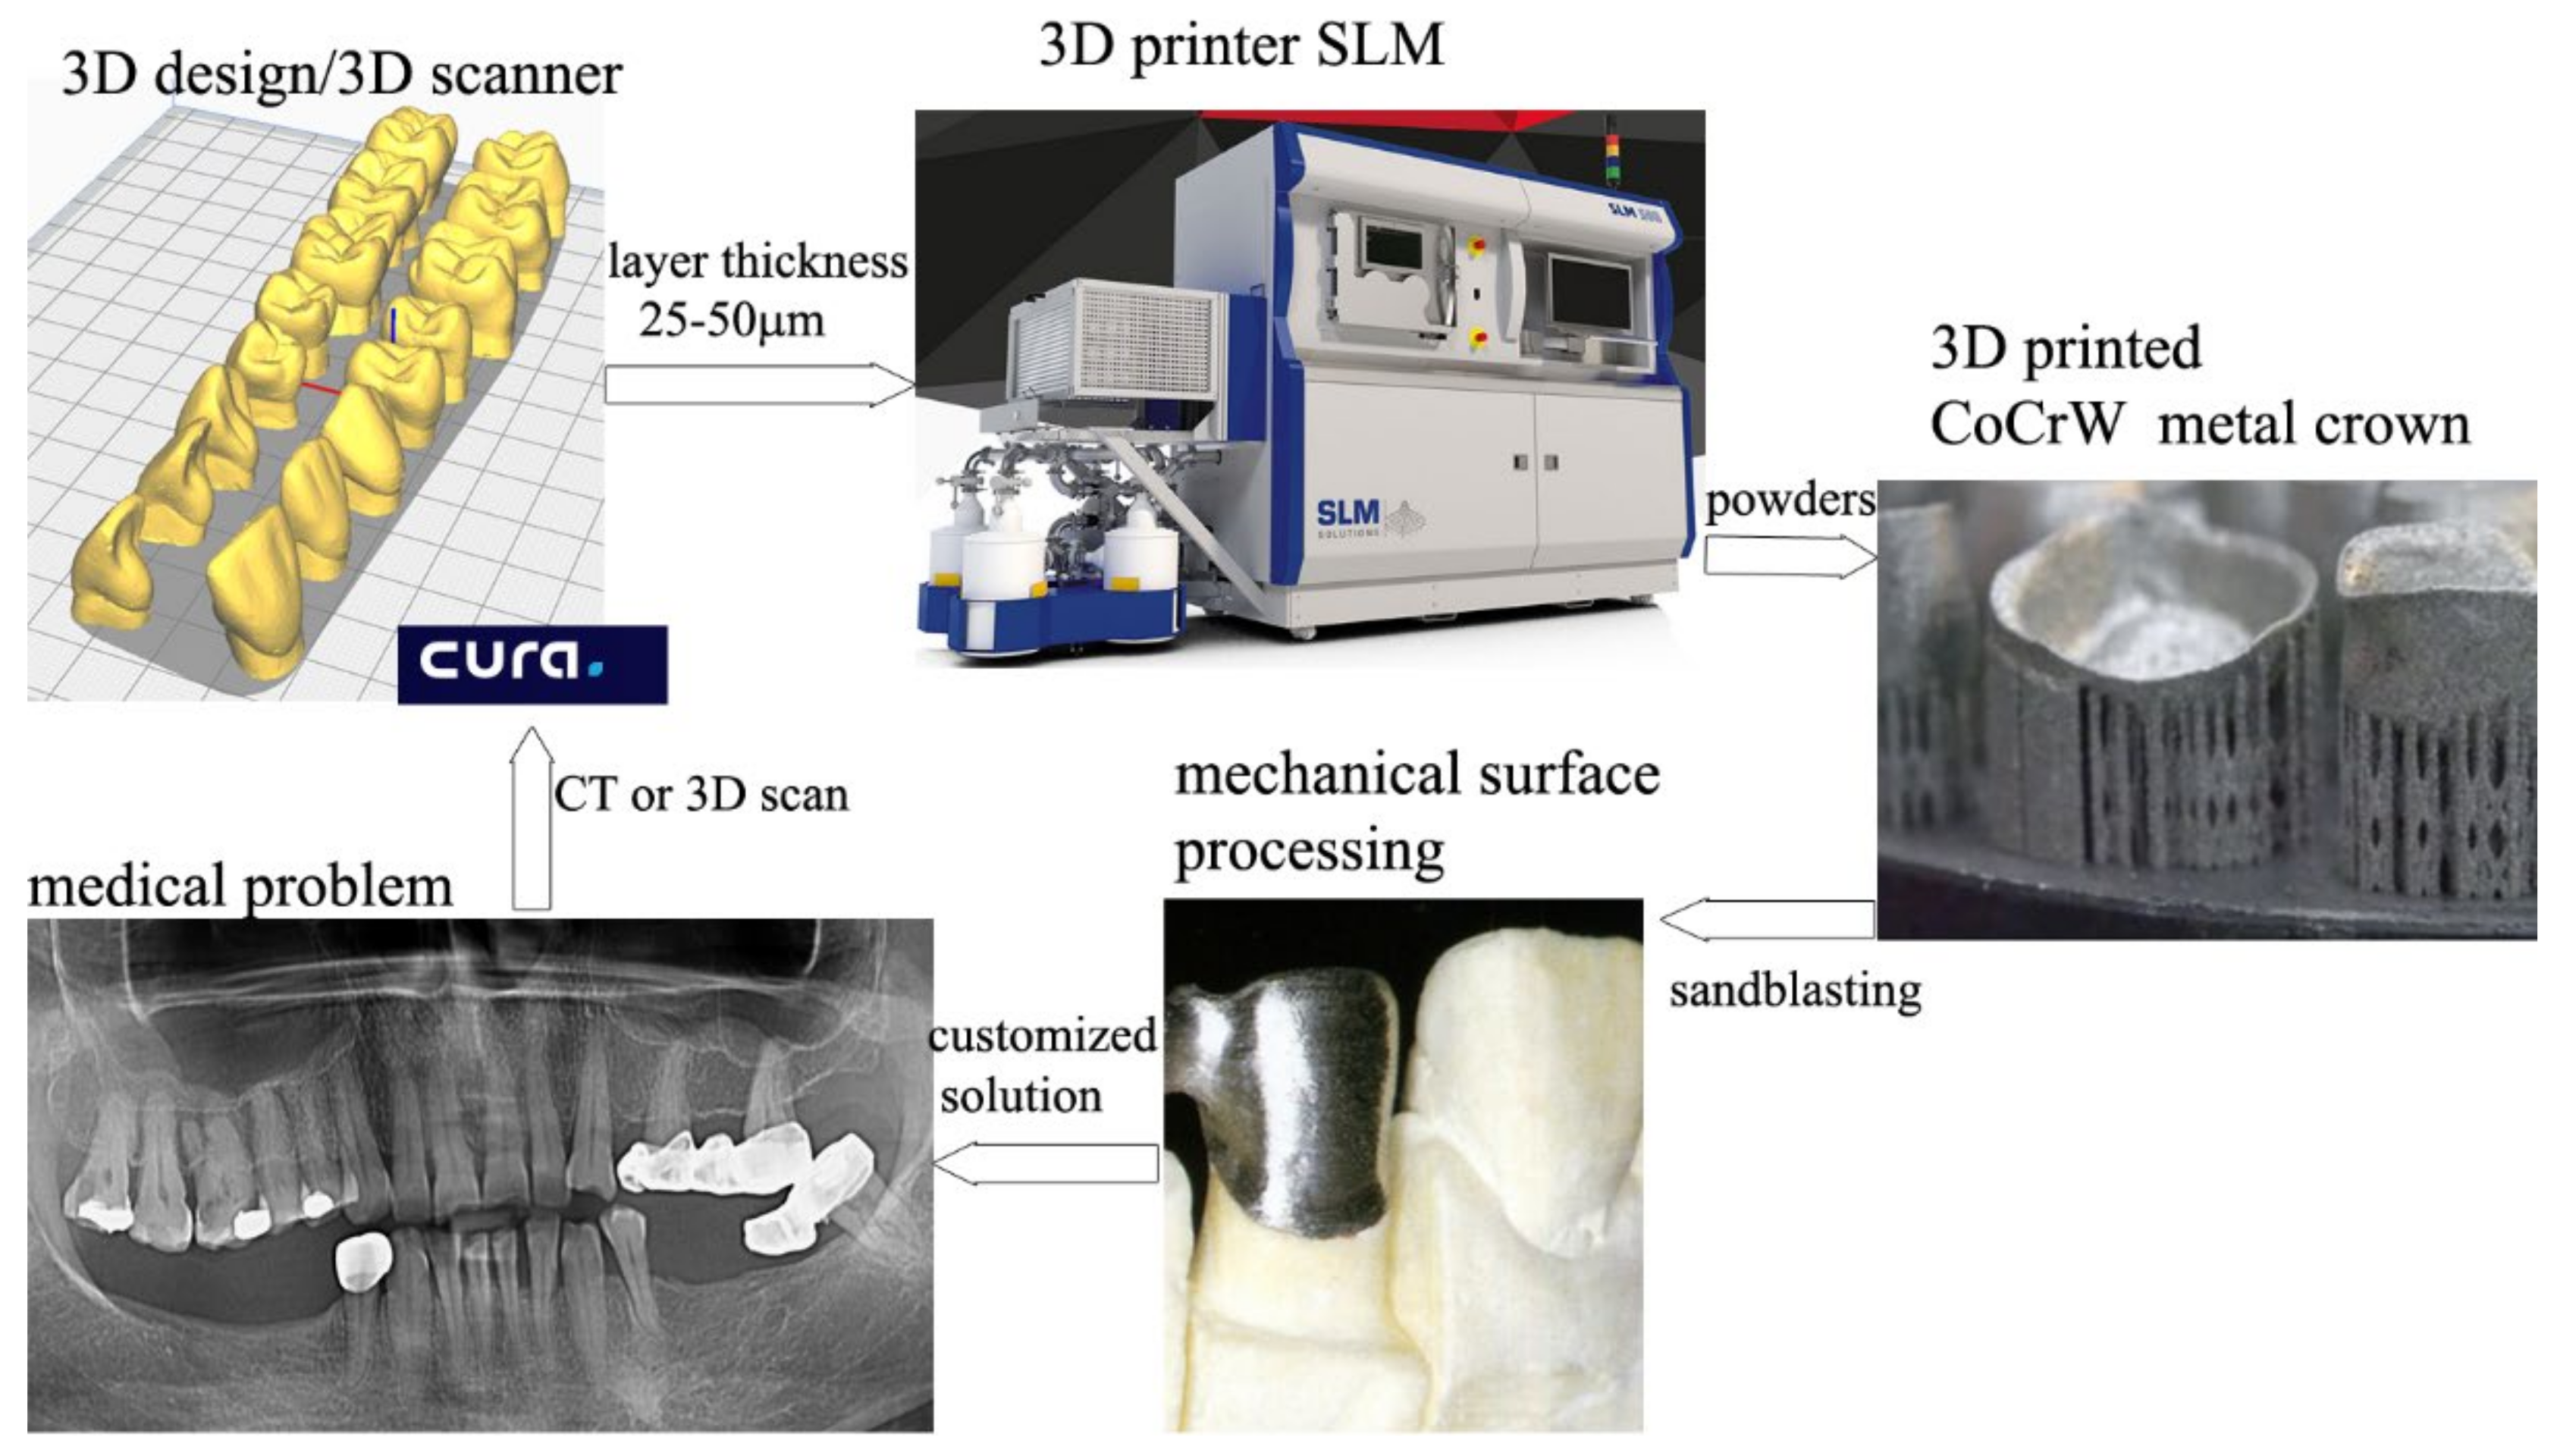
1. Introduction
2. Materials and Methods
2.1. Materials and Techniques
2.2. Wettability (Contact Angle) Determinations
2.3. Microstructural and Chemical Surface Analysis
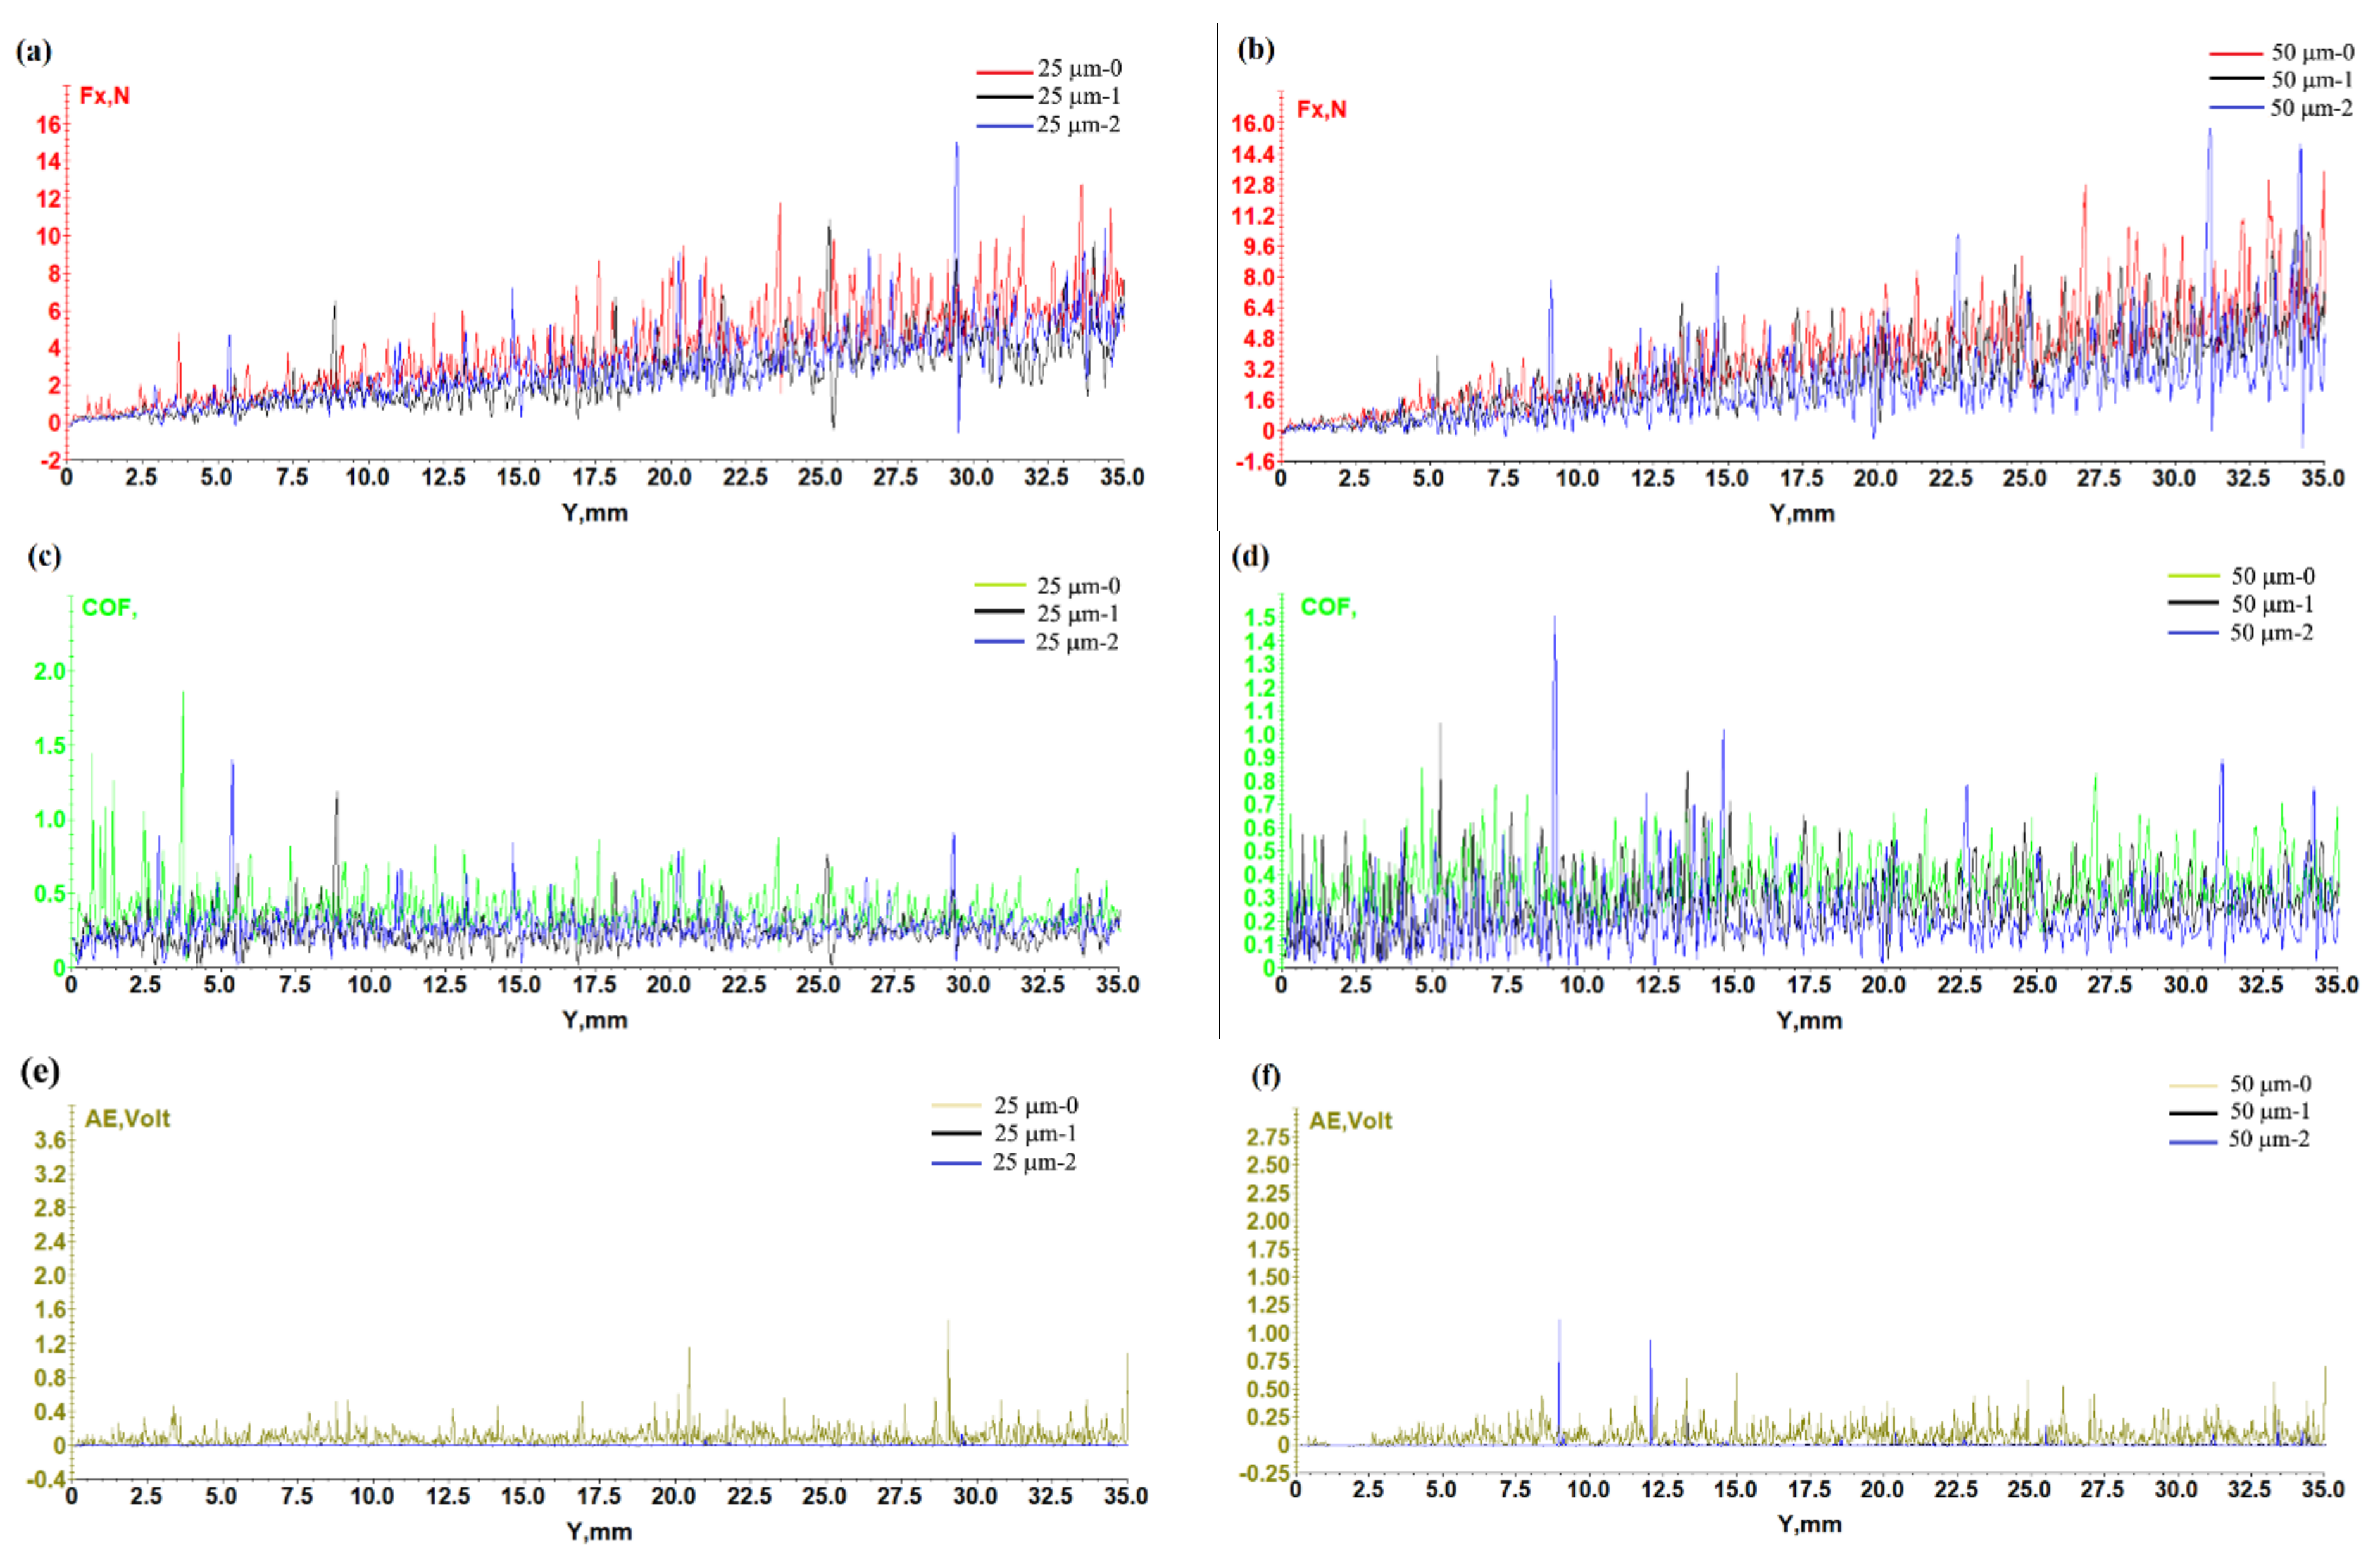
2.4. Profilometry, Scratch Test, and Microhardness
3. Results and Discussion
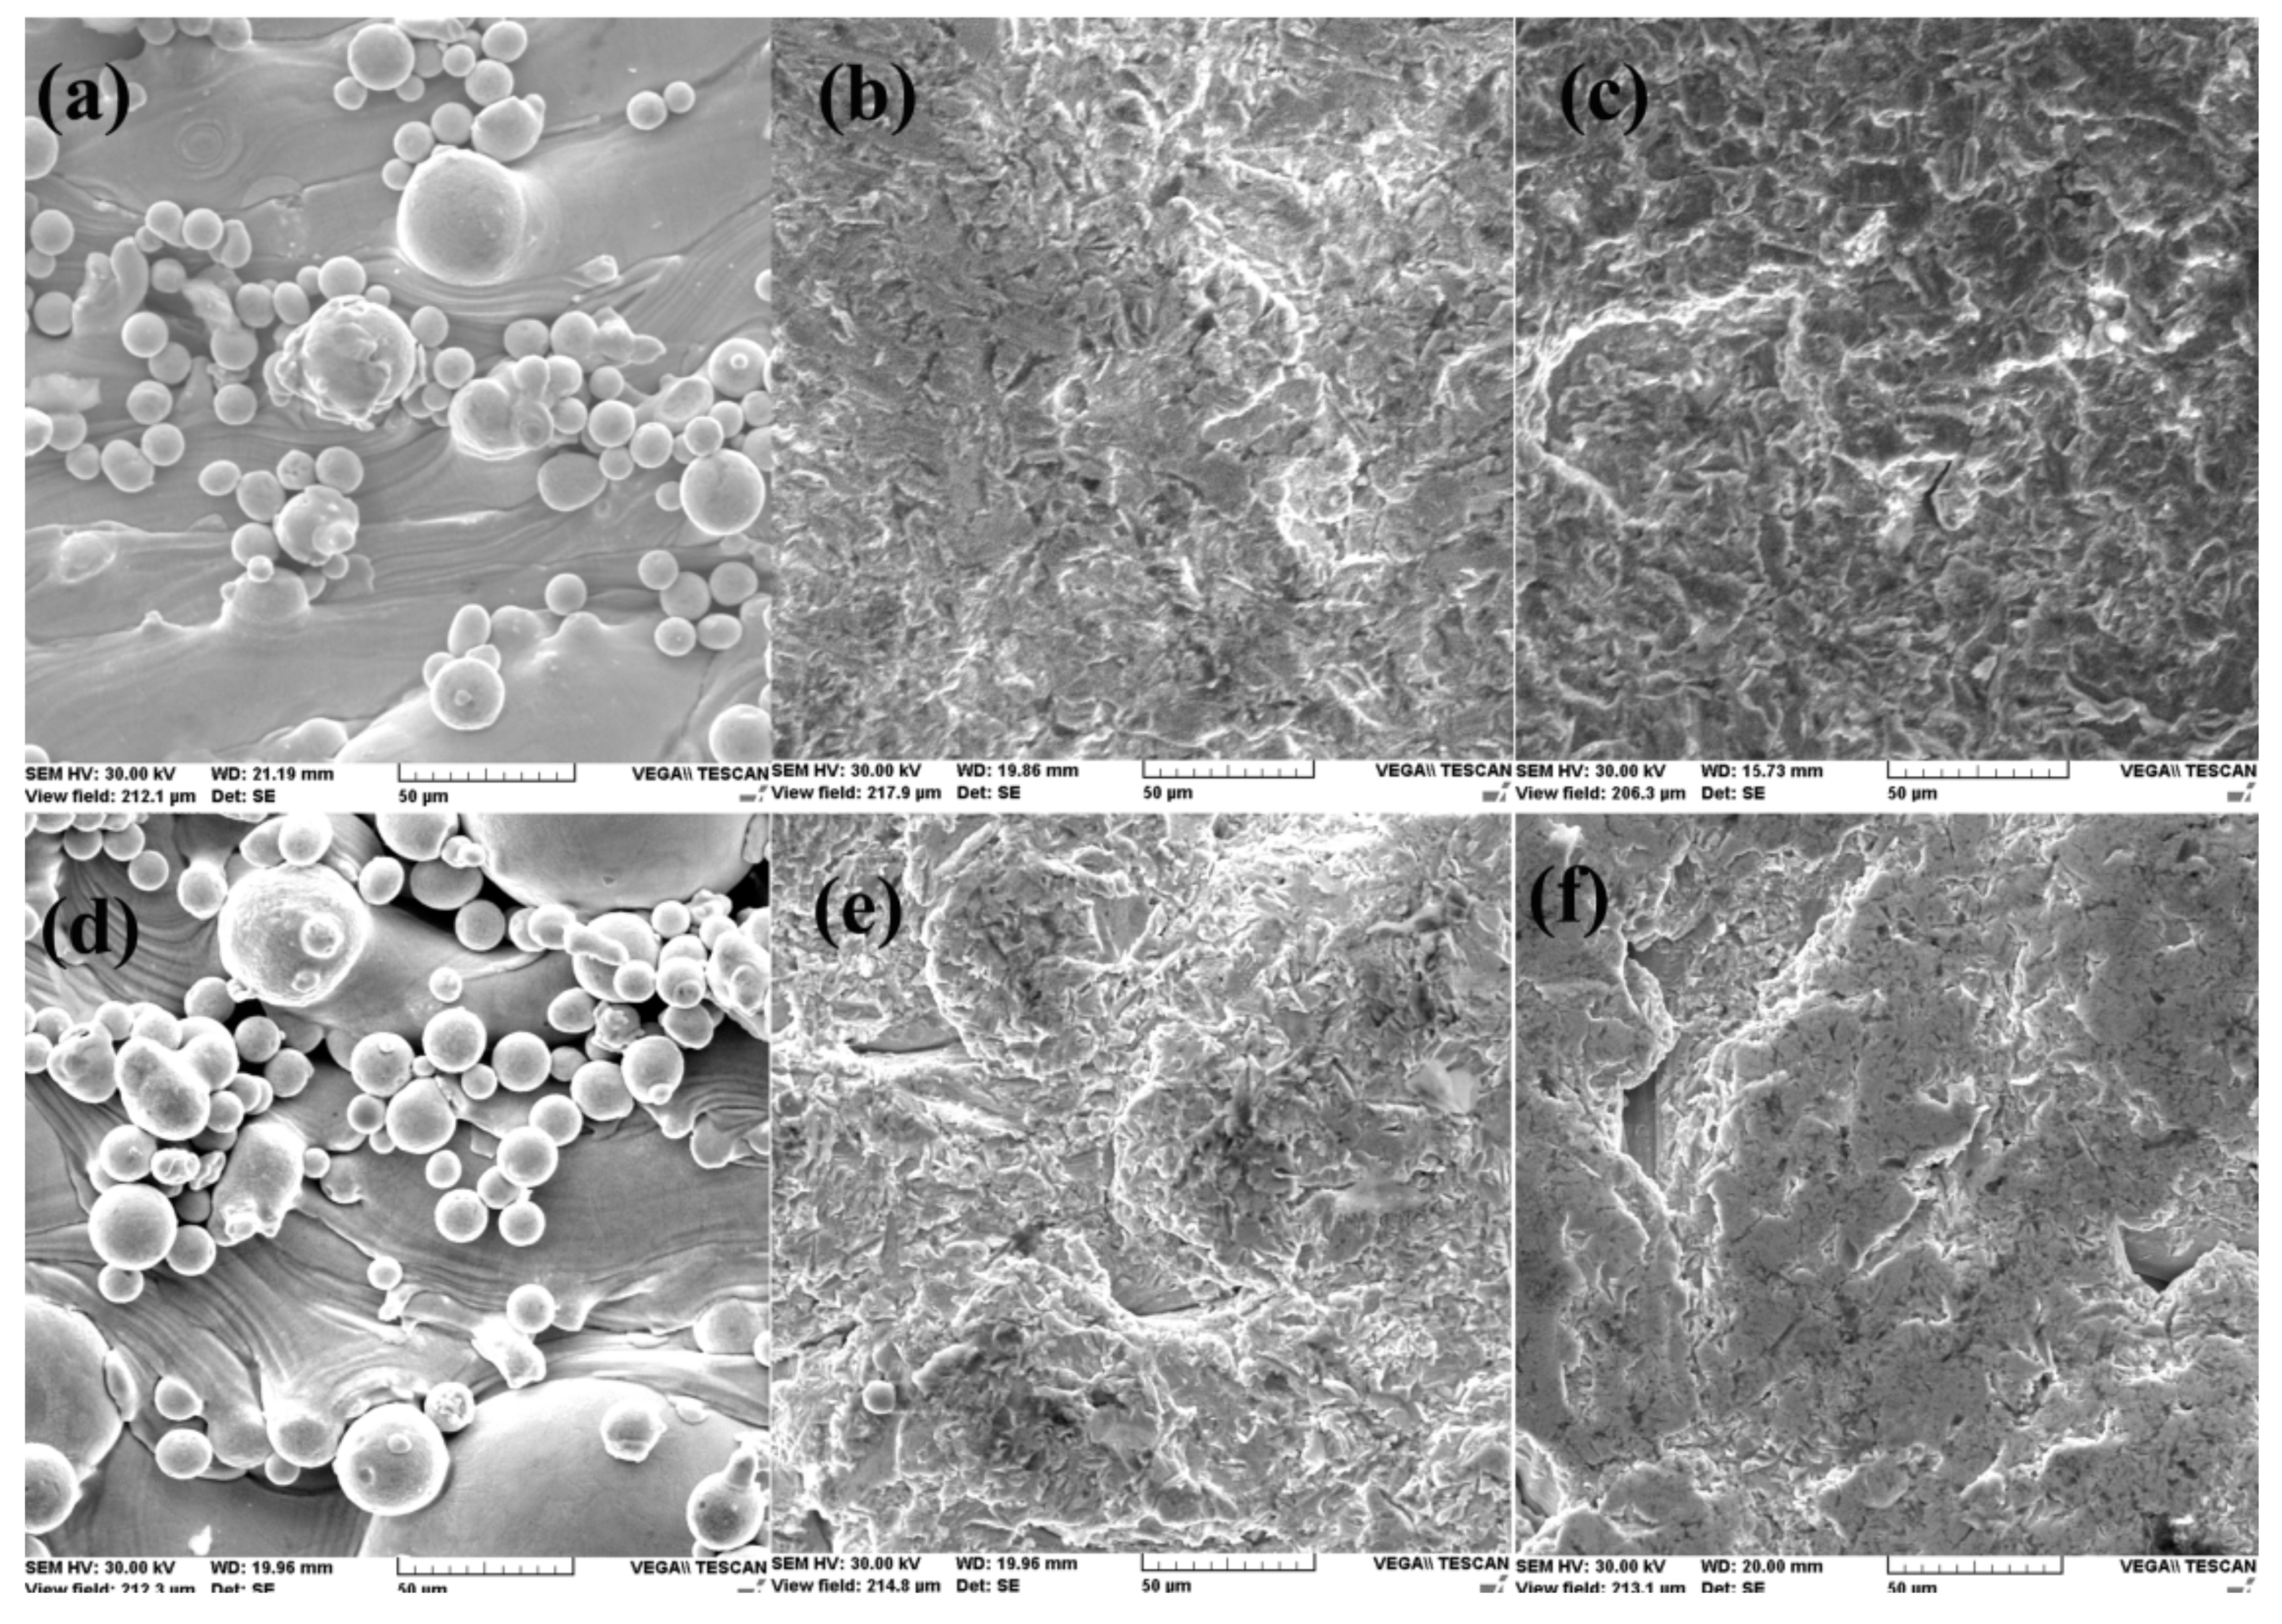
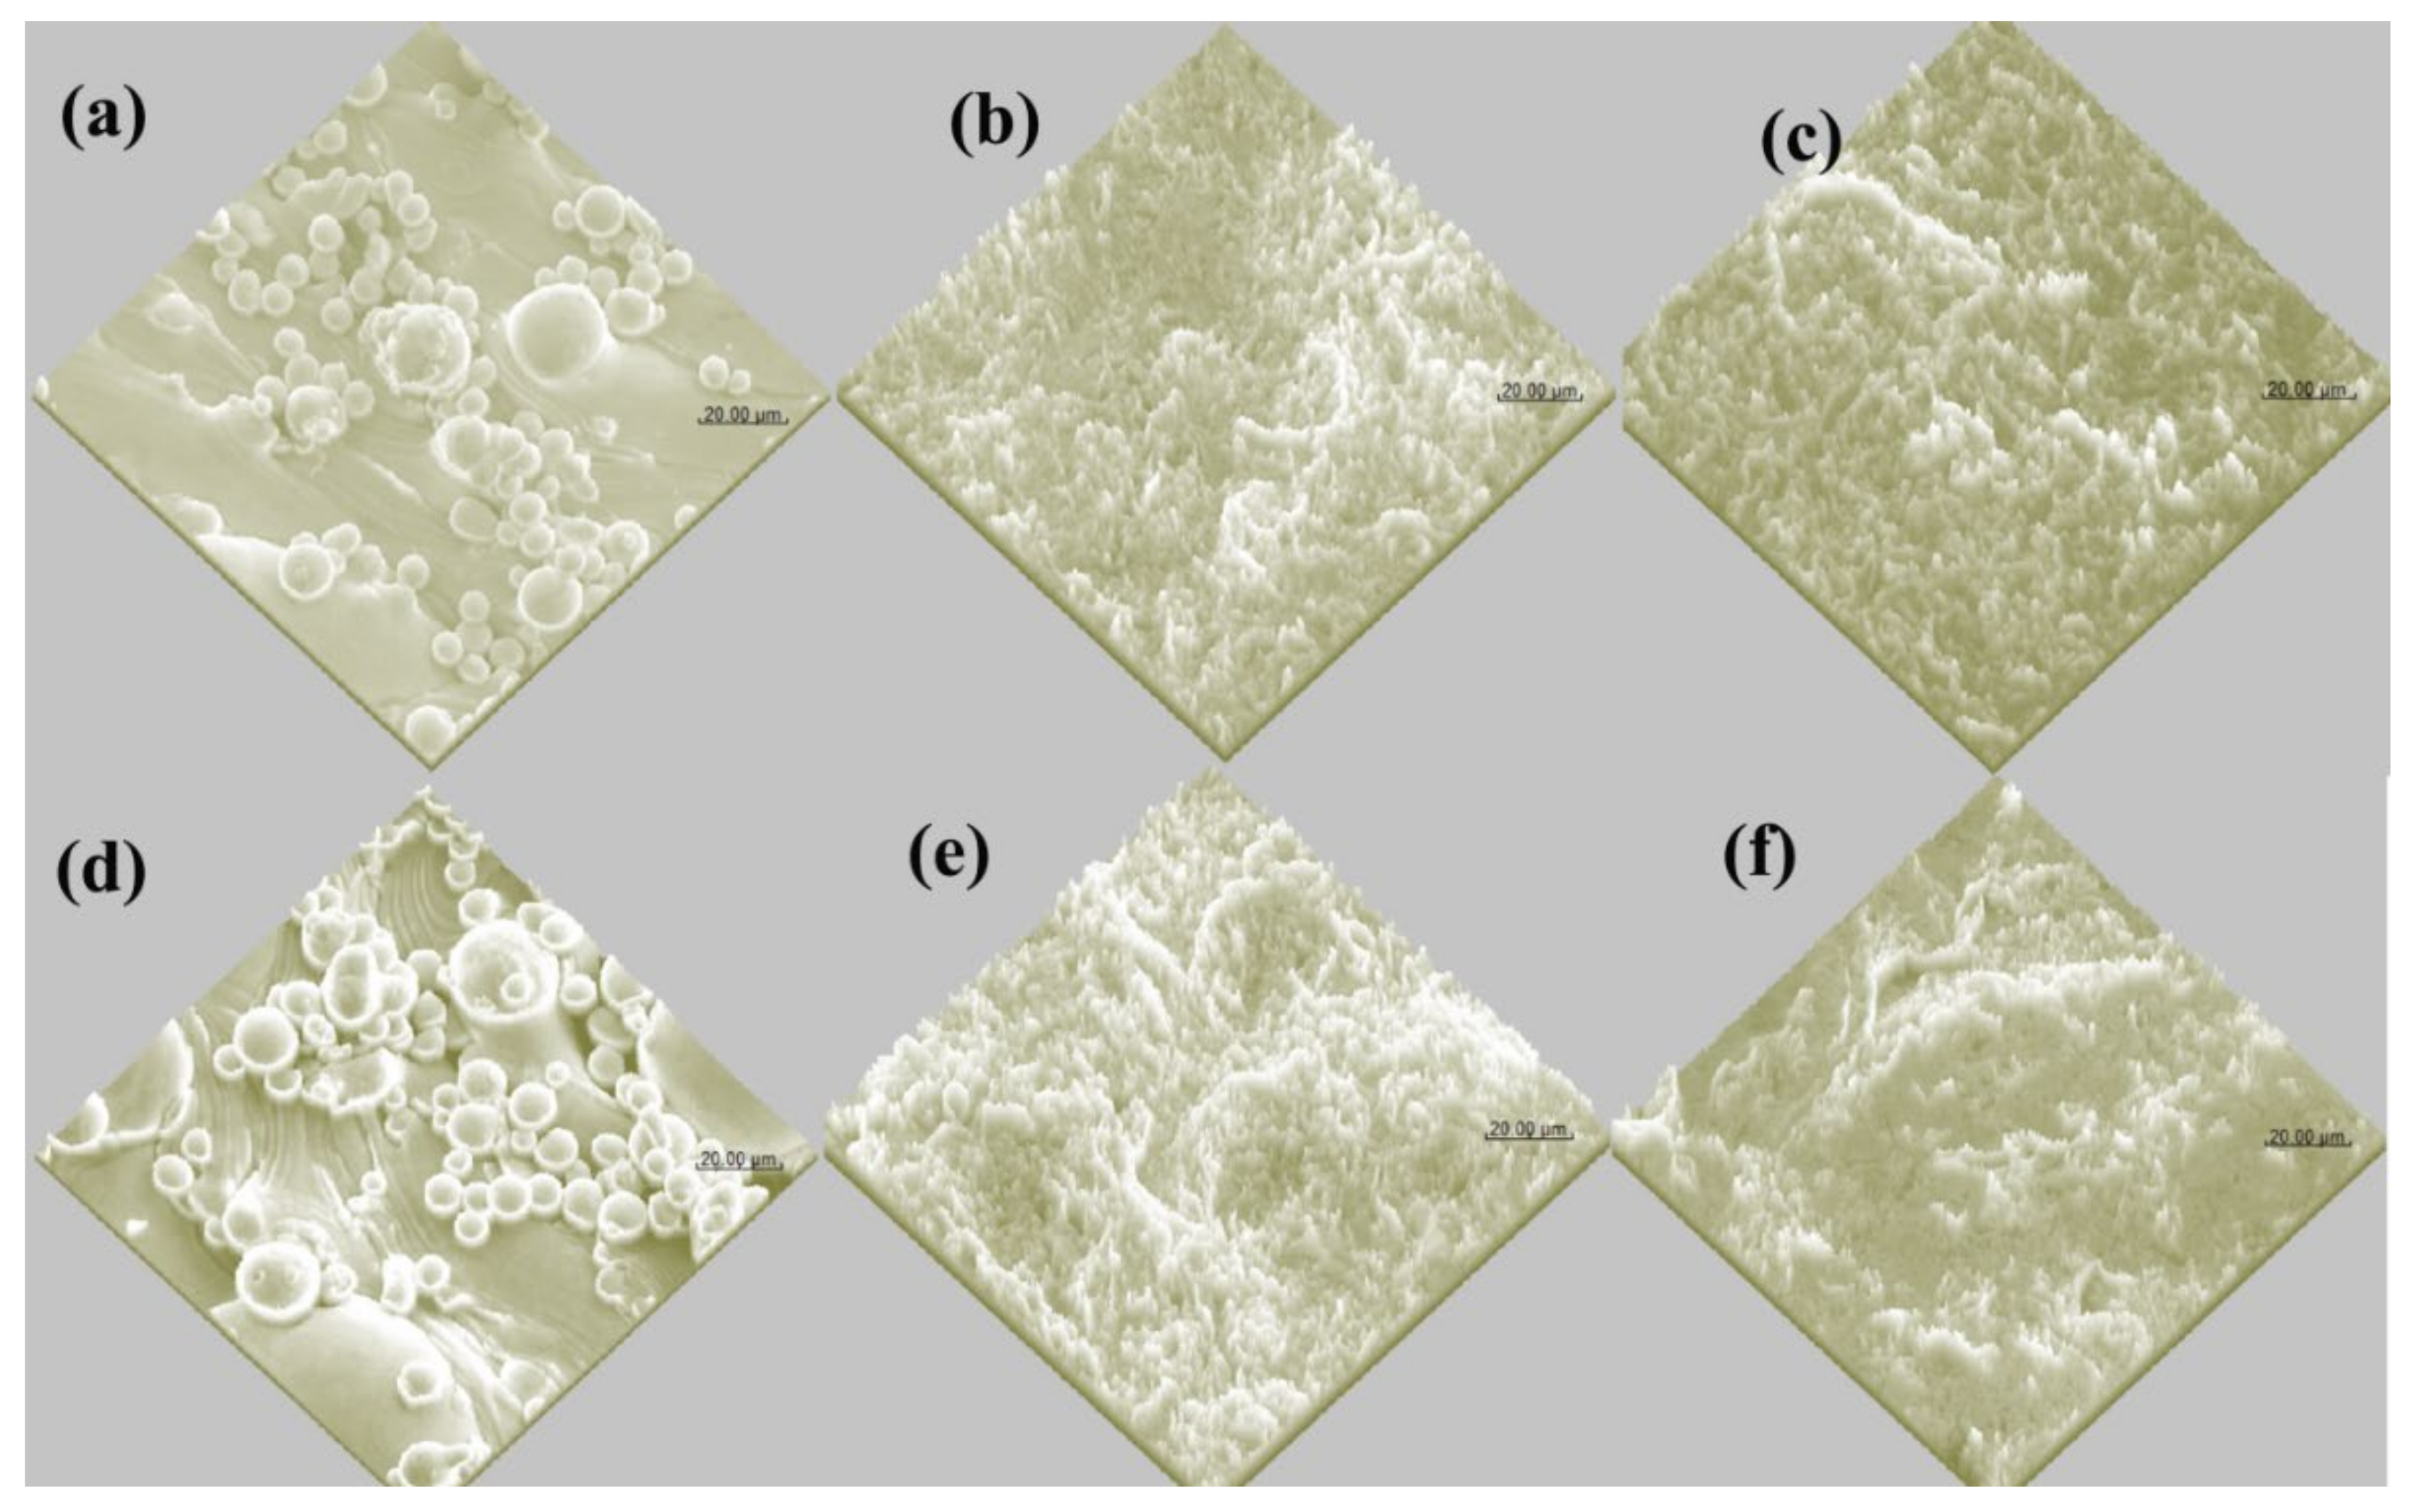
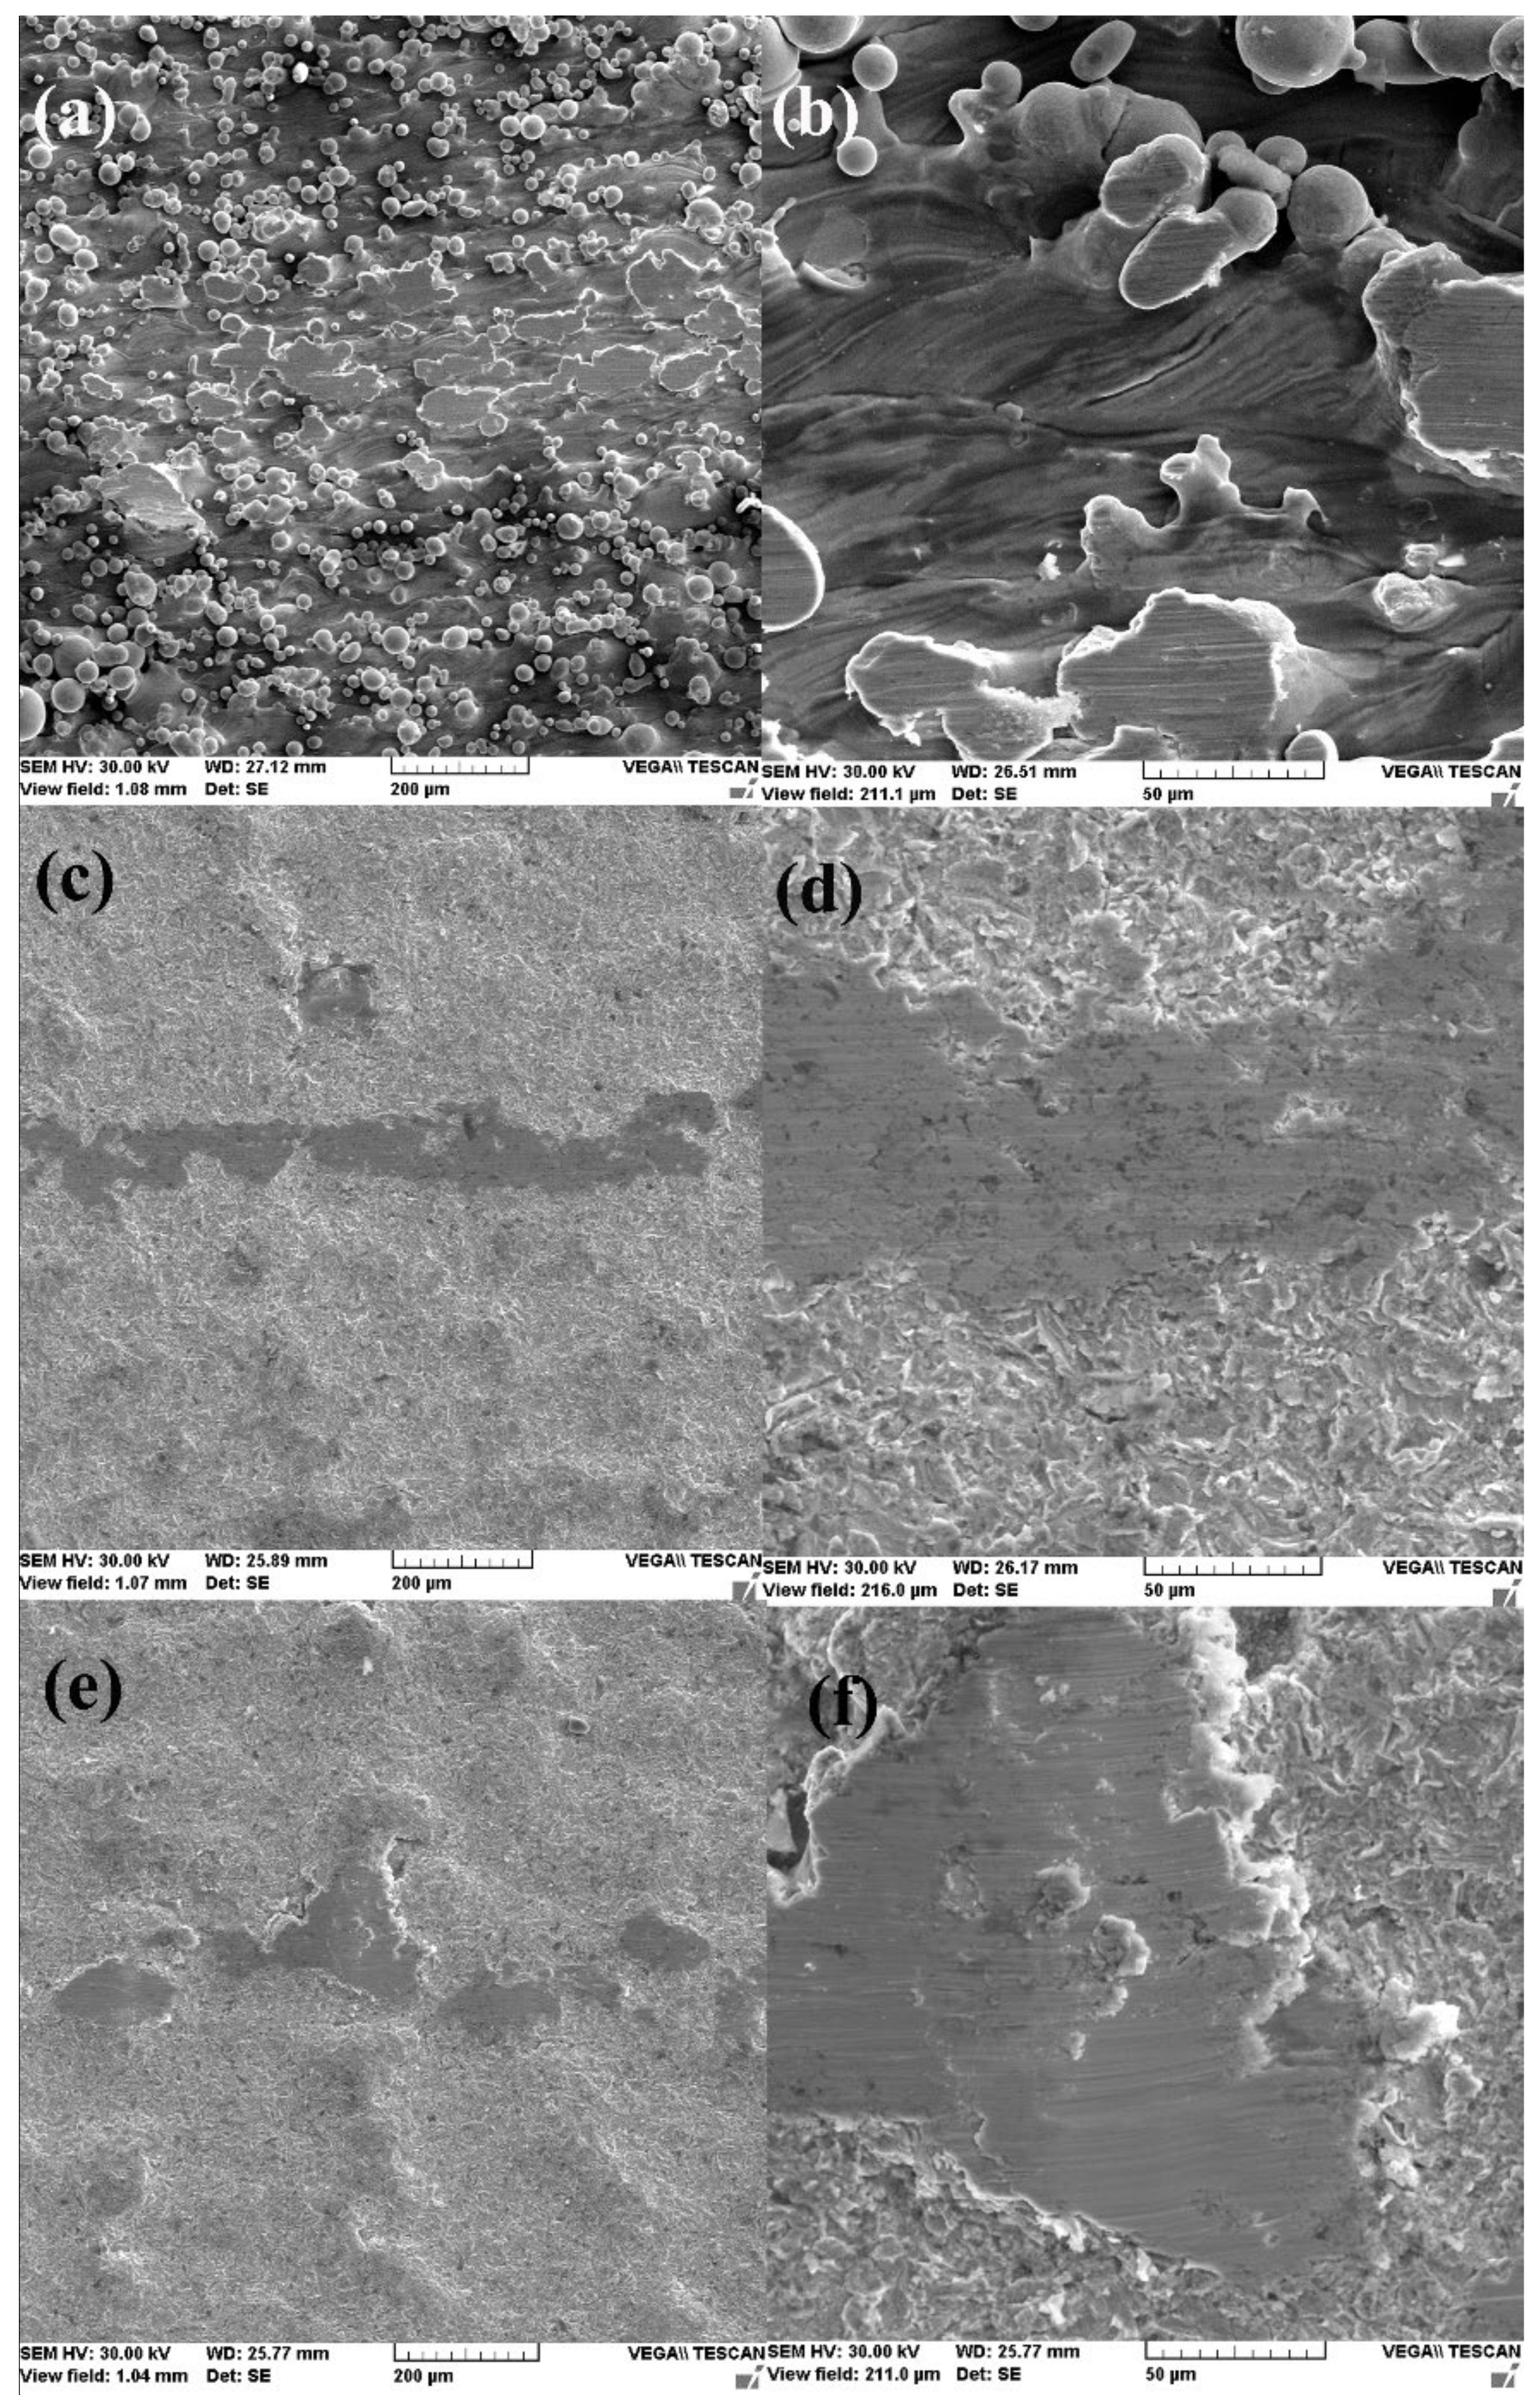
3.1. Microstructural Surface State
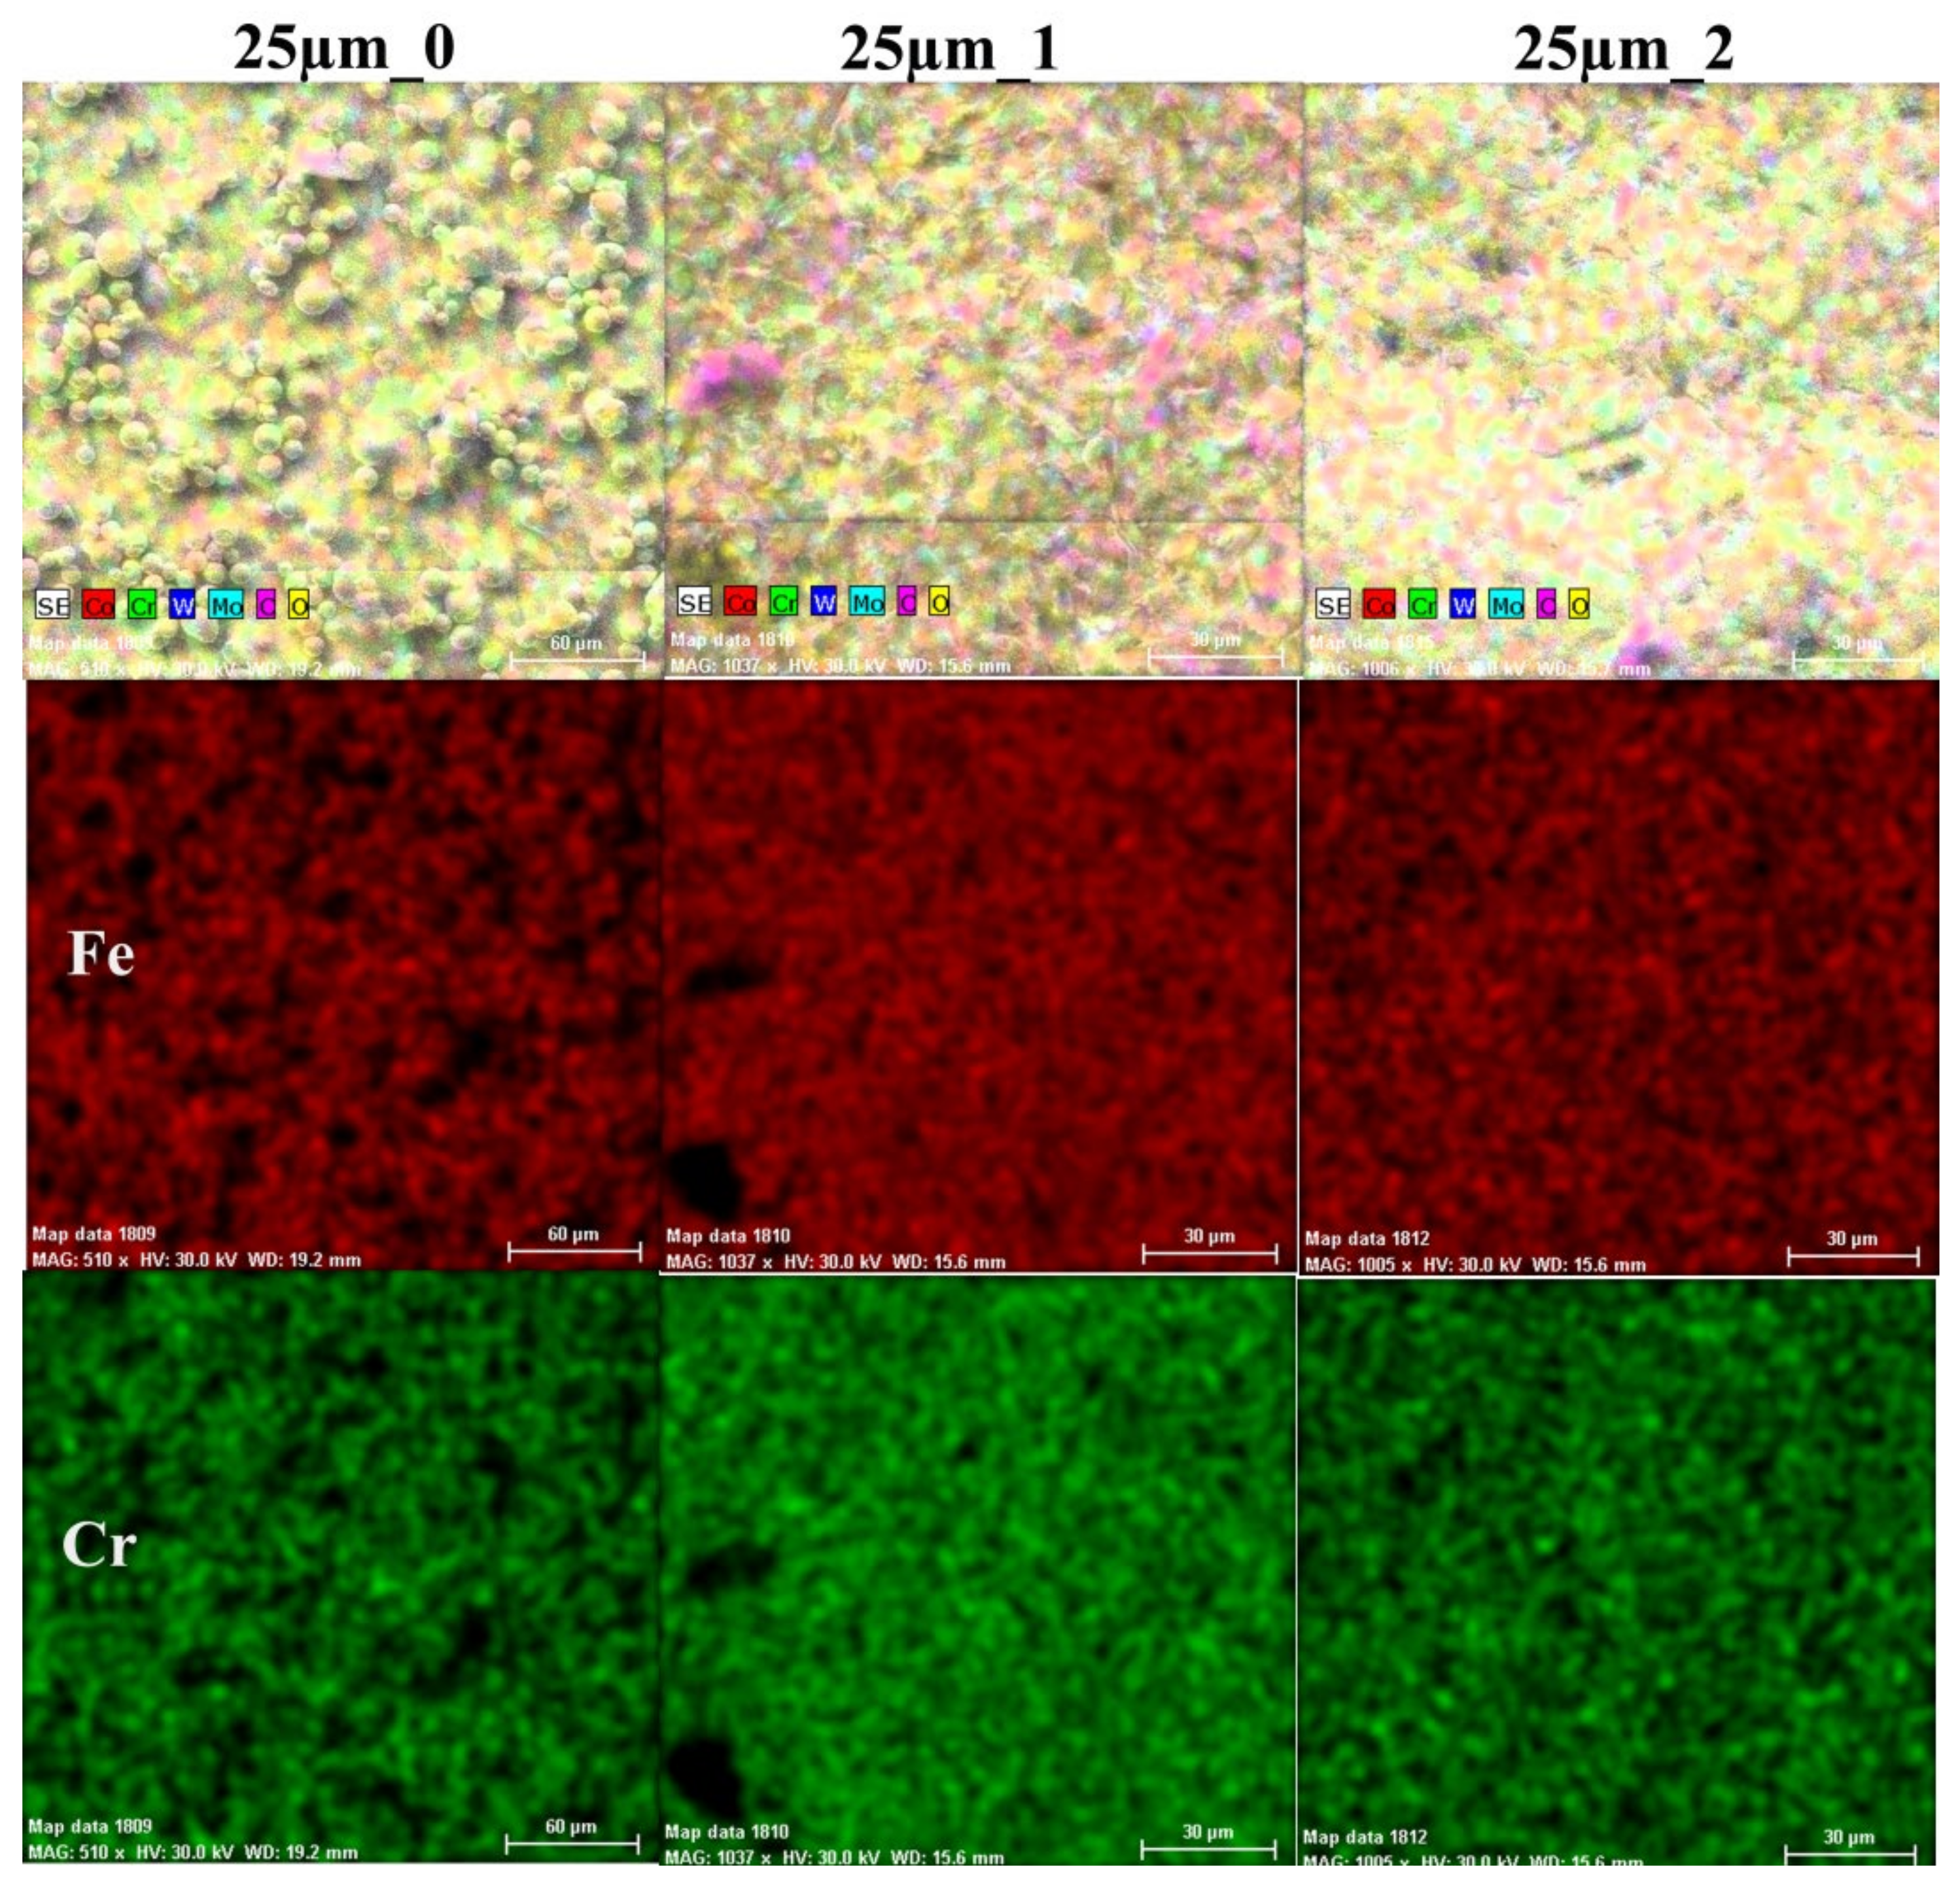
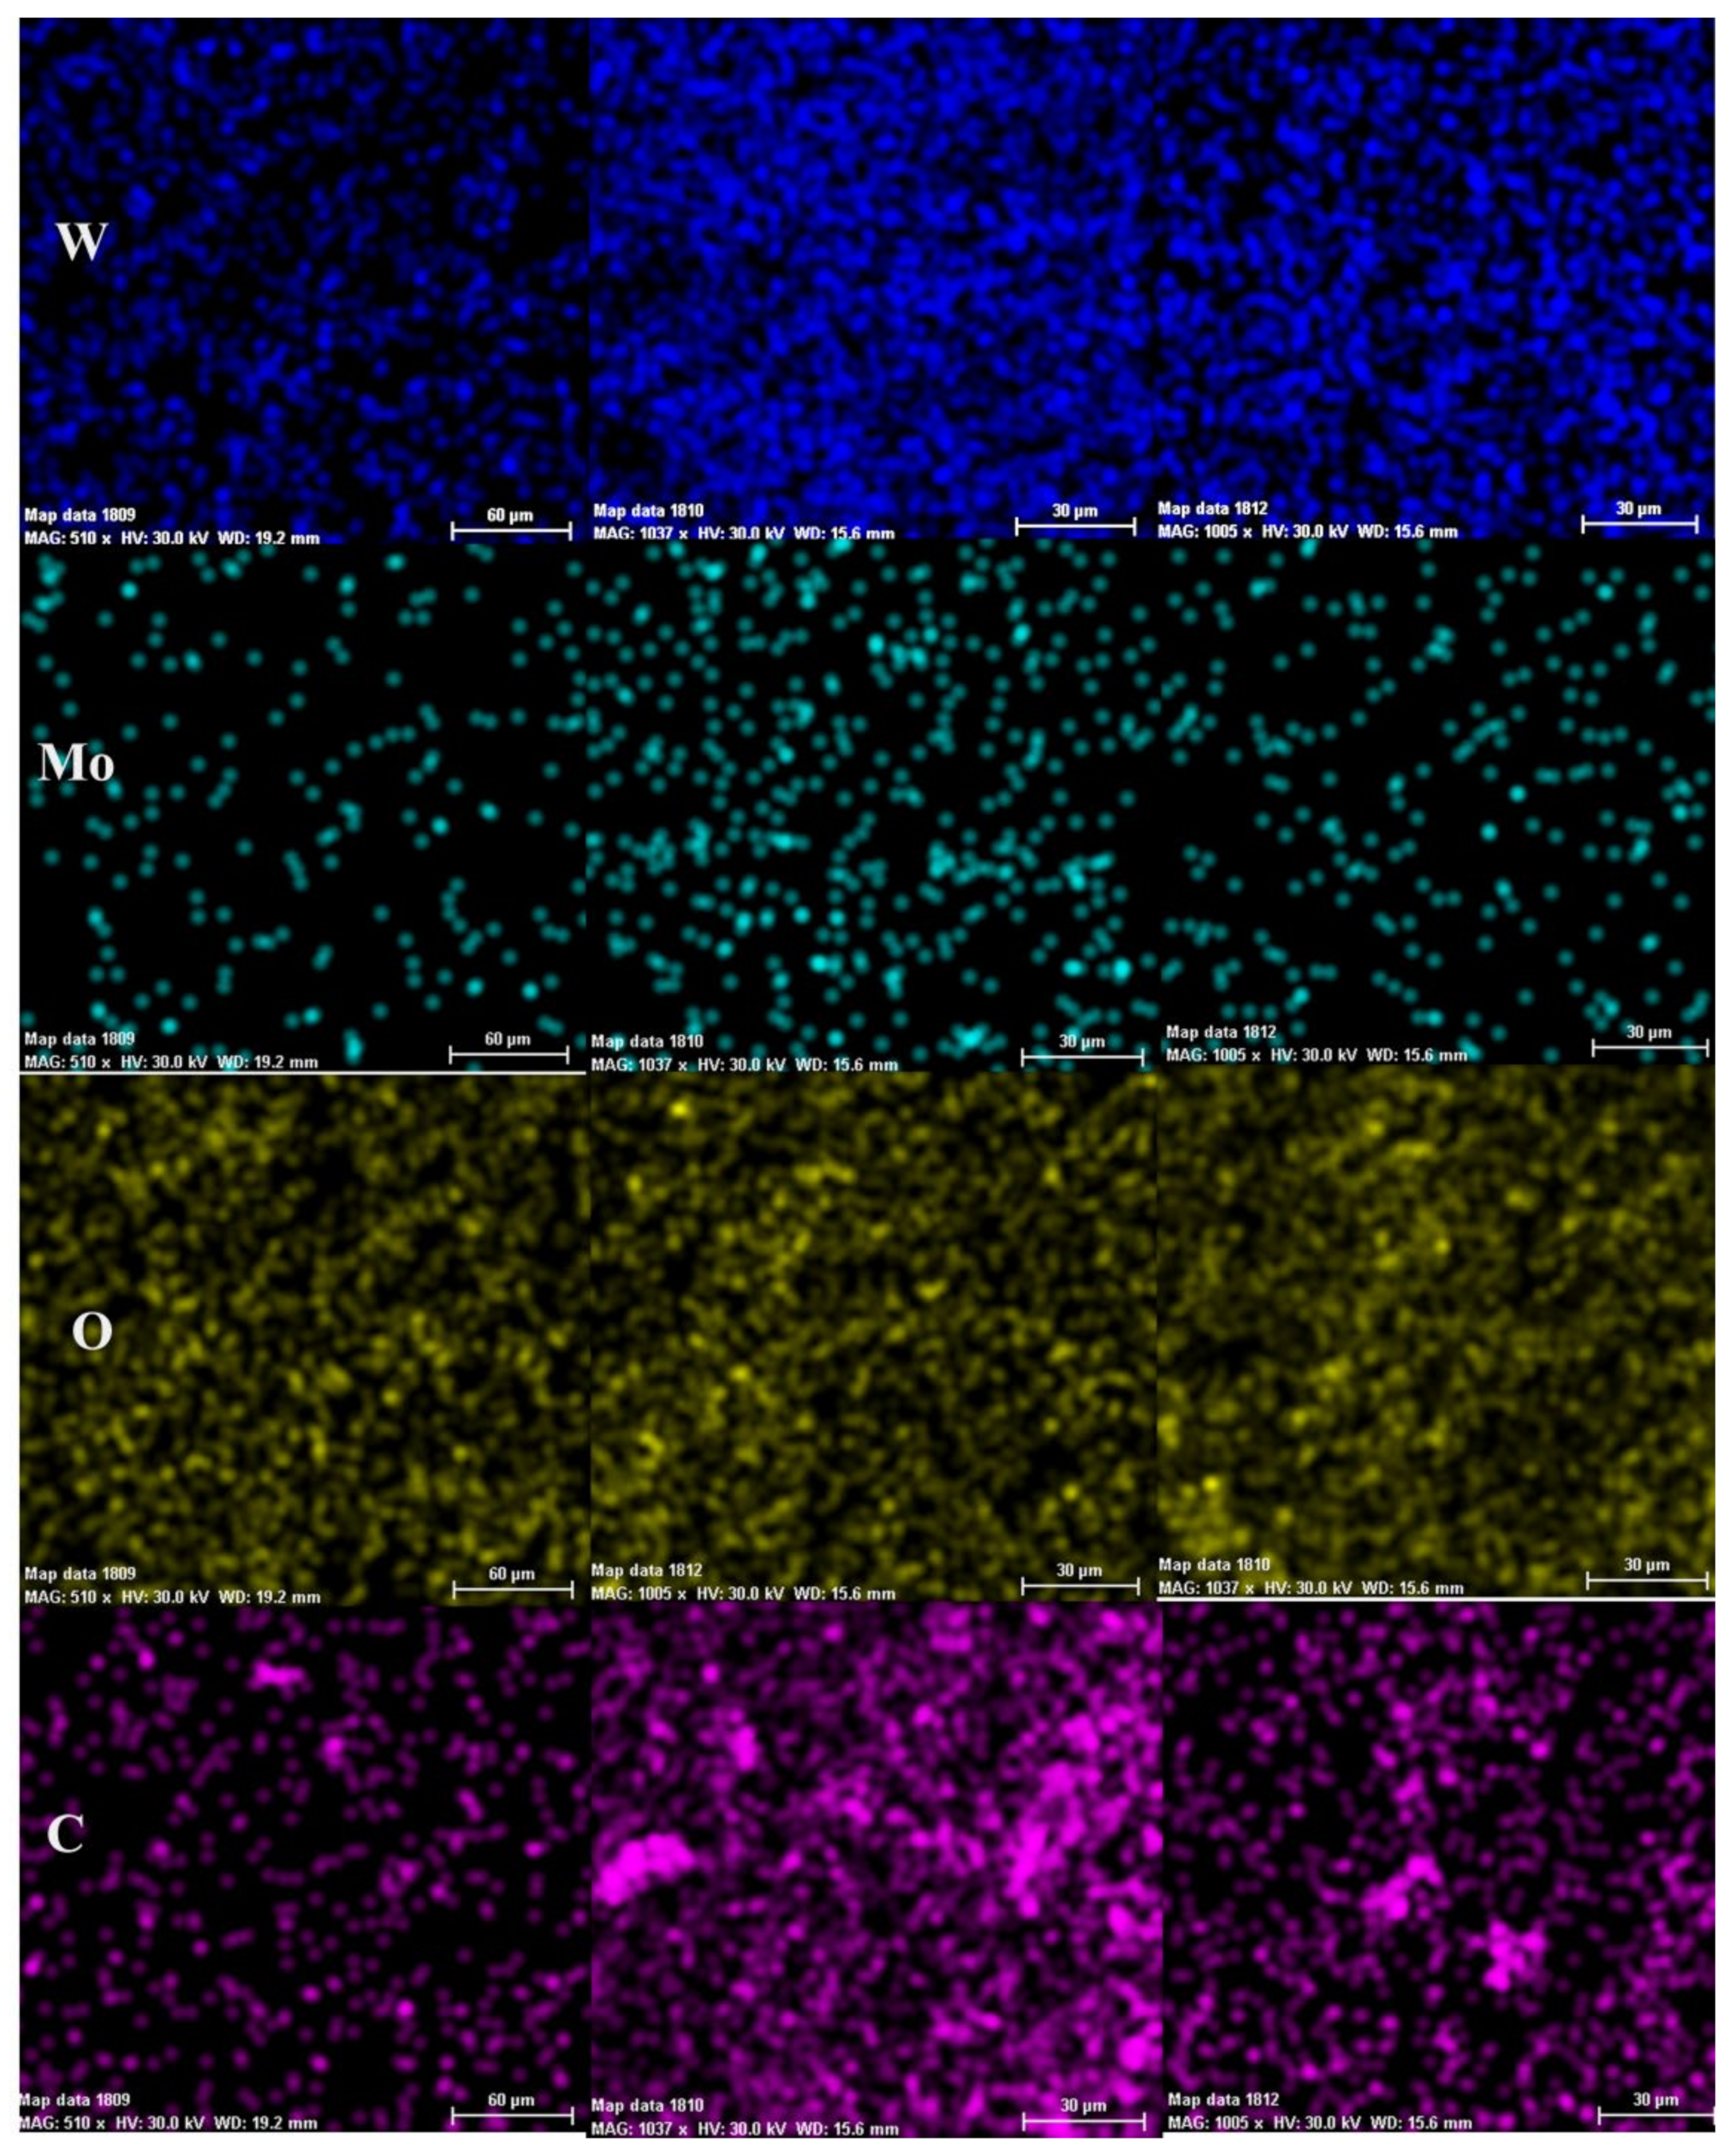
3.2. Chemical Composition Determination
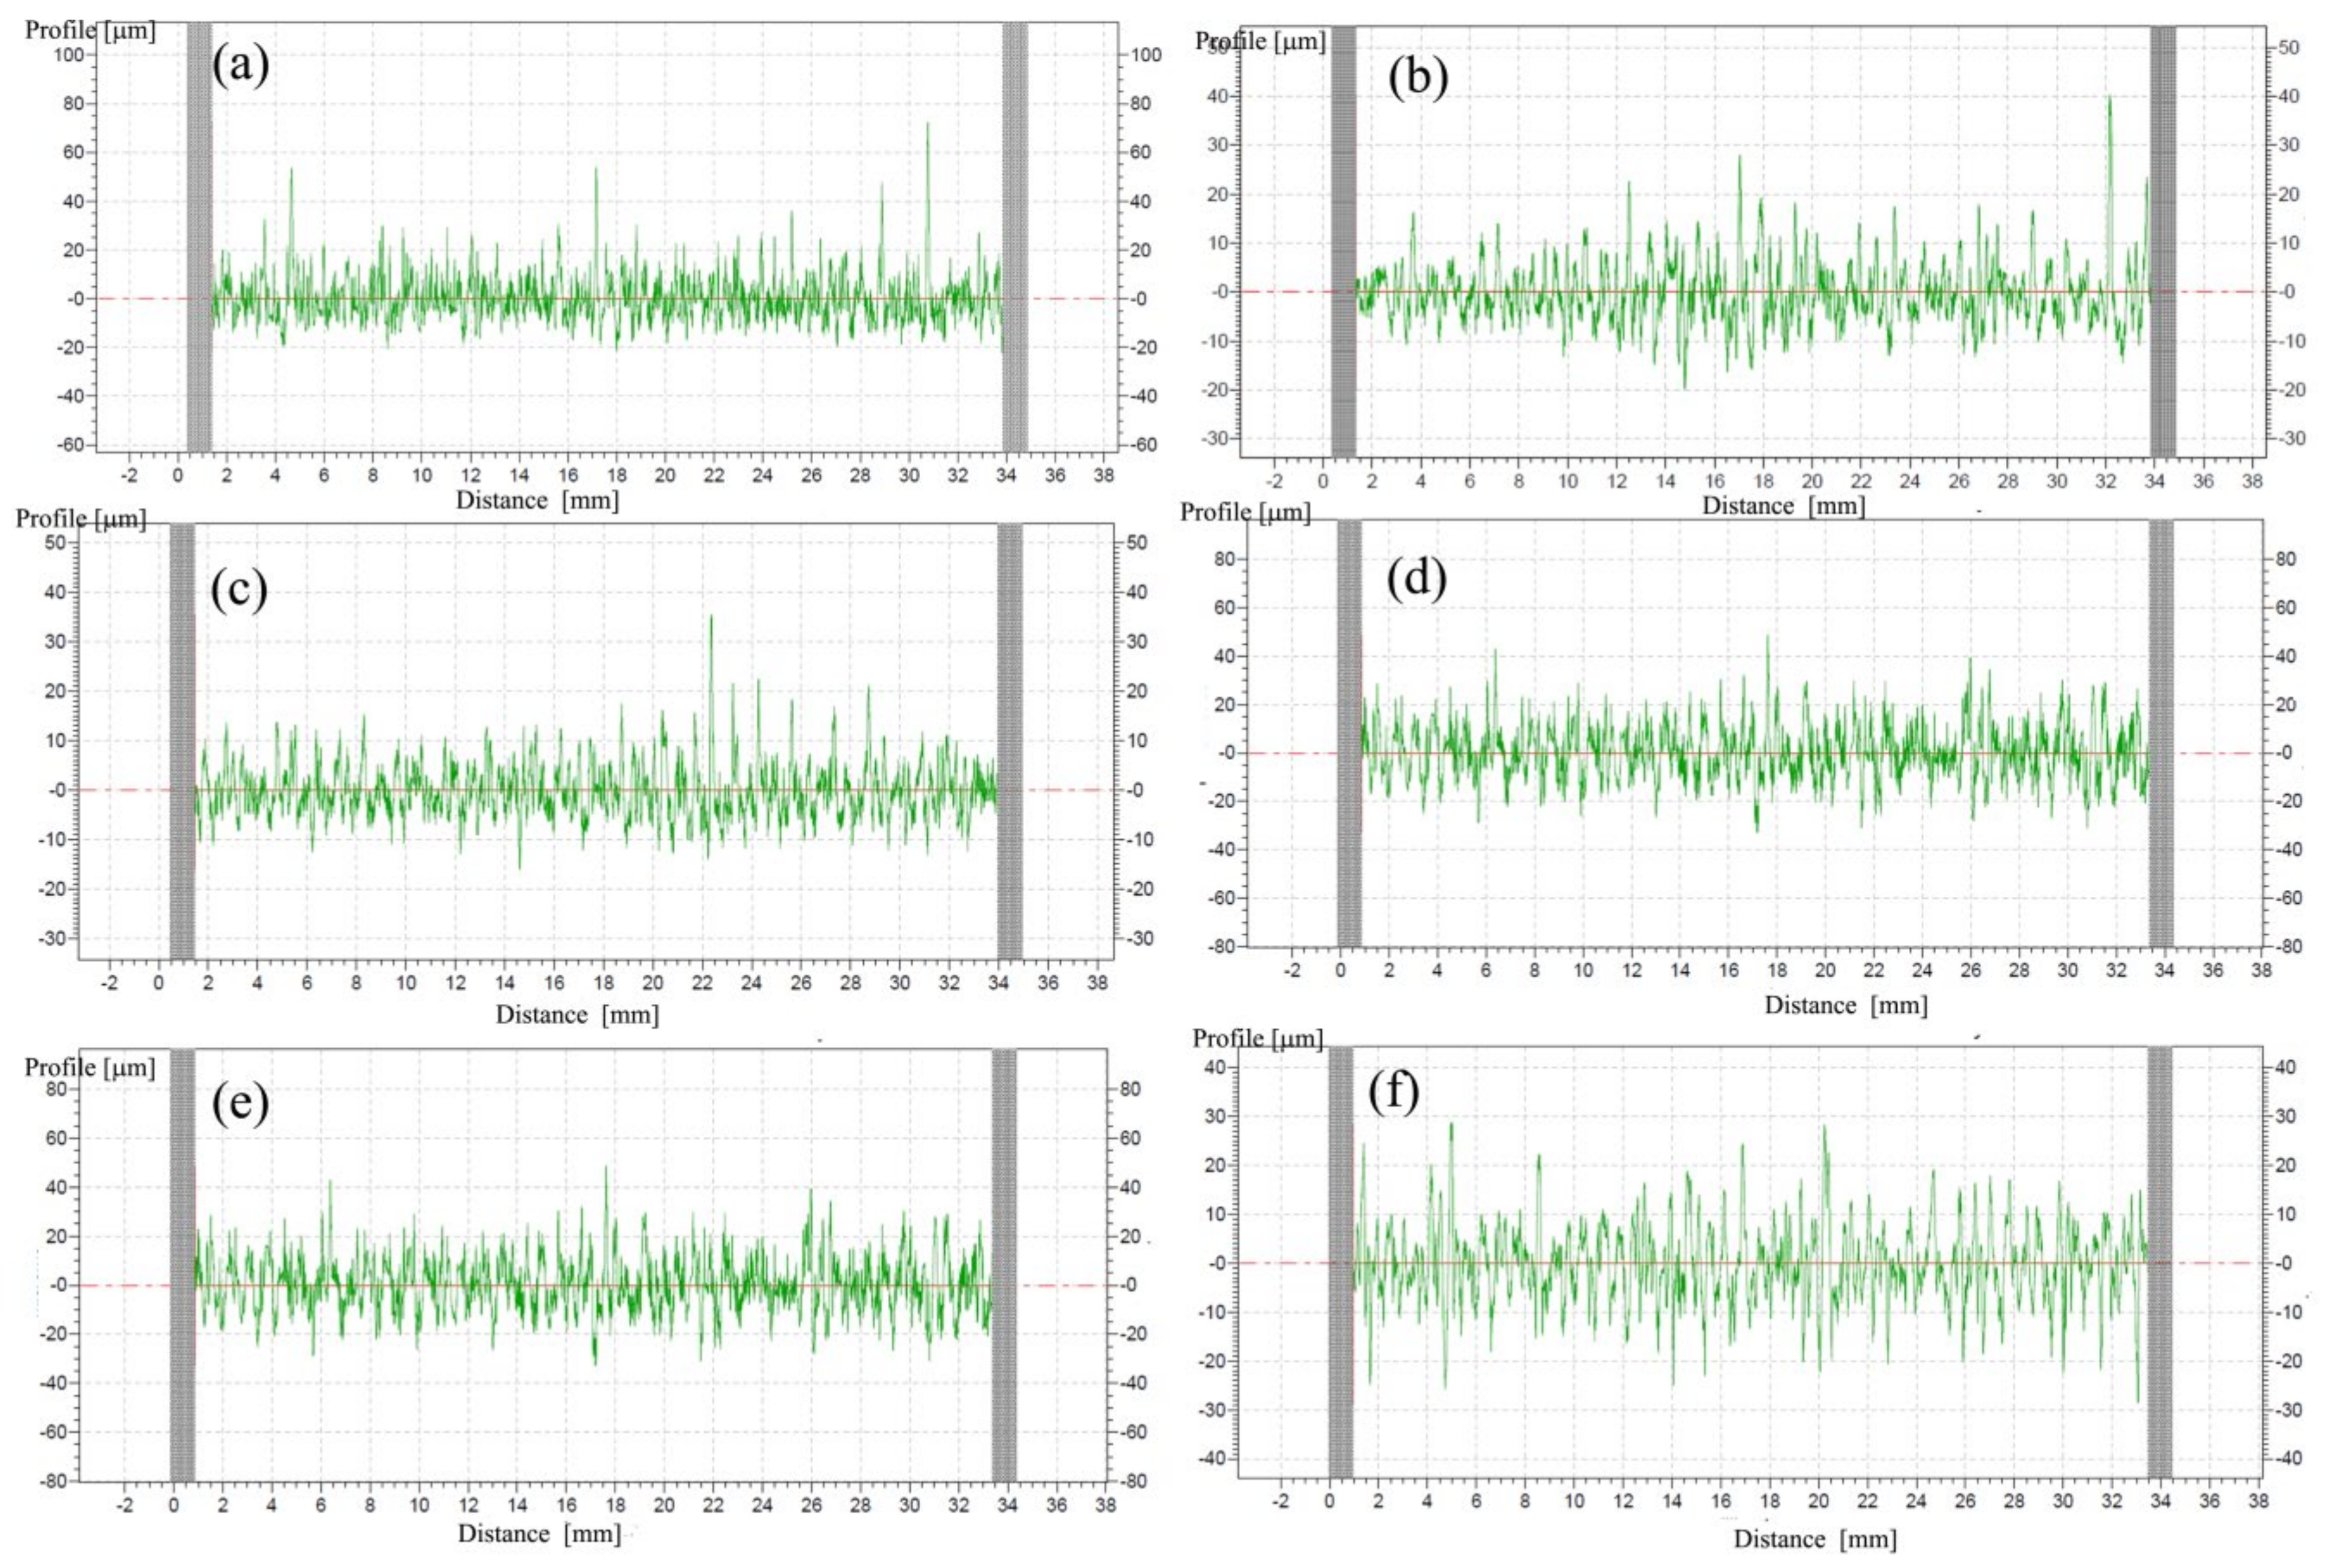
3.3. Profilometry
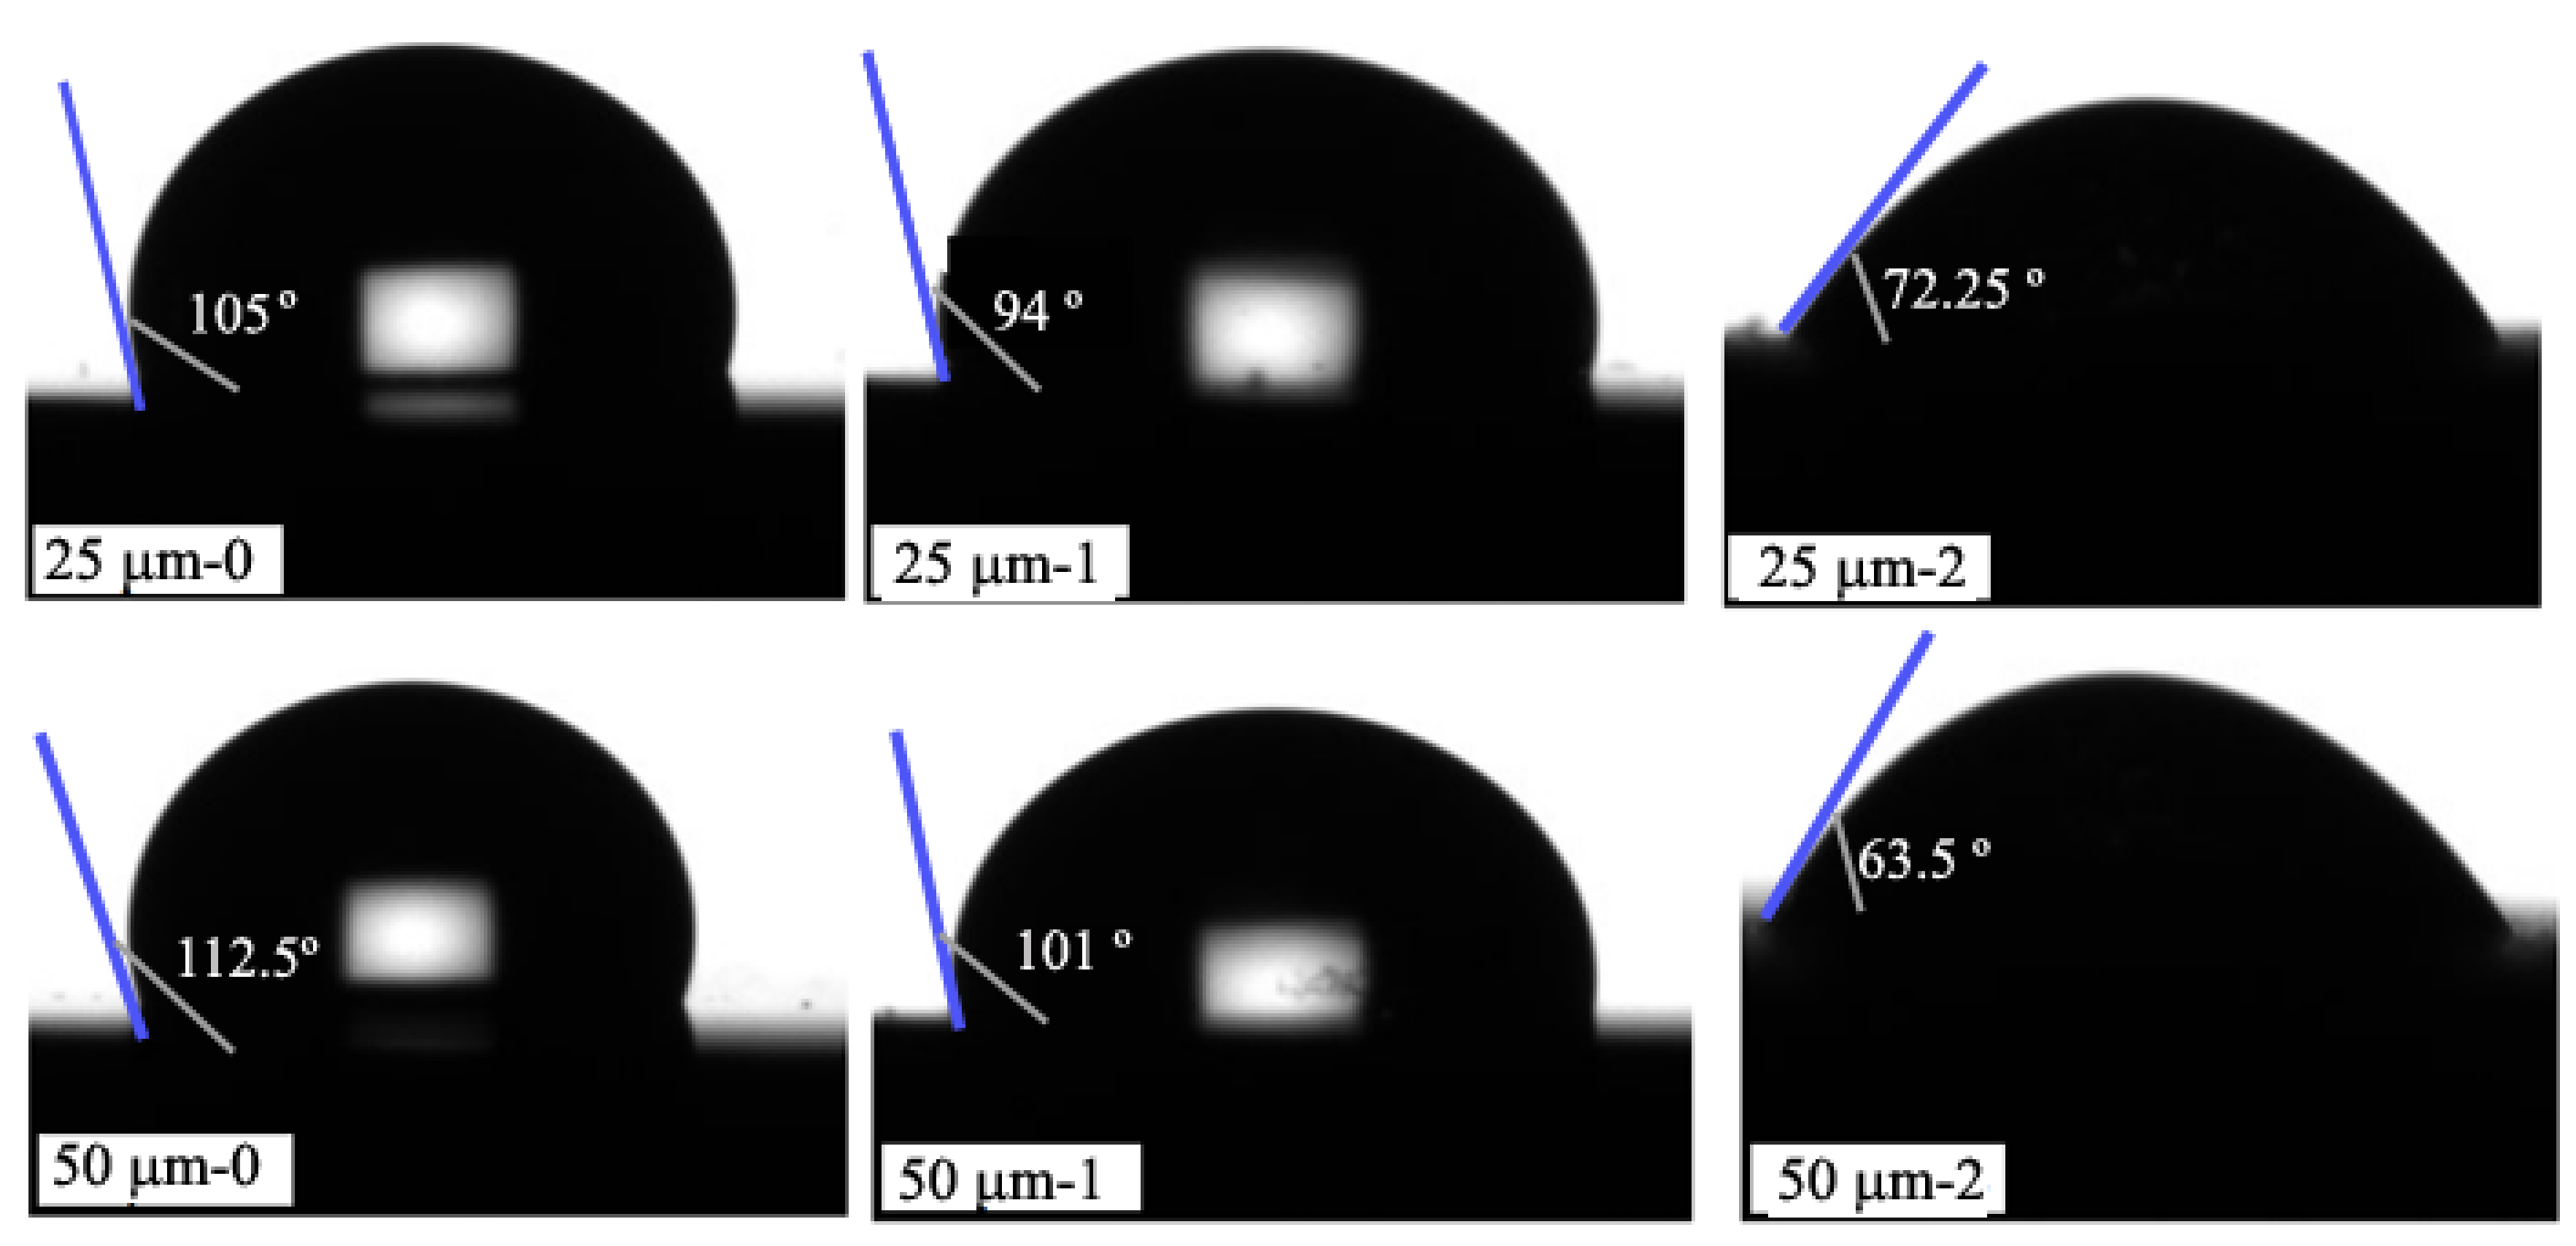
3.4. Wettability
3.5. Hardness Analysis
4. Conclusions
- After the 3D printing process, the dental material samples made through SLM presented many semi-melted particles that increased the contact surface of the elements. Using different blasting media, the 3D printed alloy surface could be cleaned and its roughness modified in order to fulfill the medical application requirements.
- The oxidation process took place on the surface of all of the samples, and unstable compounds based on sandblast materials were identified.
- The 50 µm—0 (1, 2) presented a higher roughness than the 25 µm—0 (1, 2) sample for the Ra, Rq, and RT parameters, regardless of the condition of the samples’ surfaces.
- The droplet adhesion characteristics were modified with the sandblast operation.
- The sandblast operation considerably increased the samples’ hardness, especially in the case of 25 µm—0 (1, 2).
- Even the material is consecrate in literature, and, in laboratory practice, further medical tests can be considered in order to confirm the implications of surface preparation, especially on 3D complex structures.
Author Contributions
Funding
Institutional Review Board Statement
Informed Consent Statement
Acknowledgments
Conflicts of Interest
References
- Niinomi, M.; Narushima, T.; Nakai, M. Advances in Metallic Biomaterials, Tissues, Materials and Biological Reactions. In Springer Series in Biomaterials Science and Engineering; Springer: Berlin/Heidelberg, Germany, 2015; Volume 3, pp. 157–178. [Google Scholar]
- Wulfman, C.; Koenig, V.; Mainjot, A.K. Wear measurement of dental tissues and materials in clinical studies: A systematic review. Dent. Mater. 2018, 34, 825–850. [Google Scholar] [CrossRef] [PubMed]
- Eakle, S.W.; Kimberly, B. Dental Materials. In Clinical Applications for Dental Assistants and Dental Hygienists, Saunders, 4th ed.; Elsevier: Amsterdam, The Netherlands, 2020; pp. 220–236. [Google Scholar]
- Zeng, L.; Xiang, N.; Wei, B. A comparison of corrosion resistance of cobalt-chromium-molybdenum metal ceramic alloy fabricated with selective laser melting and traditional processing. J. Prosthet. Dent. 2014, 112, 1217–1224. [Google Scholar] [CrossRef] [PubMed]
- Takaichi, A.; Suyalatu, N.T.; Natsuka, J.; Naoyuky, N.; Yusuke, T.; Satoshi, M.; Doi, H.; Kurosu, S.; Chiba, A.; Wakabayashi, N.; et al. Microstructures and mechanical properties of Co-29Cr-6Mo alloy fabricated by selective laser melting for dental application. J. Mech. Behav. Biomed. Mater. 2013, 21, 67–76. [Google Scholar] [CrossRef] [PubMed]
- Van Noort, R. The future of dental devices is digital. Dent. Mater. 2012, 28, 3–12. [Google Scholar] [CrossRef]
- Dikova, T.; Dzhendov, D.; Simov, M.; Katreva-Bozukova, I.; Angelova, S.; Pavlova, D.; Abadzhiev, M.; Tonchev, T. Modern trends in the development of the technologies for production of dental constructions. J. IMAB 2015, 21, 974–981. [Google Scholar] [CrossRef]
- Gu, D. Laser Additive Manufacturing of High-Performance; Springer-Verlag: Berlin/Heidelberg, Germany, 2015; pp. 15–71. [Google Scholar]
- Bandyopadhyay, A.; Bose, S.; Das, S. 3D printing of biomaterials. MRS Bulletin 2015, 40, 108–115. [Google Scholar] [CrossRef]
- Torabi, K.; Farjood, E.; Hamedani, S.H. Rapid prototyping technologies and their applications in prosthodontics, a review of literature. J. Dent. 2015, 16, 1–9. [Google Scholar]
- Lu, Y.; Lin, W.; Xie, M.; Xu, W.; Liu, Y.; Lin, J.; Yu, C.; Tang, K.; Liu, W.; Yang, K.; et al. Examining Cu content contribution to changes in oxide layer formed on selective-laser-melted CoCrW alloys. Appl. Surf. Sci. 2019, 464, 262–272. [Google Scholar] [CrossRef]
- Wang, D.; Ye, G.; Dou, W.; Zhang, M.; Yang, Y.; Mai, S.; Liu, Y. Influence of spatter particles contamination on densification behavior and tensile properties of CoCrW manufactured by selective laser melting. Opt. Laser Technol. 2020, 121, 105678. [Google Scholar] [CrossRef]
- Ho, L.W.; Jung, K.-H.; Hwang, S.-K.; Kang, S.-H.; Kim, D.-K. Microstructure and mechanical anisotropy of CoCrW alloy processed by selective laser melting. Mater. Sci. Eng. A 2019, 749, 65–73. [Google Scholar]
- Padrós, R.; Punset, M.; Molmeneu, M.; Velasco, A.B.; Herrero-Climent, M.; Rupérez, E.; Gil, F.J. Mechanical Properties of CoCr Dental-Prosthesis Restorations Made by Three Manufacturing Processes Influence of the Microstructure and Topography. Metals 2020, 10, 788. [Google Scholar]
- Baciu, A.M.; Bejinariu, C.; Corǎbieru, A.; Mihalache, E.; Lupu-Poliac, M.; Baciu, C.; Baciu, E.R. Influence of process parameters for Selective Laser Melting on the roughness of 3D printed surfaces in Co-Cr dental alloy powder. IOP Conf. Ser. Mater. Sci. Eng. 2019, 572, 012054. [Google Scholar] [CrossRef]
- Bernevig-Sava, M.A.; Stamate, C.; Lohan, N.-M.; Baciu, A.M.; Postolache, I.; Baciu, C.; Baciu, E.-R. Considerations on the surface roughness of SLM processed metal parts and the effects of subsequent sandblasting. IOP Conf. Ser. Mater. Sci. Eng. 2019, 572, 012071. [Google Scholar] [CrossRef]
- Spierings, A.B.; Herres, N.; Levy, G. Influence of the particle size distribution on surface quality and mechanical properties in AM steel parts. Rapid Prototyp. J. 2011, 17, 195–202. [Google Scholar] [CrossRef]
- Tan, J.H.; Wong, W.L.E.; Dalgarno, K.W. An overview of powder granulometry on feedstock and part performance in the selective laser melting process. Addit. Manuf. 2017, 18, 228–255. [Google Scholar] [CrossRef]
- Wang, D.; Wu, S.; Fu, F.; Mai, S.; Yang, Y.; Liu, Y.; Song, C. Mechanisms and characteristics of spatter generation in SLM processing and its effect on the properties. Mater. Des. 2017, 117, 121–130. [Google Scholar] [CrossRef]
- Dorcheh, A.S.; Schütze, M.; Galetz, C.M. Factors affecting isothermal oxidation of pure chromium in air. Corros. Sci. 2018, 130, 261–269. [Google Scholar] [CrossRef]
- Hong, M.-H.; Min, B.K.; Kwon, T.-Y. The Influence of Process Parameters on the Surface Roughness of a 3D-Printed Co–Cr Dental Alloy Produced via Selective Laser Melting. Appl. Sci. 2016, 6, 401. [Google Scholar] [CrossRef]
- Wei, C.; Luo, L.; Wu, Z.; Zhang, J.; Su, S.; Zhan, Y. New Zr-25Ti-xMo alloys for dental implant application: Properties characterization and surface analysis. J. Mech. Behav. Biomed. 2020, 111, 104017. [Google Scholar]
- Pasang, T.; Lees, S.; Takahashi, M.; Fujita, T.; Conor, P.; Tanaka, K.; Kamiya, O. Machining of dental Alloys: Evaluating the surface finish of laterally milled Co-Cr-Mo Alloy. Procedia Manuf. 2017, 13, 5–12. [Google Scholar] [CrossRef]
- Qin, L.; Wu, H.; Guo, J.; Feng, X.; Dong, G.; Shao, J.; Zeng, Q.; Zhang, Y.; Qin, Y. Fabricating hierarchical micro and nano structures on implantable Co-Cr-Mo alloy for tissue engineering by one-step laser ablation. Colloid Surf. B. 2018, 161, 628–635. [Google Scholar] [CrossRef] [PubMed]
- Zhang, Z.Y.; Gu, Q.M.; Jiang, W.; Zhu, H.; Xu, K.; Ren, Y.P.; Xu, C. Achieving of bionic super-hydrophobicity by electrodepositing nano-Ni-pyramids on the picosecond laser-ablated micro-Cu-cone surface. Surf. Coat. Technol. 2019, 363, 170–178. [Google Scholar] [CrossRef]
- Rupp, F.; Gittens Rolando, A.; Lutz, S.; Marmur, A.; Boyan, B.D.; Schwartz, Z.; Geis-Gerstorfer, J. A review on the wettability of dental implant surfaces I: Theoretical and experimental aspects. Acta Biomater. 2014, 10, 2894–2906. [Google Scholar] [CrossRef] [PubMed]
- Kuncická, L.; Kocich, R.; Lowe, T.C. Advances in metals and alloys for joint replacement. Prog. Mater. Sci. 2017, 88, 232–280. [Google Scholar] [CrossRef]
- Hong, J.H.; Yeoh, F.Y. Mechanical properties and corrosion resistance of cobalt-chrome alloy fabricated using additive manufacturing. Mater. Today Proc. 2020, 29, 196–201. [Google Scholar] [CrossRef]
- McGrory, B.J.; Ruterbories, J.M.; Pawar, V.D.; Thomas, R.K.; Salehi, A.B. Comparison of surface characteristics of retrieved cobalt-chromium femoral heads with and without ion implantation. J. Arthroplast. 2012, 27, 109–115. [Google Scholar] [CrossRef]
- Ratner, B.D.; Hoffman, A.S.; Schoen, F.J.; Lemons, J.E. Biomaterials Science: An Introduction to Materials in Medicine; Academic Press: Cambridge, MA, USA, 2004. [Google Scholar]
- Paleu, V.; Gurau, G.; Comaneci, R.I.; Sampath, V.; Gurau, C.; Bujoreanu, L.G. A new application of Fe-28Mn-6Si-5Cr (mass%) shape memory alloy, for self-adjustable axial preloading of ball bearings. Smart Mater. Struct. 2018, 27, 075026. [Google Scholar] [CrossRef]
- Lu, Y.; Zhao, W.; Yang, C.; Liu, Y.; Xiang, H.; Yang, K. Improving mechanical properties of selective laser melted Co29Cr9W3Cu alloy by eliminating mesh-like random high-angle grain boundary. Mater. Sci. Eng. A 2020, 793, 139895. [Google Scholar] [CrossRef]
- Cicciu, M.; Fiorillo, L.; D’Amico, C.; Gambino, D.; Amantia, E.M.; Laino, L.; Crimi, S.; Campagna, P.; Bianch, A.; Herford, A.S.; et al. 3D Digital Impression Systems Compared with Traditional Techniques in Dentistry: A Recent Data Systematic Review. Materials 2020, 13, 1982. [Google Scholar] [CrossRef]


| Chemical Elements | Co | Cr | W | Mo | O | C | Al | Si | ||||||||
|---|---|---|---|---|---|---|---|---|---|---|---|---|---|---|---|---|
| wt% | at% | wt% | at% | wt% | at% | wt% | at% | wt% | at% | wt% | at% | wt% | at% | wt% | at% | |
| 25 (50) µm—0 | 51.7 | 38.87 | 23.11 | 19.7 | 8.23 | 1.98 | 4.09 | 1.89 | 10.8 | 29.91 | 1.08 | 5.07 | - | - | 1.0 | 2.58 |
| 25 (50) µm—1 | 49.91 | 34.95 | 21.59 | 17.14 | 7.81 | 1.75 | 4.08 | 1.76 | 12.2 | 31.48 | 2.32 | 7.38 | 1.11 | 1.63 | 0.96 | 2.52 |
| 25 (50) µm—2 | 46.62 | 35.1 | 23.08 | 19.69 | 7.31 | 1.77 | 4.3 | 1.99 | 9.68 | 26.85 | - | - | 6.02 | 9.9 | 2.98 | 4.71 |
| EDS error | 1.35 | 0.66 | 0.3 | 0.31 | 2.9 | 0.5 | 0.2 | 0.2 | ||||||||
| Sample/Parameters | Ra µm | Rq µm | Rsk | Rku | Rp µm | Rv µm | RT µm |
|---|---|---|---|---|---|---|---|
| 25 µm—0 | 7.16 | 9.73 | 1.57 | 9.06 | 36.65 | 18.30 | 94.53 |
| 25 µm—1 | 4.73 | 6.39 | 1.11 | 7.09 | 18.21 | 13.12 | 60.16 |
| 25 µm—2 | 4.20 | 5.48 | 0.90 | 5.69 | 16.62 | 12.35 | 51.64 |
| 50 µm—0 | 8.77 | 11.08 | 0.28 | 3.27 | 32.10 | 25.59 | 81.45 |
| 50 µm—1 | 8.00 | 10.05 | 0.07 | 3.05 | 23.61 | 24.54 | 68.82 |
| 50 µm—2 | 6.11 | 7.96 | 0.19 | 3.82 | 19.82 | 21.38 | 57.44 |
| Sample | Test 1 | Test 2 | Test 3 | Test 4 | Test 5 | Average HV Value |
|---|---|---|---|---|---|---|
| 25 µm—0 | 404.3 | 406.1 | 437.5 | 378 | 411.7 | 407.52 |
| 25 µm—1 | 391.7 | 470.4 | 456.8 | 468 | 429 | 443.18 |
| 25 µm—2 | 479.7 | 499.4 | 528.4 | 514 | 475 | 499.3 |
| 50 µm—0 | 468 | 437.5 | 463.5 | 472.7 | 463.5 | 461.04 |
| 50 µm—1 | 459 | 472.7 | 484.5 | 470.4 | 472.7 | 471.86 |
| 50 µm—2 | 477.4 | 470.4 | 481.2 | 484.5 | 473.8 | 477.46 |
Publisher’s Note: MDPI stays neutral with regard to jurisdictional claims in published maps and institutional affiliations. |
© 2020 by the authors. Licensee MDPI, Basel, Switzerland. This article is an open access article distributed under the terms and conditions of the Creative Commons Attribution (CC BY) license (http://creativecommons.org/licenses/by/4.0/).
Share and Cite
Baciu, E.-R.; Cimpoeșu, R.; Vițalariu, A.; Baciu, C.; Cimpoeșu, N.; Sodor, A.; Zegan, G.; Murariu, A. Surface Analysis of 3D (SLM) Co–Cr–W Dental Metallic Materials. Appl. Sci. 2021, 11, 255. https://doi.org/10.3390/app11010255
Baciu E-R, Cimpoeșu R, Vițalariu A, Baciu C, Cimpoeșu N, Sodor A, Zegan G, Murariu A. Surface Analysis of 3D (SLM) Co–Cr–W Dental Metallic Materials. Applied Sciences. 2021; 11(1):255. https://doi.org/10.3390/app11010255
Chicago/Turabian StyleBaciu, Elena-Raluca, Ramona Cimpoeșu, Anca Vițalariu, Constantin Baciu, Nicanor Cimpoeșu, Alina Sodor, Georgeta Zegan, and Alice Murariu. 2021. "Surface Analysis of 3D (SLM) Co–Cr–W Dental Metallic Materials" Applied Sciences 11, no. 1: 255. https://doi.org/10.3390/app11010255
APA StyleBaciu, E.-R., Cimpoeșu, R., Vițalariu, A., Baciu, C., Cimpoeșu, N., Sodor, A., Zegan, G., & Murariu, A. (2021). Surface Analysis of 3D (SLM) Co–Cr–W Dental Metallic Materials. Applied Sciences, 11(1), 255. https://doi.org/10.3390/app11010255