Article

Two-Stage Classification Method for MSI Status Prediction Based on Deep Learning Approach

1
Korea Institute of Medical Microrobotics, Gwangju 506813, Korea
2
Daegu-Gyeongbuk Medical Innovation Foundation, Daegu 427724, Korea
3
Department of Computer Convergence Software, Korea University, Sejong 826802, Korea
4
Electronics and Telecommunications Research Institute, Daejeon 008242, Korea
5
Robotics Engineering Convergence and Department of Artificial Intelligence Convergence, Chonnam National University, Gwangju 506813, Korea
*
Authors to whom correspondence should be addressed.
Appl. Sci. 2021, 11(1), 254; https://doi.org/10.3390/app11010254
Submission received: 11 November 2020 / Revised: 23 December 2020 / Accepted: 24 December 2020 / Published: 29 December 2020

Abstract

:
Colorectal cancer is one of the most common cancers with a high mortality rate. The determination of microsatellite instability (MSI) status in resected cancer tissue is vital because it helps diagnose the related disease and determine the relevant treatment. This paper presents a two-stage classification method for predicting the MSI status based on a deep learning approach. The proposed pipeline includes the serial connection of the segmentation network and the classification network. In the first stage, the tumor area is segmented from the given pathological image using the Feature Pyramid Network (FPN). In the second stage, the segmented tumor is classified as MSI-L or MSI-H using Inception-Resnet-V2. We examined the performance of the proposed method using pathological images with 10× and 20× magnifications, in comparison with that of the conventional multiclass classification method where the tissue type is identified in one stage. The F1-score of the proposed method was higher than that of the conventional method at both 10× and 20× magnifications. Furthermore, we verified that the F1-score for 20× magnification was better than that for 10× magnification.

1. Introduction

Colorectal cancer (CRC), a malignant tumor that occurs in the colon or rectum, is a fast-growing cancer related to deaths in both developed and developing countries. In Korea, 28,111 people were diagnosed with CRC in 2017, according to the National Cancer Center, Korea; moreover, 8691 people died of the disease that year in Korea alone [1]. The American Cancer Society has reported that in 2020, more than 140,000 patients will be newly diagnosed with CRC and over 50,000 will die from the disease, nationally [2]. CRC has typically been among the top five cancers in terms of mortality rates; however, the incidences and the mortality rates have exhibited decreasing trends in recent years, attributed in part to a consensus on the molecular classification and its targeted therapies [3].
Microsatellite instability (MSI) is a typical pathogenesis of CRC, along with chromosome instability (CIN) and CpG island methylator phenotype (CIMP). MSI arises from the increased abnormal genetic alterations caused by a damaged DNA mismatch repair system, which can be molecularly detected with the repeated DNA motifs [4]. The National Cancer Society defines the MSI status of CRC tissue as MSI-H if it has two or more among five abnormal microsatellite markers, MSI-L if it has one, and MSI-Stable if it has none. Identifying the MSI status is crucial because it helps determine the related disease, such as the Lynch syndrome, and improve the prognosis for cancer treatments. Therefore, pathologists are strongly recommended to check the status of MSI in resected CRC tissue [5]. A general diagnosis procedure is conducted by examining hematoxylin- and eosin-stained CRC tissue and manually checking any abnormalities in the microscopic images. However, this procedure is tedious, and sometimes, prone to error.
Automatic diagnosis based on pathological images, initially proposed for breast cancers, has been widely studied to reduce the fatigue of pathologists [6]. In recent years, deep-learning-based approaches have been proposed to diagnose different cancers; moreover, they have exhibited good results, comparable to those of manual diagnoses. These studies focused on two main tasks for the pathological diagnosis: segmentation and classification.
Prior to the widespread use of deep learning approaches, various segmentation methods have been studied: region-based [7,8,9] and edge-based approaches [10]. Region-based segmentation methods are generally more robust than edge-based methods, particularly on images containing noise and texture; however, they are not accurate in determining the boundary of an object in real-world images. Segmentation methods using deep learning have outperformed the prior methods both in determining the boundaries and processing the images with noise and texture; therefore, they have been widely used on medical images [11]. The fully convolutional network (FCN) is the originator of the semantic segmentation network [12], which has been adapted to vessel segmentation [13], skin lesion segmentation [14], and organ segmentation from computed tomography scans [15]. UNet, originally developed for neuronal structure segmentation in electron microscopic stacks [16], is widely used in medical image segmentation, demonstrating good results on 2D and 3D images [17,18].
Image recognition competitions such as ILSVRC [19] have brought a dramatic improvement in image classification networks. For example, the famous networks such as AlexNet [20], VGG [21], and Resnet [22] were developed through competitions. VGG demonstrates that deeper networks have better classification performances. GoogleNet, often referred to as InceptionNet, uses the Inception block to form a more complex network with a smaller number of parameters. The skip connection of Resnet enables the formation of extensively deep networks. These deeper and more complex networks have been widely used for different medical image classification tasks by achieving performance comparable to that of medical experts. Inception-V3 has been adopted to diagnose skin cancer [23] and detect diabetic retinopathy [24]. AlexNet has been applied to classify thyroid cytopathology [25]. In pathological image classification, various networks (such as VGG and Resnet) have exhibited good diagnosis performance [26,27,28].
A challenge when employing deep convolutional neural networks (DCNNs) is the extremely large size of pathological images, which can be in gigapixels. To overcome this issue, Spanhol et al. proposed the use of small patches of the given images for a convolution neural network (CNN) in breast cancer classification [29]. The original whole slide image (WSI) was divided into small patches to train the CNN, and the final decision was made by combining the results for each patch. Different decision methods were used to combine the patch-wise results; however, they provided similar results, and none surpassed the individual results. Araúju et al. improved the work of patch-based CNNs by using a support vector machine (SVM) to combine the patch-wise results [30]. By applying the inception architecture, Liu et al. extensively compared the performance of different approaches, such as a multi-scale approach, color normalization, and the use of a pre-trained network on the ImageNet dataset [31], for breast cancer diagnosis; they resulted in a similar outcome [32].
The main contribution of the present study is a novel two-stage classification pipeline, that is, the serial connection of the segmentation network and the binary classification network. This study was inspired by the results of the breast cancer classification challenge conducted in 2018, where the accuracy of binary classification (carcinoma or not carcinoma) was reported to be higher than that of four-class classification (normal, benign, in situ carcinoma, or invasive carcinoma) [33]. As a preliminary experiment, we trained the network for three-class classification (MSI-L, MSI-H, or normal tissue) and two binary classifications (normal or tumor and MSI-L or MSI-H). The resultant confusion matrix demonstrated that the binary classifications outperformed the three-class classification in that the network sometimes misclassified MSI-H patches as MSI-L or normal tissue. We presumed that the dataset imbalance caused the misclassification; thus we propose the two-stage classification pipeline that enables to perform classification with a dataset in which the imbalance is significantly reduced.
In this study, first we segmented the tumor area from the WSI using the Feature Pyramid Network (FPN) [34] to except the normal tissue area from the MSI-status classification. Then we classified the segmented tumor area as either MSI-L or MSI-H using Inception-Resnet-V2 [35]. The proposed two-stage classification method is presented in Section 2, followed by the experimental results in Section 3. We compared the performance of the proposed two-stage classification pipeline to that of the conventional classification algorithm, which simultaneously classified the patches into normal tissue, MSI-L, and MSI-H.

2. Methods

The original WSI has a gigapixel resolution, which limits the use of a conventional CNN classifier scheme. Therefore, we adapted the patch-wise classification method. This section begins with a description of the dataset used in this study, followed by the patch preparation procedure for the training dataset. The proposed two-stage classification method is then elaborated, and the section ends with the implementation details.

2.1. Dataset

The dataset used in this study was provided by the PAIP 2020 challenge, which was aimed at MSI-H classification for CRC [36]. Our dataset included 47 training sets and 10 validation sets. The validation datasets were excluded from the training session and used only in the validation session. Each dataset contains WSIs, XML files annotating a tumor area, and ground truths for MSI classification. The WSIs included in the dataset were the microscopic images of resected tissue, stained with hematoxylin and eosin and scanned at 40× magnification using Aperio AT2. In addition to the original image with 40× magnification, the WSIs also included images with low magnifications, such as 20× and 10×, to display the surrounding context information. In this study, WSIs with 20× and 10× magnifications were mainly used, considering computational time and efficiency. All WSIs contain at least one region of the colorectal tumor. The ground truths for MSI classification and tumor area were annotated by pathologists at Seoul National University Hospital (Seoul, Korea), Seoul National University Bundang Hospital (Seongnam, Korea), and Seoul Metropolitan Government Seoul National University Boramae Medical Center (Seoul, Korea) from January 2005 to June 2018.

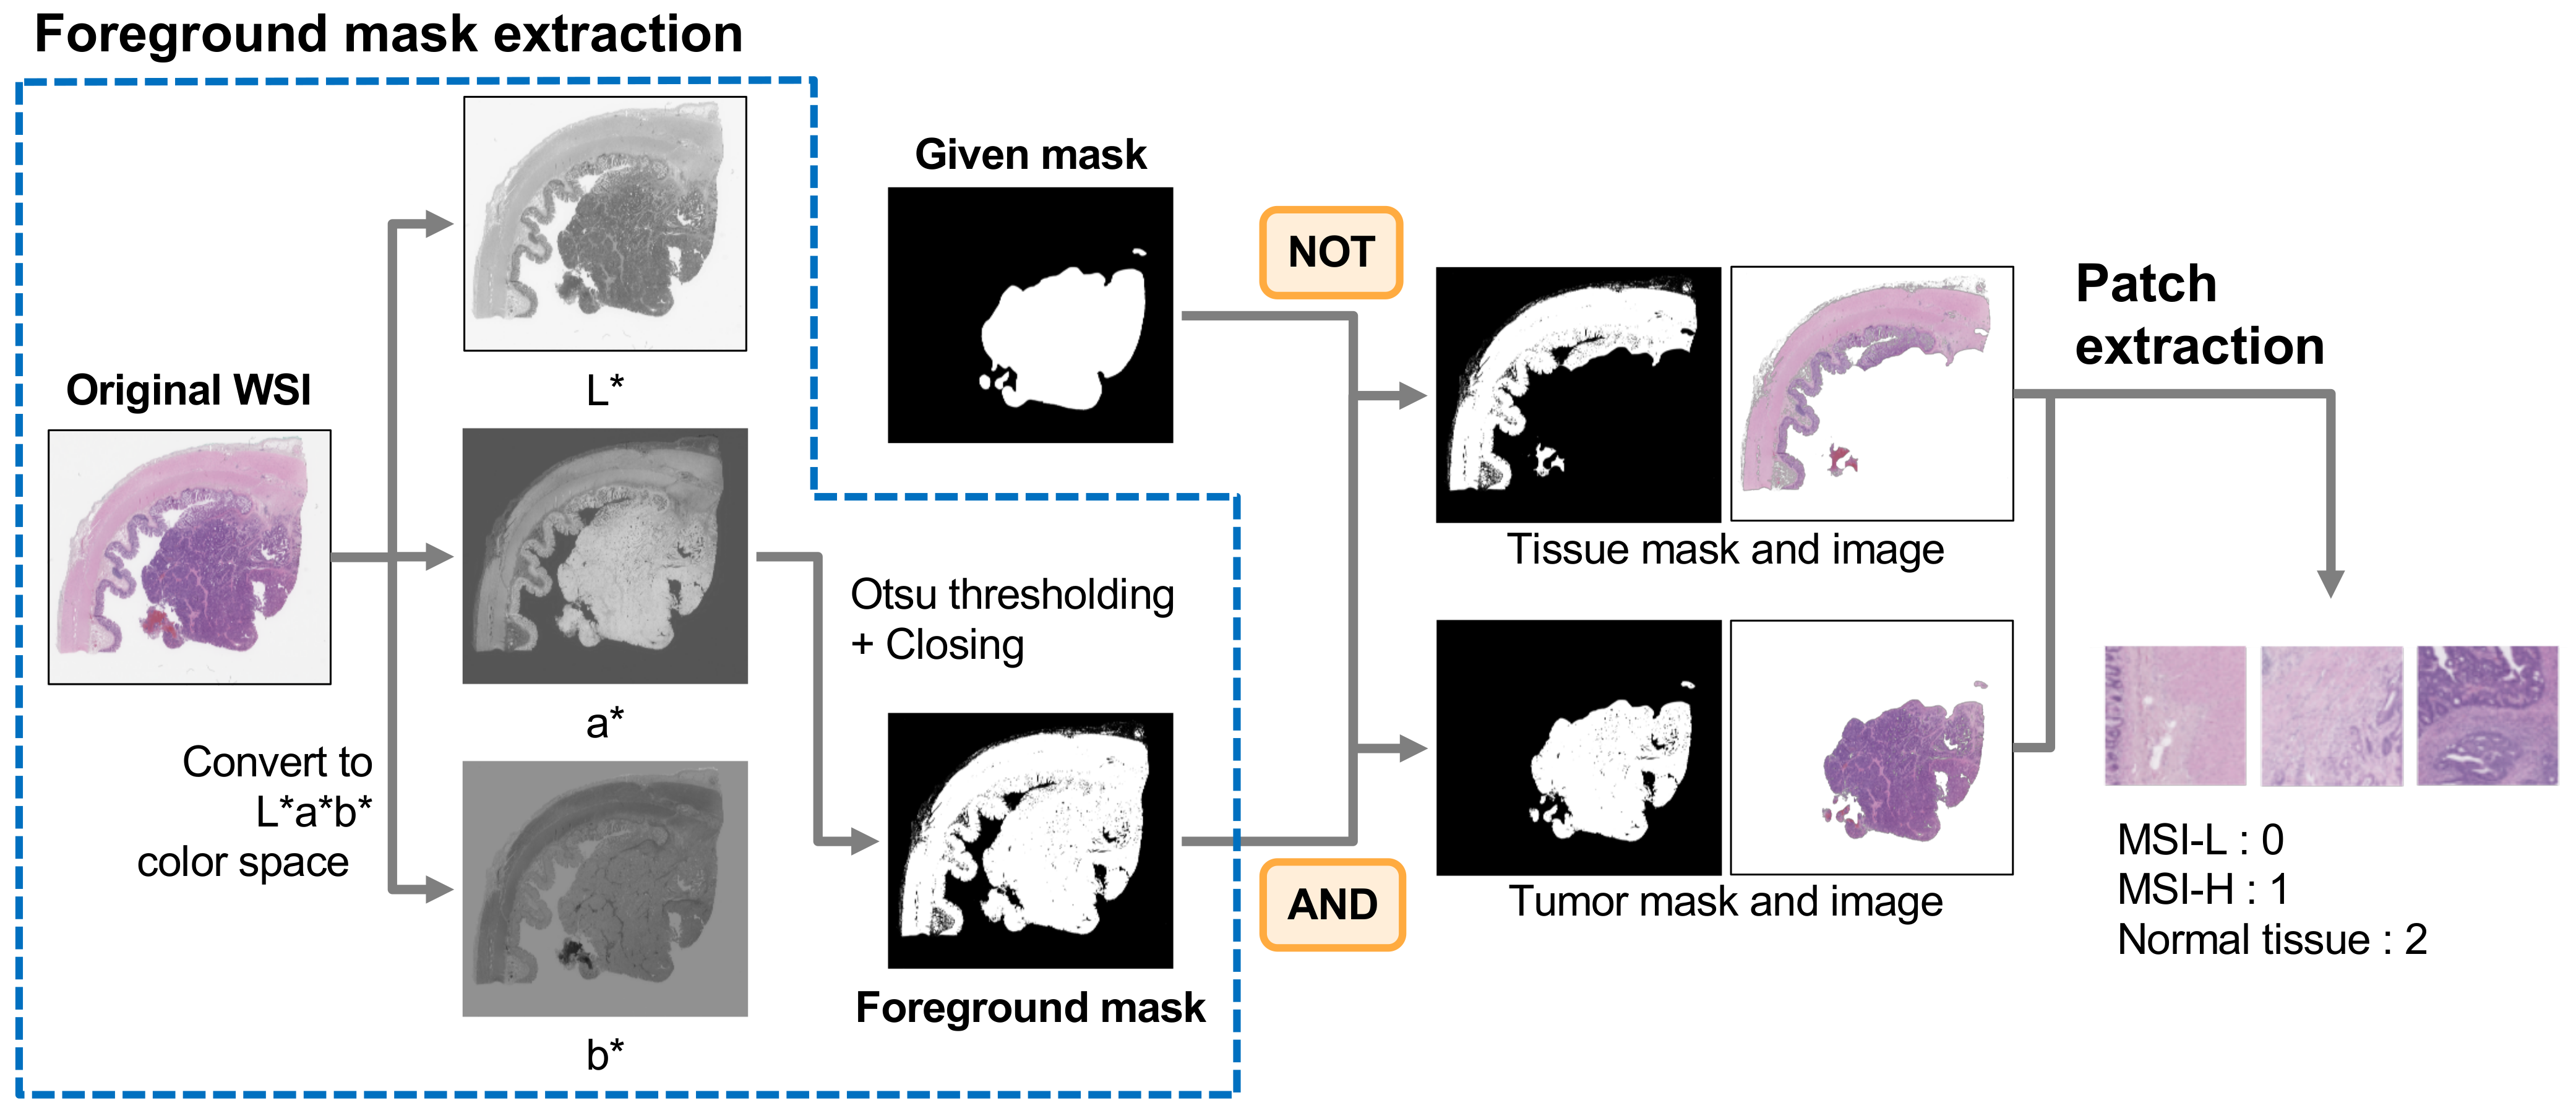
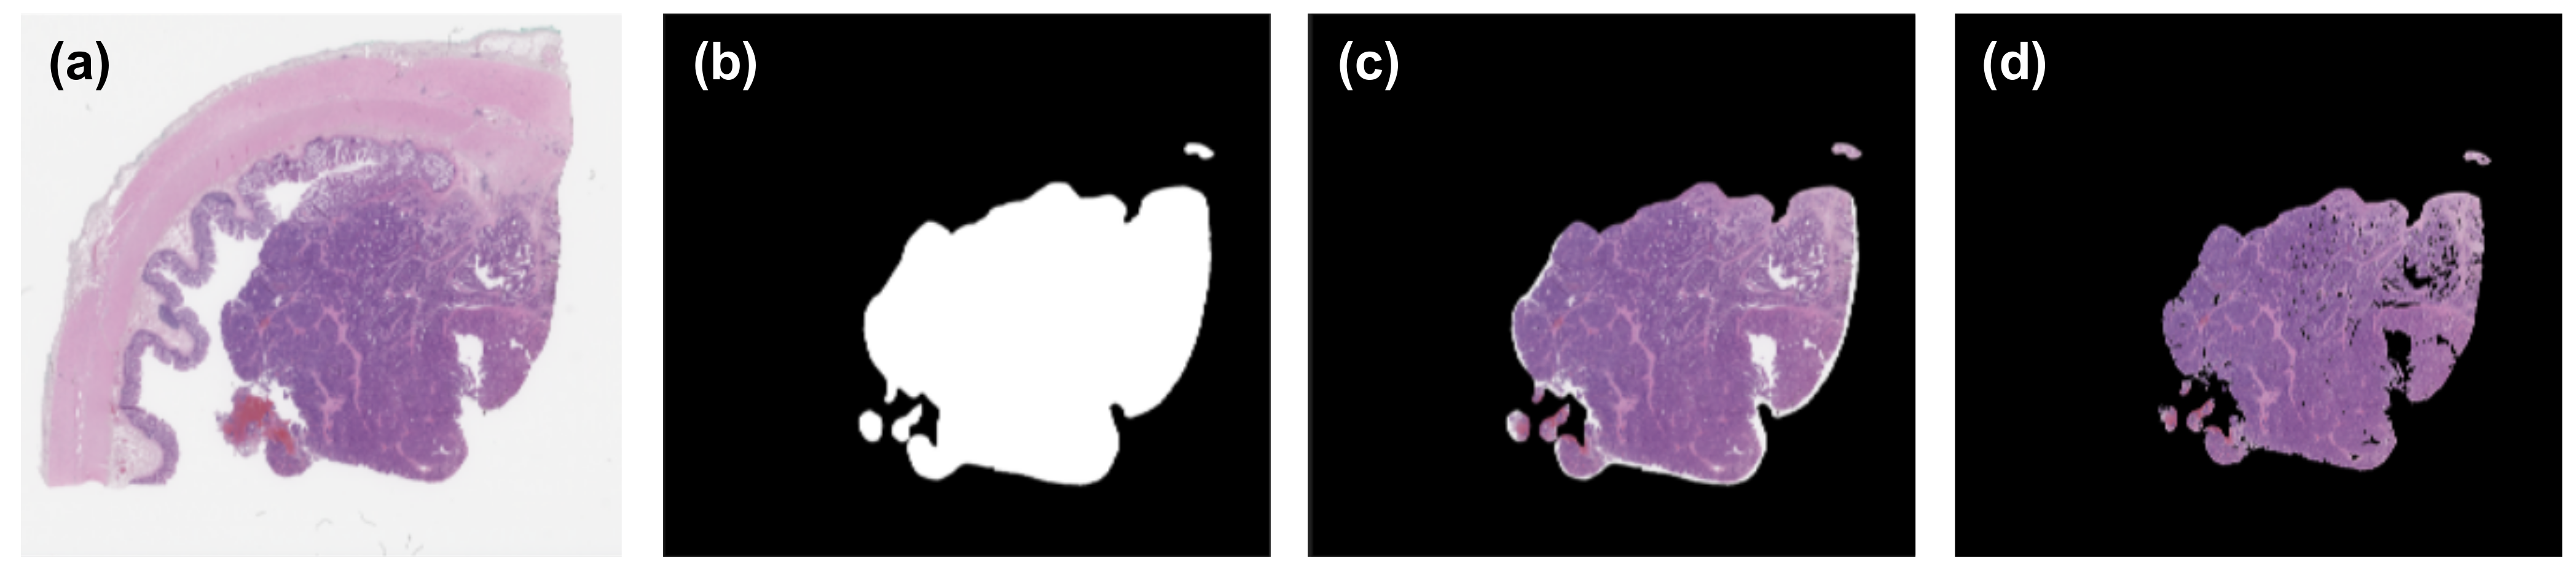
2.2. Patch Preparation

We adapted the patch extraction method described in [37], wherein the color characteristics of the stained tissue were considered. The overall patch preparation procedure is presented in Figure 1. The procedure began with the foreground mask extraction. The color format of the original WSI was converted from RGBA to the CIE L*a*b* color space, which helped separate the red-stained tissues from the background. To extract the foreground mask, we applied the Otsu thresholding method [9] to the a* channel of the image and a closed morphology to eliminate noise. This foreground mask was combined with the mask created from the given XML annotation file to create the masks for normal tissue and tumor area. The tissue and tumor masks were created by applying pixel-wise NOT and AND operations on the two masks, respectively. Notably, the mask obtained from the annotated XML file contained the background, as shown in Figure 2. This might deteriorate the network performance; therefore, we used the newly created mask to improve the accuracy, as shown in Figure 2d.
The created tissue and tumor masks were used to obtain the WSI without a background. The segmented WSI was then cropped into small patches with a size of 224 × 224 pixels. The patches were extracted with 50% overlap for data augmentation. The patch-wise annotation was labeled as follows: MSI-L = 0, MSI-H = 1, and normal tissue = 2, according to MSI classifications diagnosed by the pathologists.

2.3. Two-Stage Classification

A two-stage classification pipeline is proposed for MSI status classification, inspired by the findings that the network performs better at binary classification than at multiple classification. As a preliminary experiment, we trained the network with Inception-Resnet-V2 that classified three classes simultaneously with 20× and 10× magnified WSIs. The proposed pipeline included two main steps: tumor segmentation and patch-wise MSI status classification. In the tumor segmentation step, a pre-trained network on the ImageNet dataset [31] is used to divide the patches into two types: normal tissues and tumors (MSI-L and MSI-H). Then, the patch-wise MSI status classification is performed on only the patches labeled as tumors. A schematic of the overall pipeline is presented in Figure 3.
The patches were prepared similar to the training patches described in Section 2.2. Particularly, the patches were split with a size of 224 × 224 pixels, similar to the training patches, but without overlapping areas. Patches with more than 50% foreground pixels were fed into the pre-trained segmentation network based on FPN. The segmentation network produced a tumor mask for each patch, annotating one for tumor area and zero for normal tissue area. The masks were then stitched into the overall tumor mask, which had the same size as the WSI. This whole-slide-sized mask and the original WSI were used to extract the area containing tumors using the pixel-wise AND operation. The resultant images were again split into patches. If more than 50% of a patch corresponded to background or normal tissue area, that patch was discarded and not used for MSI status classification. The second network, which was a patch-wise MSI status classification network, was then used to classify the patch into MSI-L or MSI-H based on Inception-Resnet-V2. Finally, the patch-wise classification results were collected to determine the MSI status of the given WSI. Among the various ensemble methods, the majority vote method was chosen in this study.

3. Experimental Results

3.1. Implementation Details
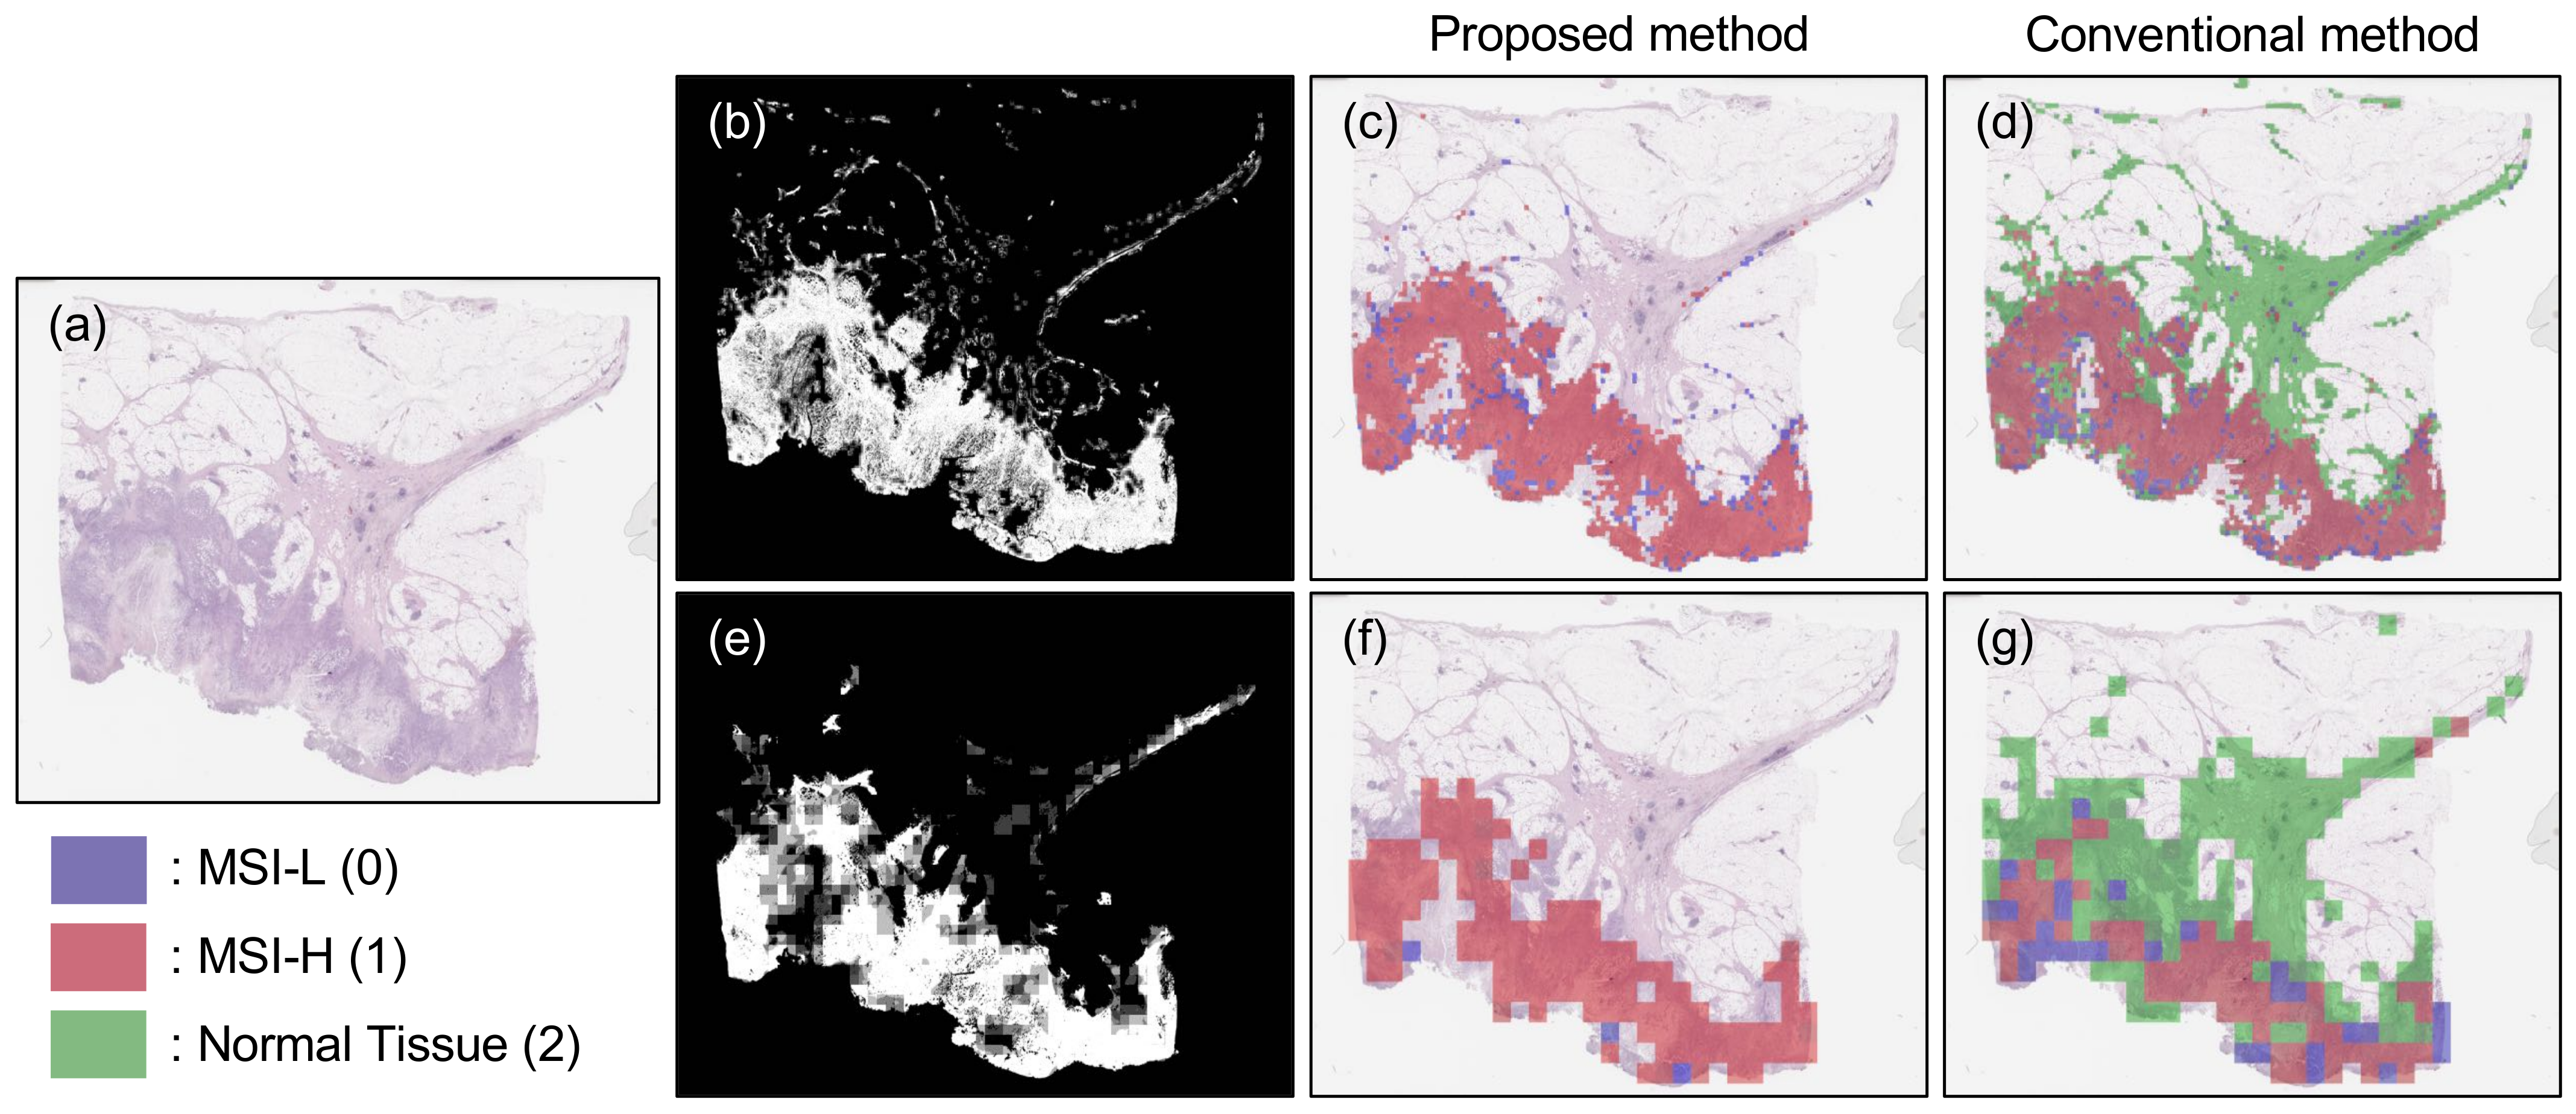
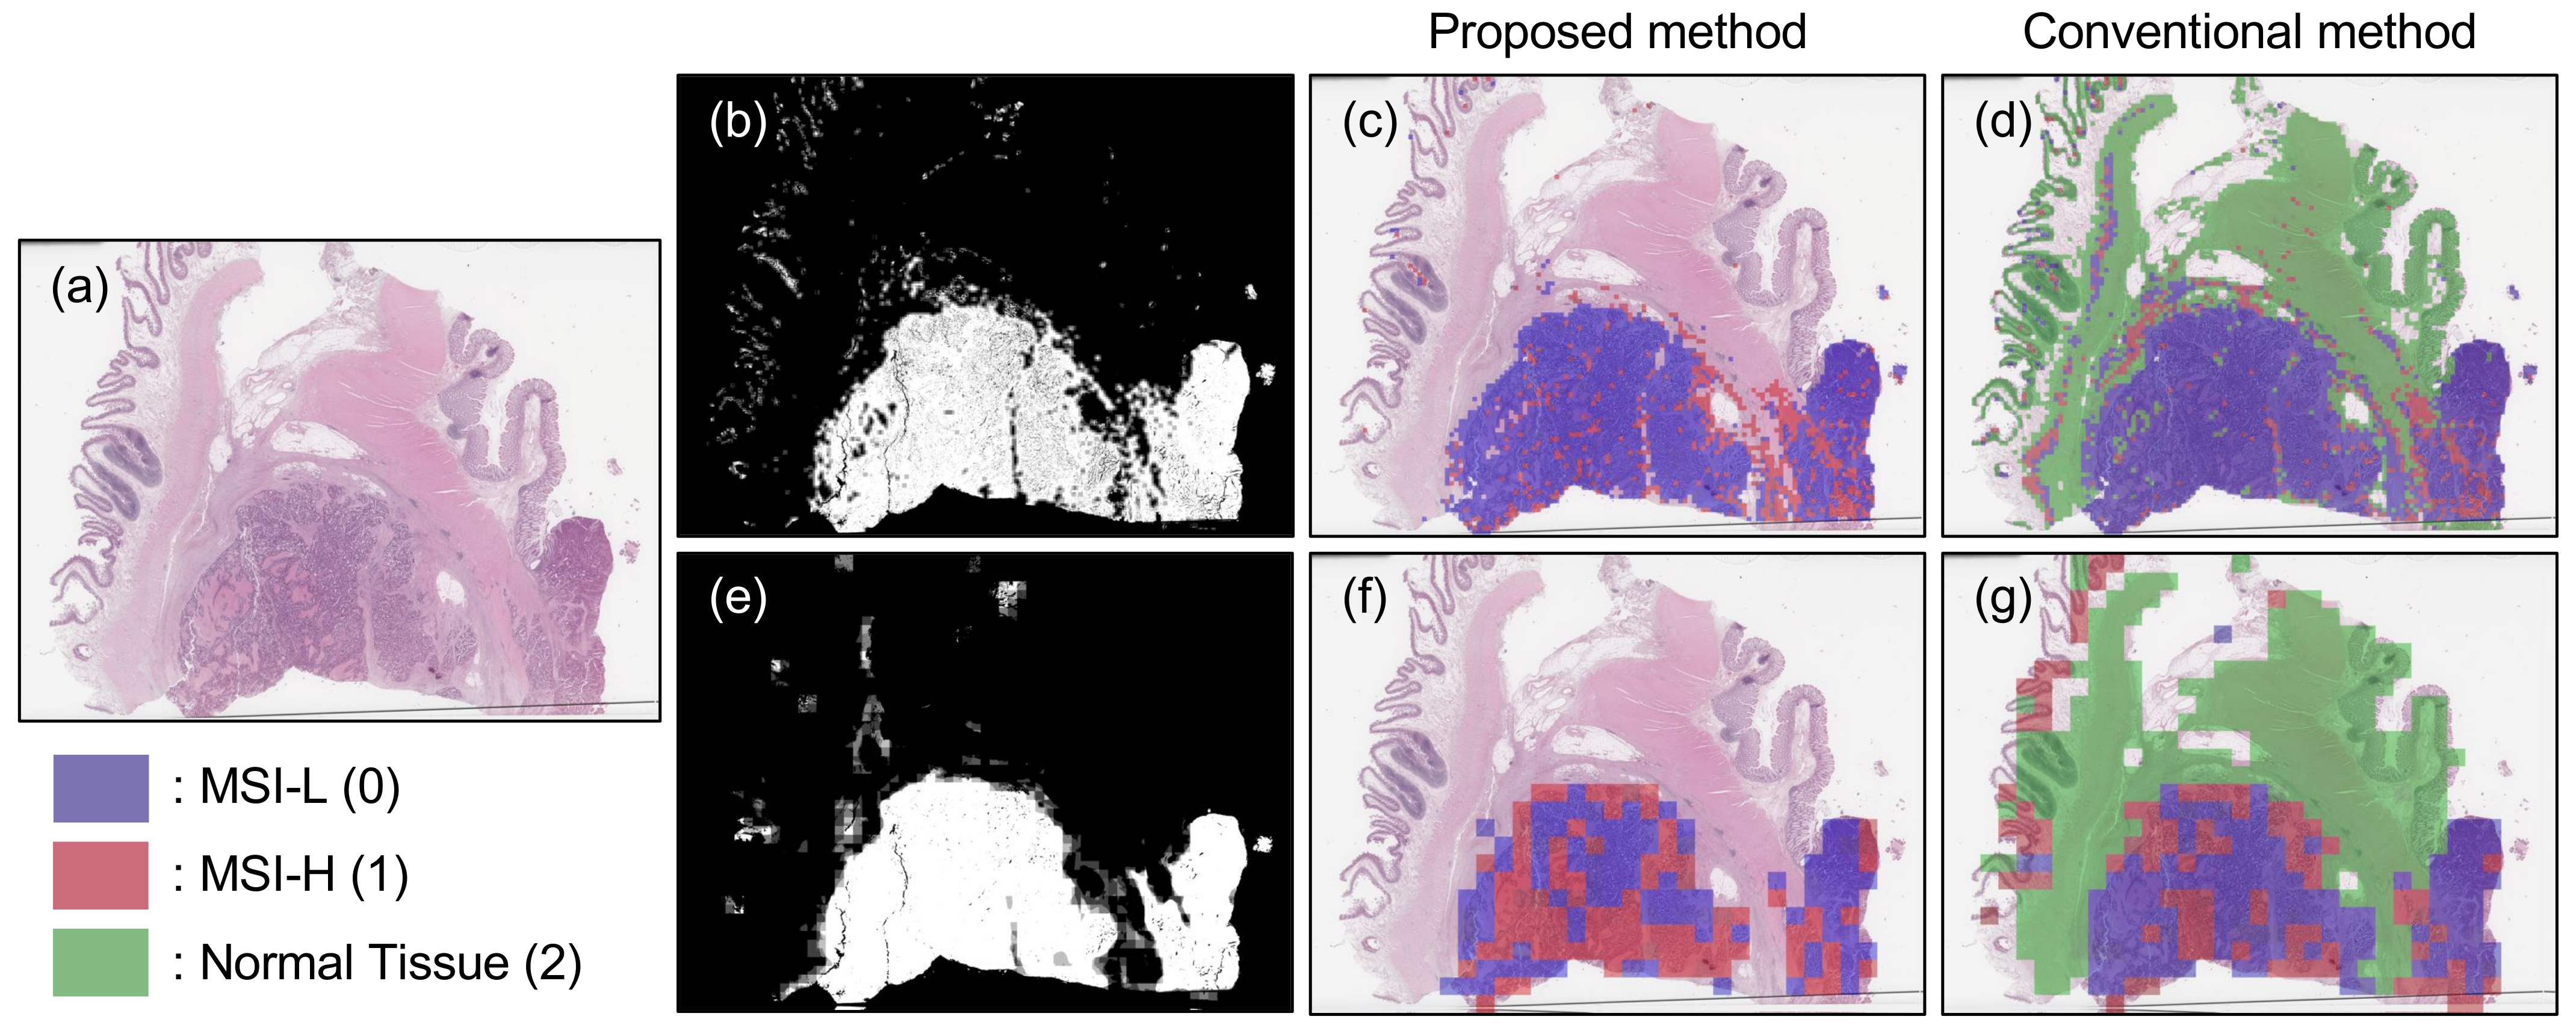
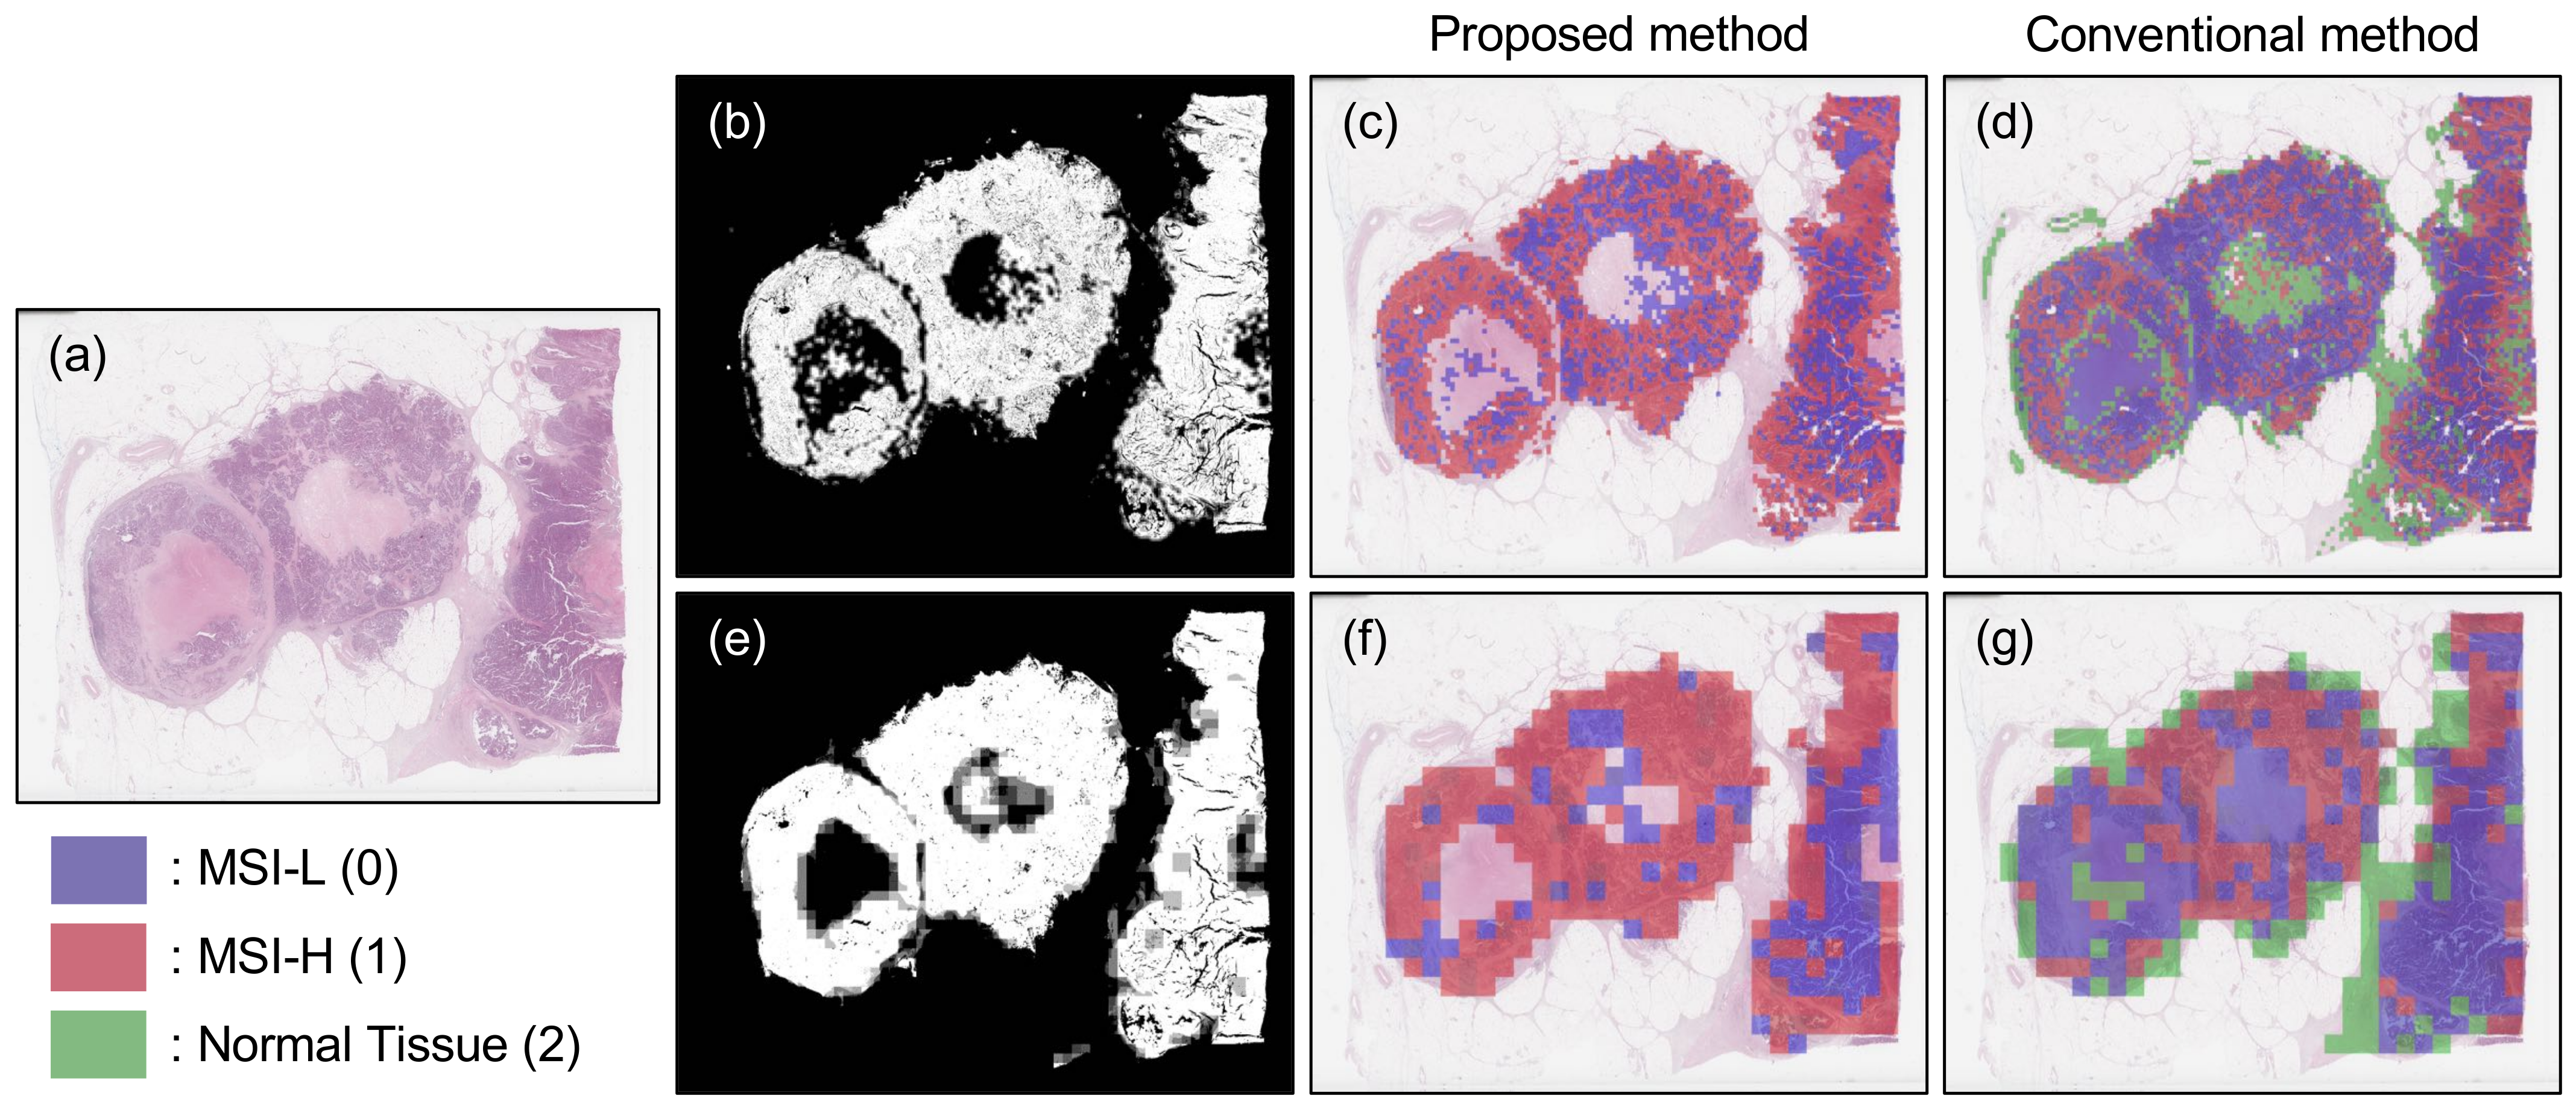
We generated patches for three classes (i.e., MSI-L, MSI-H, and normal tissue) by preprocessing the training dataset. To avoid the class imbalance problem, classes with fewer patches were oversampled by allowing replacement. Eighty percent of the patches were used for training and the remaining were used for cross-validation. To avoid overfitting, we applied different data augmentations to the patches, including horizontal and vertical flips, random rotations, and crops.
For the segmentation network, we used FPN [34], which was robust in multi-scale object detection. In this study, we used EfficientNets [38] as the encoder backbone network because it is more accurate and efficient compared to other convolutional networks such as VGG16 [21] and ResNet [22]. For the classification network, we selected Inception-Resnet-V2 because it showed the best performance for breast cancer classification compared to VGG19, Inception-V3, and Inception-V4 [37]. The segmentation and classification networks were trained using the same data, prepared as described in Section 2.2. We chose a dice loss for the segmentation network to consider the imbalance of the dataset. For the classification network, we used a cross entropy as a loss function, which is commonly used for such a task; the imbalance in the dataset still exists; however, it was dealt with oversampling. Table 1 represents the F1-score results when different optimizers and learning rate schedulers were implemented. Based on the preliminary results, the Adam optimizer was used with an initial learning rate of 1e-4 and a step decay scheduler for both networks.
The models were implemented in PyTorch using the Python library for segmentation [39]. We trained the network for 100 epochs with a batch size of 64 using NVIDIA Tesla V100 GPU. The network was trained using 47 training datasets and tested with another 10 validation datasets, comprising five MSI-L and five MSI-H WSIs.

3.2. Results

The performance of the proposed two-stage classification method was compared to that of the conventional multiclass classification method, which simultaneously identified the given patches as normal tissue, MSI-L, or MSI-H. The representative cases of the patch-wise prediction results on the validation datasets were visualized with the heatmaps created for different image magnifications, as shown in Figure 4, Figure 5 and Figure 6. Each patch in the heatmap was colored according to the prediction results; blue, red, and green patches represented the MSI status of tissues as MSI-L, MSI-H, and normal, respectively.
The representative prediction results are shown in Figure 4 and Figure 5, according to which both the proposed and conventional methods performed accurate prediction. Figure 4 shows the results for the MSI-H tissue. The results for the WSIs at 20× magnification and 10× magnifications are depicted in Figure 4b–d and Figure 4e–g, respectively. In all cases, the network predicted MSI-H using the majority vote method from the patch-wise classification results. At 20× magnification, the heatmaps created using the proposed method (Figure 4c) and the conventional method (Figure 4d) were similar. Most patches were identified as MSI-H within the segmented tumor area. In contrast, at the lower magnification, the conventional multiclass classification method resulted in a mixture of red and blue patches in the segmented tumor area (Figure 4g). Certain patches were even classified as normal tissue, depicted with green color in the heatmap. For the MSI-L tissue, the proposed and conventional methods performed accurate predictions at both 10× and 20× magnifications, as shown in Figure 5. However, at 10× magnification, the proposed method did not precisely predict the status of the segmented tumor area, although the majority vote concluded the status as MSI-L (Figure 5f). Apparently, the proposed two-stage classification method performed better on 20× magnified images.
Another representative prediction result is shown in Figure 6. The figure shows the prediction results of the MSI-H tissue, wherein the proposed method and the conventional method predicted differently. The proposed method determined MSI-H tissues accurately; however, the conventional method identified them as MSI-L. The proposed method showed better performance in distinguishing the MSI-L and MSI-H status of the tumor patch, regardless of the image magnifications. Furthermore, the conventional method determined several normal tissue patches as MSI-L, which led to an increase in the number of patches predicted as MSI-L, and thus, distorted the final decision. This was avoided with the proposed two-stage classification.
The classification performance of the proposed method is presented with the F1-score, as shown in Table 2. The final decision obtained after the majority vote was used to describe the performance of the overall classification pipeline. The F1-score was used as the performance measure because of the general unequal distribution of data for MSI-L and MSI-H in clinical practice. The proposed method trained with the 20× magnified images exhibited the highest F1-score of 0.83. In the case of both the proposed and the conventional methods, the network trained with the 20× magnified images exhibited better performance than that trained with the 10× magnified images.

4. Discussion and Conclusions

A typical multiclass classification method categorizes the three MSI status simultaneously; however, such a method exhibits poor efficiency in distinguishing MSI-H from other tissue types. In this paper, we present a novel two-stage classification pipeline to predict the MSI status of CRC tissue. The proposed classification pipeline serially connected two classifiers: the segmentation network and the classification network. The segmentation network, in the first stage, prevented the incorrect prediction of normal tissues as MSI-L by excluding them in advance; this confusion was, however, observed when using the multiclass classification method.
The performance of the proposed method was compared to that of the multiclass classification method using the F1-score as the evaluation measure. The proposed method notably outperformed the one multiclass classification. In this approach, the binary classification was performed in the region only determined as tumor tissue using the prior segmentation techniques, which enables to perform the classification on a dataset with significantly reduced imbalance. Particularly, the given original dataset we used for this study was unbalanced; for example, in each WSI, the normal tissue occupied more regions than the tumor tissue. Since we could exclude the region of the normal tissues at the first segmentation stage, the binary classification at the second stage could result in better performance.
The results of our classification method were comparable to that of the eighth-place team for PAIP 2020 competition; however, the direct comparison was hard to be evaluated since the dataset we used for this study was different to that used for the final rank. The first-place team adopted the sequentially connected segmentation and classification network; after the segmentation stage, one hundred patches were randomly selected and VGG16 was applied to each patch followed by a recurrent neural network (RNN). The team scored the F1-score of 0.92 using the test dataset, which is 0.09 higher than that of our approach. The required high computational power and complexity of the network pipeline may lead to better performance. Our study rather focuses on experimentally verifying the performance improvement of using two-stage classification compared to the one conventional multiclass classification, although different networks for the segmentation and classification in two-stage classification pipeline may result in better performance.
Furthermore, we have identified the image magnification effect on the F1-Score. Both the proposed and the conventional method showed better performance with images at 20× than at 10× magnification. In general, as the magnification increased, information about the neighboring cells disappeared; however, the geometrical characteristics of each cell, such as size, convexity, and intervals between cells, were emphasized. We may conclude that the geometrical properties improved the classification performance at higher magnifications. In our future work, more advanced image processing techniques will be considered at the preprocessing stage, which can help accentuate the geometrical properties of each individual cell. The final decision-making method considering the distribution of patch-wise classification results can be one of our future works.

Author Contributions

Conceptualization, H.L., G.L., and A.H.; methodology, H.L., J.S., and D.Y.; visualization, H.L. and G.L.; writing—original draft, H.L.; writing—review and editing, D.Y. and A.H.; funding acquisition, J.P.; supervision, D.Y. and A.H. All authors have read and agreed to the published version of the manuscript.

Funding

This work was supported by the grant of the Korea Health Technology R&D Project through the Korea Health Industry Development Institute (KHIDI), funded by the Ministry of Health and Welfare, Republic of Korea (grant number: HI19C0642), and a National Research Council of Science and Technology (NST) grant from the Korean government (MSIP) (No. CRC-15-05-ETRI). De-identified pathology images and annotations used in this research were prepared and provided by the Seoul National University Hospital by a grant of the Korea Health Technology R&D Project through the KHIDI, funded by the Ministry of Health and Welfare, Republic of Korea (grant number: HI18C0316).

Institutional Review Board Statement

Not applicable.

Informed Consent Statement

Not applicable.

Data Availability Statement

Restrictions apply to the availability of these data. Data was obtained from PAIP 2020 challenge and are available https://paip2020.grand-challenge.org/Home/ with the permission.

Conflicts of Interest

The authors declare no conflict of interest.

References

  1. Hong, S.; Won, Y.J.; Park, Y.R.; Jung, K.W.; Kong, H.J.; Lee, E.S. Cancer Statistics in Korea: Incidence, Mortality, Survival, and Prevalence in 2017. Cancer Res. Treat. 2020, 52, 335. [Google Scholar] [CrossRef] [PubMed]
  2. Siegel, R.L.; Miller, K.D.; Jemal, A. Cancer statistics, 2020. CA Cancer J. Clin. 2020, 70, 7–30. [Google Scholar] [CrossRef] [PubMed]
  3. Jass, J. Classification of colorectal cancer based on correlation of clinical, morphological and molecular features. Histopathology 2007, 50, 113–130. [Google Scholar] [CrossRef] [PubMed]
  4. Bardhan, K.; Liu, K. Epigenetics and colorectal cancer pathogenesis. Cancers 2013, 5, 676–713. [Google Scholar] [CrossRef] [PubMed] [Green Version]
  5. Kawakami, H.; Zaanan, A.; Sinicrope, F.A. Microsatellite instability testing and its role in the management of colorectal cancer. Curr. Treat. Options Oncol. 2015, 16, 1–15. [Google Scholar] [CrossRef] [PubMed]
  6. Stenkvist, B.; Westman-Naeser, S.; Holmquist, J.; Nordin, B.; Bengtsson, E.; Vegelius, J.; Eriksson, O.; Fox, C.H. Computerized nuclear morphometry as an objective method for characterizing human cancer cell populations. Cancer Res. 1978, 38, 4688–4697. [Google Scholar] [PubMed]
  7. Potts, R.B. Some generalized order-disorder transformations. In Mathematical Proceedings of the Cambridge Philosophical Society; Cambridge University Press: Cambridge, UK, 1952; Volume 48, pp. 106–109. [Google Scholar]
  8. Chan, T.F.; Vese, L.A. Active contours without edges. IEEE Trans. Image Process 2001, 10, 266–277. [Google Scholar] [CrossRef] [Green Version]
  9. Otsu, N. A threshold selection method from gray-level histograms. IEEE Trans. Syst. Man Cybern 1979, 9, 62–66. [Google Scholar] [CrossRef] [Green Version]
  10. Caselles, V.; Kimmel, R.; Sapiro, G. Geodesic active contours. Int. J. Comput. Vis. 1997, 22, 61–79. [Google Scholar] [CrossRef]
  11. Wang, S.; Yang, D.M.; Rong, R.; Zhan, X.; Xiao, G. Pathology Image Analysis Using Segmentation Deep Learning Algorithms. Am. J. Pathol. 2019, 189, 1686–1698. [Google Scholar] [CrossRef] [Green Version]
  12. Long, J.; Shelhamer, E.; Darrell, T. Fully convolutional networks for semantic segmentation. In Proceedings of the IEEE Conference on Computer Vision and Pattern Recognition, Boston, MA, USA, 7–12 June 2015; pp. 3431–3440. [Google Scholar]
  13. Bi, L.; Feng, D.; Kim, J. Dual-path adversarial learning for fully convolutional network (FCN)-based medical image segmentation. Vis. Comput. 2018, 34, 1043–1052. [Google Scholar] [CrossRef]
  14. Yuan, Y.; Chao, M.; Lo, Y.C. Automatic skin lesion segmentation using deep fully convolutional networks with jaccard distance. IEEE Trans. Med. Imaging 2017, 36, 1876–1886. [Google Scholar] [CrossRef] [PubMed]
  15. Lu, F.; Wu, F.; Hu, P.; Peng, Z.; Kong, D. Automatic 3D liver location and segmentation via convolutional neural network and graph cut. Int. J. Comput. Assist. Radiol. Surg. 2017, 12, 171–182. [Google Scholar] [CrossRef]
  16. Ronneberger, O.; Fischer, P.; Brox, T. U-net: Convolutional networks for biomedical image segmentation. In Proceedings of the International Conference on Medical Image Computing and Computer-Assisted Intervention, Munich, Germany, 5–9 October 2015; pp. 234–241. [Google Scholar]
  17. Falk, T.; Mai, D.; Bensch, R.; Çiçek, Ö.; Abdulkadir, A.; Marrakchi, Y.; Böhm, A.; Deubner, J.; Jäckel, Z.; Seiwald, K.; et al. U-Net: Deep learning for cell counting, detection, and morphometry. Nat. Methods 2019, 16, 67–70. [Google Scholar] [CrossRef] [PubMed]
  18. Çiçek, Ö.; Abdulkadir, A.; Lienkamp, S.S.; Brox, T.; Ronneberger, O. 3D U-Net: Learning dense volumetric segmentation from sparse annotation. In Proceedings of the International Conference on Medical Image Computing and Computer-Assisted Intervention, Athens, Greece, 17–21 October 2016; pp. 424–432. [Google Scholar]
  19. ILSVRC. Available online: http://www.image-net.org/challenges/LSVRC/ (accessed on 29 December 2020).
  20. Krizhevsky, A.; Sutskever, I.; Hinton, G.E. Imagenet classification with deep convolutional neural networks. Commun. ACM 2017, 60, 84–90. [Google Scholar] [CrossRef]
  21. Simonyan, K.; Zisserman, A. Very deep convolutional networks for large-scale image recognition. arXiv 2014, arXiv:1409.1556. [Google Scholar]
  22. He, K.; Zhang, X.; Ren, S.; Sun, J. Deep residual learning for image recognition. In Proceedings of the IEEE Conference on Computer Vision and Pattern Recognition, Las Vegas, NV, USA, 27–30 June 2016; pp. 770–778. [Google Scholar]
  23. Esteva, A.; Kuprel, B.; Novoa, R.A.; Ko, J.; Swetter, S.M.; Blau, H.M.; Thrun, S. Dermatologist-level classification of skin cancer with deep neural networks. Nature 2017, 542, 115–118. [Google Scholar] [CrossRef] [PubMed]
  24. Gulshan, V.; Peng, L.; Coram, M.; Stumpe, M.C.; Wu, D.; Narayanaswamy, A.; Venugopalan, S.; Widner, K.; Madams, T.; Cuadros, J.; et al. Development and validation of a deep learning algorithm for detection of diabetic retinopathy in retinal fundus photographs. JAMA 2016, 316, 2402–2410. [Google Scholar] [CrossRef]
  25. Kim, J.; Calhoun, V.D.; Shim, E.; Lee, J.H. Deep neural network with weight sparsity control and pre-training extracts hierarchical features and enhances classification performance: Evidence from whole-brain resting-state functional connectivity patterns of schizophrenia. Neuroimage 2016, 124, 127–146. [Google Scholar] [CrossRef] [Green Version]
  26. Turkki, R.; Linder, N.; Kovanen, P.E.; Pellinen, T.; Lundin, J. Antibody-supervised deep learning for quantification of tumor-infiltrating immune cells in hematoxylin and eosin stained breast cancer samples. J. Pathol. Inform. 2016, 7, 41. [Google Scholar] [CrossRef]
  27. Romo-Bucheli, D.; Janowczyk, A.; Gilmore, H.; Romero, E.; Madabhushi, A. Automated tubule nuclei quantification and correlation with oncotype DX risk categories in ER+ breast cancer whole slide images. Sci. Rep. 2016, 6, 32706. [Google Scholar] [CrossRef] [PubMed] [Green Version]
  28. Wang, S.; Yao, J.; Xu, Z.; Huang, J. Subtype cell detection with an accelerated deep convolution neural network. In Proceedings of the International Conference on Medical Image Computing and Computer-Assisted Intervention, Athens, Greece, 17–21 October 2016; pp. 640–648. [Google Scholar]
  29. Spanhol, F.A.; Oliveira, L.S.; Petitjean, C.; Heutte, L. Breast cancer histopathological image classification using convolutional neural networks. In Proceedings of the 2016 international joint conference on neural networks (IJCNN), Vancouver, BC, Canada, 24–29 July 2016; pp. 2560–2567. [Google Scholar]
  30. Araújo, T.; Aresta, G.; Castro, E.; Rouco, J.; Aguiar, P.; Eloy, C.; Polónia, A.; Campilho, A. Classification of breast cancer histology images using convolutional neural networks. PLoS ONE 2017, 12, e0177544. [Google Scholar] [CrossRef] [PubMed]
  31. Deng, J.; Dong, W.; Socher, R.; Li, L.J.; Li, K.; Fei-Fei, L. Imagenet: A large-scale hierarchical image database. In Proceedings of the 2009 IEEE conference on computer vision and pattern recognition, Miami, FL, USA, 20–25 June 2009; pp. 248–255. [Google Scholar]
  32. Liu, Y.; Gadepalli, K.; Norouzi, M.; Dahl, G.E.; Kohlberger, T.; Boyko, A.; Venugopalan, S.; Timofeev, A.; Nelson, P.Q.; Corrado, G.S.; et al. Detecting cancer metastases on gigapixel pathology images. arXiv 2017, arXiv:1703.02442. [Google Scholar]
  33. Aresta, G.; Araújo, T.; Kwok, S.; Chennamsetty, S.S.; Safwan, M.; Alex, V.; Marami, B.; Prastawa, M.; Chan, M.; Donovan, M.; et al. Bach: Grand challenge on breast cancer histology images. Med. Image Anal. 2019, 56, 122–139. [Google Scholar] [CrossRef]
  34. Lin, T.Y.; Dollár, P.; Girshick, R.; He, K.; Hariharan, B.; Belongie, S. Feature pyramid networks for object detection. In Proceedings of the IEEE Conference on Computer Vision and Pattern Recognition, Honolulu, HI, USA, 21–27 July 2017; pp. 2117–2125. [Google Scholar]
  35. Szegedy, C.; Ioffe, S.; Vanhoucke, V.; Alemi, A. Inception-v4, inception-resnet and the impact of residual connections on learning. arXiv 2016, arXiv:1602.07261. [Google Scholar]
  36. PAIP2020. Available online: https://paip2020.grand-challenge.org/Home/ (accessed on 29 December 2020).
  37. Kwok, S. Multiclass classification of breast cancer in whole-slide images. In Proceedings of the International Conference Image Analysis and Recognition, Povoa de Varzim, Portugal, 27–29 June 2018; pp. 931–940. [Google Scholar]
  38. Tan, M.; Le, Q.V. EfficientNet: Rethinking Model Scaling for Convolutional Neural Networks. arXiv 2019, arXiv:1905.11946. [Google Scholar]
  39. Yakubovskiy, P. Segmentation Models Pytorch. 2020. Available online: https://github.com/qubvel/segmentation_models.pytorch (accessed on 29 December 2020).
Figure 1. Overview of the patch preparation procedure: foreground mask extraction, new tissue and mask creation, and patch extraction.
Applsci 11 00254 g001
Figure 2. The original whole slide image (WSI) and the associated tumor mask: (a) the original WSI, (b) the tumor mask created from the given XML annotation, (c) the segmented tumor area from WSI, and (d) the created tumor mask without background.
Applsci 11 00254 g002
Figure 3. Two-stage classification pipeline for microsatellite instability (MSI) status prediction.
Applsci 11 00254 g003
Figure 4. Patch-wise classification results of the MSI-H tissue, which were predicted as MSI-H for both the proposed and the conventional method. (a) The original WSI. The segmented tumor mask and the heatmap created using the proposed method and the conventional method with images at 20× magnification (bd) and 10× magnification (eg).
Applsci 11 00254 g004
Figure 5. Patch-wise classification results of the MSI-L tissue, which were predicted as MSI-L for both the proposed and the conventional method. (a) The original WSI. The segmented tumor mask and the heatmap created using the proposed method and the conventional method with images at 20× magnification (bd) and 10× magnification (eg).
Applsci 11 00254 g005
Figure 6. Patch-wise classification results of the MSI-H tissue, which were predicted as MSI-H for the proposed method but MSI-L for the conventional method. (a) The original WSI. The segmented tumor mask and the heatmap created using the proposed method and the conventional method with images at 20× magnification (bd) and 10× magnification (eg).
Applsci 11 00254 g006
Table 1. F1-score results with different optimizers and learning rate schedulers.
Scheduler Type
(Option)
Step Decay
(Initial lr = 0.0001, Decayed by 10 Every 25 Epochs)
Cosine Annealing
(Maximum lr = 0.0001, Epoch/Cycle = 20)
OptimizerRMSPropAdamRMSPropAdam
Precision0.930.960.950.96
Recall0.930.960.950.96
F1-score0.940.960.950.95
Table 2. Performance of the proposed two-stage classification method compared to the conventional method on images at 20× and 10× magnifications.
Magnification20×10×
MethodTwo-Stage
Classification
Conventional
Classification
Two-Stage
Classification
Conventional
Classification
Precision0.830.670.830.67
Recall0.830.800.710.67
F1-score0.830.730.770.67
Publisher’s Note: MDPI stays neutral with regard to jurisdictional claims in published maps and institutional affiliations.

