Pigments on Roman Wall Painting and Stucco Fragments from the Monte d’Oro Area (Rome): A Multi-Technique Approach

 ,
,  ,
,  , and
, and 
Abstract
1. Introduction
2. Materials and Methods
2.1. Materials
2.2. Methods
3. Results
3.1. Bright Red, Red, Purple Red, Light Red/Orange and Yellow
3.2. Green
3.3. Light Blue
3.4. White and Black
3.5. Golden Area on Sample 1
4. Discussion
5. Conclusions
Author Contributions
Funding
Acknowledgments
Conflicts of Interest
References
- Siddall, R. Mineral pigments in archaeology: Their analysis and the range of available materials. Minerals 2018, 8, 201. [Google Scholar] [CrossRef]
- Bonizzoni, L.; Bruni, S.; Gargano, M.; Guglielmi, V.; Zaffino, C.; Pezzotta, A.; Pilato, A.; Auricchio, T.; Delvaux, L.; Ludwig, N. Use of integrated non-invasive analyses for pigment characterisation and indirect dating of old restorations on one Egyptian coffin of the XXI dynasty. Microchem. J. 2018, 138, 122–131. [Google Scholar] [CrossRef]
- Fermo, P.; Delnevo, E. Analisi e caratterizzazione dei pigmenti dei dipinti murali dei secoli I-IV d.C. In Caelius II. Pars Inferior. Le Case Romane sotto la Basilica dei Ss. Giovanni e Paolo; Englen, A., Filetici, M.G., Palazzo, P., Pavolini, C., Santolini, R., Eds.; L’Erma di Bretschneider: Roma, Italy, 2015; pp. 466, 468, 471, 473, 479. [Google Scholar]
- Fermo, P.; Piazzalunga, A.; De Vos, M.; Andreoli, M. A multi-analytical approach for the study of the pigments used in the wall paintings from a building complex on the Caelian Hill (Rome). Appl. Phys. A Mater. 2013, 113, 1109–1119. [Google Scholar] [CrossRef]
- Aliatis, I.; Bersani, D.; Campani, E.; Casoli, A.; Lottici, P.P.; Mantovan, S.; Marino, I.G.; Ospitali, F. Green pigments of the Pompeian artists’ palette. Spectrochim. Acta A 2009, 73, 532–538. [Google Scholar] [CrossRef] [PubMed]
- Fermo, P.; Mearini, A.; Bonomi, R.; Arrighetti, E.; Comite, V. Integrated analytical approach for the characterisation of repainted wooden statues dated to the fifteenth century. Microchem. J. 2020, 157, 105072. [Google Scholar] [CrossRef]
- Ruffolo, S.A.; La Russa, M.F.; Barca, D.; Casoli, A.; Comite, V.; Nava, G.; Crisci, G.M.; De Francesco, A.M.; Miriello, D. Mineralogical, petrographic and chemical analyses for the study of the canvas “Cristo alla Colonna” from Cosenza, Italy: A case study. Period. Mineral. 2010, 79, 71–79. [Google Scholar] [CrossRef]
- La Russa, M.F.; Belfiore, C.M.; Comite, V.; Barca, D.; Bonazza, A.; Ruffolo, S.A.; Crisci, G.M.; Pezzino, A. A scientific approach to the characterisation of the painting technique of an author: The case of Raffaele Rinaldi. Appl. Phys. A 2014, 114, 733–740. [Google Scholar] [CrossRef]
- La Russa, M.F.; Ricca, M.; Cerioni, A.; Chilosi, M.G.; Comite, V.; De Santis, M.; Rovella, N.; Ruffolo, S.A. The colours of the Fontana di Trevi: An analytical approach. Int. J. Archit. Herit. 2018, 12, 114–124. [Google Scholar] [CrossRef]
- Comite, V.; Ricca, M. Diagnostic investigation for the study of the fresco “Madonna con il bambino”, from Cosenza, southern Italy: A case study. Rend. Online Soc. Geol. Ital. 2016, 38, 21–24. [Google Scholar] [CrossRef]
- Crupi, V.; Fazio, B.; Fiocco, G.; Galli, G.; La Russa, M.F.; Licchelli, M.; Majolino, D.; Malagodi, M.; Ricca, M.; Ruffolo, S.A.; et al. Multi-analytical study of Roman frescoes from Villa dei Quintili (Rome, Italy). J. Archaeol. Sci. Rep. 2018, 21, 422–432. [Google Scholar] [CrossRef]
- Miriello, D.; Bloise, A.; Crisci, G.M.; De Luca, R.; De Nigris, B.; Martellone, A.; Osanna, M.; Pace, R.; Pecci, A.; Ruggieri, N. Non-destructive multi-analytical approach to study the pigments of wall painting fragments reused in mortars from the archaeological site of pompeii (Italy). Minerals 2018, 8, 134. [Google Scholar] [CrossRef]
- Alberghina, M.F.; Macchia, A.; Capizzi, P.; Schiavone, S.; Ruffolo, S.A.; Comite, V.; Barberio, M.; La Russa, M.F. Surface and volume non-invasive methods for the structural monitoring of the bass-relief “Madonna con Bambino” (Gorizia, Northern Italy). Nat. Prod. Res. 2019, 33, 1034–1039. [Google Scholar] [CrossRef]
- Tarquini, O.; Pronti, L.; Lorenzetti, E.G.; Felici, A.C. Pigment identification on campana reliefs from the palatine hill and colosseum valley in Rome. J. Cult. Herit. 2020, 43, 294–302. [Google Scholar] [CrossRef]
- Cappelletti, G.; Ardizzone, S.; Fermo, P.; Gilardoni, S. The influence of iron content on the promotion of the zircon structure and the optical properties of pink coral pigments. J. Eur. Ceram. Soc. 2015, 25, 911–917. [Google Scholar] [CrossRef]
- Bonizzoni, L.; Bruni, S.; Galli, A.; Gargano, M.; Guglielmi, V.; Ludwig, N.; Lodi, L.; Martini, M. Non-invasive in situ analytical techniques working in synergy: The application on graduals held in the Certosa di Pavia. Microchem. J. 2016, 126, 172–180. [Google Scholar] [CrossRef]
- Bonizzoni, L.; Bruni, S.; Guglielmi, V.; Milazzo, M.; Neri, O. Field and laboratory multi-technique analysis of pigments and organic painting media from an Egyptian coffin (26th dynasty). Archaeometry 2011, 53, 1212–1230. [Google Scholar] [CrossRef]
- Mazzocchin, G.A.; Agnoli, F.; Mazzocchin, S.; Colpo, I. Analysis of pigments from Roman wall paintings found in Vicenza. Talanta 2003, 61, 565–572. [Google Scholar] [CrossRef]
- Tintori, L. Conservazione, Tecnica e Restauro Degli Affreschi; Mitteilungen des Kunsthistorischen Institutes: Florenz, Italy, 1975; pp. 149–180. [Google Scholar]
- Andersen, F.A.; Brecevic, L. Infrared spectra of amorphous and crystalline calcium carbonate. Acta Chem. Scand. 1991, 45, 1018–1024. [Google Scholar] [CrossRef]
- Bruni, S.; Guglielmi, V.; Della Foglia, E.; Castoldi, M.; Bagnasco Gianni, G. A non-destructive spectroscopic study of the decoration of archaeological pottery: From matt-painted bichrome ceramic sherds (southern Italy, VIII-VII B.C.) to an intact Etruscan cinerary urn. Spectrochim. Acta A Mol. Biomol. Spectrosc. 2018, 191, 88–97. [Google Scholar] [CrossRef]
- Gulotta, D.; Bertoldi, M.; Bortolotto, S.; Fermo, P.; Piazzalunga, A.; Toniolo, L. The Angera stone: A challenging conservation issue in the polluted environment of Milan (Italy). Environ. Earth Sci. 2013, 69, 1085–1094. [Google Scholar] [CrossRef]
- Chukanov, N.V. Infrared Spectra of Mineral Species, 3rd ed.; Springer: Berlino, Germany, 2014; pp. 14–1726. [Google Scholar]
- Saikia, B.J.; Parthasarathy, G. Fourier transform infrared spectroscopic characterizazion of kaolinite from Assam and Meghalaya, Northeastern India. J. Mod. Phys. 2010, 1, 206. [Google Scholar] [CrossRef]
- di Lernia, S.; Bruni, S.; Cislaghi, I.; Cremaschi, M.; Gallinaro, M.; Gugliemi, V.; Mercuri, A.M.; Poggi, G.; Zerboni, A. Colour in context. Pigments and other coloured residues from the Early-Middle Holocene site of Takarkori (SW Libya). Archaeol. Anthropol. Sci. 2015, 8, 381–402. [Google Scholar] [CrossRef]
- Bikiaris, D.; Daniilia, S.; Sotiropoulou, S.; Katsimbiri, O.; Pavlidou, E.; Moutsatsou, A.P.; Chryssoulakis, Y. Ochre-differentiation through micro-Raman and micro-FTIR spectroscopies: Application on wall paintings at Meteora and Mount Athos, Greece. Spectrochim. Acta A Mol. Biomol. Spectrosc. 2000, 56, 3–18. [Google Scholar] [CrossRef]
- Helwig, K. The Characterization of Iron Earth Pigments Using IR Spectroscopy, in Postprints of IRUG2; Pretzel, B., Ed.; Victoria & Albert Museum (V&A): London, UK, 1998; pp. 83–91. [Google Scholar]
- Zviagina, B.B.; Drits, V.A.; Dorzhieva, O.V. Distinguishing Features and Identification Criteria for K-Dioctahedral 1M Micas (Illite-Aluminoceladonite and Illite-Glauconite-Celadonite Series) from Middle-Infrared Spectroscopy Data. Minerals 2020, 10, 153. [Google Scholar] [CrossRef]
- Aliatis, I.; Bersani, D.; Campani, E.; Casoli, A.; Lottici, P.P.; Mantovana, S.; Marino, I.G. Pigments used in Roman wall paintingsin the Vesuvian area. J. Raman Spectrosc. 2010, 41, 1537–1542. [Google Scholar] [CrossRef]
- Burgio, L.; Clark, R.J.H. Library of FT-Raman spectra of pigments, minerals, pigment media and varnishes, and supplement to existing library of Raman spectra of pigments with visible excitation. Spectrochim. Acta A 2001, 57, 1491–1521. [Google Scholar] [CrossRef]
- Genestar, C.; Pons, C. Earth pigments in painting: Characterisation and differentiation by means of FT-IR spectroscopy and SEM-EDS microanalysis. Anal. Bioanal. Chem. 2005, 382, 269–274. [Google Scholar] [CrossRef]
- Mortimore, J.L.; Marshall, L.J.R.; Almond, M.J.; Hollins, P.; Matthews, W. Analysis of red and yellow ochre samples from Clearwell Caves and Catalhoyuk by vibrational spectroscopy and other techniques. Spectrochim. Acta A Mol. Biomol. Spectrosc. 2004, 60, 1179–1188. [Google Scholar] [CrossRef]
- Froment, F.; Tournié, A.; Colomban, P. Raman identification of natural red to yellow pigments: Ochre and iron-containing ores. J. Raman Spectrosc. 2008, 39, 560–568. [Google Scholar] [CrossRef]
- Burgio, L.; Clark, R.J.H.; Firth, S. Raman spectroscopy as a means for the identification of plattnerite (PbO2), of lead pigments and of their degradation products. R. Soc. Chem. 2001, 126, 222–227. [Google Scholar] [CrossRef]
- Smith, G.D.; Clark, R.J.H. discience. J. Archaeol. Sci. 2004, 31, 1137–1160. [Google Scholar] [CrossRef]
- Carmen Edreira, M.; José Feliu, M.; Fernández-Lorenzo, C.; Martín, J. Spectroscopic study of Egyptian blue mixed with other pigments. Helv. Chim. Acta 2003, 86, 29–49. [Google Scholar] [CrossRef]
- Aceto, M.; Agostino, A.; Fenoglio, G.; Idone, A.; Gulmini, M.; Picollo, M.; Ricciardi, P.; Delaneyf, J.K. Characterisation of colourants on illuminated manuscripts by portable fibre optic UV-visible-NIR reflectance spectrophotometry. Anal. Methods 2014, 6, 1488–1500. [Google Scholar] [CrossRef]
- Elias, M.; Chartier, C.; Prevot, G.; Garay, H.; Vignaud, C. The colour of ochres explained by their composition. Mater. Sci. Eng. B 2006, 127, 70–80. [Google Scholar] [CrossRef]
- Cheilakou, E.; Troullinos, M.; Koui, M. Identification of pigments on Byzantine wall paintings from Crete (14th century AD) using non-invasive Fiber Optics Diffuse Reflectance Spectroscopy (FORS). J. Archaeol. Sci. 2014, 41, 541–555. [Google Scholar] [CrossRef]
- Zagora, J. SEM-EDX Pigment Analysis and Multi-Analytical Study of the Ground and Paint layers of Francesco Fedrigazzi’s Painting from Kostanje. CeROArt EGG 2013. Available online: http://journals.openedition.org/ceroart/3248(3) (accessed on 30 July 2020).
- Ormanci, O. Non-destructive characterisation of Egyptian Blue cakes and wall painting fragments from the east of Lake Van, Turkey. Spectrochim. Acta A Mol. Biomol. Spectrosc. 2020, 229, 117889. [Google Scholar] [CrossRef]
- Vahur, S.; Teearu, A.; Peets, P.; Joosu, L.; Leito, I. ATR-FT-IR spectral collection of conservation materials in the extended region of 4000-80 cm−1. Anal. Bioanal. Chem. 2016, 408, 3373–3379. [Google Scholar] [CrossRef]
- Database of ATR-FT-IR Spectra of Various Materials. Available online: http://lisa.chem.ut.ee/IR_spectra/paint/pigments/egyptian-blue/ (accessed on 31 July 2020).
- Tomasini, E.P.; Halac, E.B.; Reinoso, M.; Di Liscia, E.J.; Maier, M.S. Micro-Raman spectroscopy of carbon-based black pigments. J. Raman Spectrosc. 2012, 43, 1671–1675. [Google Scholar] [CrossRef]
- Bandinelli, R.B. Roma. L’arte Romana nel Centro del Potere; BUR: Milano, Italy, 2015; p. 123. [Google Scholar]
- Maurina, B. Intonaci di età Tardorepubblicana e Augustea Provenienti Dagli Scavi di Vigna Barberini (Palatino, Roma): Una panoramica, Mélanges de l’École française de Rome—Antiquité. Available online: https://journals.openedition.org/mefra/4737 (accessed on 28 July 2020).
- Bearat, H. Quelle est la gamme exacte des pigments romains? Confrontation des résultats d’analyse avec les textes de Vitruve et de Pline. In Roman Wall Paintings. Materials, Techniques, Analysis and Conservation; Bearat, H., Fuchs, M., Maggetti, M., Paunier, D., Eds.; Institute of Mineralogy and Petrography: Fribourg, Switzerland, 1997; pp. 11–34. [Google Scholar]
- Barbet, A.; Allag, C. La pittura romana. In Dal Pittore al Restauratore; Ciurletti, G., Scagliarini, C.D., Eds.; Bononia University Press: Bologna, Italy, 2000; p. 44. [Google Scholar]
- Cortea, I.M.; Ghervase, L.; Țentea, O.; Constantina, A. Pârău & Roxana Rădvan first analytical study on second-century wall paintings from ulpia traiana sarmizegetusa: Insights on the materials and painting technique. Int. J. Archit. Herit. 2020, 14, 751–761. [Google Scholar]


| SAMPLE | Colour | Description and Provenance Area |
|---|---|---|
| 1 | bright red | 607,354 (wallpainting) |
| 2 | red | 608,046 (wallpainting) |
| 3 | bright red | 608,043 (wallpainting) |
| 4 | purple red | 608,042 (wallpainting) |
| 5 | light red/orange | (wallpainting) |
| 6 | yellow | 608,054 (wallpainting) |
| 7 | green | 608,039 (wallpainting) |
| 8 | light blue | 608,040 (wallpainting) |
| 9 | light blue | Type 15 (stucco) |
| 10 | light blue | 607,286 (stucco) |
| 11 | white | 608,048 (wallpainting) |
| 12 | black | 608,050 (wallpainting) |
| Sample | Al | Au | Ba | Ca | Cl | Cu | Fe | Hg | K | Mg | Na | P | Pb | S | Si |
|---|---|---|---|---|---|---|---|---|---|---|---|---|---|---|---|
| 1 | 2.2 | - | - | 83.1 | 0.4 | - | 2.2 | 5.1 | 1.4 | - | - | - | - | 1 | 4.5 |
| 1p | - | 95.4 | - | 4.7 | - | - | - | - | - | - | - | - | - | - | - |
| 2 | 2.1 | - | - | 72.1 | - | - | 13.7 | - | 0.7 | - | - | - | 4.7 | - | 6.8 |
| 3 | 2.2 | - | - | 54.7 | - | - | 3.9 | 27.6 | 1 | - | - | - | - | 6.03 | 4.6 |
| 4 | 1.8 | - | - | 61.6 | - | - | 28.6 | - | 0.8 | 0.1 | 0.3 | - | - | - | 6.7 |
| 5 | 11.2 | - | - | 31.6 | - | - | 22.0 | - | 6.4 | 1 | - | - | - | - | 27.8 |
| 6 | 2.5 | - | 3.3 | 78.7 | - | - | 7.3 | - | 1.0 | - | - | - | - | - | 7.2 |
| 6p | 1.1 | - | 64.2 | 13.2 | - | - | 1.2 | - | 0.4 | - | - | - | - | 17.1 | 2.8 |
| 7 | 2.4 | - | - | 75.3 | - | - | 7.2 | - | 3.1 | 0.7 | - | - | - | - | 11.4 |
| 8 | 2 | - | - | 66.5 | - | 2.3 | 5.5 | - | 1.5 | - | - | - | - | - | 22.3 |
| 9 | 4.5 | - | - | 50.8 | 0.5 | 1.8 | 10.5 | - | 3.0 | 0.4 | 0.5 | - | - | - | 27.9 |
| 10 | 4.1 | - | - | 66.8 | - | 1.5 | 0.8 | - | 0.7 | 0.1 | 0.2 | - | - | 0.2 | 25.5 |
| 11 | 2.9 | - | - | 80.4 | 1.2 | - | 4.7 | - | 2 | 0.2 | - | - | - | - | 8.7 |
| 12 | 1.1 | - | - | 94.4 | - | - | - | - | 0.9 | - | - | - | - | - | 3.6 |
| Sample | Colour | SEM-EDS Analysis (Elements) | FTIR Peaks (cm−1) | Raman Peaks (cm−1) |
|---|---|---|---|---|
| 1 | bright red | Ca, Hg, Si, Fe, Al, K, S, Cl, Au | 1403, 1032, 1007, 871, 712, 532, 472 | 253, 284, 343, 1086 |
| 2 | red | Ca, Fe, Si, Pb, Al, K | 1409, 1032, 1009, 913, 872, 712, 533, 468 | 147, 223, 253, 291, 406, 494, 605, 1086 |
| 3 | bright red | Ca, Hg, S, Si, Fe, Al, K | 1404, 1024, 872, 712, 670, 467 | 253, 284, 343, 1086 |
| 4 | purple red | Ca, Fe, Si, Al, K, Na, Mg | 1409, 1090, 872, 794, 712, 540, 472 | 223, 288, 404, 490, 604 |
| 5 | light red/orange | Ca, Si, Fe, Al, K, Mg | 1421, 1032, 1007, 913, 873, 797, 779, 712, 693, 526, 466 | 143, 284, 405, 463, 710, 1086 |
| 6 | yellow | Ca, Fe, Si, Ba, Al, K, S | 1406, 1032, 1009, 913, 873, 797, 712, 532, 468 | 284, 391, 712, 1086 |
| 7 | green | Ca, Si, Fe, K, Al, Mg | 1414, 970, 873, 798, 712, 679, 490, 452 | - |
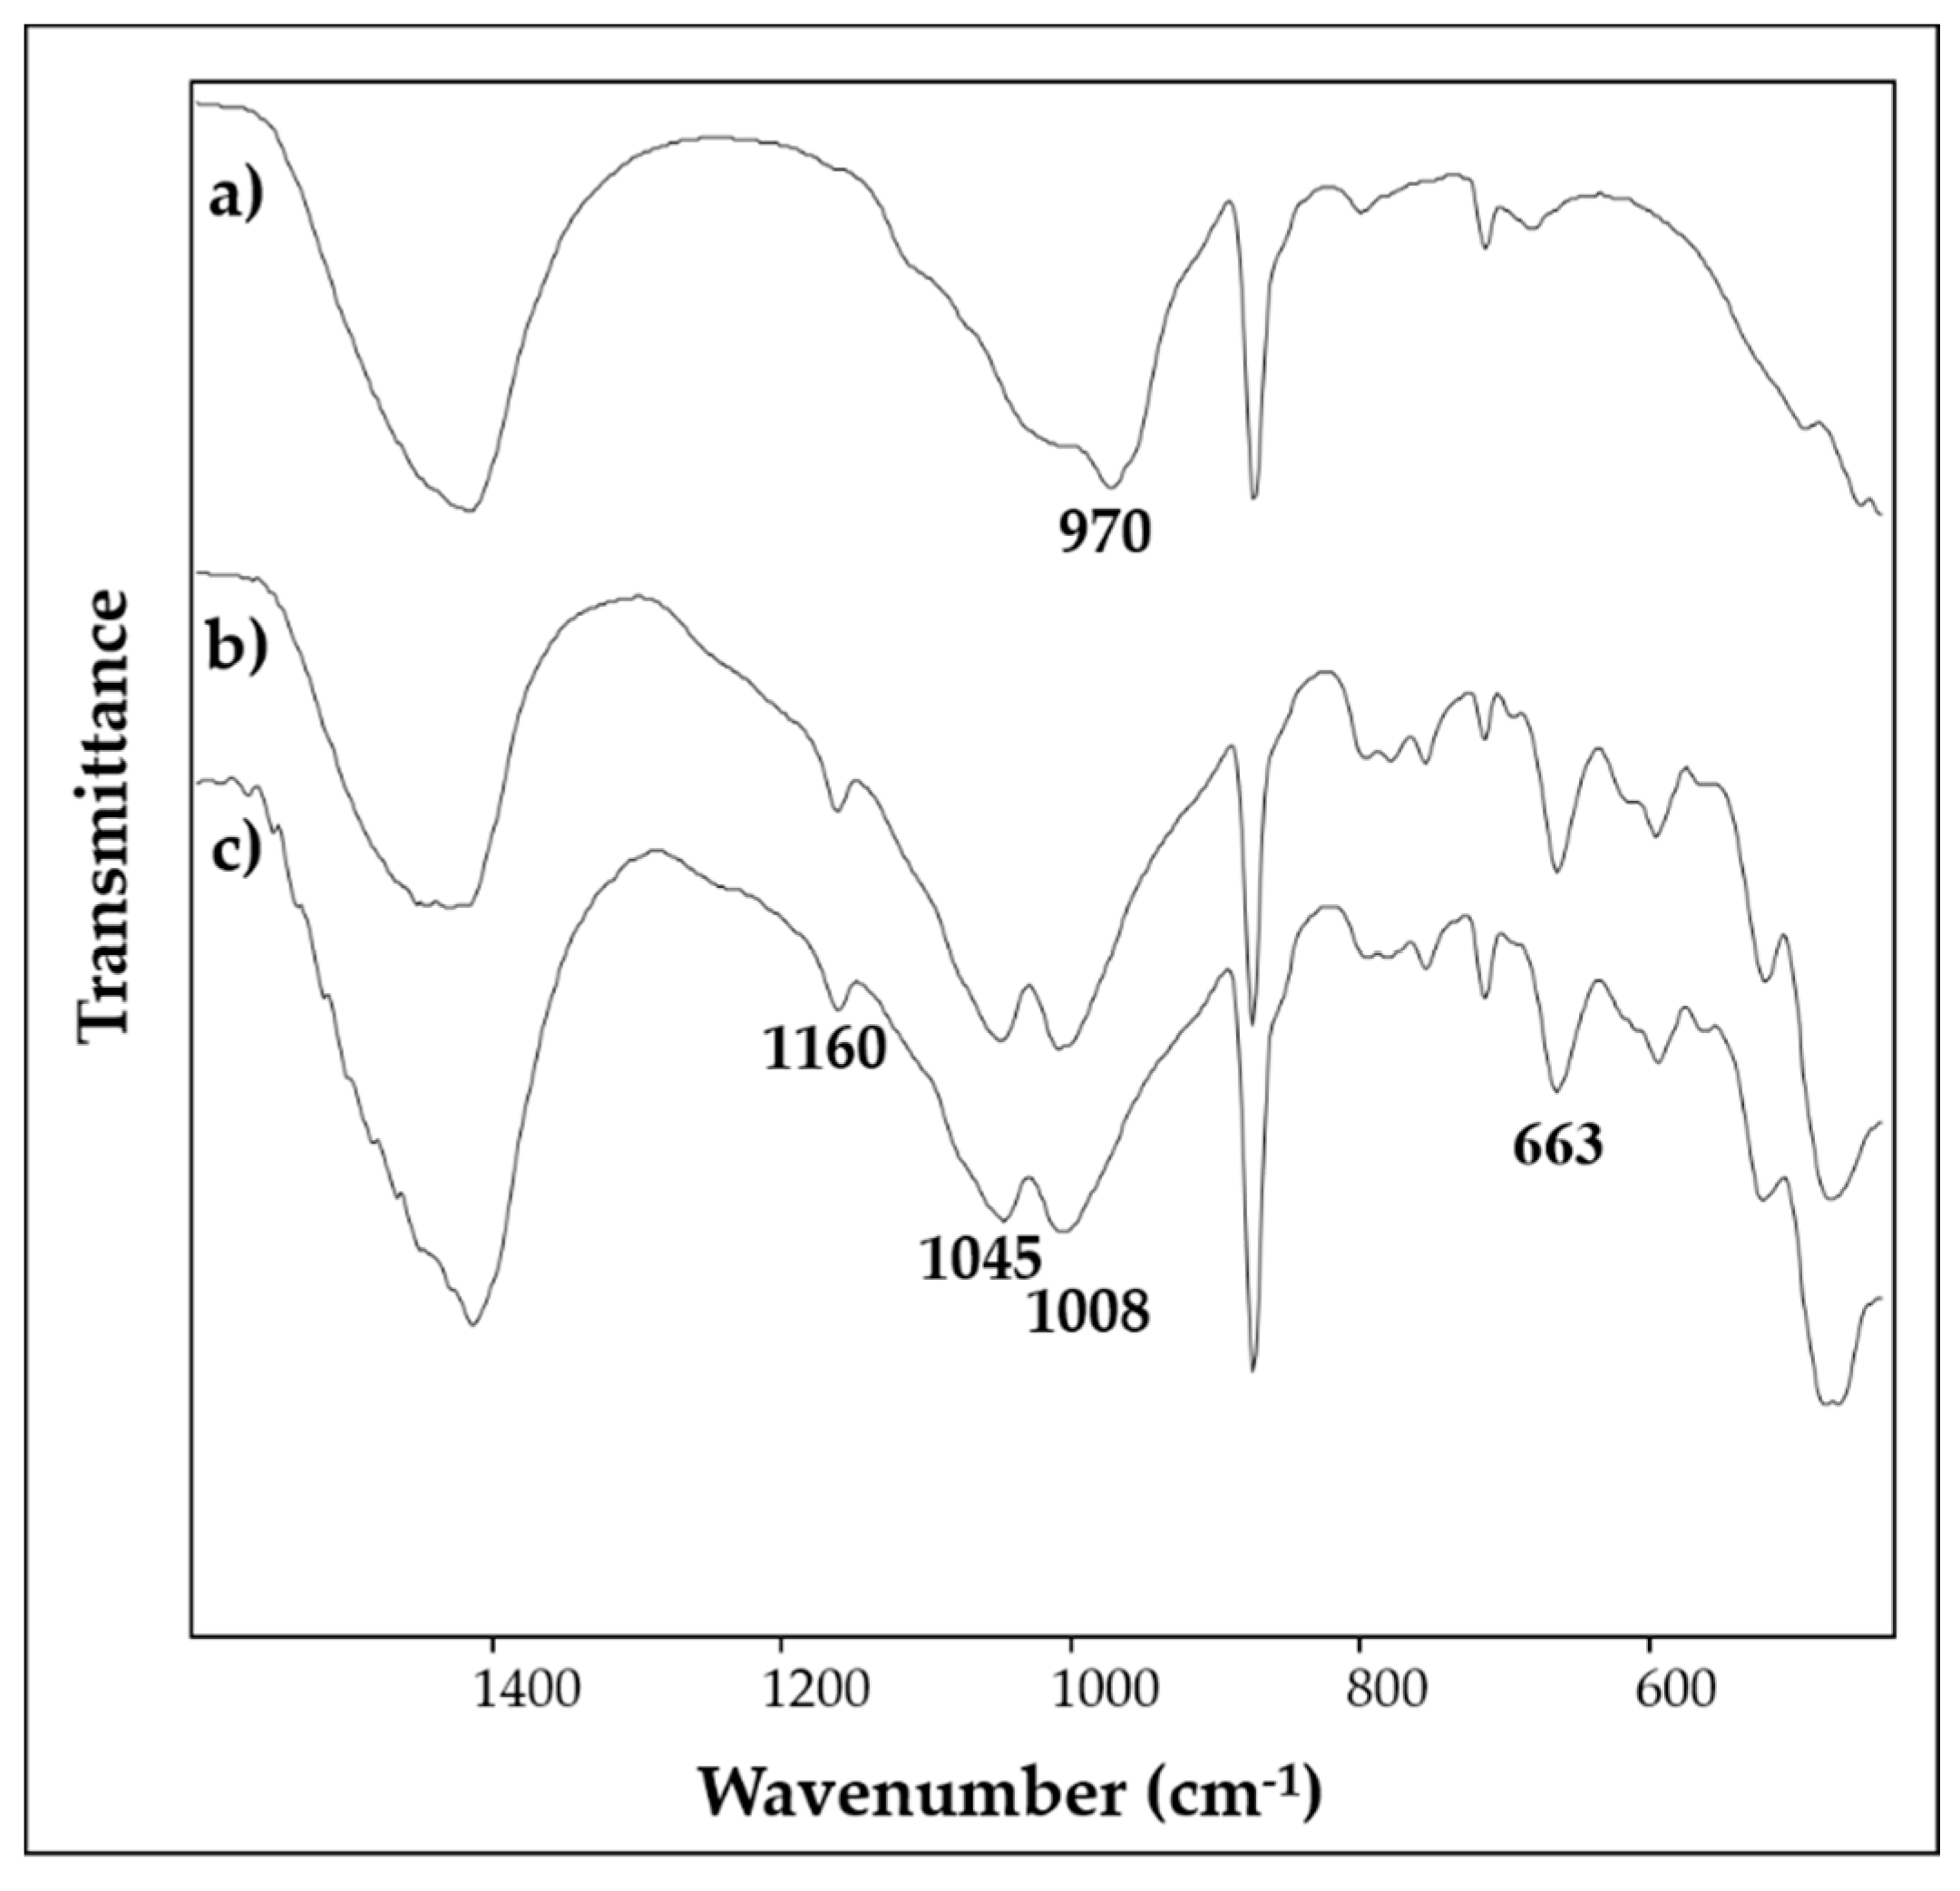
| 8 | light blue | Ca, Si, Fe, Cu, Al, K | 1430, 1160, 1048, 1008, 874, 795, 778, 754, 712, 663, 593, 519, 472 | - |
| 9 | light blue | Ca, Si, Fe, Al, K, Cu, Cl, Mg, Na | 1412, 1160, 1045, 1008, 874, 793, 754, 712, 663, 593, 519, 467 | - |
| 10 | light blue | Ca, Si, Al, Cu, Fe, K, Na, S, Mg | - | - |
| 11 | white | Ca, Si, Fe, Al, K, Cl, Mg | 1403,1033, 872, 712 | 285, 391, 712, 1086 |
| 12 | black | Ca, Si, Al, K | 1403, 1033, 872, 712 | 1300, 1580 |
| Sample | SEM-EDS | ATR-FTIR | Raman | Pigments |
|---|---|---|---|---|
| 1 | Hg + S + Fe + Au | red ochre | cinnabar | cinnabar + gold leaf + red ochre |
| 2 | Fe + Pb | red ochre | red ochre + litharge + cinnabar | red ochre + litharge + cinnabar |
| 3 | Hg + S + Fe | red ochre | cinnabar | cinnabar + red ochre |
| 4 | Fe | haematite | haematite | haematite |
| 5 | Fe | red + yellow ochre | red ochre + massicot | red ochre + massicot + yellow ochre |
| 6 | Fe | yellow ochre | yellow ochre | yellow ochre |
| 7 | Fe | celadonite | - | green earth |
| 8 | Cu | Egyptian blue | - | Egyptian blue |
| 9 | Cu | Egyptian blue | - | Egyptian blue |
| 10 | Cu | - | - | Egyptian blue |
| 11 | Ca | calcite | calcite + yellow ochre | calcite + yellow ochre |
| 12 | - | - | amorphous carbon | carbon black |
© 2020 by the authors. Licensee MDPI, Basel, Switzerland. This article is an open access article distributed under the terms and conditions of the Creative Commons Attribution (CC BY) license (http://creativecommons.org/licenses/by/4.0/).
Share and Cite
Guglielmi, V.; Comite, V.; Andreoli, M.; Demartin, F.; Lombardi, C.A.; Fermo, P. Pigments on Roman Wall Painting and Stucco Fragments from the Monte d’Oro Area (Rome): A Multi-Technique Approach. Appl. Sci. 2020, 10, 7121. https://doi.org/10.3390/app10207121
Guglielmi V, Comite V, Andreoli M, Demartin F, Lombardi CA, Fermo P. Pigments on Roman Wall Painting and Stucco Fragments from the Monte d’Oro Area (Rome): A Multi-Technique Approach. Applied Sciences. 2020; 10(20):7121. https://doi.org/10.3390/app10207121
Chicago/Turabian StyleGuglielmi, Vittoria, Valeria Comite, Martina Andreoli, Francesco Demartin, Chiara Andrea Lombardi, and Paola Fermo. 2020. "Pigments on Roman Wall Painting and Stucco Fragments from the Monte d’Oro Area (Rome): A Multi-Technique Approach" Applied Sciences 10, no. 20: 7121. https://doi.org/10.3390/app10207121
APA StyleGuglielmi, V., Comite, V., Andreoli, M., Demartin, F., Lombardi, C. A., & Fermo, P. (2020). Pigments on Roman Wall Painting and Stucco Fragments from the Monte d’Oro Area (Rome): A Multi-Technique Approach. Applied Sciences, 10(20), 7121. https://doi.org/10.3390/app10207121