Response of the Arthropod Community to Soil Characteristics and Management in the Franciacorta Viticultural Area (Lombardy, Italy)


 , ,
, ,
Abstract
1. Introduction
2. Materials and Methods
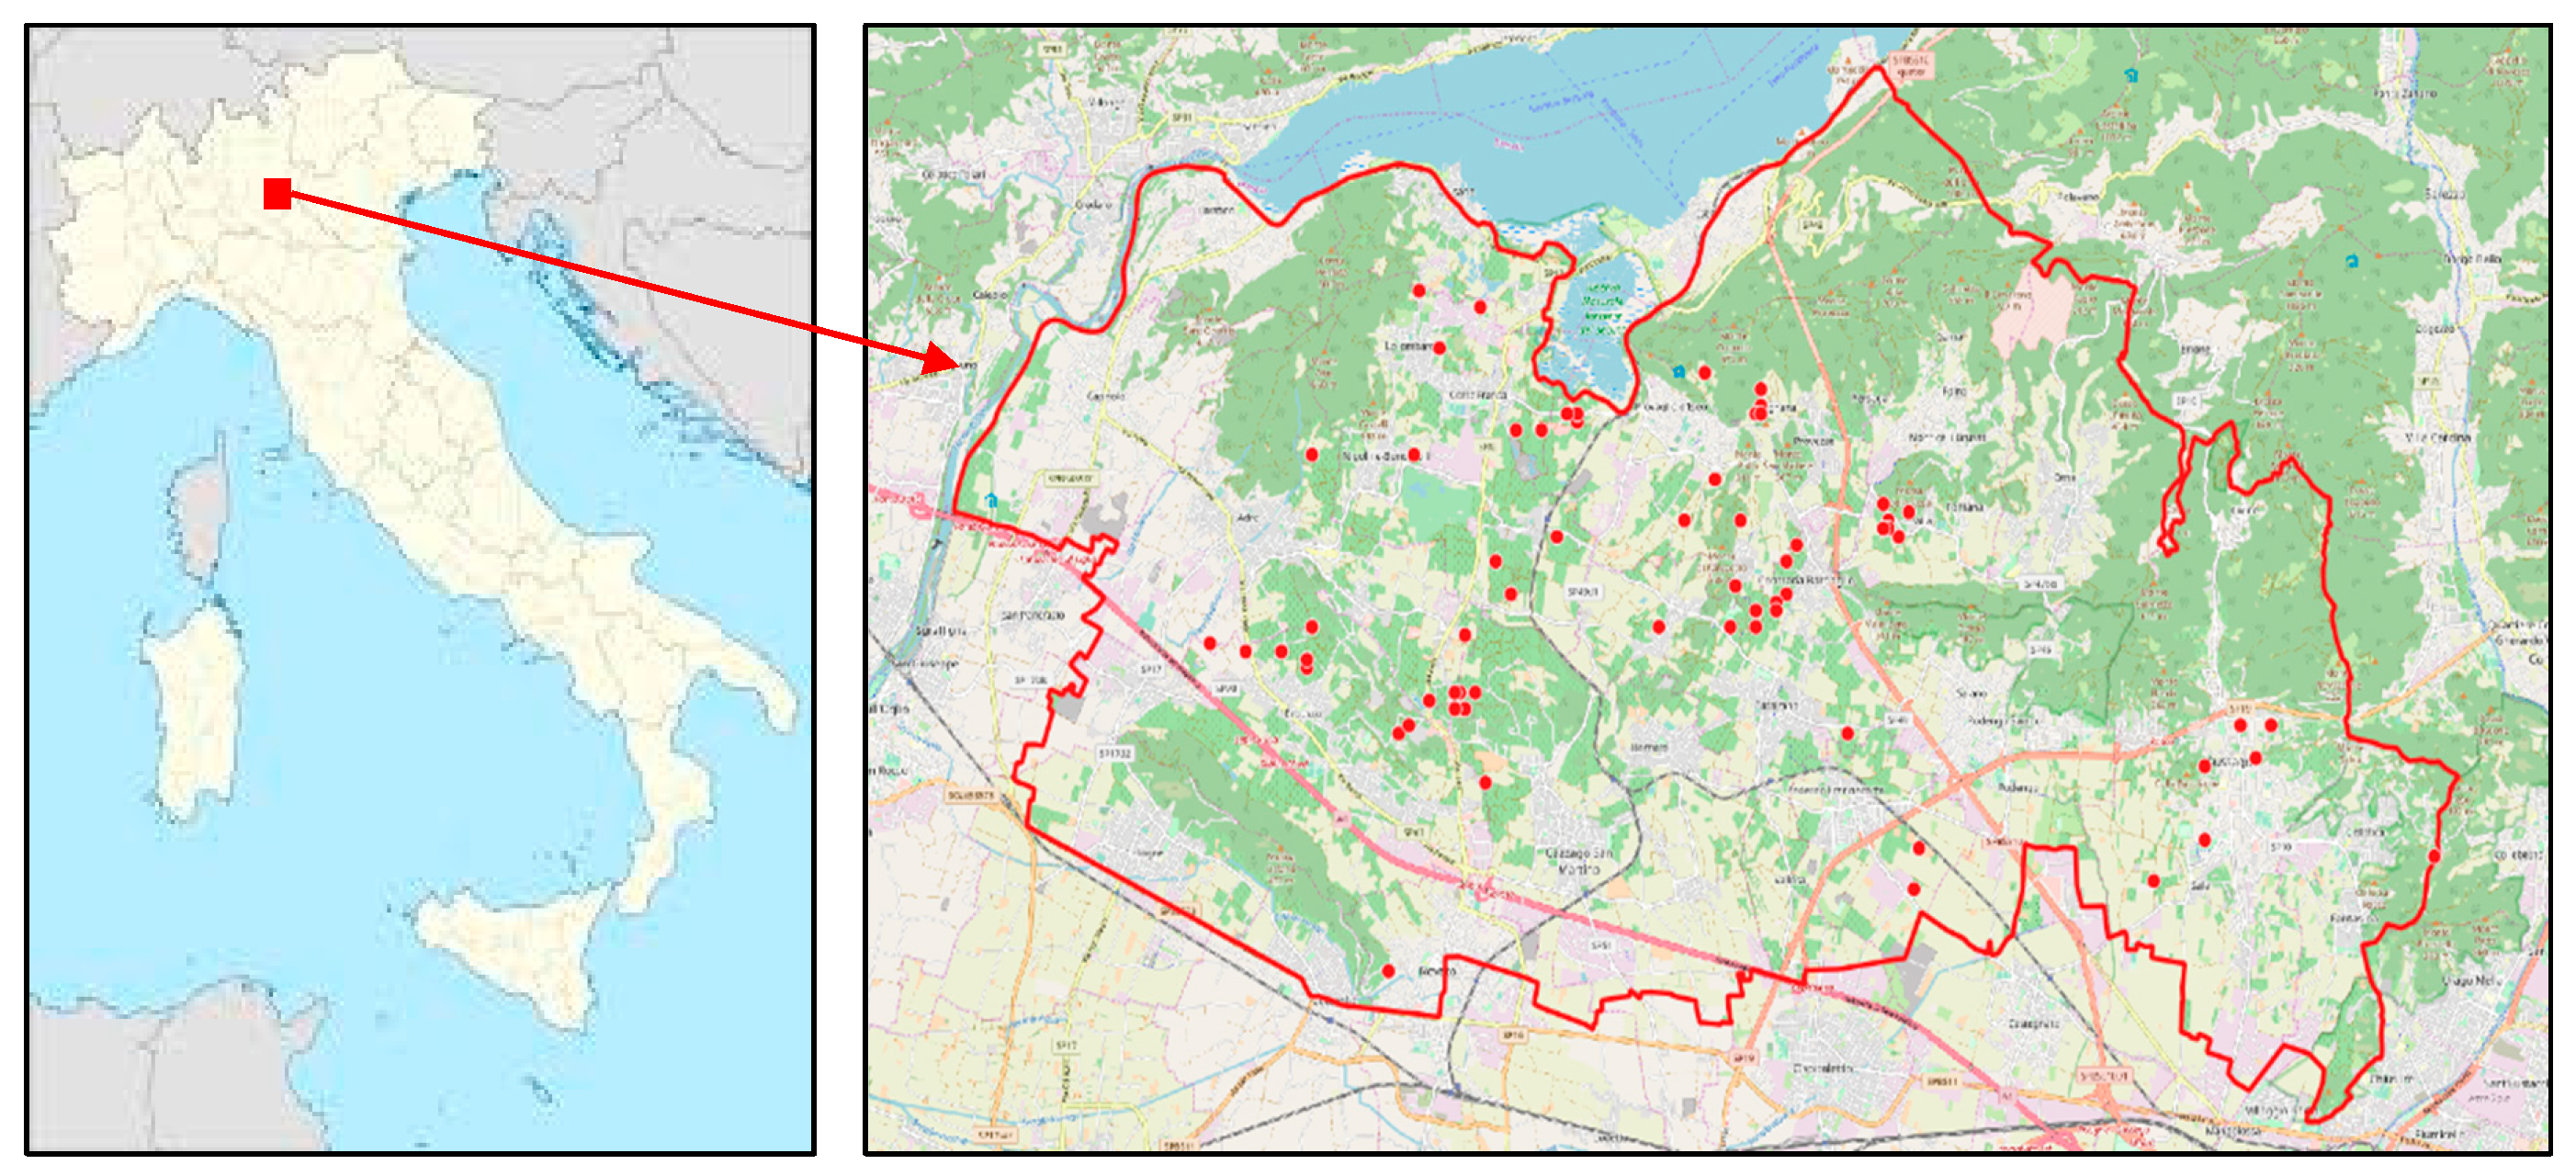
2.1. Study Sites
2.2. Environmental Variables
2.3. Chemical Characterisation of Soils
2.4. Soil Arthropods Identification
2.5. Data Analysis
2.5.1. Taxa Co-Occurrence Patterns
2.5.2. Vineyard Management Impact
3. Results
3.1. Descriptive Analysis
3.1.1. Environmental and Vineyard Management Variables
3.1.2. Taxa Identification
3.2. Co-Occurrence Pattern Identification
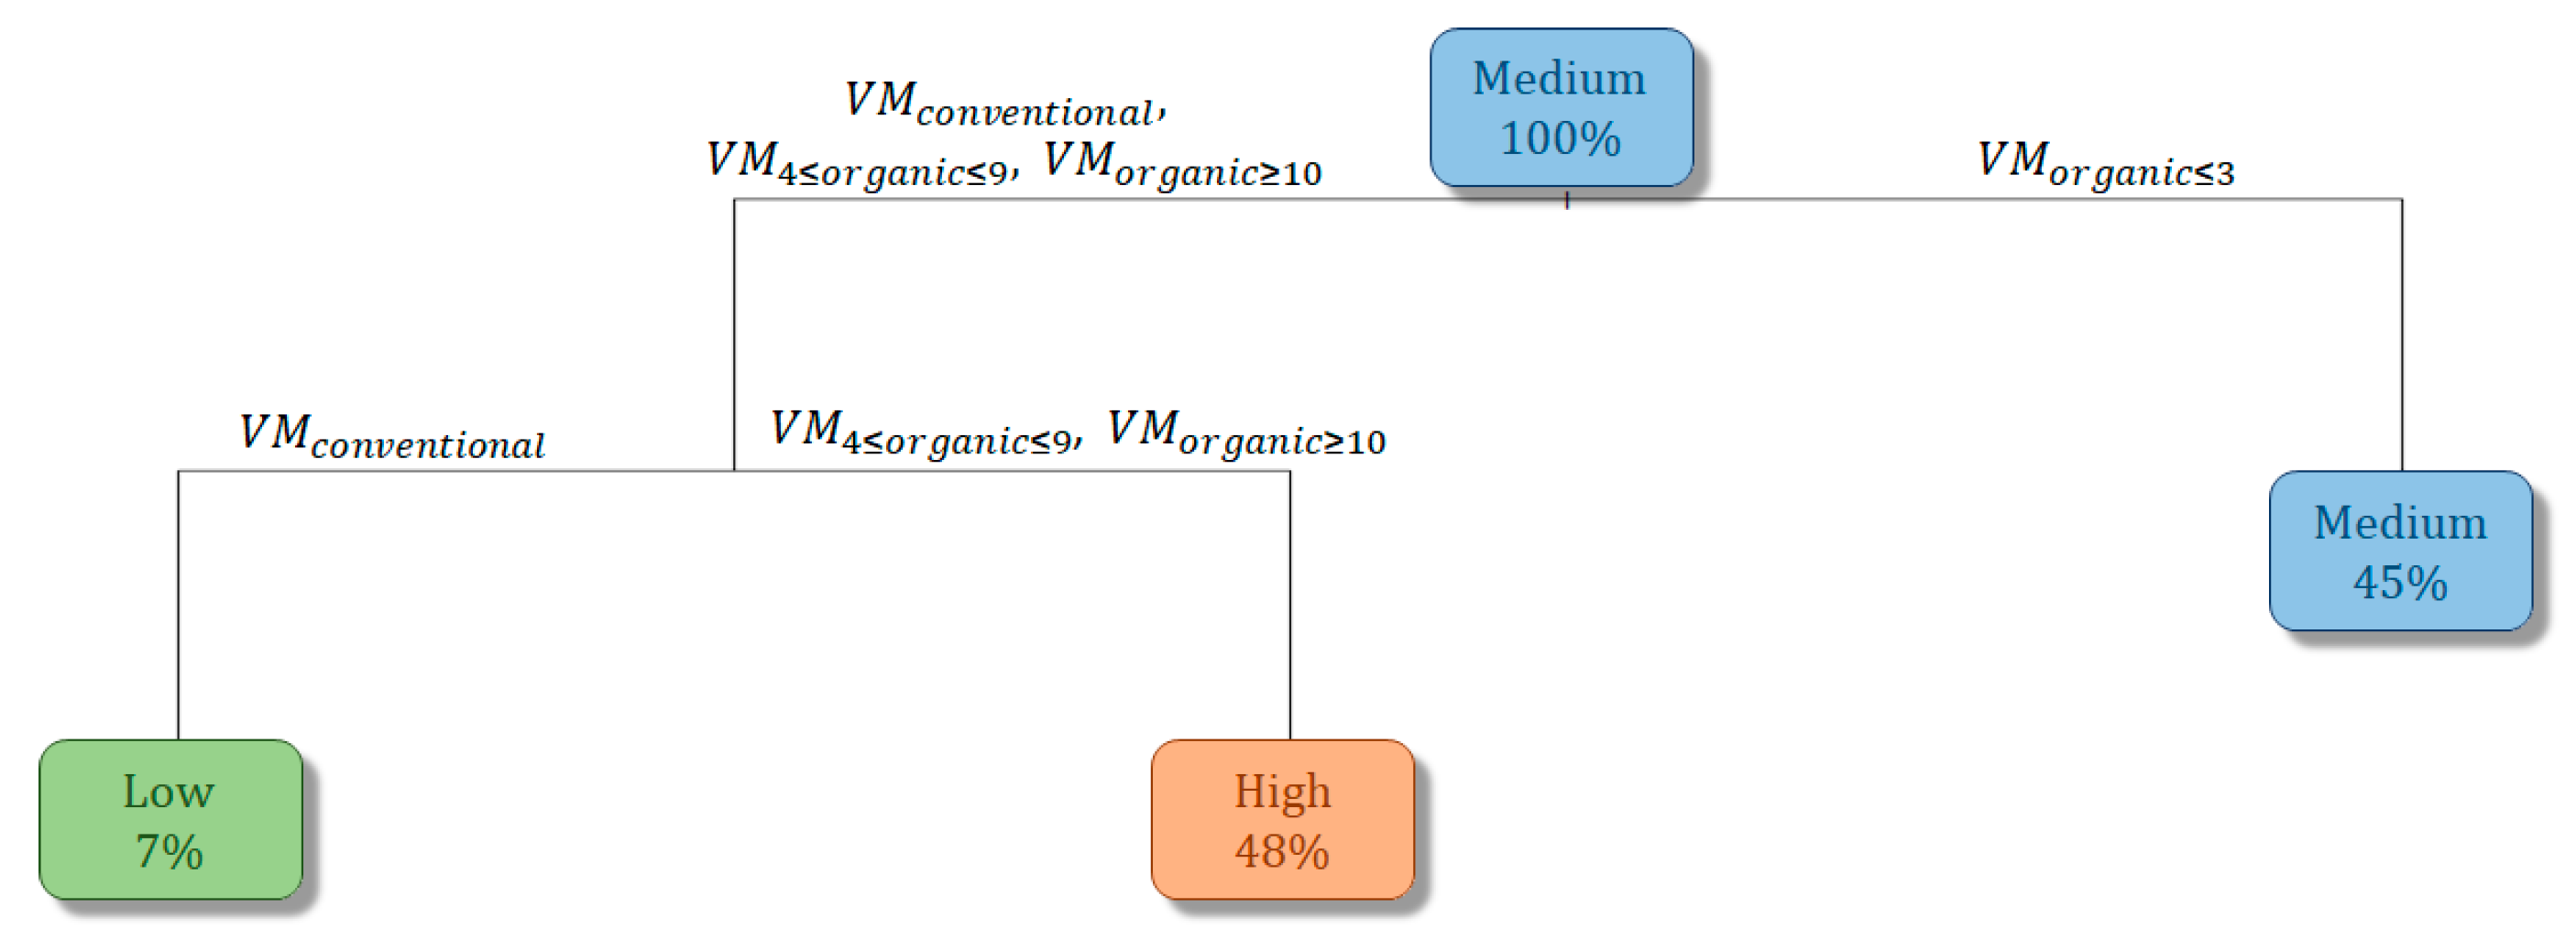
3.3. Vineyard Management
4. Discussion and Conclusions
Author Contributions
Funding
Acknowledgments
Conflicts of Interest
Appendix A

| ID Field | Date | ST | SM | ID Field | Date | ST | SM |
|---|---|---|---|---|---|---|---|
| 1 | 14 May | 20.20 | 0.087 | 51 | 15 June | 24.90 | 0.299 |
| 2 | 14 May | 20.21 | 0.090 | 52 | 15 June | 24.61 | 0.221 |
| 3 | 14 May | 19.65 | 0.085 | 53 | 15 June | 24.85 | 0.227 |
| 4 | 14 May | 19.72 | 0.091 | 54 | 15 June | 24.54 | 0.244 |
| 5 | 14 May | 20.27 | 0.106 | 55 | 15 June | 26.14 | 0.225 |
| 6 | 14 May | 20.31 | 0.082 | 56 | 15 June | 25.21 | 0.226 |
| 7 | 14 May | 20.28 | 0.082 | 57 | 15 June | 25.21 | 0.225 |
| 8 | 14 May | 20.19 | 0.088 | 58 | 15 June | 25.97 | 0.223 |
| 9 | 14 May | 20.18 | 0.086 | 59 | 15 June | 25.97 | 0.222 |
| 10 | 14 May | 20.28 | 0.087 | 60 | 16 June | 21.71 | 0.340 |
| 11 | 14 May | 20.29 | 0.084 | 61 | 16 June | 21.71 | 0.341 |
| 12 | 14 May | 20.70 | 0.100 | 62 | 16 June | 21.71 | 0.340 |
| 13 | 14 May | 20.71 | 0.103 | 63 | 16 June | 21.71 | 0.339 |
| 14 | 14 May | 20.52 | 0.101 | 64 | 16 June | 25.75 | 0.370 |
| 15 | 14 May | 20.52 | 0.102 | 65 | 16 June | 25.76 | 0.370 |
| 16 | 14 May | 19.26 | 0.128 | 66 | 16 June | 20.29 | 0.344 |
| 17 | 14 May | 19.26 | 0.127 | 67 | 16 June | 26.05 | 0.369 |
| 18 | 14 May | 19.22 | 0.145 | 68 | 16 June | 25.75 | 0.370 |
| 19 | 14 May | 19.53 | 0.121 | 69 | 16 June | 26.05 | 0.369 |
| 20 | 14 May | 19.44 | 0.120 | 70 | 16 June | 26.05 | 0.369 |
| 21 | 14 May | 19.58 | 0.122 | 71 | 16 June | 25.75 | 0.370 |
| 22 | 14 May | 20.52 | 0.100 | 72 | 16 June | 26.02 | 0.369 |
| 23 | 14 May | 20.52 | 0.100 | 73 | 16 June | 20.29 | 0.344 |
| 24 | 14 May | 20.52 | 0.099 | 74 | 16 June | 26.05 | 0.369 |
| 25 | 14 May | 19.63 | 0.087 | 75 | 16 June | 26.56 | 0.370 |
| 26 | 14 May | 20.17 | 0.087 | 76 | 16 June | 20.29 | 0.344 |
| 27 | 14 May | 20.17 | 0.088 | 77 | 16 June | 26.04 | 0.369 |
| 28 | 14 September | 23.47 | 0.190 | 78 | 16 June | 21.54 | 0.337 |
| 29 | 14 September | 23.58 | 0.325 | 79 | 16 June | 25.14 | 0.371 |
| 30 | 14 September | 24.56 | 0.188 | 80 | 16 June | 21.38 | 0.326 |
| 31 | 14 September | 24.56 | 0.185 | 81 | 16 June | 18.98 | 0.352 |
| 32 | 15 May | 18.70 | 0.353 | 82 | 16 June | 18.98 | 0.350 |
| 33 | 15 May | 19.97 | 0.336 | 83 | 16 June | 18.98 | 0.352 |
| 34 | 15 June | 22.98 | 0.361 | 84 | 16 June | 18.98 | 0.354 |
| 35 | 15 June | 22.98 | 0.345 | 85 | 16 June | 18.98 | 0.352 |
| 36 | 15 June | 22.92 | 0.361 | 86 | 16 June | 18.98 | 0.351 |
| 37 | 15 June | 24.74 | 0.230 | 87 | 17 September | 27.97 | 0.349 |
| 38 | 15 June | 24.74 | 0.228 | 88 | 17 September | 27.84 | 0.349 |
| 39 | 15 June | 25.02 | 0.300 | 89 | 17 September | 22.95 | 0.353 |
| 40 | 15 June | 23.89 | 0.275 | 90 | 17 September | 21.67 | 0.164 |
| 41 | 15 June | 24.74 | 0.176 | 91 | 17 September | 21.67 | 0.162 |
| 42 | 15 June | 24.70 | 0.178 | 92 | 17 September | 21.67 | 0.159 |
| 43 | 15 June | 24.70 | 0.177 | 93 | 17 September | 25.84 | 0.339 |
| 44 | 15 June | 24.75 | 0.165 | 94 | 17 September | 25.84 | 0.340 |
| 45 | 15 June | 25.08 | 0.299 | 95 | 17 September | 21.67 | 0.162 |
| 46 | 15 June | 24.90 | 0.302 | 96 | 17 September | 25.84 | 0.340 |
| 47 | 15 June | 24.14 | 0.336 | 97 | 17 September | 25.84 | 0.340 |
| 48 | 15 June | 24.13 | 0.338 | 98 | 18 June | 24.37 | 0.323 |
| 49 | 15 June | 24.14 | 0.344 | 99 | 18 June | 24.37 | 0.322 |
| 50 | 15 June | 24.11 | 0.334 | 100 | 18 June | 24.37 | 0.323 |
References
- Kopittke, P.M.; Menzies, N.W.; Wang, P.; McKenna, B.A.; Lombi, E. Soil and the intensification of agriculture for global food security. Environ. Int. 2019, 132, 105078. [Google Scholar] [CrossRef] [PubMed]
- Wolters, V. Biodiversity of soil fauna and its function. Eur. J. Soil Biol. 2001, 37, 221–227. [Google Scholar] [CrossRef]
- Decaëns, T.; Jiménez, J.J.; Gioia, C.; Measey, G.J.; Lavelle, P. The values of soil animals for conservation biology. Eur. J. Soil Biol. 2006, 42, S23–S38. [Google Scholar] [CrossRef]
- European Commission. The Factory of Life. Why Soil Biodiversity Is so Important; Office for Official Publications of the European Union: Luxembourg, 2010; p. 22.
- Geisen, S.; Briones, M.J.I.; Gan, H.; Behan-Pelletier, V.M.; Friman, V.-P.; de Groot, G.A.; Hannula, S.E.; Lindo, Z.; Philippot, L.; Tiunov, A.V.; et al. A methodological framework to embrace soil biodiversity. Soil Biol. Biochem. 2019, 136, 107536. [Google Scholar] [CrossRef]
- Cameron, E.K.; Martins, I.S.; Lavelle, P.; Mathieu, J.; Tedersoo, L.; Gottschall, F.; Guerra, C.A.; Hines, J.; Patoine, G.; Siebert, J.; et al. Global gaps in soil biodiversity data. Nat. Ecol. Evol. 2018, 2, 1042–1043. [Google Scholar] [CrossRef]
- Juan-Ovejero, R.; Benito, E.; Barreal, M.E.; Rodeiro, J.; Briones, M.J.I. Tolerance to fluctuating water regimes drives changes in mesofauna community structure and vertical stratification in peatlands. Pedobiologia 2019, 76, 150571. [Google Scholar] [CrossRef]
- Wallwork, J.A. Distribution Patterns and Population Dynamics of the Micro-Arthropods of a Desert Soil in Southern California. J. Anim. Ecol. 1972, 41, 291–310. [Google Scholar] [CrossRef]
- Ruf, A.; Beck, L.; Dreher, P.; Hund-Rinke, K.; Römbke, J.; Spelda, J. A biological classification concept for the assessment of soil quality: “biological soil classification scheme” (BBSK). Agric. Ecosyst. Environ. 2003, 98, 263–271. [Google Scholar] [CrossRef]
- Marasas, M.E.; Sarandón, S.J.; Cicchino, A.C. Changes in soil arthropod functional group in a wheat crop under conventional and no tillage systems in Argentina. Appl. Soil Ecol. 2001, 18, 61–68. [Google Scholar] [CrossRef]
- van Straalen, N.M. Evaluation of bioindicator systems derived from soil arthropod communities. Appl. Soil Ecol. 1998, 9, 429–437. [Google Scholar] [CrossRef]
- Büchs, W.; Harenberg, A.; Zimmermann, J.; Weiß, B. Biodiversity, the ultimate agri-environmental indicator?: Potential and limits for the application of faunistic elements as gradual indicators in agroecosystems. Agric. Ecosyst. Environ. 2003, 98, 99–123. [Google Scholar] [CrossRef]
- Migliorini, M.; Pigino, G.; Bianchi, N.; Bernini, F.; Leonzio, C. The effects of heavy metal contamination on the soil arthropod community of a shooting range. Environ. Pollut. 2004, 129, 331–340. [Google Scholar] [CrossRef] [PubMed]
- Xu, G.-L.; Kuster, T.M.; Günthardt-Goerg, M.S.; Dobbertin, M.; Li, M.-H. Seasonal exposure to drought and air warming affects soil Collembola and mites. PLoS ONE 2012, 7, 1–9. [Google Scholar] [CrossRef] [PubMed]
- Ghiglieno, I.; Simonetto, A.; Donna, P.; Tonni, M.; Valenti, L.; Bedussi, F.; Gilioli, G. Soil Biological Quality Assessment to Improve Decision Support in the Wine Sector. Agronomy 2019, 9, 593. [Google Scholar] [CrossRef]
- Frampton, G.; Van den Brink, P.; Gould, P. Effect of spring drought and irrigation on farmland arthropods in southern Britain. J. Appl. Ecol. 2001, 37, 865–883. [Google Scholar] [CrossRef]
- Uvarov, A.V. Effects of diurnal temperature fluctuations on population responses of forest floor mites. Pedobiologia 2003, 47, 331–339. [Google Scholar] [CrossRef]
- Jucevica, E.; Melecis, V. Global warming affect Collembola community: A long-term study. Pedobiologia 2006, 50, 177–184. [Google Scholar] [CrossRef]
- Clapperton, M.J.; Kanashiro, D.A.; Behan-Pelletier, V.M. Changes in abundance and diversity of microarthropods associated with Fescue Prairie grazing regimes. Pedobiologia 2002, 46, 496–511. [Google Scholar] [CrossRef]
- Holmstrup, M.; Maraldo, K.; Krogh, P.H. Combined effect of copper and prolonged summer drought on soil Microarthropods in the field. Environ. Pollut. 2007, 146, 525–533. [Google Scholar] [CrossRef]
- Tsiafouli, M.A.; Kallimanis, A.S.; Katana, E.; Stamou, G.P.; Sgardelis, S.P. Responses of soil microarthropods to experimental short-term manipulations of soil moisture. Appl. Soil Ecol. 2005, 29, 17–26. [Google Scholar] [CrossRef]
- Reddy, M.V.; Venkataiah, B. Seasonal abundance of soil-surface arthropods in relation to some meteorological and edaphic variables of the grassland and tree-planted areas in a tropical semi-arid savanna. Int. J. Biometeorol. 1990, 34, 49–59. [Google Scholar] [CrossRef]
- Grear, J.S.; Schmitz, O.J. Effects of Grouping Behavior and Predators on the Spatial Distribution of a Forest Floor Arthropod. Ecology 2005, 86, 960–971. [Google Scholar] [CrossRef]
- Choi, W.I.; Ryoo, M.I.; Kim, J.-G. Biology of Paronychiurus kimi(Collembola: Onychiuridae) under the influence of temperature, humidity and nutrition. Pedobiologia 2002, 46, 548–557. [Google Scholar] [CrossRef]
- Choi, W.I.; Moorhead, D.L.; Neher, D.A.; Ryoo, M.I. A modeling study of soil temperature and moisture effects on population dynamics of Paronychiurus kimi (Collembola: Onychiuridae). Biol. Fertil. Soils 2006, 43, 69–75. [Google Scholar] [CrossRef]
- O’Lear, H.A.; Blair, J.M. Responses of soil microarthropods to changes in soil water availability in tallgrass prairie. Biol. Fertil. Soils 1999, 29, 207–217. [Google Scholar] [CrossRef]
- Liu, J.-L.; Li, F.-R.; Liu, L.-L.; Yang, K. Responses of different Collembola and mite taxa to experimental rain pulses in an arid ecosystem. Catena 2017, 155, 53–61. [Google Scholar] [CrossRef]
- Ikemoto, T. Intrinsic Optimum Temperature for Development of Insects and Mites. Environ. Entomol. 2005, 34, 1377–1387. [Google Scholar] [CrossRef]
- Ikemoto, T. Possible existence of a common temperature and a common duration of development among members of a taxonomic group of arthropods that underwent speciational adaptation to temperature. Appl. Entomol. Zool. 2003, 38, 487–492. [Google Scholar] [CrossRef]
- Rapoport, E.H.; Tschapek, M. Soil water and soil fauna. Rev. Ecol. Biol. Sol. 1967, 4, 1–58. [Google Scholar]
- Eisenbeis, G.; Wichard, W. Atlas on the Biology of Soil Arthropods; Springer: Berlin/Heidelberg, Germany, 1987. [Google Scholar]
- Petersen, H.; Luxton, M. A Comparative Analysis of Soil Fauna Populations and Their Role in Decomposition Processes. Oikos 1982, 39, 288–388. [Google Scholar] [CrossRef]
- Wu, P.; Liu, X.; Liu, S.; Wang, J.; Wang, Y. Composition and spatio-temporal variation of soil microarthropods in the biodiversity hotspot of northern Hengduan Mountains, China. Eur. J. Soil Biol. 2014, 62, 30–38. [Google Scholar] [CrossRef]
- Culliney, T. Role of arthropods in maintaining soil fertility. Agriculture 2013, 3, 629–659. [Google Scholar] [CrossRef]
- Bagyaraj, D.J.; Nethravathi, C.J.; Nitin, K.S. Soil Biodiversity and Arthropods: Role in Soil Fertility. In Economic and Ecological Significance of Arthropods in Diversified Ecosystems; Chakravarthy, A.K., Sridhara, S., Eds.; Springer: Singapore, 2016; pp. 17–51. [Google Scholar]
- André, H.M.; Noti, M.-I.; Lebrun, P. The soil fauna: The other last biotic frontier. Biodivers. Conserv. 1994, 3, 45–56. [Google Scholar] [CrossRef]
- van Straalen, N.M.; Verhoef, H.A. The Development of a Bioindicator System for Soil Acidity Based on Arthropod pH Preferences. J. Appl. Ecol. 1997, 34, 217–232. [Google Scholar] [CrossRef]
- Lavelle, P.; Chauvel, A.; Fragoso, C. Faunal activity in acid soils. In Plant-Soil Interactions at Low pH: Principles and Management. Developments in Plant and Soil Sciences; Date, R.A., Grundon, N.J., Rayment, G.E., Probert, M.E., Eds.; Springer: Dordrecht, The Netherlands, 1995; Volume 64, pp. 201–211. [Google Scholar]
- Andrés, P.; Moore, J.C.; Simpson, R.T.; Selby, G.; Cotrufo, F.; Denef, K.; Haddix, M.L.; Shaw, E.A.; de Tomasel, C.M.; Molowny-Horas, R.; et al. Soil food web stability in response to grazing in a semi-arid prairie: The importance of soil textural heterogeneity. Soil Biol. Biochem. 2016, 97, 131–143. [Google Scholar] [CrossRef]
- Potapov, A.; Goncharov, A.; Semenina, E.; Korotkevich, A.; Tsurikov, S.; Rozanova, O.; Anichkin, A.; Zuev, A.; Samoylova, E.; Semenyuk, I.; et al. Arthropods in the subsoil: Abundance and vertical distribution as related to soil organic matter, microbial biomass and plant roots. Eur. J. Soil Biol. 2017, 82, 88–97. [Google Scholar] [CrossRef]
- Shakir, M.M.; Ahmed, S. Seasonal abundance of soil arthropods in relation to meteorological and edaphic factors in the agroecosystems of Faisalabad, Punjab, Pakistan. Int. J. Biometeorol. 2015, 59, 605–616. [Google Scholar] [CrossRef]
- Sapkota, T.B.; Mazzoncini, M.; Bàrberi, P.; Antichi, D.; Silvestri, N. Fifteen years of no till increase soil organic matter, microbial biomass and arthropod diversity in cover crop-based arable cropping systems. Agron. Sustain. Dev. 2012, 32, 853–863. [Google Scholar] [CrossRef]
- Bedano, J.C.; Cantú, M.P.; Doucet, M.E. Soil springtails (Hexapoda: Collembola), symphylans and pauropods (Arthropoda: Myriapoda) under different management systems in agroecosystems of the subhumid Pampa (Argentina). Eur. J. Soil Biol. 2006, 42, 107–119. [Google Scholar] [CrossRef]
- Chauvat, M.; Wolters, V.; Dauber, J. Response of collembolan communities to land-use change and grassland succession. Ecography 2007, 30, 183–192. [Google Scholar] [CrossRef]
- Gkisakis, V.; Volakakis, N.; Kollaros, D.; Bàrberi, P.; Kabourakis, E.M. Soil arthropod community in the olive agroecosystem: Determined by environment and farming practices in different management systems and agroecological zones. Agric. Ecosyst. Environ. 2016, 218, 178–189. [Google Scholar] [CrossRef]
- Hadjicharalampous, E.; Kalburtji, K.L.; Mamolos, A.P. Soil Arthropods (Coleoptera, Isopoda) in Organic and Conventional Agroecosystems. Environ. Manag. 2002, 29, 683–690. [Google Scholar] [CrossRef] [PubMed]
- Gagnarli, E.; Goggioli, D.; Tarchi, F.; Guidi, S.; Nannelli, R.; Vignozzi, N.; Valboa, G.; Lottero, M.R.; Corino, L.; Simoni, S. Case study of microarthropod communities to assess soil quality in different managed vineyards. Soil 2015, 1, 527–536. [Google Scholar] [CrossRef]
- Caprio, E.; Nervo, B.; Isaia, M.; Allegro, G.; Rolando, A. Organic versus conventional systems in viticulture: Comparative effects on spiders and carabids in vineyards and adjacent forests. Agric. Syst. 2015, 136, 61–69. [Google Scholar] [CrossRef]
- Puig-Montserrat, X.; Stefanescu, C.; Torre, I.; Palet, J.; Fàbregas, E.; Dantart, J.; Arrizabalaga, A.; Flaquer, C. Effects of organic and conventional crop management on vineyard biodiversity. Agric. Ecosyst. Environ. 2017, 243, 19–26. [Google Scholar] [CrossRef]
- Seniczak, A.; Seniczak, S.; García-Parra, I.; Ferragut, F.; Xamaní, P.; Graczyk, R.; Messeguer, E.; Laborda, R.; Rodrigo, E. Oribatid mites of conventional and organic vineyards in the Valencian Community, Spain. Acarologia 2018, 58, 119–133. [Google Scholar]
- Costantini, E.A.C.; Agnelli, A.E.; Fabiani, A.; Gagnarli, E.; Mocali, S.; Priori, S.; Simoni, S.; Valboa, G. Short-term recovery of soil physical, chemical, micro- and mesobiological functions in a new vineyard under organic farming. Soil 2015, 1, 443–457. [Google Scholar] [CrossRef]
- Döring, J.; Collins, C.; Frisch, M.; Kauer, R. Organic and Biodynamic Viticulture Affect Biodiversity and Vine and Wine Properties: A Systematic Quantitative Review. Am. J. Enol. Vitic. 2019, 70, 221–242. [Google Scholar] [CrossRef]
- National Centers for Environmental Prediction; National Weather Service; NOAA; U.S. Department of Commerce. NCEP GDAS/FNL 0.25 Degree Global Tropospheric Analyses and Forecast Grids 2015. Research Data Archive at the National Center for Atmospheric Research, Computational and Information Systems Laboratory. Available online: https://doi.org/10.5065/D65Q4T4Z (accessed on 5 November 2019).
- Powers, J.G.; Klemp, J.B.; Skamarock, W.C.; Davis, C.A.; Dudhia, J.; Gill, D.O.; Coen, J.L.; Gochis, D.J.; Ahmadov, R.; Peckham, S.E.; et al. The Weather Research and Forecasting Model: Overview, System Efforts, and Future Directions. Bull. Am. Meteorol. Soc. 2017, 98, 1717–1737. [Google Scholar] [CrossRef]
- Ek, M.B.; Mitchell, K.E.; Lin, Y.; Rogers, E.; Grunmann, P.; Koren, V.; Gayno, G.; Tarpley, J.D. Implementation of Noah land surface model advances in the National Centers for Environmental Prediction operational mesoscale Eta model. J. Geophys. Res. Atmos. 2003, 108, 8851. [Google Scholar] [CrossRef]
- Soil Science Division Staff. Soil Survey Manual; Ditzler, C., Scheffe, K., Monger, H.C., Eds.; USDA Handbook 18; Government Printing Office: Washington, DC, USA, 2017; p. 125.
- Menta, C.; Conti, F.D.; Pinto, S.; Bodini, A. Soil Biological Quality index (QBS-ar): 15 years of application at global scale. Ecol. Indic. 2018, 85, 773–780. [Google Scholar] [CrossRef]
- Kenkel, N.C.; Orloci, L. Applying Metric and Nonmetric Multidimensional Scaling to Ecological Studies: Some New Results. Ecology 1986, 67, 919–928. [Google Scholar] [CrossRef]
- Clarke, K.R. Non-parametric multivariate analyses of changes in community structure. Aust. J. Ecol. 1993, 18, 117–143. [Google Scholar] [CrossRef]
- Oksanen, J.; Blanchet, F.G.; Friendly, M.; Kindt, R.; Legendre, P.; McGlinn, D.; Minchin, P.R.; O’Hara, R.B.; Simpson, G.L.; Solymos, P.; et al. Vegan: Community Ecology Package, R Package Version 2.5; 2018. Available online: http://CRAN.Rproject.org/package=vegan (accessed on 19 May 2020).
- R Core Team. R: A Language and Environment for Statistical Computing. R Foundation for Statistical Computing; R Core Team: Vienna, Austria, 2019; Available online: https://www.R-project.org/ (accessed on 19 May 2020).
- Therneau, T.; Atkinson, B. rpart: Recursive Partitioning and Regression Trees, R Package Version 4.1-13; 2018. Available online: http://CRAN.Rproject.org/package=rpart (accessed on 19 May 2020).
- Pérez Bote, J.; Romero, A. Epigeic soil arthropod abundance under different agricultural land uses. Span. J. Agric. Res. 2012, 10, 55–61. [Google Scholar] [CrossRef]
- Zhu, G.; Luo, Y.; Xue, M.; Zhao, H.; Xia, N.; Wang, X. Effects of high-temperature stress and heat shock on two root maggots, Bradysia odoriphaga and Bradysia difformis (Diptera: Sciaridae). J. Asia-Pac. Entomol. 2018, 21, 106–114. [Google Scholar] [CrossRef]
- Sjursen, H.; Holmstrup, M. Cold and drought stress in combination with pyrene exposure: Studies with Protaphorura armata (Collembola: Onychiuridae). Ecotoxicol. Environ. Saf. 2004, 57, 145–152. [Google Scholar] [CrossRef]
- Heiniger, C.; Barot, S.; Ponge, J.-F.; Salmon, S.; Meriguet, J.; Carmignac, D.; Suillerot, M.; Dubs, F. Collembolan preferences for soil and microclimate in forest and pasture communities. Soil Biol. Biochem. 2015, 86, 181–192. [Google Scholar] [CrossRef]
- Bertrand, M.; Lumaret, J.P. The role of Diplopoda litter grazing activity on recycling processes in a Mediterranean climate. Vegetatio 1992, 99, 289–297. [Google Scholar] [CrossRef]
- Stašiovstasiov, S.; Stašiová, A.; Svitok, M.; Michalková, E.; Slobodník, B.; Lukáčikarbbh, I. Millipede (Diplopoda) communities in an arboretum: Influence of tree species and soil properties. Biologia 2012, 67, 945–952. [Google Scholar]
- Badejo, M.A. Seasonal Abundance of Soil Mites (Acarina) in Two Contrasting Environments. Biotropica 1990, 22, 382–390. [Google Scholar] [CrossRef]
- Byers, G.W.; Thornhill, R. Biology of the Mecoptera. Annu. Rev. Entomol. 1983, 28, 203–228. [Google Scholar] [CrossRef]
- Varga, I. Structure and changes of macroinvertebrate community colonizing decomposing rhizome litter of common reed at Lake Fertő/Neusiedler See (Hungary). Hydrobiologia 2003, 506, 413–420. [Google Scholar] [CrossRef]
- Weygoldt, P. The Biology of Pseudoscorpions; Harvard University Press: Cambridge, Massachusetts, 1969. [Google Scholar]
- Bauer, T. Predation by a carabid beetle specialized for catching collembola. Pedobiologia 1982, 24, 169–179. [Google Scholar]

 p-value < 0.5, dashed line
  p-value < 0.1, dotted line
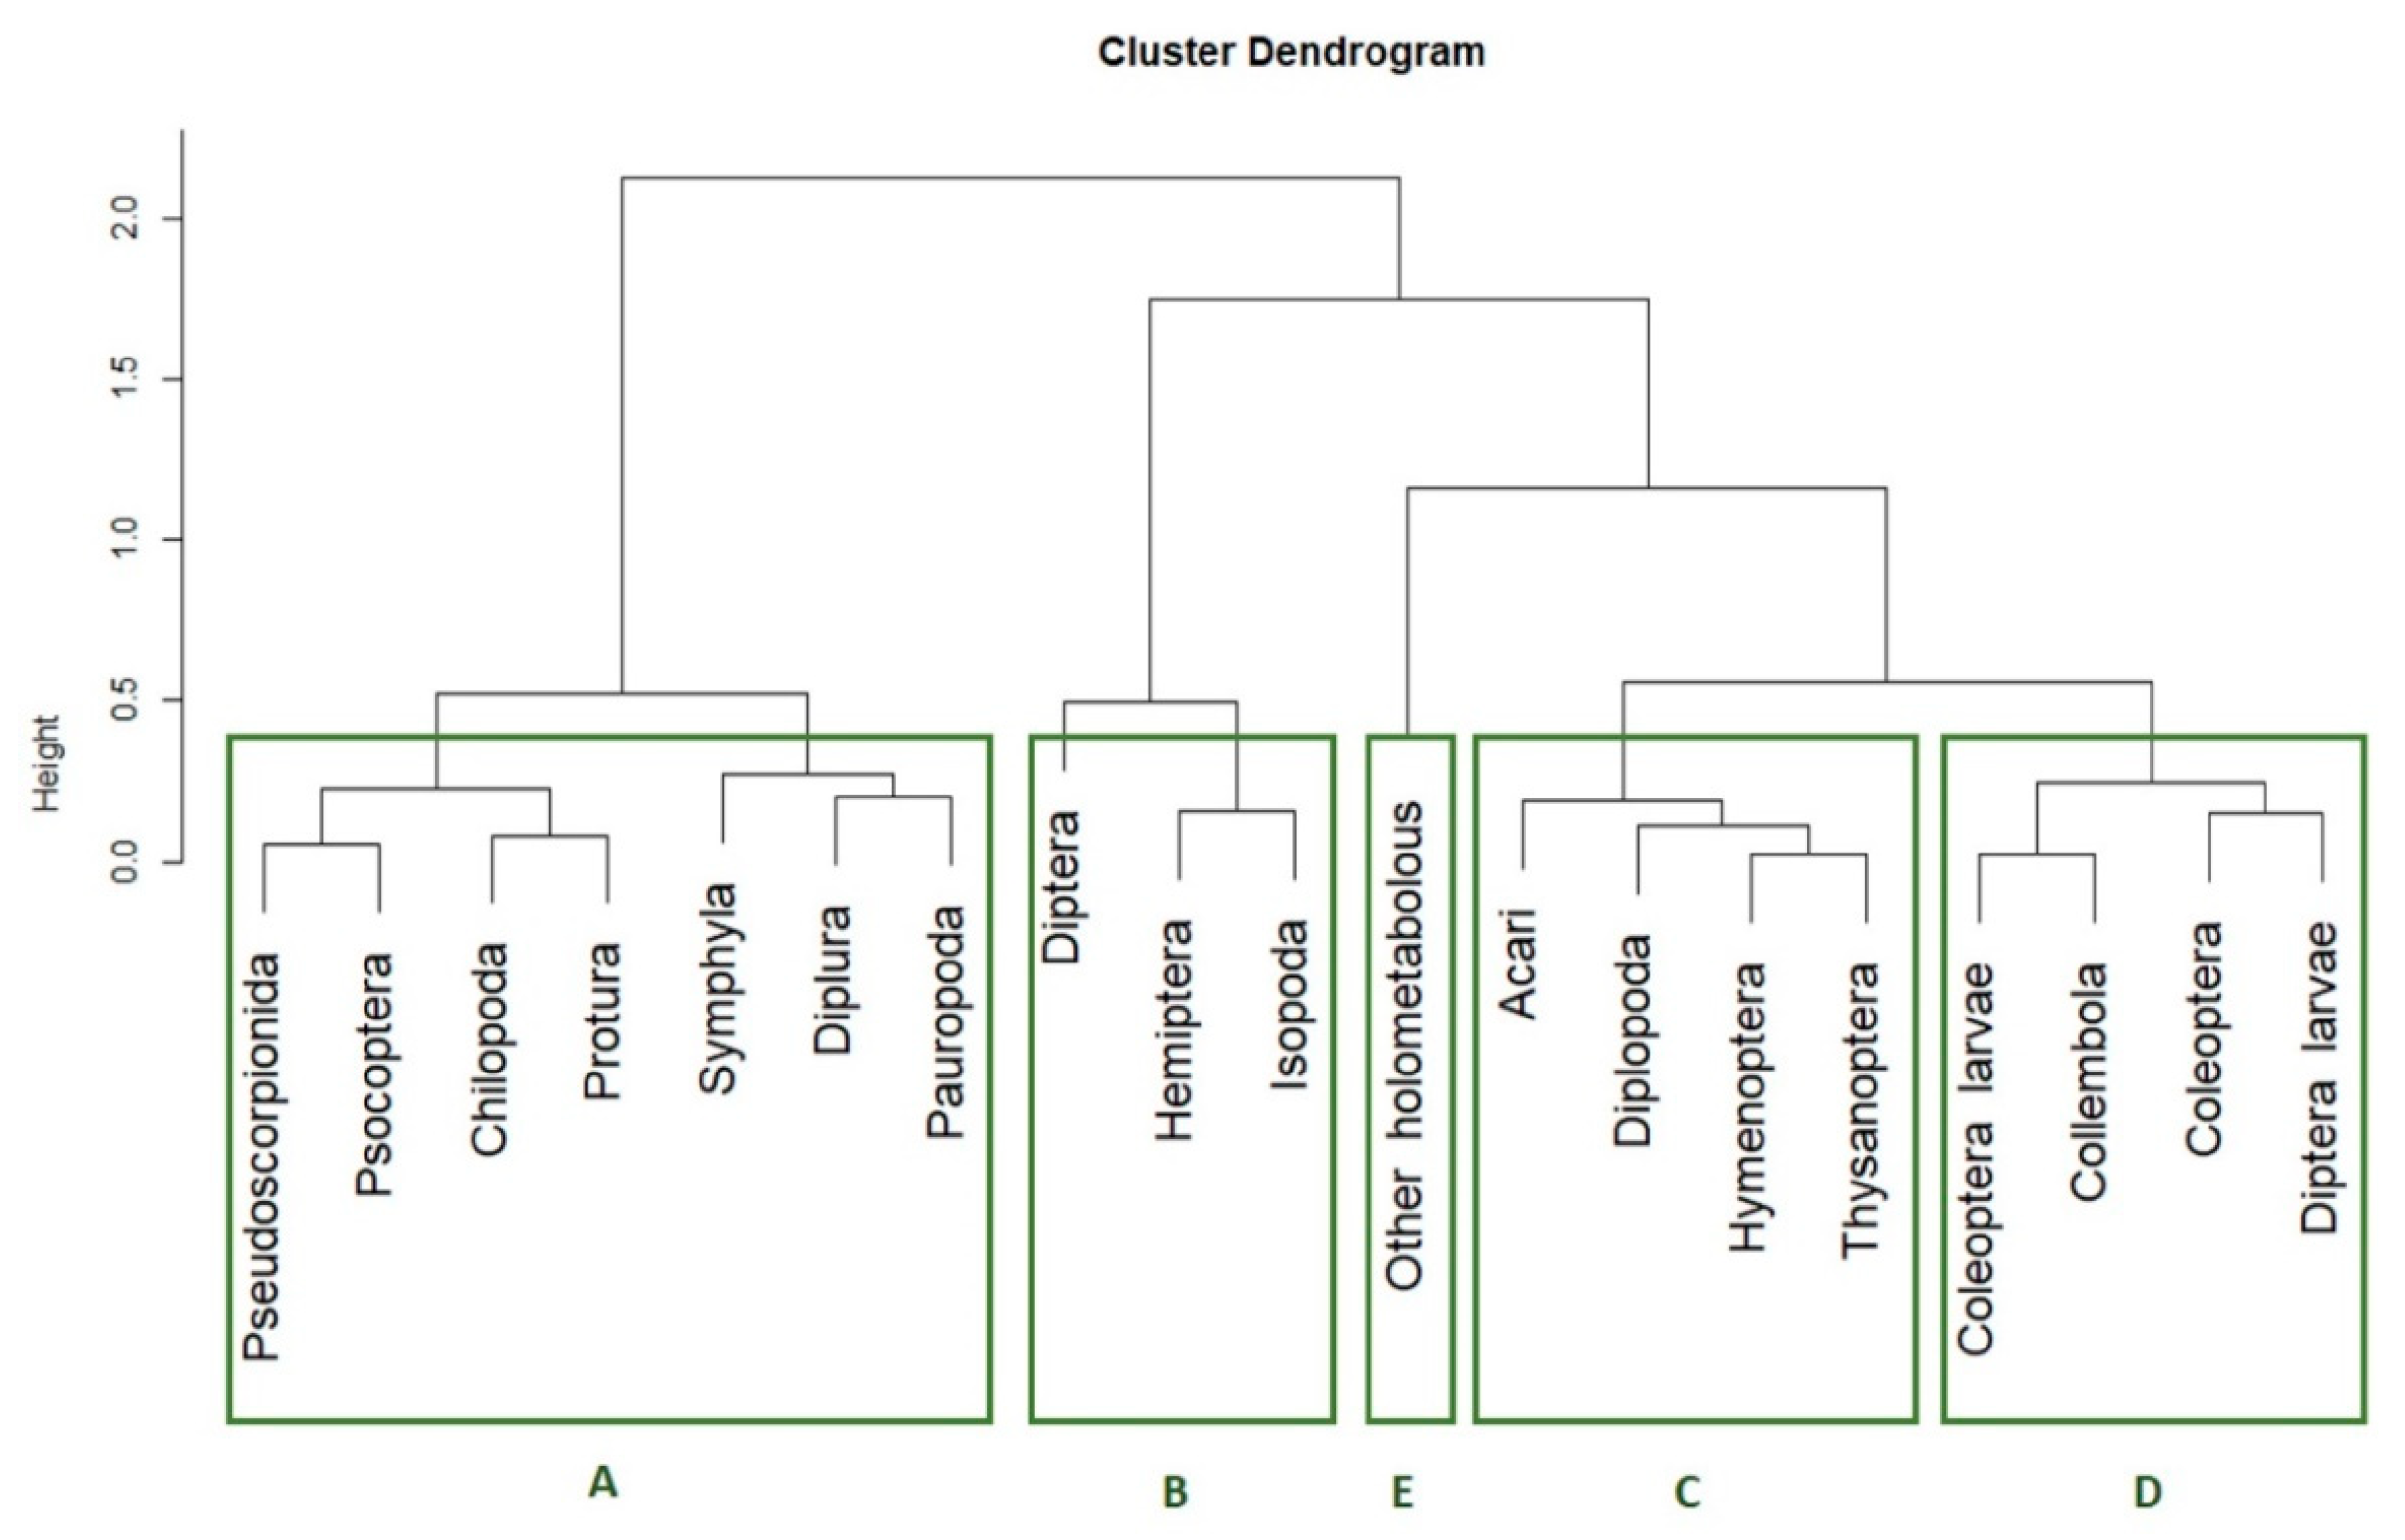
  p-value < 0.15). The five clusters of taxa according their presence pattern are highlighted with the green circles.
p-value < 0.5, dashed line p-value < 0.1, dotted line p-value < 0.15). The five clusters of taxa according their presence pattern are highlighted with the green circles.
p-value < 0.15). The five clusters of taxa according their presence pattern are highlighted with the green circles.
p-value < 0.5, dashed line p-value < 0.1, dotted line p-value < 0.15). The five clusters of taxa according their presence pattern are highlighted with the green circles.


| Unit of Measure | Mean ± Standard Deviation | Median (Q25–Q75) | Min | Max | |
|---|---|---|---|---|---|
| Cu | (mg/kg) | 58.68 ± 32.81 | 55.40 (36.9–72.2) | 4.20 | 170.00 |
| pH | 7.10 ± 0.87 | 7.30 (6.35–7.9) | 5.30 | 8.20 | |
| AL | (g CaCO3/kg) | 10.16 ± 22.62 | 0.00 (0.00–13.50) | 0.00 | 130.00 |
| SOM 1 | (g/kg) | 21.94 ± 9.08 | 23.00 (15.00–25.00) | 5.00 | 42.00 |
| P | (mg P2O5/kg) | 54.47 ± 40.20 | 51.00 (26.00–64.00) | 9.00 | 222.00 |
| K | (mg K2O/kg) | 148.52 ± 67.53 | 145.00 (94.00–178.00) | 60.00 | 354.00 |
| Mg | (mg MgO/kg) | 165.75 ± 75.37 | 138.00 (117.00–210.00) | 66.00 | 383.00 |
| TL 2 | °C | 68.76 ± 44.90 | 69.75 (33.67–104.39) | 0.00 | 161.46 |
| TH 3 | °C | 106.05 ± 59.06 | 121.76 (55.73–153.38) | 14.20 | 241.77 |
| MD 4 | Pure number | 10.39 ± 26.03 | 5.16 (1.51–7.88) | 0.00 | 135.53 |
| MH 5 | Pure number | 0.11 ± 0.20 | 0.00 (0.00–0.156) | 0.00 | 0.63 |
| Taxa | Larvae | N° of Presences | Other Stages 1 | N° of Presences |
|---|---|---|---|---|
| Acari | x | 89 | ||
| Myriapoda—Diplopoda | x | 12 | ||
| Myriapoda—Chilopoda | x | 17 | ||
| Myriapoda—Symphyla | x | 56 | ||
| Myriapoda—Pauropoda | x | 32 | ||
| Hymenoptera | x | 80 | ||
| Thysanoptera | x | 7 | ||
| Pseudoscorpionida | x | 11 | ||
| Psocoptera | x | 8 | ||
| Coleoptera | x | 31 | ||
| Coleoptera larvae | x | 39 | ||
| Collembola | x | 89 | ||
| Diptera | x | 31 | ||
| Diptera larvae | x | 32 | ||
| Protura | x | 25 | ||
| Diplura | x | 27 | ||
| Hemiptera | x | 12 | ||
| Isopoda | x | 6 | ||
| Other_holometabolous2 | x | 20 |
| Variable | Squared Correlation Coefficient | p-Value 6 of Correlation Coefficient | |
|---|---|---|---|
| Cu | 0.05 | 0.17 | |
| pH | 0.06 | 0.09 | ** |
| AL | 0.02 | 0.48 | |
| SOM 1 | 0.08 | 0.05 | *** |
| P | 0.02 | 0.43 | |
| K | 0.01 | 0.66 | |
| Mg | 0.01 | 0.64 | |
| TL 2 | 0.08 | 0.04 | *** |
| TH 3 | 0.15 | 0.01 | *** |
| MD 4 | 0.05 | 0.15 | * |
| MH 5 | 0.12 | 0.01 | *** |
| TXT | 0.04 | 0.83 | |
© 2020 by the authors. Licensee MDPI, Basel, Switzerland. This article is an open access article distributed under the terms and conditions of the Creative Commons Attribution (CC BY) license (http://creativecommons.org/licenses/by/4.0/).
Share and Cite
Ghiglieno, I.; Simonetto, A.; Orlando, F.; Donna, P.; Tonni, M.; Valenti, L.; Gilioli, G. Response of the Arthropod Community to Soil Characteristics and Management in the Franciacorta Viticultural Area (Lombardy, Italy). Agronomy 2020, 10, 740. https://doi.org/10.3390/agronomy10050740
Ghiglieno I, Simonetto A, Orlando F, Donna P, Tonni M, Valenti L, Gilioli G. Response of the Arthropod Community to Soil Characteristics and Management in the Franciacorta Viticultural Area (Lombardy, Italy). Agronomy. 2020; 10(5):740. https://doi.org/10.3390/agronomy10050740
Chicago/Turabian StyleGhiglieno, Isabella, Anna Simonetto, Francesca Orlando, Pierluigi Donna, Marco Tonni, Leonardo Valenti, and Gianni Gilioli. 2020. "Response of the Arthropod Community to Soil Characteristics and Management in the Franciacorta Viticultural Area (Lombardy, Italy)" Agronomy 10, no. 5: 740. https://doi.org/10.3390/agronomy10050740
APA StyleGhiglieno, I., Simonetto, A., Orlando, F., Donna, P., Tonni, M., Valenti, L., & Gilioli, G. (2020). Response of the Arthropod Community to Soil Characteristics and Management in the Franciacorta Viticultural Area (Lombardy, Italy). Agronomy, 10(5), 740. https://doi.org/10.3390/agronomy10050740