Suppression of Food Allergic Symptoms by Raw Cow’s Milk in Mice is Retained after Skimming but Abolished after Heating the Milk—A Promising Contribution of Alkaline Phosphatase

 , and
, and 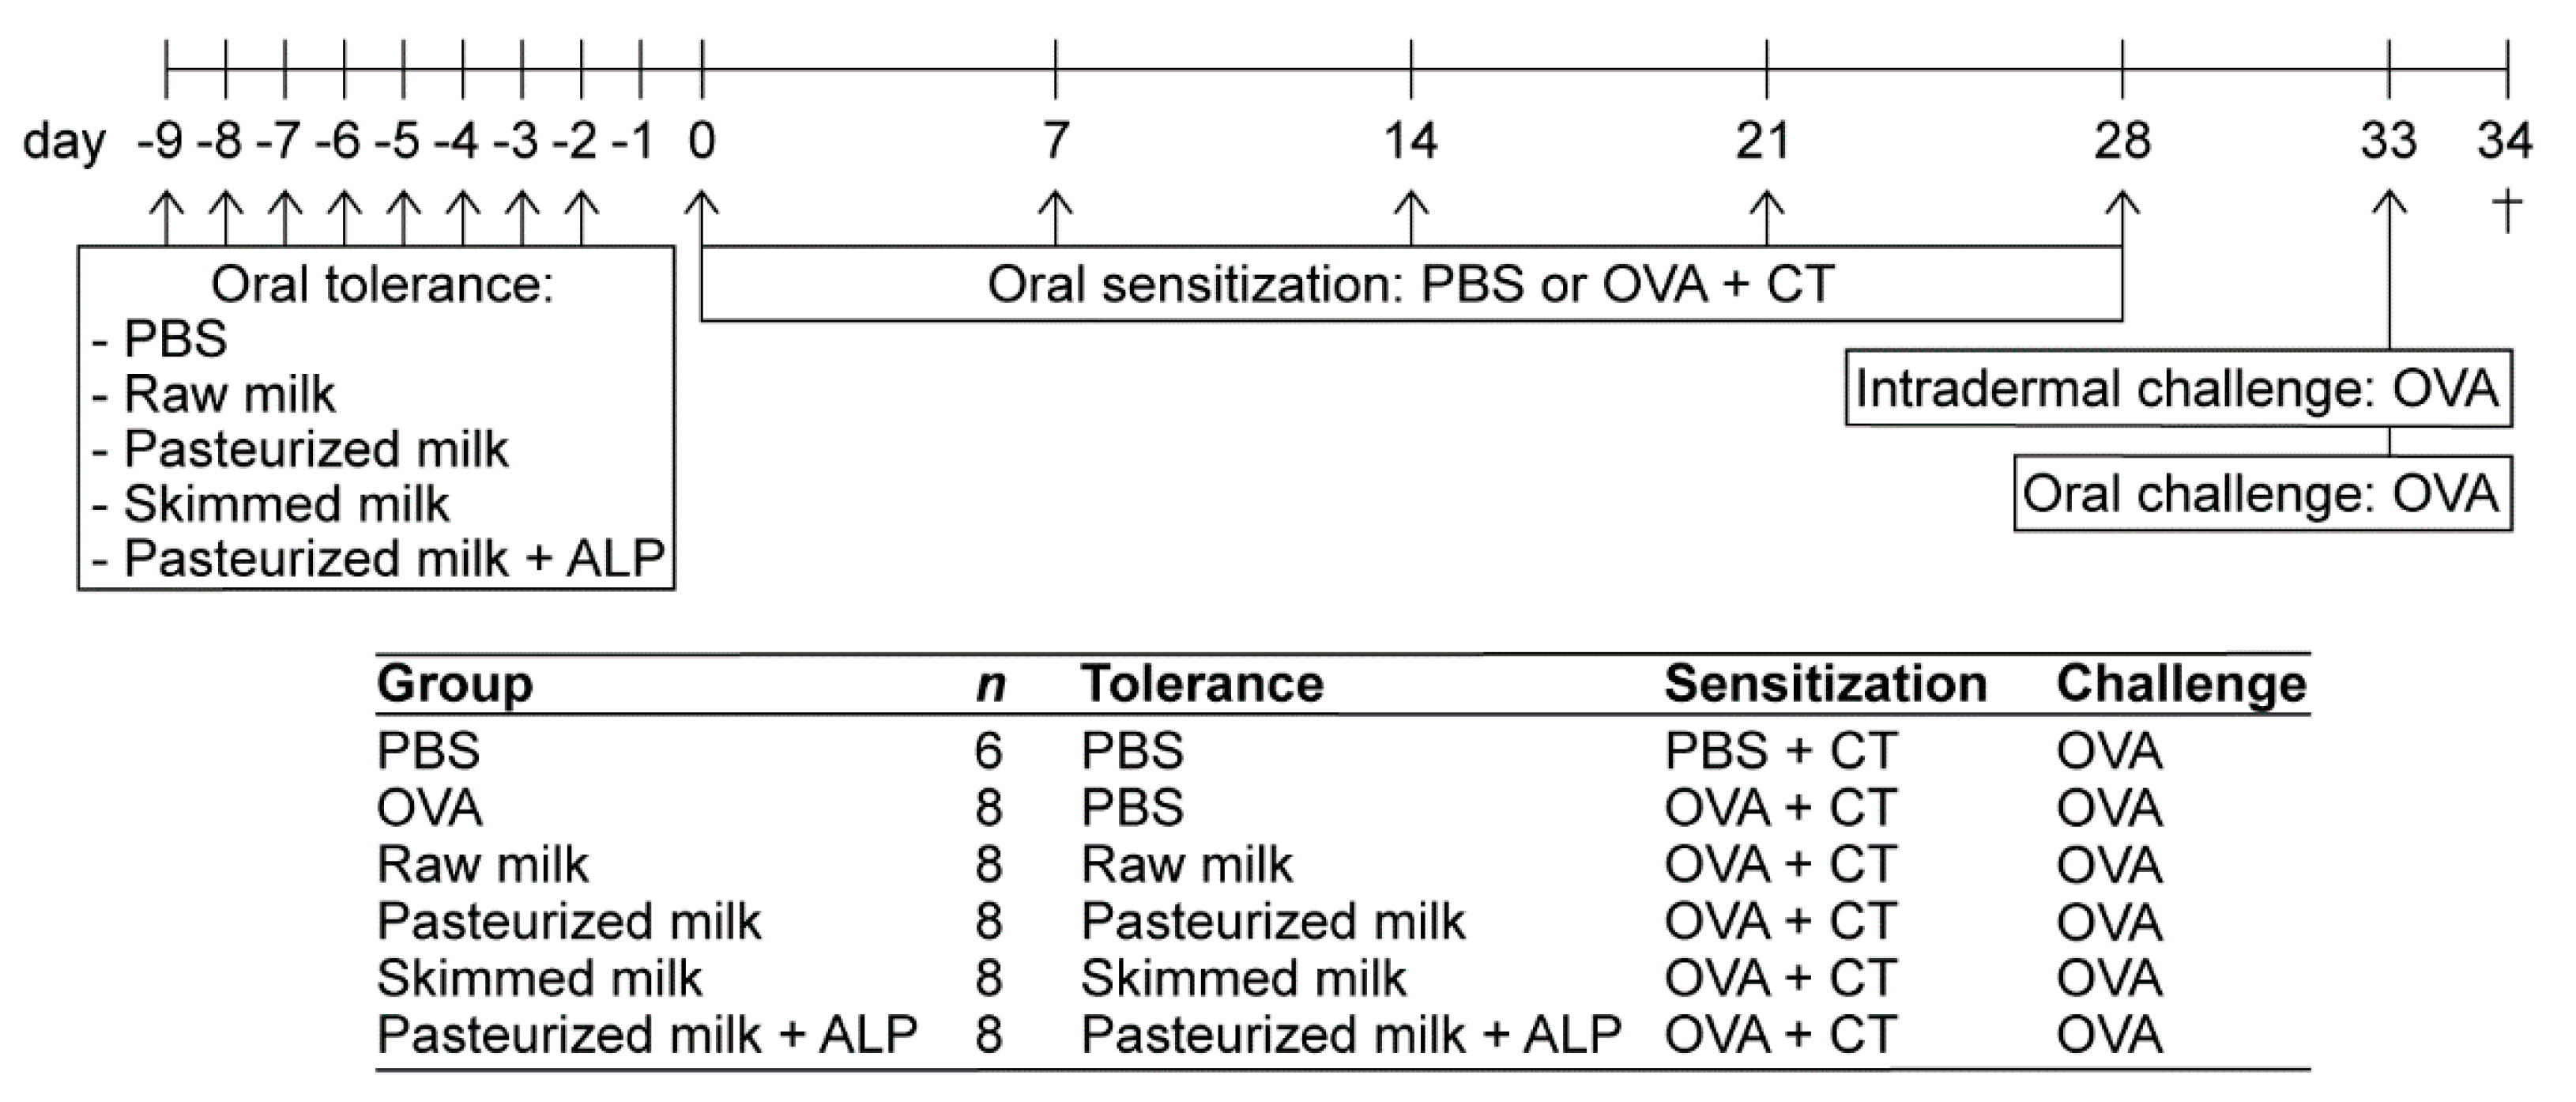
Abstract
1. Introduction
2. Materials and Methods
2.1. Mice
2.2. Milk Types
2.3. Animal Procedures
2.4. Evaluation of the Acute Allergic Skin Response
2.5. Basophil Activation Test
2.6. Measurement of OVA-Specific Immunoglobulins in Serum
2.7. Spleen, Mesenteric Lymph Nodes (MLN) and Lamina Propria (LP) Cell Isolation
2.8. Flow Cytometric Analysis of Immune Cells
2.9. Cytokine Measurements after ex vivo OVA-Specific Stimulation of Splenocytes
2.10. Short-Chain Fatty Acid (SCFA) Analysis in Caecum
2.11. Statistical Analysis
3. Results
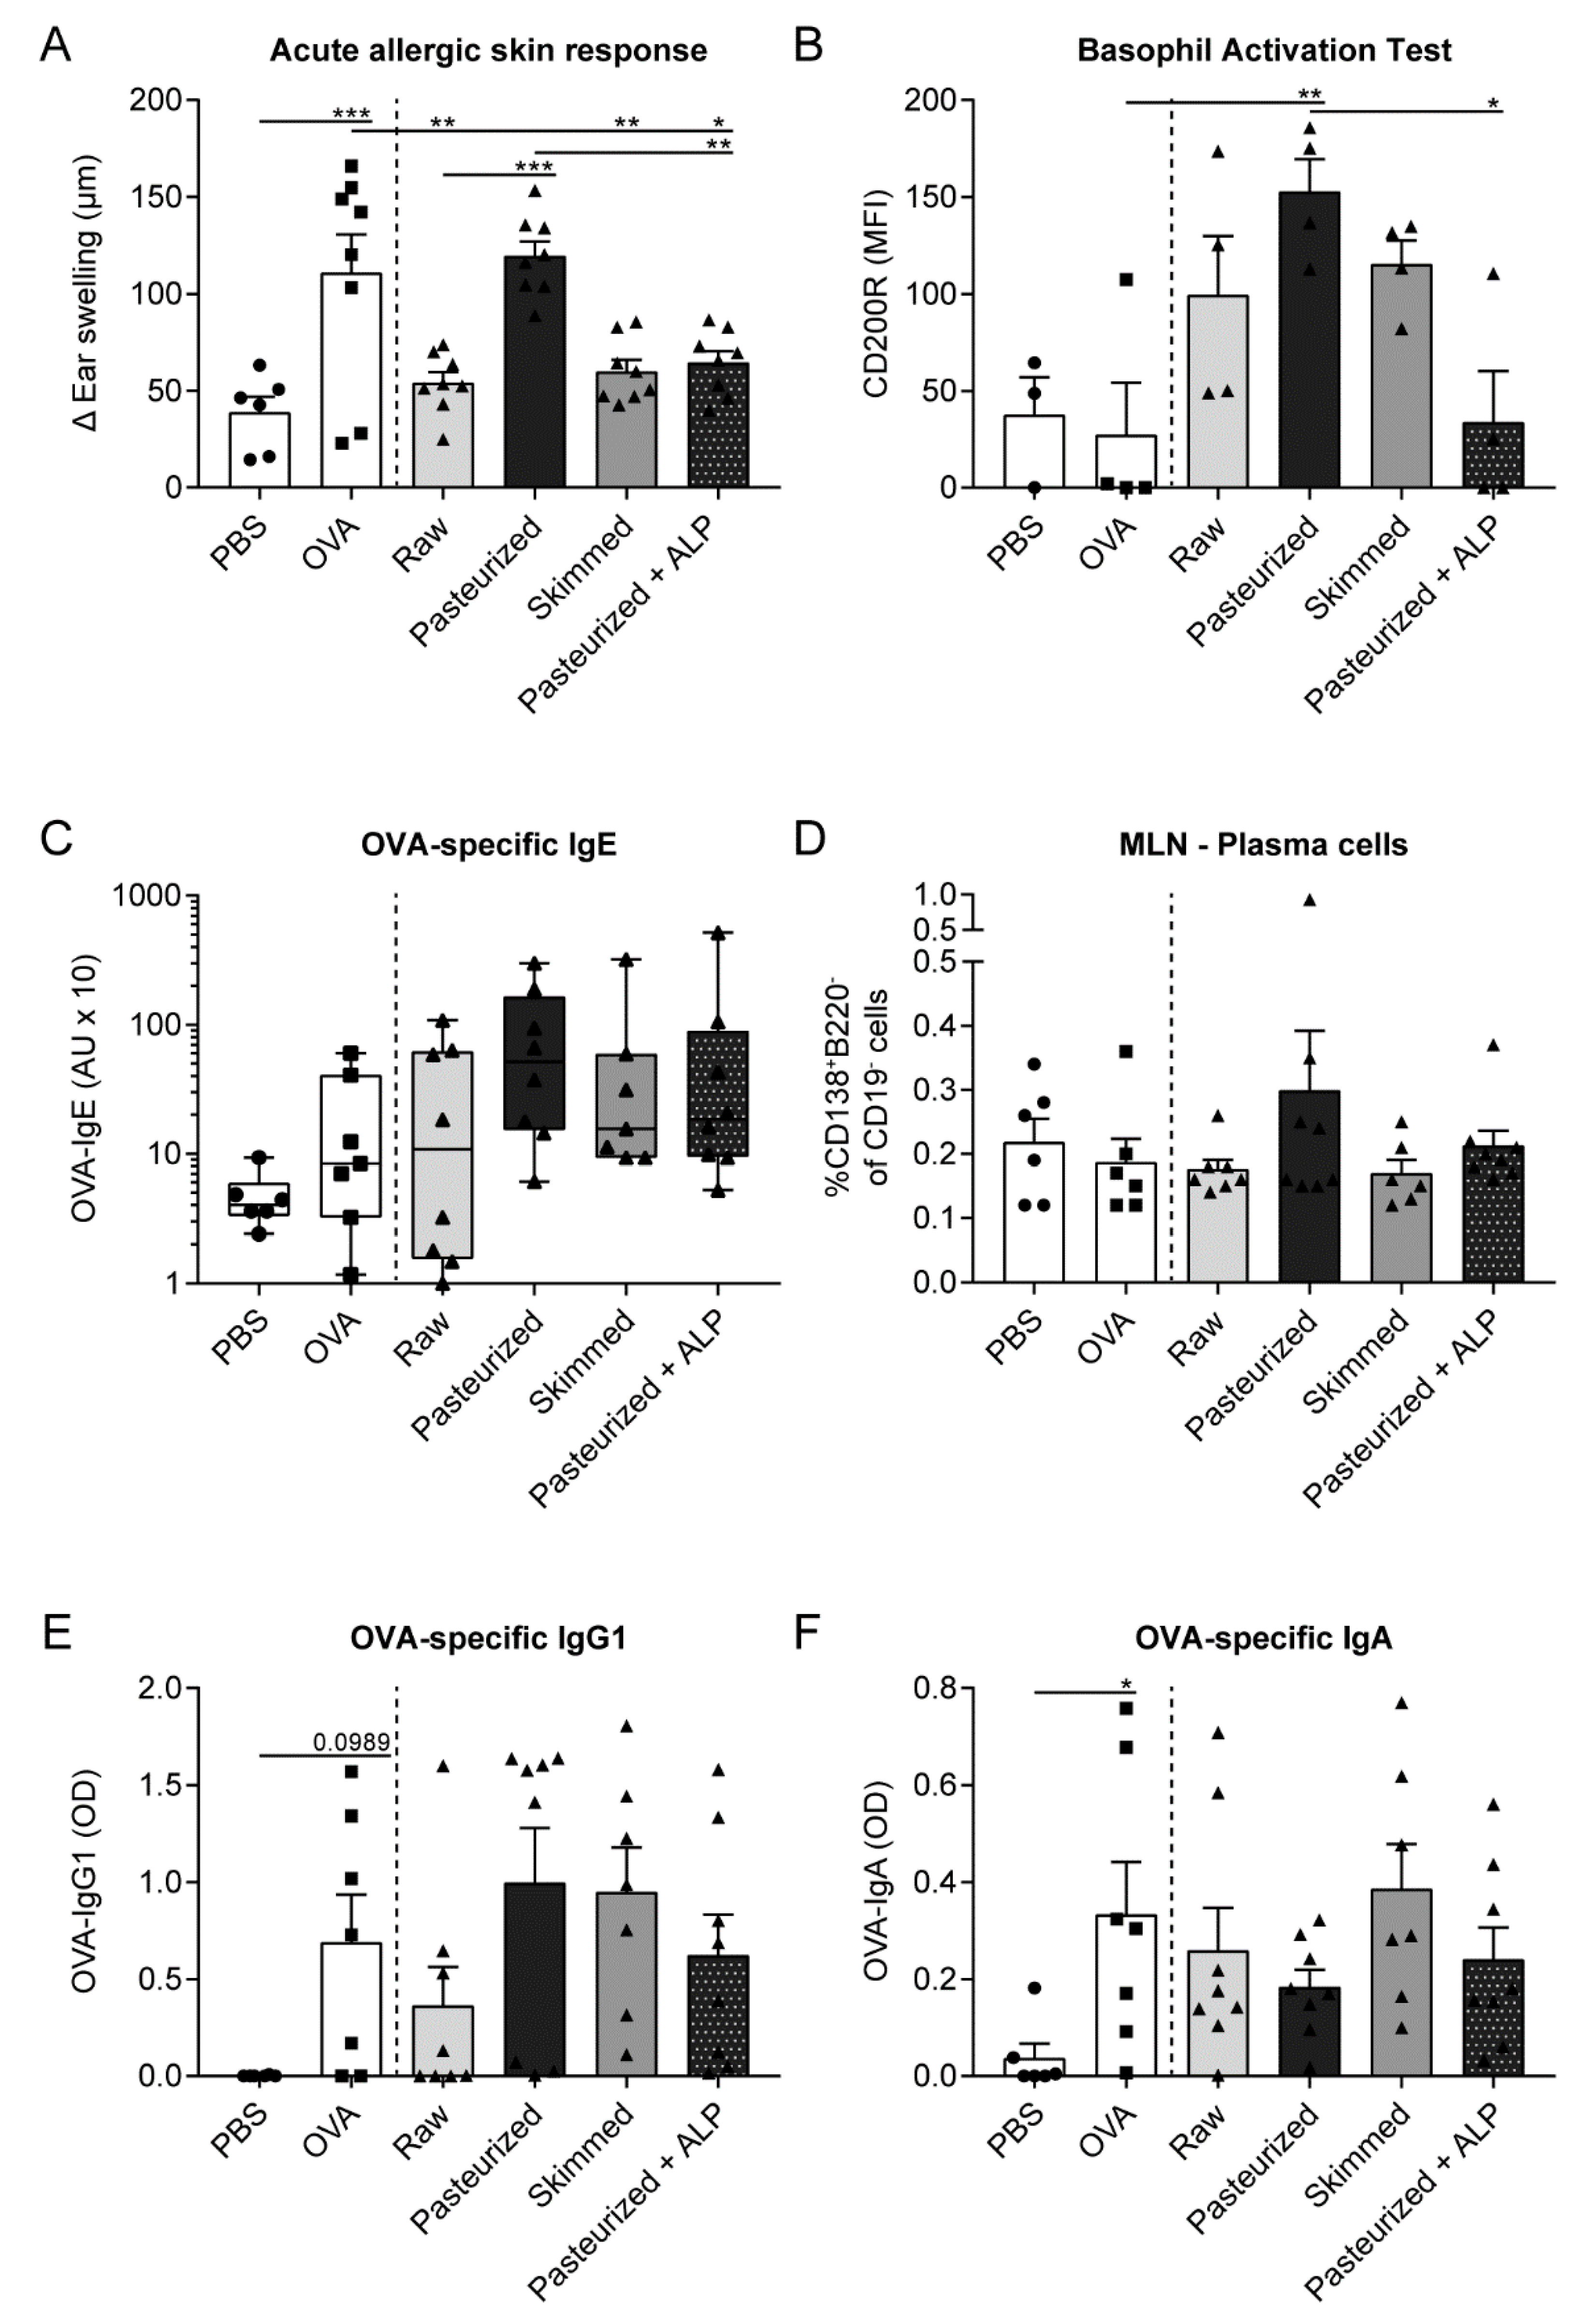
3.1. Suppression of the Allergic Effector Response by Raw Milk is Retained after Skimming but Abolished after Heating the Milk
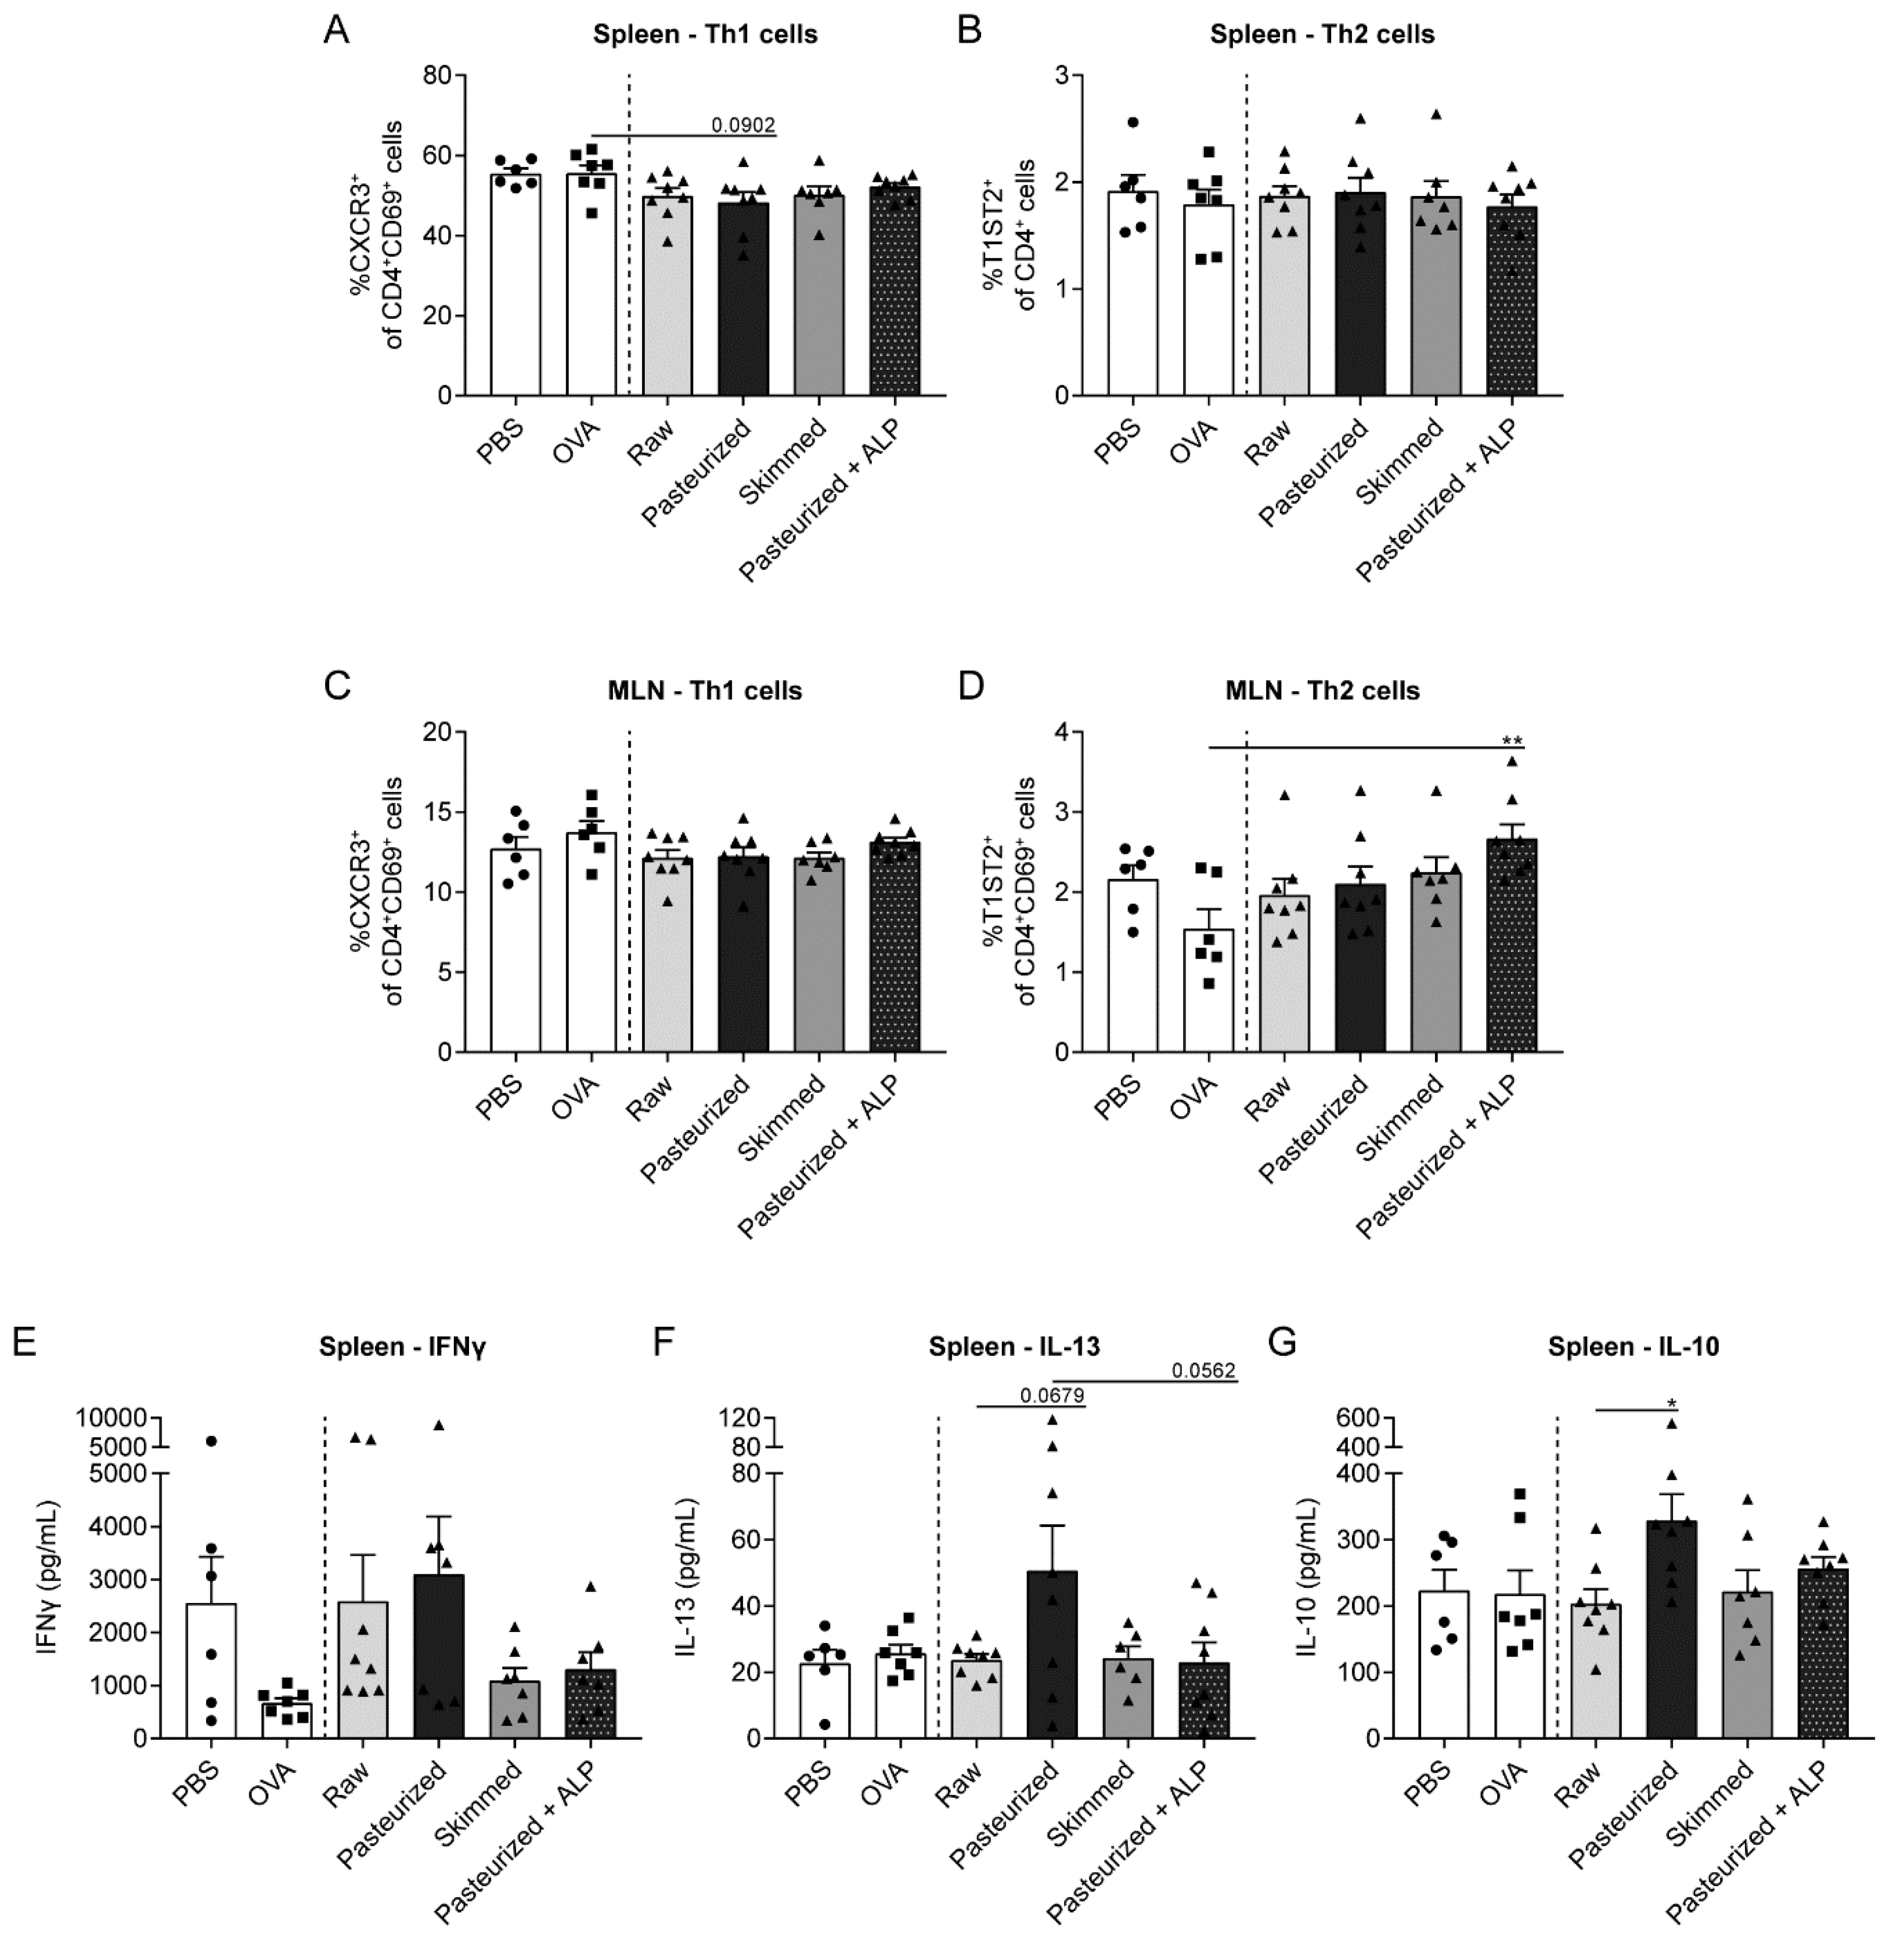
3.2. Low Th2-Related Cytokine Production by Splenocytes from Raw Milk- and Skimmed Milk-Treated Mice after ex vivo Stimulation with OVA
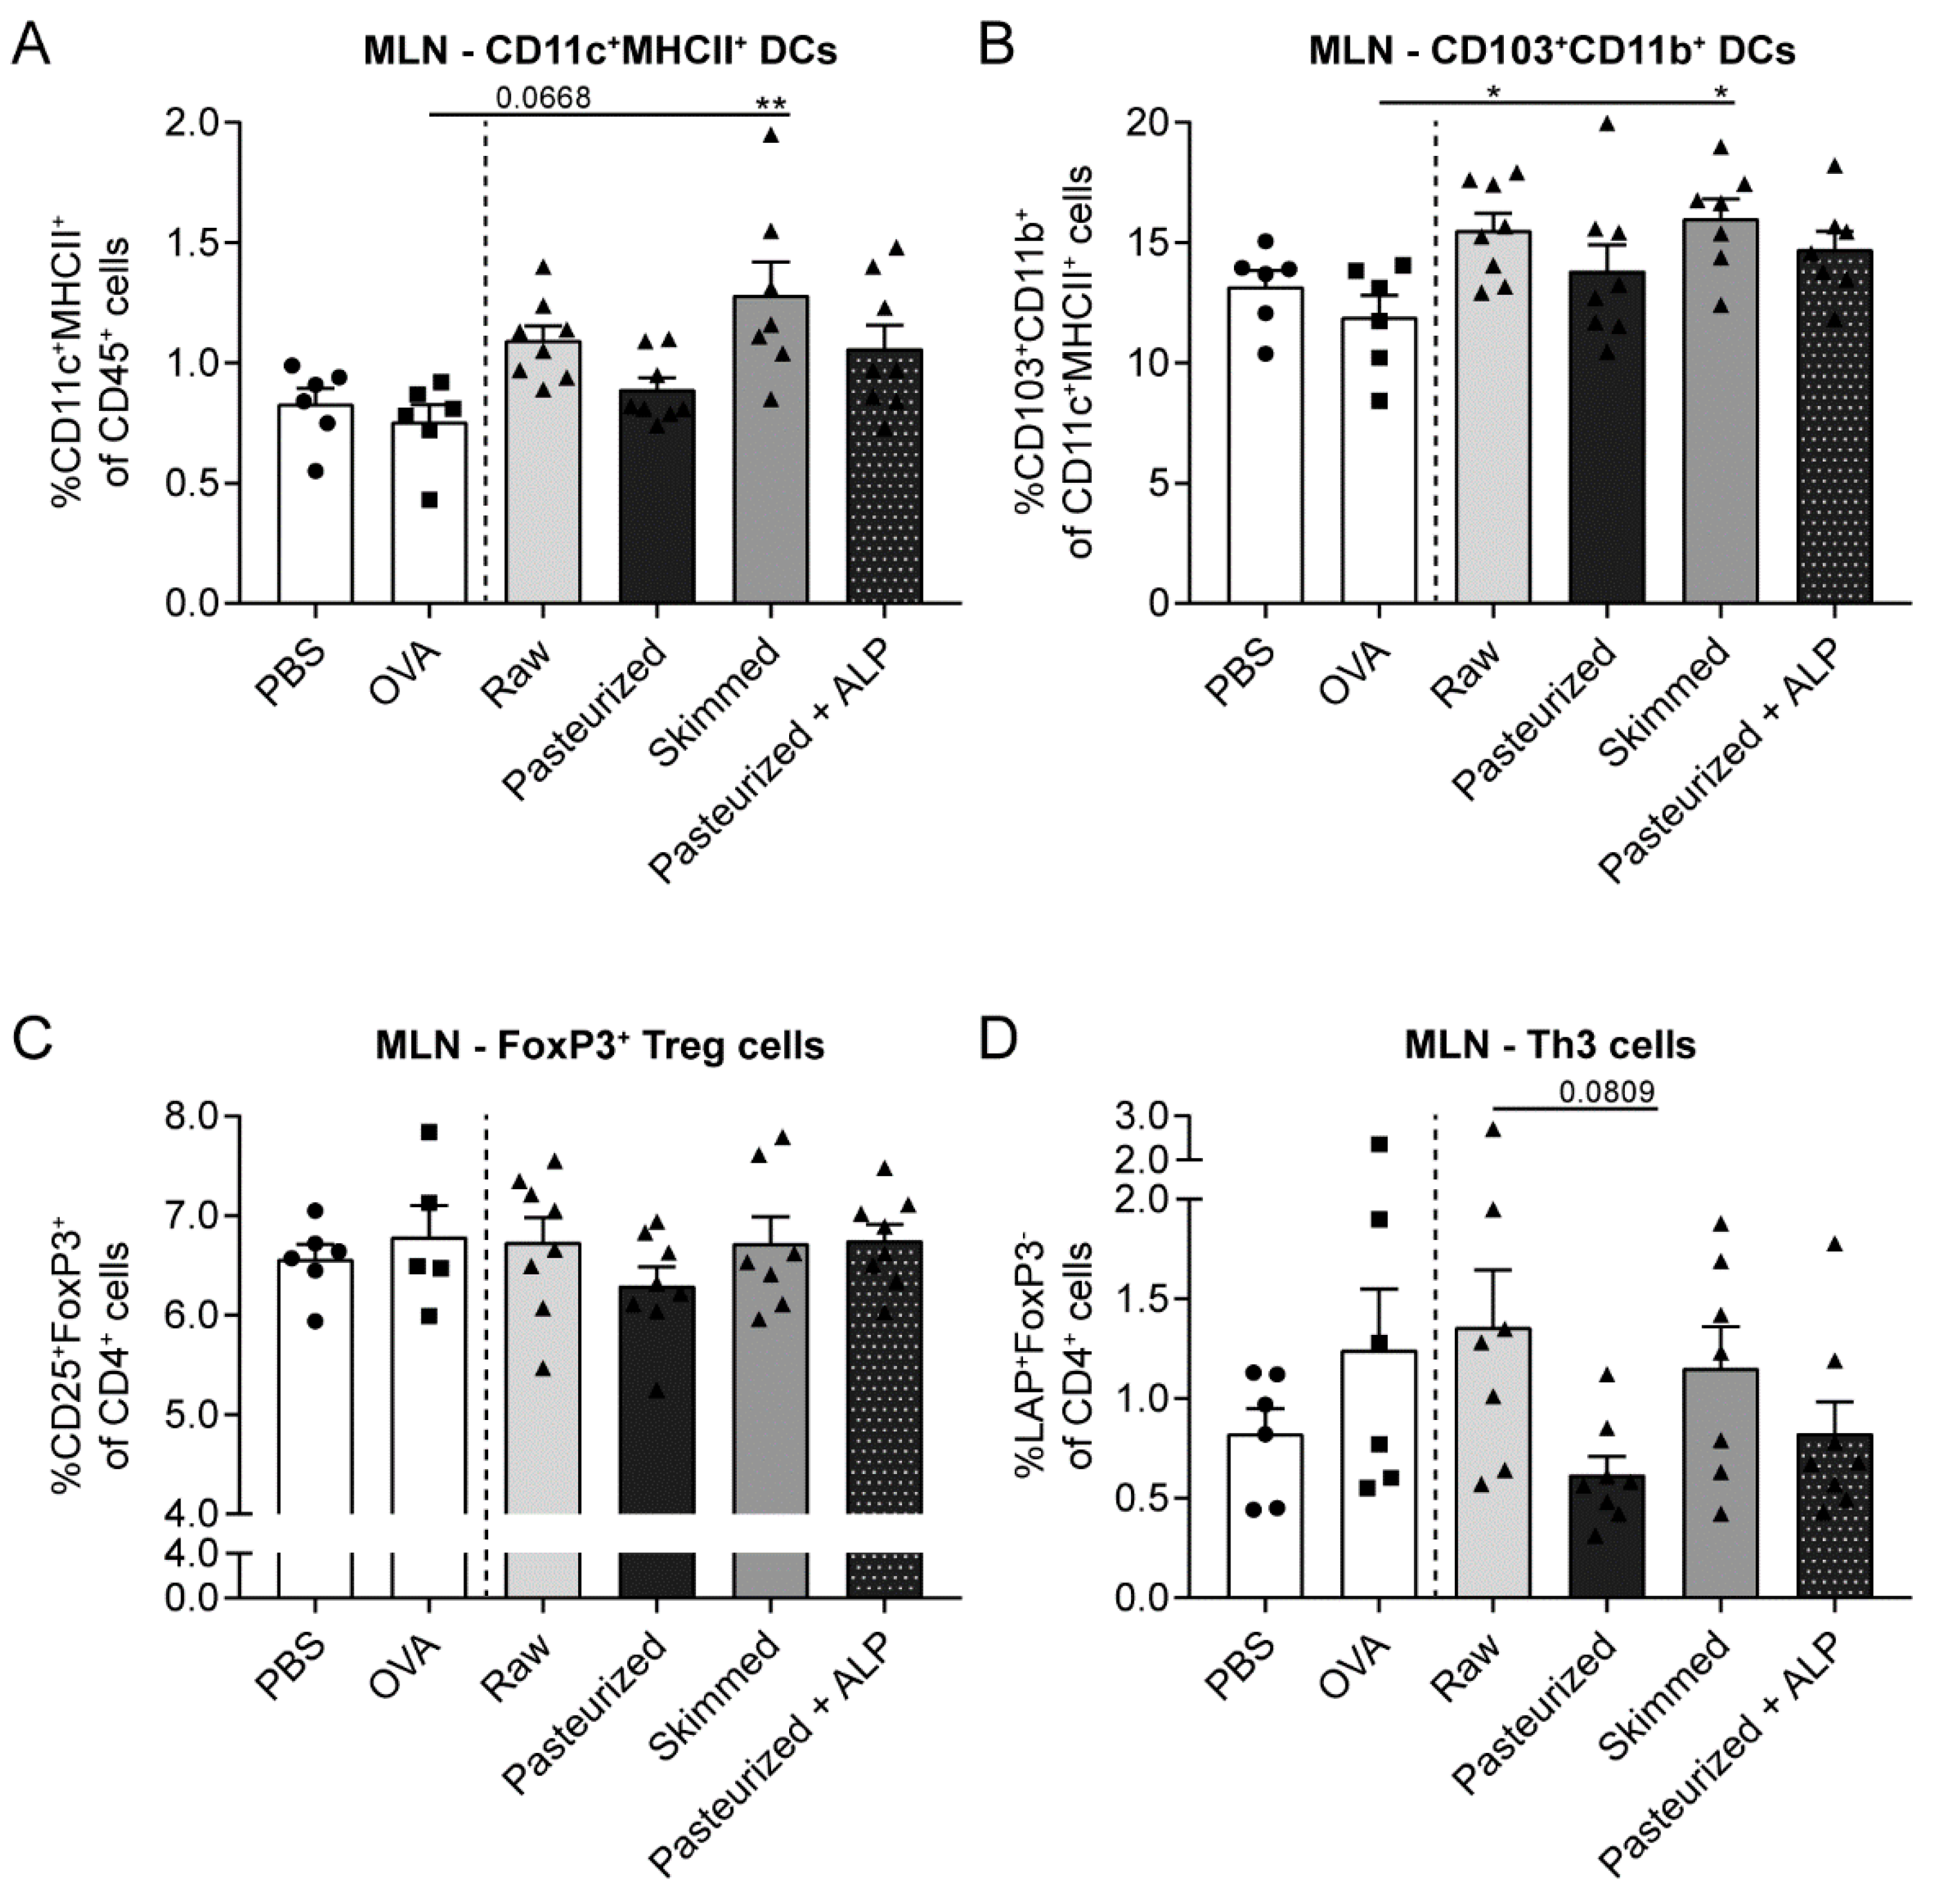
3.3. Raw Milk and Skimmed Milk Induce Tolerance-Associated Cell Types in the MLN
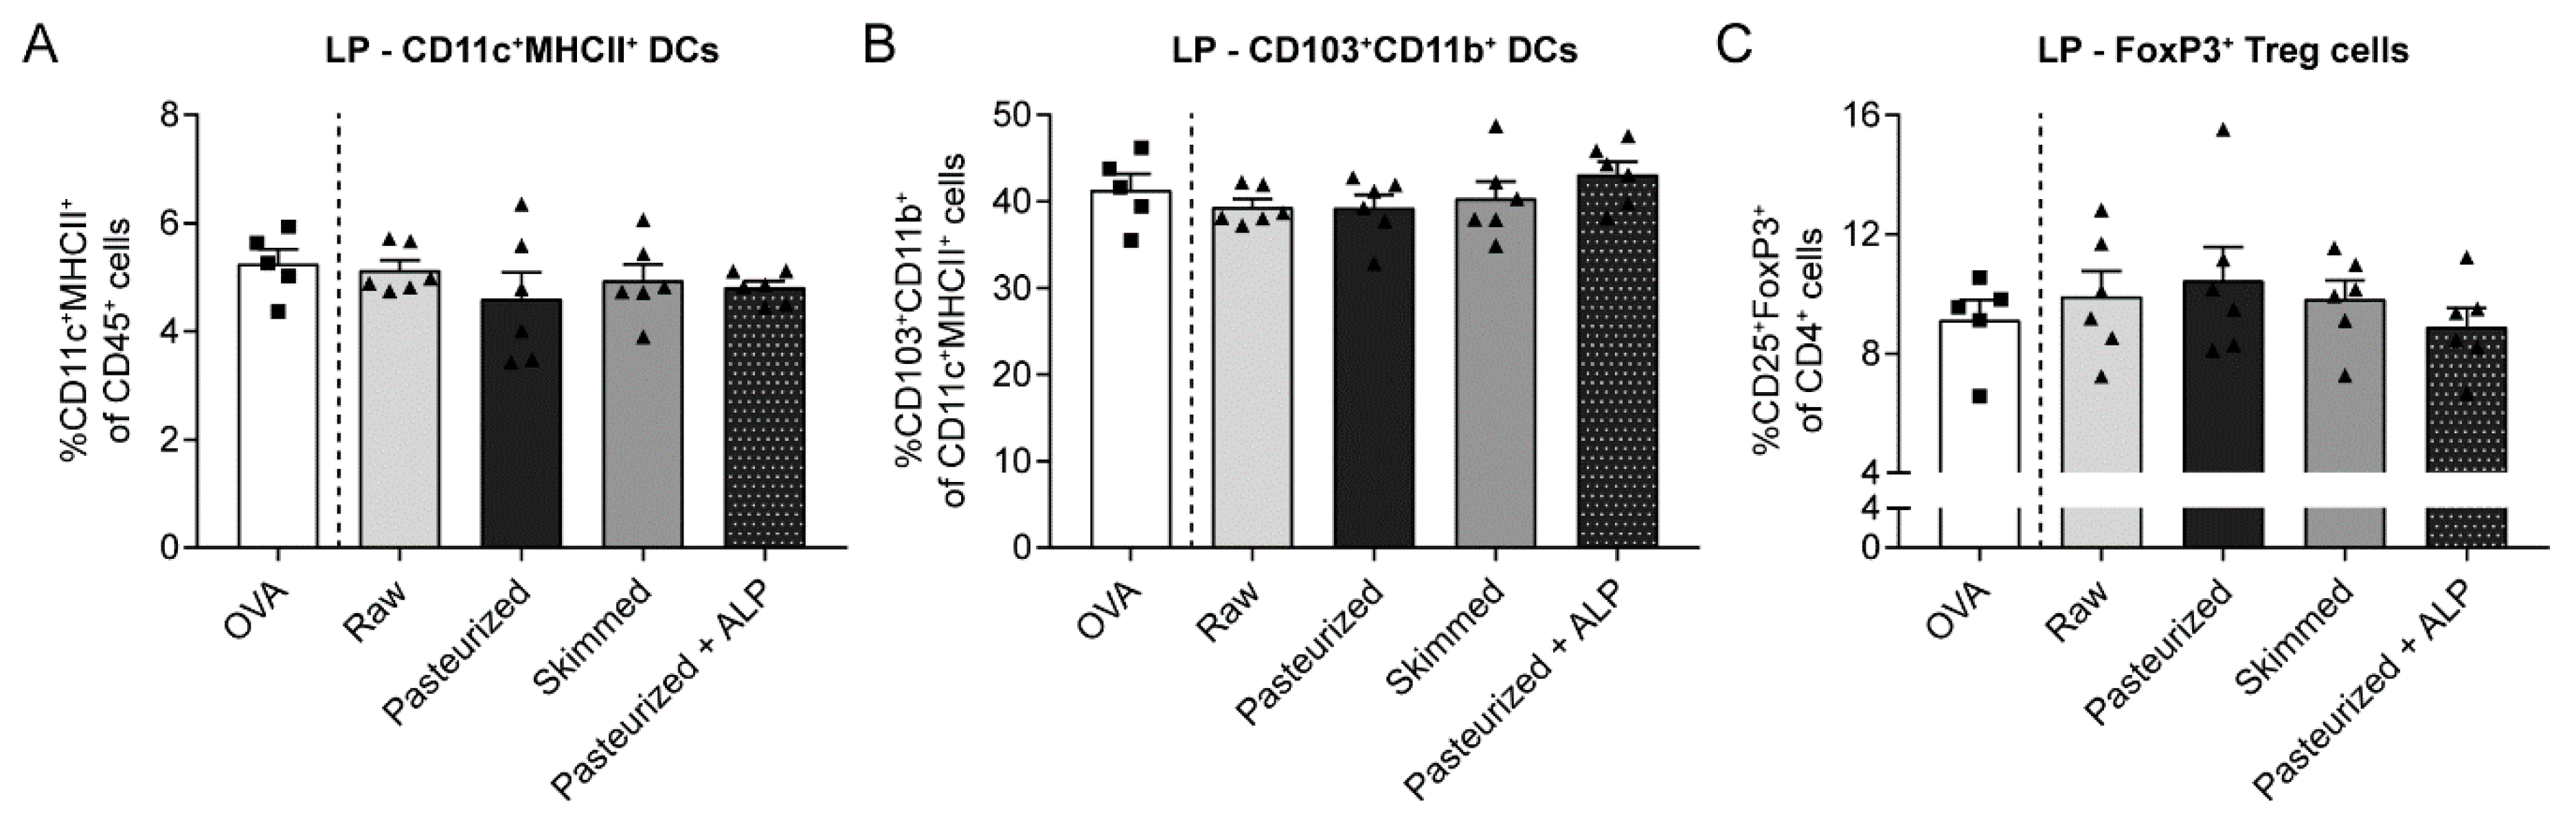
3.4. Increased Percentage of Tolerogenic DCs in MLN of Raw Milk- and Skimmed Milk-Treated Mice is Not Associated with Increased Treg Cell Frequency in the LP
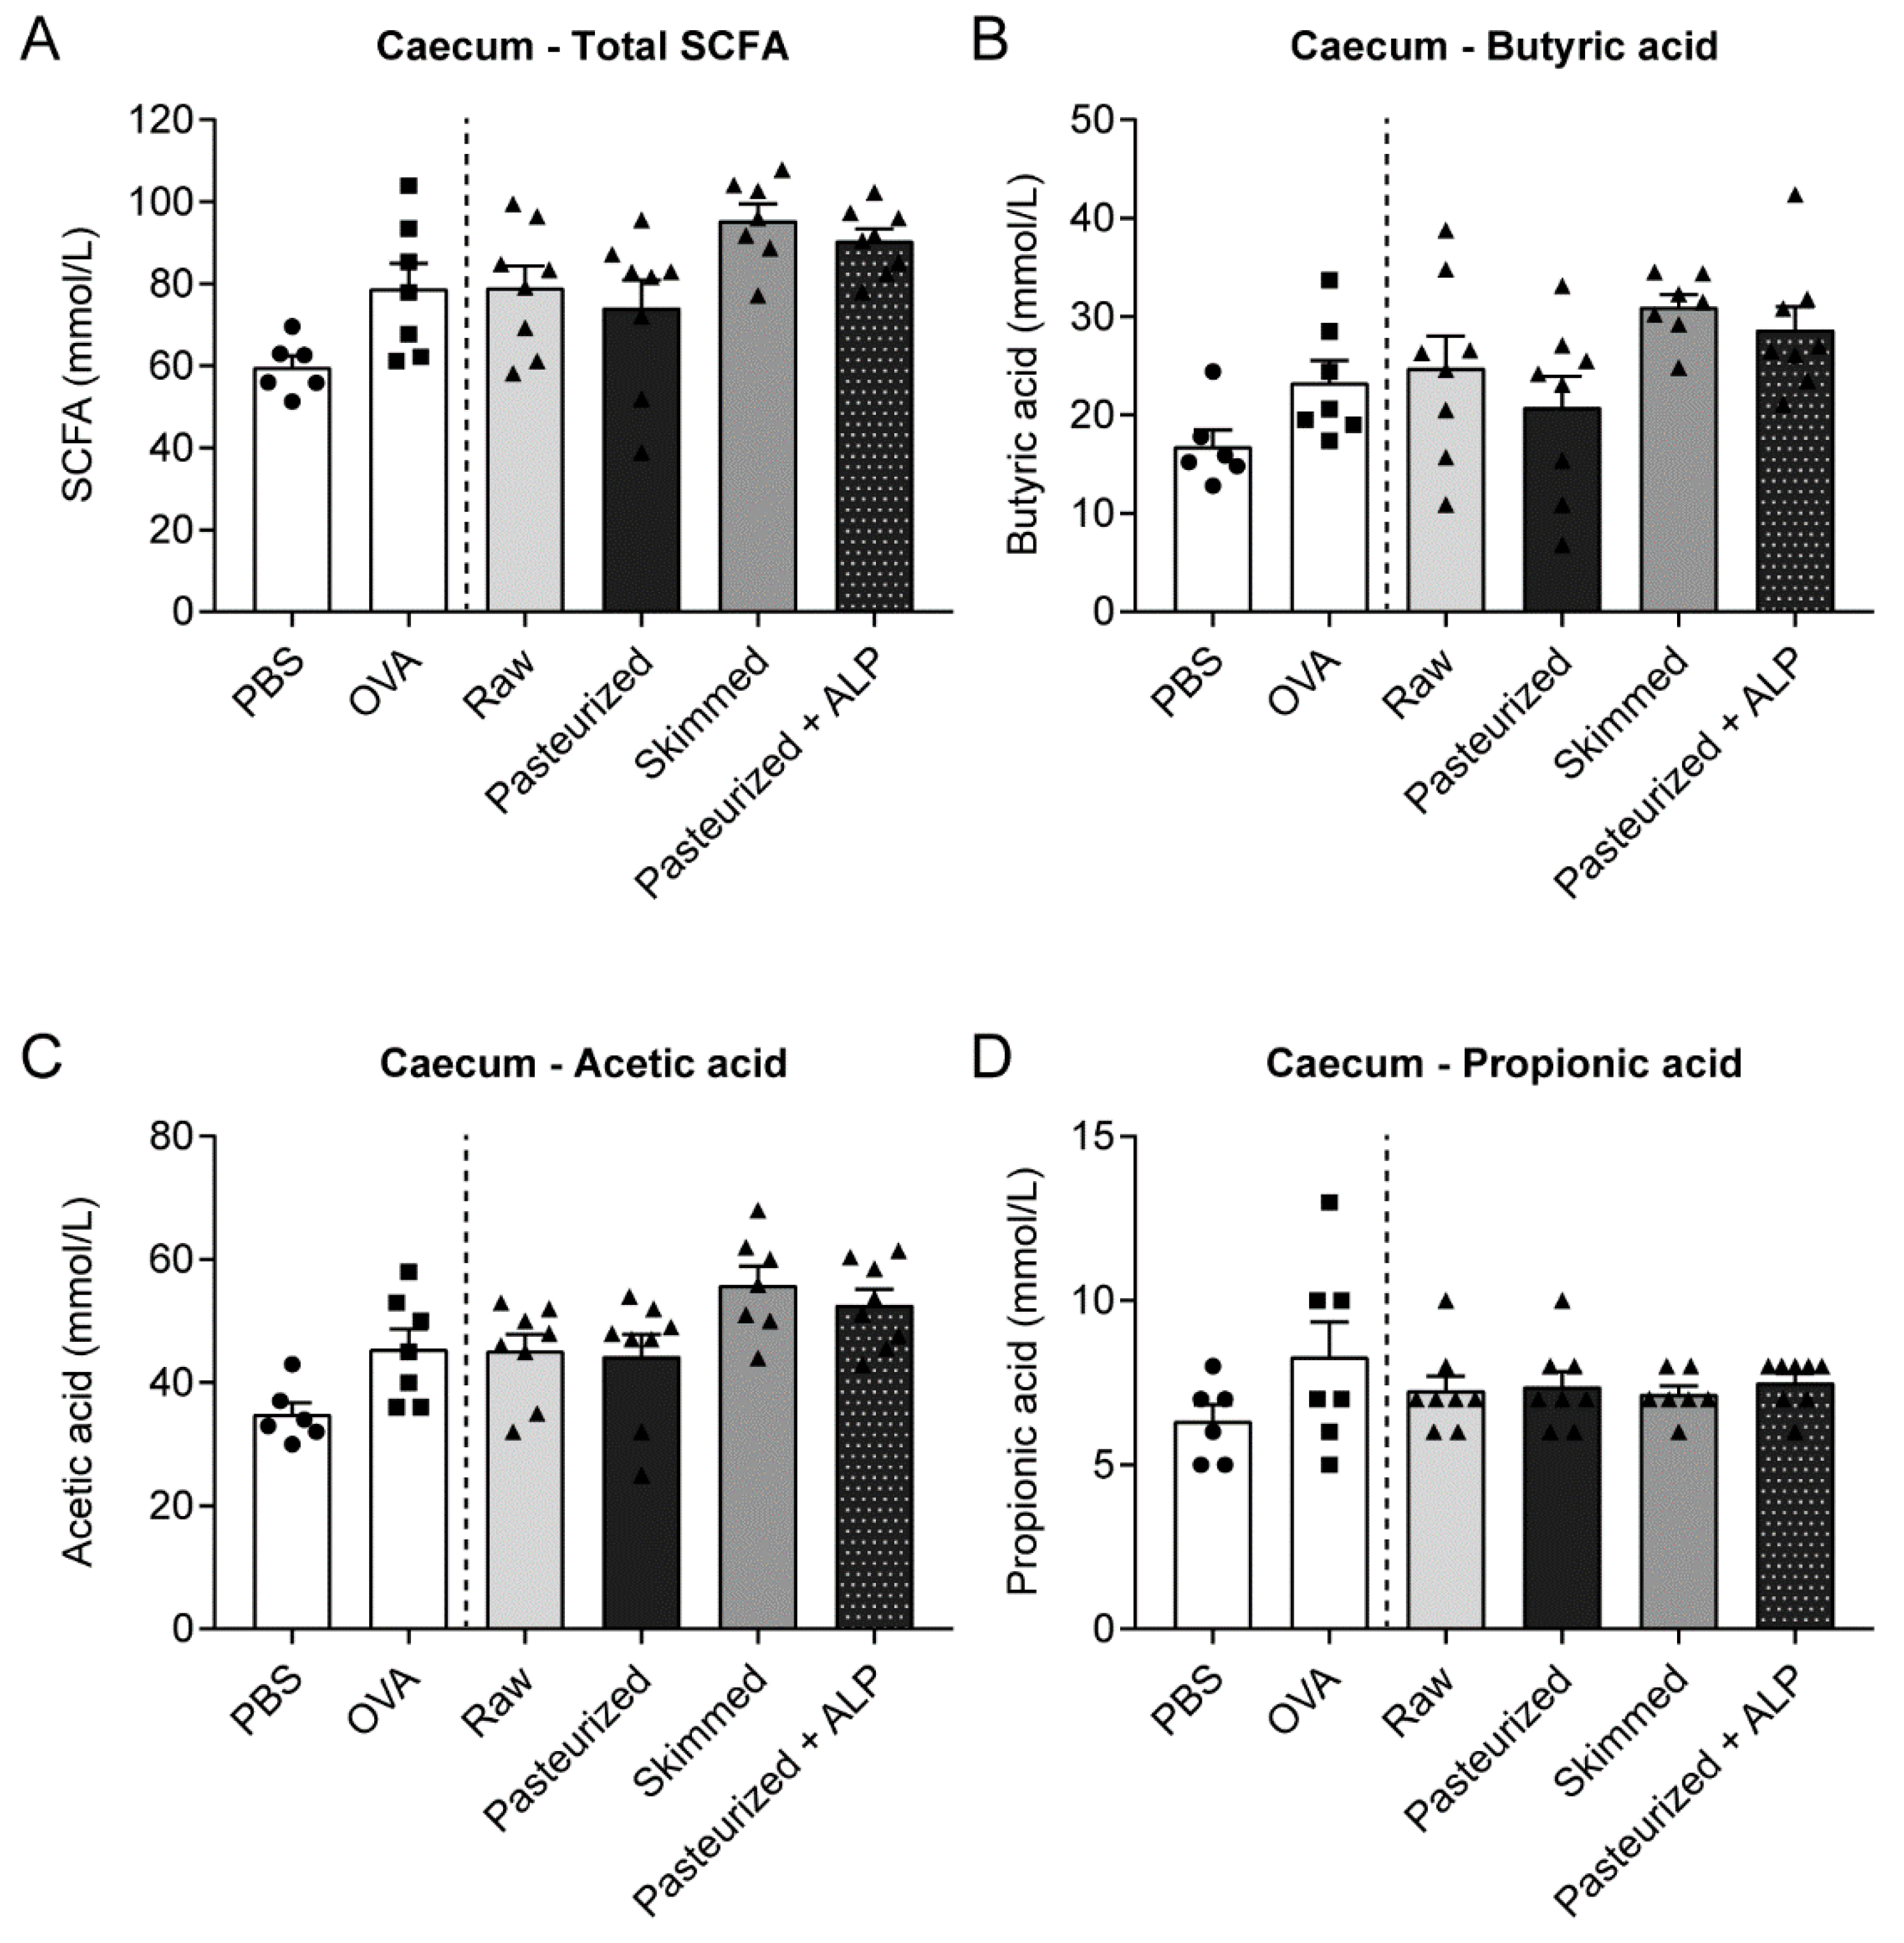
3.5. Different Milk Types Did Not Affect SCFA Concentrations
4. Discussion
Author Contributions
Funding
Acknowledgments
Conflicts of Interest
References
- West, C.E.; D’Vaz, N.; Prescott, S.L. Dietary immunomodulatory factors in the development of immune tolerance. Curr. Allergy Asthma Rep. 2011, 11, 325–333. [Google Scholar] [CrossRef] [PubMed]
- Thijs, C.; Muller, A.; Rist, L.; Kummeling, I.; Snijders, B.E.; Huber, M.; van Ree, R.; Simoes-Wust, A.P.; Dagnelie, P.C.; Van Den Brandt, P.A. Fatty acids in breast milk and development of atopic eczema and allergic sensitisation in infancy. Allergy 2011, 66, 58–67. [Google Scholar] [CrossRef] [PubMed]
- Verhasselt, V.; Milcent, V.; Cazareth, J.; Kanda, A.; Fleury, S.; Dombrowicz, D.; Glaichenhaus, N.; Julia, V. Breast milk-mediated transfer of an antigen induces tolerance and protection from allergic asthma. Nat. Med. 2008, 14, 170–175. [Google Scholar] [CrossRef] [PubMed]
- Moro, G.; Arslanoglu, S.; Stahl, B.; Jelinek, J.; Wahn, U.; Boehm, G. A mixture of prebiotic oligosaccharides reduces the incidence of atopic dermatitis during the first six months of age. Arch. Dis. Child. 2006, 91, 814–819. [Google Scholar] [CrossRef] [PubMed]
- Loss, G.; Apprich, S.; Waser, M.; Kneifel, W.; Genuneit, J.; Buchele, G.; Weber, J.; Sozanska, B.; Danielewicz, H.; Horak, E.; et al. The protective effect of farm milk consumption on childhood asthma and atopy: The GABRIELA study. J. Allergy Clin. Immunol. 2011, 128. [Google Scholar] [CrossRef] [PubMed]
- Ege, M.J.; Frei, R.; Bieli, C.; Schram-Bijkerk, D.; Waser, M.; Benz, M.R.; Weiss, G.; Nyberg, F.; van Hage, M.; Pershagen, G.; et al. Not all farming environments protect against the development of asthma and wheeze in children. J. Allergy Clin. Immunol. 2007, 119, 1140–1147. [Google Scholar] [CrossRef] [PubMed]
- Riedler, J.; Braun-Fahrlander, C.; Eder, W.; Schreuer, M.; Waser, M.; Maisch, S.; Carr, D.; Schierl, R.; Nowak, D.; von Mutius, E.; et al. Exposure to farming in early life and development of asthma and allergy: A cross-sectional survey. Lancet 2001, 358, 1129–1133. [Google Scholar] [CrossRef]
- Waser, M.; Michels, K.B.; Bieli, C.; Floistrup, H.; Pershagen, G.; von Mutius, E.; Ege, M.; Riedler, J.; Schram-Bijkerk, D.; Brunekreef, B.; et al. Inverse association of farm milk consumption with asthma and allergy in rural and suburban populations across Europe. Clin. Exp. Allergy 2007, 37, 661–670. [Google Scholar] [CrossRef]
- Perkin, M.R.; Strachan, D.P. Which aspects of the farming lifestyle explain the inverse association with childhood allergy? J. Allergy Clin. Immunol. 2006, 117, 1374–1381. [Google Scholar] [CrossRef]
- Abbring, S.; Verheijden, K.A.T.; Diks, M.A.P.; Leusink-Muis, A.; Hols, G.; Baars, T.; Garssen, J.; van Esch, B.C.A.M. Raw Cow’s Milk Prevents the Development of Airway Inflammation in a Murine House Dust Mite-Induced Asthma Model. Front. Immunol. 2017, 8, 1045. [Google Scholar] [CrossRef]
- Abbring, S.; Wolf, J.; Ayechu Muruzabal, V.; Diks, M.A.P.; Alashkar Alhamwe, B.; Alhamdan, F.; Harb, H.; Renz, H.; Garn, H.; Garssen, J.; et al. Raw cow’s milk suppresses allergic symptoms in a murine model for food allergy—A potential role for epigenetic modifications. Nutrients. (under review).
- Committee on Infectious Diseases & Committee on Nutrition & American Academy of Pediatrics. Consumption of Raw or Unpasteurized Milk and Milk Products by Pregnant Women and Children. Pediatrics 2014, 133, 175–179. [Google Scholar] [CrossRef] [PubMed]
- Verordnung über die Güteprüfung und Bezahlung der Anlieferungsmilch (Milch-Güteverordnung). Available online: http://www.gesetze-im-internet.de/milchg_v/index.html (accessed on 26 March 2019).
- Brick, T.; Schober, Y.; Bocking, C.; Pekkanen, J.; Genuneit, J.; Loss, G.; Dalphin, J.C.; Riedler, J.; Lauener, R.; Nockher, W.A.; et al. Omega-3 fatty acids contribute to the asthma-protective effect of unprocessed cow’s milk. J. Allergy Clin. Immunol. 2016, 137, 1699–1706.e13. [Google Scholar] [CrossRef] [PubMed]
- Torrero, M.N.; Larson, D.; Hubner, M.P.; Mitre, E. CD200R surface expression as a marker of murine basophil activation. Clin. Exp. Allergy 2009, 39, 361–369. [Google Scholar] [CrossRef] [PubMed]
- Deurloo, D.T.; van Esch, B.C.; Hofstra, C.L.; Nijkamp, F.P.; van Oosterhout, A.J. CTLA4-IgG reverses asthma manifestations in a mild but not in a more “severe” ongoing murine model. Am. J. Respir. Cell Mol. Biol. 2001, 25, 751–760. [Google Scholar] [CrossRef] [PubMed]
- Abbring, S.; Kusche, D.; Roos, T.C.; Diks, M.A.P.; Hols, G.; Garssen, J.; Baars, T.; van Esch, B.C.A.M. Milk processing increases the allergenicity of cow’s milk-preclinical evidence supported by a human proof-of-concept provocation pilot. Clin. Exp. Allergy 2019. [Google Scholar] [CrossRef] [PubMed]
- Bakker-Zierikzee, A.M.; Alles, M.S.; Knol, J.; Kok, F.J.; Tolboom, J.J.; Bindels, J.G. Effects of infant formula containing a mixture of galacto- and fructo-oligosaccharides or viable Bifidobacterium animalis on the intestinal microflora during the first 4 months of life. Br. J. Nutr. 2005, 94, 783–790. [Google Scholar] [CrossRef]
- Polukort, S.H.; Rovatti, J.; Carlson, L.; Thompson, C.; Ser-Dolansky, J.; Kinney, S.R.; Schneider, S.S.; Mathias, C.B. IL-10 Enhances IgE-Mediated Mast Cell Responses and Is Essential for the Development of Experimental Food Allergy in IL-10-Deficient Mice. J. Immunol. 2016, 196, 4865–4876. [Google Scholar] [CrossRef]
- Coombes, J.L.; Siddiqui, K.R.; Arancibia-Carcamo, C.V.; Hall, J.; Sun, C.M.; Belkaid, Y.; Powrie, F. A functionally specialized population of mucosal CD103+ DCs induces Foxp3+ regulatory T cells via a TGF-beta and retinoic acid-dependent mechanism. J. Exp. Med. 2007, 204, 1757–1764. [Google Scholar] [CrossRef]
- Michalski, M.C.; Januel, C. Does homogenization affect the human health properties of cow’s milk? Trends Food Sci. Technol. 2006, 17, 423–437. [Google Scholar] [CrossRef]
- Niero, G.; Penasa, M.; Berard, J.; Kreuzer, M.; Cassandro, M.; De Marchi, M. Technical note: Development and validation of an HPLC method for the quantification of tocopherols in different types of commercial cow milk. J. Dairy Sci. 2018, 101, 6866–6871. [Google Scholar] [CrossRef] [PubMed]
- Wijga, A.H.; Smit, H.A.; Kerkhof, M.; de Jongste, J.C.; Gerritsen, J.; Neijens, H.J.; Boshuizen, H.C.; Brunekreef, B.; PIAMA. Association of consumption of products containing milk fat with reduced asthma risk in pre-school children: The PIAMA birth cohort study. Thorax 2003, 58, 567–572. [Google Scholar] [CrossRef] [PubMed]
- Van Neerven, R.J.; Knol, E.F.; Heck, J.M.; Savelkoul, H.F. Which factors in raw cow’s milk contribute to protection against allergies? J. Allergy Clin. Immunol. 2012, 130, 853–858. [Google Scholar] [CrossRef] [PubMed]
- Abbring, S.; Hols, G.; Garssen, J.; van Esch, B.C.A.M. Raw cow’s milk consumption and allergic diseases—The potential role of bioactive whey proteins. Eur. J. Pharmacol. 2019, 843, 55–65. [Google Scholar] [CrossRef] [PubMed]
- Perdijk, O.; van Splunter, M.; Savelkoul, H.F.J.; Brugman, S.; van Neerven, R.J.J. Cow’s Milk and Immune Function in the Respiratory Tract: Potential Mechanisms. Front. Immunol. 2018, 9, 143. [Google Scholar] [CrossRef]
- Brick, T.; Ege, M.; Boeren, S.; Bock, A.; von Mutius, E.; Vervoort, J.; Hettinga, K. Effect of Processing Intensity on Immunologically Active Bovine Milk Serum Proteins. Nutrients 2017, 9, 963. [Google Scholar] [CrossRef]
- Rankin, S.A.; Christiansen, A.; Lee, W.; Banavara, D.S.; Lopez-Hernandez, A. Invited review: The application of alkaline phosphatase assays for the validation of milk product pasteurization. J. Dairy Sci. 2010, 93, 5538–5551. [Google Scholar] [CrossRef] [PubMed]
- Beumer, C.; Wulferink, M.; Raaben, W.; Fiechter, D.; Brands, R.; Seinen, W. Calf intestinal alkaline phosphatase, a novel therapeutic drug for lipopolysaccharide (LPS)-mediated diseases, attenuates LPS toxicity in mice and piglets. J. Pharmacol. Exp. Ther. 2003, 307, 737–744. [Google Scholar] [CrossRef]
- Tuin, A.; Poelstra, K.; de Jager-Krikken, A.; Bok, L.; Raaben, W.; Velders, M.P.; Dijkstra, G. Role of alkaline phosphatase in colitis in man and rats. Gut 2009, 58, 379–387. [Google Scholar] [CrossRef]
- Whitehouse, J.S.; Riggle, K.M.; Purpi, D.P.; Mayer, A.N.; Pritchard, K.A., Jr.; Oldham, K.T.; Gourlay, D.M. The protective role of intestinal alkaline phosphatase in necrotizing enterocolitis. J. Surg. Res. 2010, 163, 79–85. [Google Scholar] [CrossRef]
- Lalles, J.P. Intestinal alkaline phosphatase: Multiple biological roles in maintenance of intestinal homeostasis and modulation by diet. Nutr. Rev. 2010, 68, 323–332. [Google Scholar] [CrossRef] [PubMed]
- Akdis, M.; Blaser, K.; Akdis, C.A. T regulatory cells in allergy: Novel concepts in the pathogenesis, prevention, and treatment of allergic diseases. J. Allergy Clin. Immunol. 2005, 116, 961–968. [Google Scholar] [CrossRef] [PubMed]
- Perez-Machado, M.A.; Ashwood, P.; Thomson, M.A.; Latcham, F.; Sim, R.; Walker-Smith, J.A.; Murch, S.H. Reduced transforming growth factor-beta1-producing T cells in the duodenal mucosa of children with food allergy. Eur. J. Immunol. 2003, 33, 2307–2315. [Google Scholar] [CrossRef]
- Scott, C.L.; Aumeunier, A.M.; Mowat, A.M. Intestinal CD103+ dendritic cells: Master regulators of tolerance? Trends Immunol. 2011, 32, 412–419. [Google Scholar] [CrossRef] [PubMed]
- Mucida, D.; Pino-Lagos, K.; Kim, G.; Nowak, E.; Benson, M.J.; Kronenberg, M.; Noelle, R.J.; Cheroutre, H. Retinoic acid can directly promote TGF-beta-mediated Foxp3(+) Treg cell conversion of naive T cells. Immunity 2009, 30, 471–472. [Google Scholar] [CrossRef] [PubMed]
- Jang, M.H.; Sougawa, N.; Tanaka, T.; Hirata, T.; Hiroi, T.; Tohya, K.; Guo, Z.; Umemoto, E.; Ebisuno, Y.; Yang, B.G.; et al. CCR7 is critically important for migration of dendritic cells in intestinal lamina propria to mesenteric lymph nodes. J. Immunol. 2006, 176, 803–810. [Google Scholar] [CrossRef]
- Worbs, T.; Forster, R. A key role for CCR7 in establishing central and peripheral tolerance. Trends Immunol. 2007, 28, 274–280. [Google Scholar] [CrossRef] [PubMed]
- Spahn, T.W.; Weiner, H.L.; Rennert, P.D.; Lugering, N.; Fontana, A.; Domschke, W.; Kucharzik, T. Mesenteric lymph nodes are critical for the induction of high-dose oral tolerance in the absence of Peyer’s patches. Eur. J. Immunol. 2002, 32, 1109–1113. [Google Scholar] [CrossRef]
- Lluis, A.; Depner, M.; Gaugler, B.; Saas, P.; Casaca, V.I.; Raedler, D.; Michel, S.; Tost, J.; Liu, J.; Genuneit, J.; et al. Increased regulatory T-cell numbers are associated with farm milk exposure and lower atopic sensitization and asthma in childhood. J. Allergy Clin. Immunol. 2014, 133, 551–559. [Google Scholar] [CrossRef]
- Bates, J.M.; Akerlund, J.; Mittge, E.; Guillemin, K. Intestinal alkaline phosphatase detoxifies lipopolysaccharide and prevents inflammation in zebrafish in response to the gut microbiota. Cell Host Microbe 2007, 2, 371–382. [Google Scholar] [CrossRef]
- Malo, M.S.; Alam, S.N.; Mostafa, G.; Zeller, S.J.; Johnson, P.V.; Mohammad, N.; Chen, K.T.; Moss, A.K.; Ramasamy, S.; Faruqui, A.; et al. Intestinal alkaline phosphatase preserves the normal homeostasis of gut microbiota. Gut 2010, 59, 1476–1484. [Google Scholar] [CrossRef] [PubMed]
- Lalles, J.P. Intestinal alkaline phosphatase: Novel functions and protective effects. Nutr. Rev. 2014, 72, 82–94. [Google Scholar] [CrossRef]
- Schouten, B.; van Esch, B.C.; van Thuijl, A.O.; Blokhuis, B.R.; Groot Kormelink, T.; Hofman, G.A.; Moro, G.E.; Boehm, G.; Arslanoglu, S.; Sprikkelman, A.B.; et al. Contribution of IgE and immunoglobulin free light chain in the allergic reaction to cow’s milk proteins. J Allergy Clin Immunol. 2010, 125, 1308–1314. [Google Scholar] [CrossRef]
- Sampson, H.A.; Aceves, S.; Bock, S.A.; James, J.; Jones, S.; Lang, D.; Nadeau, K.; Nowak-Wegrzyn, A.; Oppenheimer, J.; Perry, T.T.; et al. Food allergy: A practice parameter update-2014. J. Allergy Clin. Immunol. 2014, 134. [Google Scholar] [CrossRef]
- Schouten, B.; van Esch, B.C.; Hofman, G.A.; van den Elsen, L.W.; Willemsen, L.E.; Garssen, J. Acute allergic skin reactions and intestinal contractility changes in mice orally sensitized against casein or whey. Int. Arch. Allergy Immunol. 2008, 147, 125–134. [Google Scholar] [CrossRef]
- Van Esch, B.C.; Schouten, B.; Hofman, G.A.; van Baalen, T.; Nijkamp, F.P.; Knippels, L.M.; Willemsen, L.E.; Garssen, J. Acute allergic skin response as a new tool to evaluate the allergenicity of whey hydrolysates in a mouse model of orally induced cow’s milk allergy. Pediatr. Allergy Immunol. 2010, 21, e780–e786. [Google Scholar] [CrossRef] [PubMed]
- Van Esch, B.C.; van Bilsen, J.H.; Jeurink, P.V.; Garssen, J.; Penninks, A.H.; Smit, J.J.; Pieters, R.H.; Knippels, L.M. Interlaboratory evaluation of a cow’s milk allergy mouse model to assess the allergenicity of hydrolysed cow’s milk based infant formulas. Toxicol. Lett. 2013, 220, 95–102. [Google Scholar] [CrossRef] [PubMed]


© 2019 by the authors. Licensee MDPI, Basel, Switzerland. This article is an open access article distributed under the terms and conditions of the Creative Commons Attribution (CC BY) license (http://creativecommons.org/licenses/by/4.0/).
Share and Cite
Abbring, S.; Ryan, J.T.; Diks, M.A.P.; Hols, G.; Garssen, J.; van Esch, B.C.A.M. Suppression of Food Allergic Symptoms by Raw Cow’s Milk in Mice is Retained after Skimming but Abolished after Heating the Milk—A Promising Contribution of Alkaline Phosphatase. Nutrients 2019, 11, 1499. https://doi.org/10.3390/nu11071499
Abbring S, Ryan JT, Diks MAP, Hols G, Garssen J, van Esch BCAM. Suppression of Food Allergic Symptoms by Raw Cow’s Milk in Mice is Retained after Skimming but Abolished after Heating the Milk—A Promising Contribution of Alkaline Phosphatase. Nutrients. 2019; 11(7):1499. https://doi.org/10.3390/nu11071499
Chicago/Turabian StyleAbbring, Suzanne, Joseph Thomas Ryan, Mara A.P. Diks, Gert Hols, Johan Garssen, and Betty C.A.M. van Esch. 2019. "Suppression of Food Allergic Symptoms by Raw Cow’s Milk in Mice is Retained after Skimming but Abolished after Heating the Milk—A Promising Contribution of Alkaline Phosphatase" Nutrients 11, no. 7: 1499. https://doi.org/10.3390/nu11071499
APA StyleAbbring, S., Ryan, J. T., Diks, M. A. P., Hols, G., Garssen, J., & van Esch, B. C. A. M. (2019). Suppression of Food Allergic Symptoms by Raw Cow’s Milk in Mice is Retained after Skimming but Abolished after Heating the Milk—A Promising Contribution of Alkaline Phosphatase. Nutrients, 11(7), 1499. https://doi.org/10.3390/nu11071499