Article

The Catalase Gene Family in Cotton: Genome-Wide Characterization and Bioinformatics Analysis

State Key Laboratory of Crop Biology, College of Agronomy, Shandong Agricultural University, NO. 61 Daizong Street, Tai’an 271018, China
*
Author to whom correspondence should be addressed.
Cells 2019, 8(2), 86; https://doi.org/10.3390/cells8020086
Submission received: 26 December 2018 / Revised: 19 January 2019 / Accepted: 21 January 2019 / Published: 24 January 2019
(This article belongs to the Special Issue Bioinformatics and Computational Biology 2019)

Abstract

:
Catalases (CATs), which were coded by the catalase gene family, were a type notably distinguished ROS-metabolizing proteins implicated to perform various physiological functions in plant growth, development and stress responses. However, no systematical study has been performed in cotton. In the present study, we identified 7 and 7 CAT genes in the genome of Gossypium hirsutum L. Additionally, G. barbadense L., respectively. The results of the phylogenetic and synteny analysis showed that the CAT genes were divided into two groups, and whole-genome duplication (WGD) or polyploidy events contributed to the expansion of the Gossypium CAT gene family. Expression patterns analysis showed that the CAT gene family possessed temporal and spatial specificity and was induced by the Verticillium dahliae infection. In addition, we predicted the putative molecular regulatory mechanisms of the CAT gene family. Based on the analysis and preliminary verification results, we hypothesized that the CAT gene family, which might be regulated by transcription factors (TFs), alternative splicing (AS) events and miRNAs at different levels, played roles in cotton development and stress tolerance through modulating the reactive oxygen species (ROS) metabolism. This is the first report on the genome-scale analysis of the cotton CAT gene family, and these data will help further study the roles of CAT genes during stress responses, leading to crop improvement.

1. Introduction

Reactive oxygen species (ROS), such as superoxide anion (O2), hydrogen peroxide (H2O2), hydroxyl radical (·OH), singlet oxygen (1O2), are formed as a toxic byproduct of the normal metabolism of oxygen (O2) and are also considered to play a crucial role in plant biology as signaling molecules [1]. Recent several studies have revealed that ROS are essential for maintaining normal cellular functions, as opposed to having a toxic effect on cells [2]. Even cell death that was previously considered a result from oxidative damage is now thought to be a ROS-mediated physiological pathway for programmed cell death, rather than directly killing the cells [3,4]. Additionally, ROS levels that are too low are cytostatic for cells, whereas ROS levels that are too high are cytotoxic [5]. Thus, maintaining a basal level of ROS is essential for proper cellular ROS signaling, and this level is achieved by the fine balance between ROS production and ROS scavenging [6]. The major ROS-scavenging pathways of plants include superoxide dismutases (SODs), found in almost all cellular compartments, the water-water cycle in chloroplasts; the ascorbate-glutathione cycle in chloroplasts, cytosol, mitochondria, apoplast and peroxisomes; glutathione peroxidases (GPXs) cycle in cytosol; and catalases (CATs) in peroxisomes [7,8]. Among these ROS-metabolizing proteins, CATs, which are indispensable for ROS detoxification during stress, are highly active enzymes that do not require cellular reductants as they primarily catalyze a dismutase reaction [9,10].
CATs, which can convert H2O2 into water (H2O) and O2, is an enzyme found in nearly all living organisms. In animals, CATs are encoded by a unique gene. In plants, CATs are encoded by a small multi-gene family and have been reported in different species. For example, there are three gene members in Arabidopsis thaliana (L.) Heynh. [11], tobacco (Nicotiana plumbaginifolia Viviani) [12], maize (Zea mays L.) [13], rice (Oryza sativa L.) [14] and pumpkin (Cucurbita Linn.) [15]; 4 in cucumber (Cucumis sativus L.) [16]; 2 in common barley (Hordeum vulgare L.) [17]; and 1 in sweet potato (Ipomoea batatas (L.) Poir.) [18], castor bean (Ricinus communis L.) [19] and tomato (Lycopersicon esculentum Mill.) [20].
Many studies have suggested that the gene expression of plant CATs is regulated temporally and spatially, is involved in regulating growth and development and responds to environmental stimuli [9,18,21,22,23]. In Arabidopsis, CAT1 is an important H2O2 scavenger that is generated under various abiotic stresses. CAT2 and CAT3 are major players in the removal of H2O2 contributed to ROS homeostasis in light or darkness, respectively. Additionally, CAT2 and CAT3 are the major isoforms in Arabidopsis rosette tissue [10]. Besides, CAT2 is induced under cold and drought stresses, and CAT3 is mainly activated by abscisic acid and oxidative treatments as well as at the senescence stage [11]. Studying catalase mutants and knockdowns in Arabidopsis, it was confirmed that CAT2 encodes the major leaf catalase isoform and that the function of this enzyme is closely linked to photorespiration [24]. The Arabidopsis mutants of CAT2 typically display patches of chlorosis and necrotic lesions [25]. In sweet potato, the expression of CAT1 is induced by ethephon and regulated by reduced glutathione, the NADPH oxidase inhibitor diphenylene iodonium (DPI), the calcium ion chelator EGTA and cycloheximide [18]. In tobacco, CAT1 and CAT2 are detected in non-senescent leaves; the expression level of CAT2, but not CAT1, is significantly decreased in senescent leaves compared to non-senescent leaves. CAT3 is detected in both non-senescent and senescing leaves [26]. Transgenic tobacco plants expressing the maize CAT2 gene have enhanced the resistance to pathogen infection [27]. In rice, the expression of CatA and CatC is controlled by circadian rhythm, with a morning-specific phase for CatC and an evening-specific phase for CatA. Additionally, the over-expressed CatA and CatC, but not over-expressed CatB, improved drought stress tolerance in transgenic rice. However, over-expressed CatB exhibited root growth inhibition [14]. Under salt stress, CatC interacts with the salt tolerance receptor-like cytoplasmic kinase 1 (STRK1) via palmitoylation, and CatC is phosphorylated mainly at Tyr210 and activated by STRK1, thereby regulating H2O2 homeostasis and improving the salt tolerance in rice [9]. These data, which were displayed as a table (Table S1), have suggested that some important biological processes are always related with the transcription of CAT genes, and subsequently alter the enzyme activity of CAT, leading to redox homeostasis in plant cells. However, tissue- and/or stress-specific expression profiles and their regulation of CAT genes are still largely unknown in cotton.
Cotton (Gossypium spp.), among which only four species, including two allotetraploids (Gossypium hirsutum L. and G. barbadense L.) and two diploids (G. herbaceum L. and G. arboreum L.), producing spannable fiber, is a widely cultivated polyploid crop and provides fiber, seed oil, and protein meal [28]. Among the two cultivated allotetraploids, the upland cotton G. hirsutum L. is characterized by its high yield yet moderate fiber qualities, whereas the sea-island cotton G. barbadense L. accounts for nearly 3% of the world’s cotton production and is famous for its superior quality fibers, based on the length, strength and fineness of its fibers [29]. Although they have a common ancestor [30], upland cotton and sea-island cotton have diverged with regards to their resistance to Verticillium wilt (VW), exhibiting generally susceptible and strongly resistant characteristics, respectively [29]. VW is one of the most important diseases in cotton and caused by the soil-borne fungal pathogen Verticillium dahliae Kleb., which invades over 350 species of eudicot plant hosts worldwide [31]. VW will lead to chlorosis and the wilting of leaves or defoliation, the discoloration of vascular tissues and, ultimately, even death and is especially destructive in upland cotton [31]. Several studies of the defense responses to VW in cotton have demonstrated that the rapid production of ROS (also termed ROS burst) occurs in the apoplast during the recognition of pathogen infection. The ROS burst is considered an important component of the early plant immune response. Accumulating evidence has suggested that many VW-related genes, such as GbWARKY1, GbERF, GbNRX1, GbEDS1, GhSSN, GhMLP28, GhNDR1, GhMKK2 and GhBAK1, play a crucial role in the homeostasis of apoplastic ROS in response to V. dahliae Kleb. infection in cotton [32,33,34,35,36]. Recently, the regulation mechanism of CAT-mediated ROS homeostasis has been revealed when rice is subjected to salt stress [9]. However, among plants, especially in cotton, the role and molecular regulatory system of CATs that are responsible for ROS homeostasis during the immune response of VW, is not well understood.
The release of different cotton whole-genome sequence data, including Gossypium arboreum L. [37], Gossypium raimondii Ulbr. [38], Gossypium hirsutum L. [39] and Gossypium barbadense L. [40], has made it possible to systematically identify and analyze the cotton CAT genes on a genome-scale level, and has thus enriched our understanding on their role and molecular regulatory system in VW resistance in cotton. In this research, we systematically identify CAT genes in two sequenced allotetraploids cotton species for the first time, and analyze their genomic organization, gene structure and phylogenetic relationships. Subsequently, the expression patterns of the CAT gene family in response to V. dahliae Kleb. infection is analyzed. Finally, cis-elements in the putative promoters of CAT are analyzed, and miRNA target sites of CAT are predicted. Our study provided a comprehensive analysis of the Gossypium CAT gene family and clarified the important roles of the CAT genes in VW resistance, and provided important information for further exploring the functional differences between two allotetraploid cotton species.

2. Materials and Methods

2.1. Databases

The four cotton genome files (Gossypium arboreum L., BGI; Gossypium raimondii Ulbr., JGI; Gossypium hirsutum L., NAU; Gossypium barbadense L., NAU) were downloaded from the Cotton Functional Genomics Database (CottonFGD) (https://cottonfgd.org/) [41]. The four other plant genome files (Arabidopsis thaliana (Linn.) Heynh.; Glycine max (Linn.) Merr.; Theobroma cacao L.; Vitis vinifera L.) were obtained from the JGI database (http://www.phytozome.net).

2.2. Sequence Identification and Functional Annotation Analysis

The CAT genes in the genomes of four kinds of cotton types and the other four plants were identified as described in our previous study [8]. Briefly, the HMMER 3.1 (http://www.hmmer.org/) in the default parameter settings and BLAST algorithm for Proteins (BLASTP) with the threshold expectation value set to 0.0001 were performed using the Hidden Markov Model (HMM) (version 3.0) profiles of the Catalase (PF00199) and Catalase-related immune-responsive domain (PF06628) obtained from the Pfam database (http://pfam.xfam.org/) as the query. Then, we merged all hits obtained using HMM and BLASTP searches and removed the redundant hits. All non-redundant protein sequences were retrieved and further analyzed with SMART (Simple Modular Architecture Research Tool) (version 8.0) (http://smart.embl-heidelberg.de) and InterProScan (version 4.8) (http://www.ebi.ac.uk/interpro/) to examine the inclusion of the conserved domain of the CAT protein in each candidate sequence. Finally, the identified candidate CAT genes were further confirmed manually to eliminate spurious sequences.
The details of upland cotton and sea-island cotton CAT genes, including gene features, transcript features and protein statistics, were collected from CottonFGD (https://cottonfgd.org/). The exons-intron structures of CAT genes were graphically visualized by the Gene Structure Draw Server (GSDraw) web server (http://www.bioinfogenome.net/piece/). Predictions of subcellular localizations and Gene Ontology (GO) were performed with the PredictProtein web server (https://open.predictprotein.org/). The Gene Ontology (GO) annotation was performed with the Gene Ontology Consortium web server (http://geneontology.org/) using A. thaliana as the reference species, based on their molecular functions, biological processes, and cellular localizations. The results of the GO annotation were visualized and plotted by the Web Gene Ontology Annotation Plot (WEGO, version 2.0) (http://wego.genomics.org.cn/). The conserved domains of all the protein sequences encoded by candidate CAT genes were presented by the IBS software (version 1.0.3) (http://ibs.biocuckoo.org/).

2.3. Phylogenetic and Synteny Analysis

The full-length amino acid sequence encoded by CAT genes were aligned with the ClustalW program (version 2.0) with the default settings, and then manually adjusted in MEGA6.06 [42]. Subsequently, we constructed the neighbor-joining (NJ) tree with 1000 bootstrap replicates using the Jones-Taylor-Thornton (JTT) substitution model in MEGA 6.06 with a cut-off value of 60% for the condensed tree. Additionally, the phylogenetic tree of Gossypium and four other genomes descended from common eudicot genome ancestor in Rosids used in the study was gathered from the PLAZA database (version 4.0) [43]. MCScanX, a package developed by the Plant Genome Duplication Database (PGDD) (http://chibba.pgml.uga.edu/duplication/), was used to perform a synteny examination of paralogous genes among the genomes of the four cotton species said above based on a previously described method [8]. The results of the synteny analysis were visualized with Circos-0.69 (http://circos.ca/).

2.4. Transcription Factor Binding Sites Prediction

The genomic sequences of 1.5 kb upstream of the translation start site (TSS) of each CAT gene was extracted from the assembly files of G. hirsutum L. and G. barbadense L. downloaded from CottonFGD (https://cottonfgd.org/). The putative transcription factor (TF) binding sites (TFBSs) of the CAT gene promoter regions were predicted using the Binding Site Prediction tool in the PlantTFDB 4.0 serve, a central hub for TF and regulatory interactions in plants (http://planttfdb.cbi.pku.edu.cn/), with a stricter parameter: threshold p-value ≤ 1 × 10⁻⁶. Using the sets of high-quality, non-redundant binding motifs of TFs for 156 species with whole genome sequences, the putative TFBSs of the CAT gene promoter regions were scanned.

2.5. Potential Alternative Splicing Events Analysis

We gathered all potential isoforms of the upland cotton and sea-island cotton CAT gene family from CottonFGD (https://cottonfgd.org/) with the JBrowse tool. Transcript structures of each isoform were graphically visualized by the Gene Structure Display Server (GSDS) (version 2.0) (http://gsds.cbi.pku.edu.cn/). Alternative splicing (AS) events were identified from transcript structures of each isoform and classified into intron retention (IR), exon skipping (ES), alternative 5′ donor sites (AD) and alternative 3′ acceptor sites (AA).

2.6. Putative microRNA Target Sites Analysis

We obtained microRNA (miRNA) sequences of upland cotton and sea-island cotton from miRBase (http://www.mirbase.org/), the Plant MicroRNA database (http://bioinformatics.cau.edu.cn/PMRD/), the Cotton EST database (http://www.leonxie.com/) and published articles [44,45,46,47,48,49,50,51,52]. CAT genes targeted by miRNAs were predicted by searching their coding sequence (CDS) regions for complementary sequences using the psRNATarget server with default parameters, except maximum expectation (E) = 4.0 (http://plantgrn.noble.org/psRNATarget/home). We selected the targeted sites with high degrees of complementarity shown in the Figure.

2.7. Plant Growth Conditions and Fungal Pathogen Infection Assays

Seeds of cotton (G. hirsutum L. cv. SF06 and G. barbadense L. cv. Hai7124) were surface-disinfected in 0.5% sodium hypochlorite (NaClO) for 5 min, and then washed five times with sterile distilled water. After they were transferred to sterile distilled water soaked sterile gauzes in Petri dishes (90-mm in diameter), they were placed in a biochemical incubator at room temperature (RT) for 48 h until they germinated. Any seeds presenting internal fungal contamination were discarded. Seedlings of similar size were selected and sown on commercial sterilized soil at 25/23 °C (day/night), with a 16 h light/8 h dark schedule for 2 weeks.
Fungal pathogen inoculations were performed using V. dahliae (strain Vd414, a highly toxic and defoliant strain). The strain was cultivated in a Potato Dextrose Agar (PDA) plate at 25 °C for one week from storage at –80 °C, and then high activity hyphae were collected and then cultivated in Potato Dextrose Broth (PDB) medium at 25 °C for 3–5 days. The suspension liquid was filtered through four layers of gauze (to remove mycelia), and the conidial concentration was adjusted to approximately 107 spores per ml with sterile distilled water for inoculation.
The two-week-old seedlings of the susceptible cultivar SF06 of G. hirsutum L. Additionally, the resistant cultivar Hai7124 of G. barbadense L. were inoculated with 107 spores per ml of Vd414 using the root dip method. Seedlings were gently uprooted, rinsed in sterile water, inoculated into a spore suspension for 50 min, and then the inoculated plants were returned to new pots containing sterilized soil and incubated at 25 °C under a 16 h photoperiod. Six individual seedling roots were collected at 0, 6, 12 and 24 h post inoculation. Control plants were treated with sterile distilled water in the same way, and all roots samples were immediately frozen in liquid nitrogen and stored at –80 °C until total RNA extraction.

2.8. RNA Isolation and Expression Profiling Analysis

Total RNA from 100 mg of plant samples was isolated using the RNAprep Pure Plant Kit (Polysaccharides & Polyphenolics-rich, DP441) (TIANGEN, Beijing, China). The concentrations of the isolated RNA samples were determined by 1.5% agarose gel electrophoresis and a NanoDrop 2000 Spectrophotometer (Thermo Fisher Scientific, Wilmington, DE, USA). Additionally, the RNA samples (1 μg per reaction) were reversely transcribed into complementary DNA (cDNA) using the Mir-X™ miRNA First-Strand Synthesis Kit (TaKaRa, Dalian, China). The reverse transcription polymerase chain reaction (RT-PCR) was performed to validate the accuracy of alternative splicing (AS) events. The following program was used for RT-PCR: 50 °C for 30 min, 94 °C for 2 min followed by 30 cycles at 94 °C for 30 s, 60 °C for 30 s and 72 °C for 30 s, followed by a 5 min extension step at 72 °C. The PCR products were separated on agarose gel electrophoresis and quantified using a Gel Imaging and Analysis System (Beijing Sage, China). Quantitative polymerase chain reaction (qPCR) was performed using a QuantStudio™ 6 Flex Real-Time PCR System (Applied Biosystems™, Carlsbad, CA, USA) and SYBR® Premix Ex Taq™II (Tli RNaseH Plus) (RR820A) (TaKaRa, Dalian, China) with three biological replicates and three technical replicates in a 20-μL reaction volume, which contained 1.6 μL of diluted cDNA template. PCRs included an initial denaturation at 95 °C for 3 min, followed by 40 cycles at 95 °C for 10 s, 60 °C for 20 s, and 72 °C for 30 s in a 96-well plate. Following the PCR, a melting curve analysis was performed. The cycle threshold (Ct) was used for the relative quantification of the input target number. Cotton ubiquitin 7 (UBQ7) was used as an endogenous control. Relative fold difference represents the number of treated target gene transcript copies relative to the number of untreated gene transcript copies and was calculated according to the 2−ΔΔCT method [8]. All gene-specific primers or miRNA-specific 5′-primers were gathered from the qPrimerDB database (http://biodb.swu.edu.cn/qprimerdb) [53], the ICG database (http://icg.big.ac.cn/index.php/Main_Page) [54], or designed using Primer Premier 5.0 and checked by the Blast tool (Table S2).
The expression value (FPKMs, fragments per kilobase per million reads) of cotton, which was calculated from high-throughput RNA-sequencing data and gathered from ccNET (http://structuralbiology.cau.edu.cn/gossypium/) and CottonFGD (https://cottonfgd.org/), was used to systematically analyze the expression profiling of cotton CAT genes in different tissues and under different stresses. Gene expression levels were calculated according to the log2 of FPKMs values and the default empirical abundance threshold of FPKM > 1 was used to identify the expressed gene. The heat maps were plotted by using the Cluster 3.0 software and TreeView (version 3.0).

2.9. Gene Cloning, Vector Construction, Genetic Transformation

Based on the known sequences of two allotetraploid cotton species, the gene-specific primers were designed using Primer Premier 5.0 to amplify the homologous genes of CAT with complete open reading frames (ORFs) in G. hirsutum L. cv. SF06 and G. barbadense L. cv. Hai7124. Phanta® Max Super-Fidelity DNA Polymerase (Vazyme, Nanjing, China) was used in standard PCR reactions from cotton cDNA. The PCR product was ligated into the pEASY®-Blunt (TransGen, Beijing, China) to generate cloning vectors transformed into bacterial strains of E. coli DH5α. At least ten clones per gene were randomly selected to sequence.

3. Results

3.1. Identification of CAT Genes in Upland Cotton and Sea-Island Cotton

We used HMMER 3.1 and BLASTP to search for CAT genes in the two released allotetraploid cotton genomes with the HMM profiles of the Catalase (PF00199) and Catalase-related immune-responsive domain (PF06628) obtained from the Pfam database as the queries. Then, we used the SMART and InterProScan programs to verify the predicted sequences. A total of 7 and 7 putative CAT genes were identified in G. hirsutum L. and G. barbadense L., respectively. The gene names, locus IDs and other features were shown in Table 1.

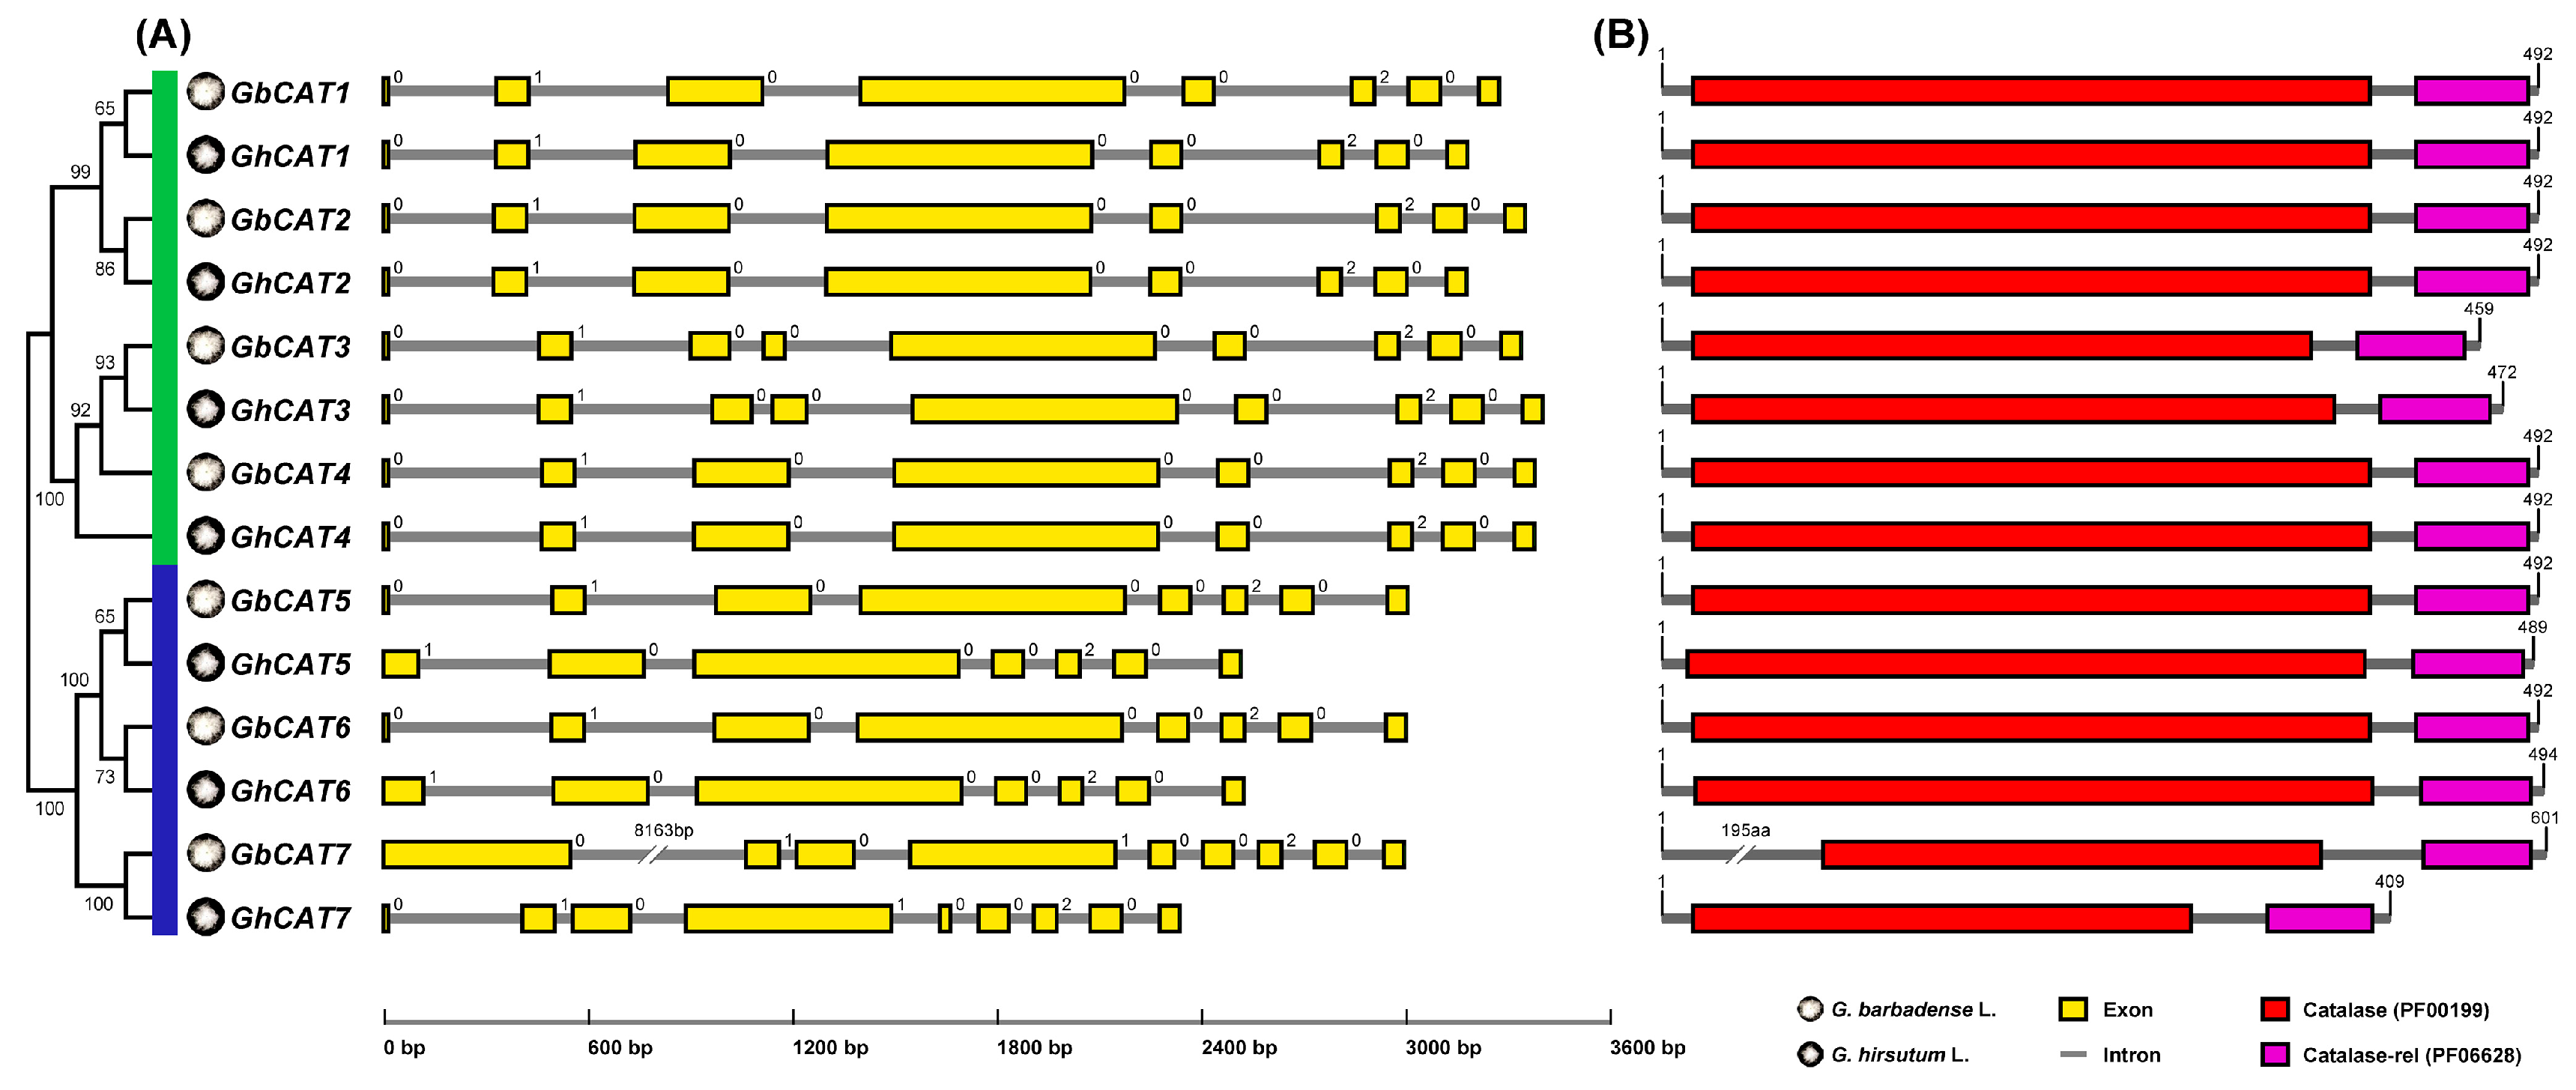
3.2. Sequence Analysis of GhCATs and GbCATs

Firstly, we collected the gene structure information of GhCATs and GbCATs in the gene annotation file and visualized it using the web tool (Figure 1A). The CAT genes of upland cotton and sea-island cotton clustering into the same group showed similar gene structures. The result of the GhCAT gene structure revealed that the numbers of exons varied between seven and nine, with the lowest numbers of exons in GhCAT5 and GhCAT6, and the highest numbers in GhCAT3 and GhCAT7. The result of the GbCAT gene structure revealed that the numbers of exons varied between eight and nine, with 8 exons in GbCAT1, GbCAT2, GbCAT4, GbCAT5 and GbCAT6, and 9 exons in GbCAT3 and GbCAT7.
Subsequently, the conserved domain of candidate GhCAT and GbCAT protein sequences were analyzed (Figure 1B). Based on the domain analysis, all conceptual GhCAT and GbCAT proteins contained one catalase core domain (PF00199, Catalase) and one catalase immune-responsive domain (PF06628, Catalase-rel). Catalase was the fundamental domain in catalases. Catalase-rel domain was an immune-responsive amphipathic octa-peptide that was found in the C-terminal of catalases. Then, we examined the chromosomal locations of GhCATs and GbCATs (Table 1). There were 7 chromosomes/scaffolds (upland cotton: chromosomes A1, A2, A5, A7, D1, D3, D5; sea-island cotton: chromosomes A1, A2, A5, A7, D1, D5, scaffold_0637), respectively, all harboring 7 CAT genes. Additionally, the computational prediction of protein localization indicated that all GhCATs and GbCATs were localized in peroxisome (Table 1).
In addition, we noticed that there are great differences in the length of the genomic sequence and coding sequence, and the size of the first exon, between GhCAT7 and GbCAT7, which was a pair of orthology genes. The first intron of GbCAT7 reached 8163 bp, and the first exon of GbCAT7 encoded 195 amino acids, which did not match with the conserved domains of classical catalases (Table 1 and Figure 1). Then, we found that the RNA-seq Junction Support value of the GbCAT7’s first intron was 0 from the Cotton Functional Genomics Database. The RNA-seq Junction Support value was the number of RNA-seq reads supporting each intron in the transcript structure page, and the larger the number, the more supporting reads and the more credible this gene structure was. Thus, we hypothesized that the gene structure of GbCAT7 was annotated wrong because there were some erroneous assemblies when sequencing the whole genomes of sea-island cotton. To test this, the experimental investigations were carried out. Firstly, we aligned the GbCAT7 CDS in the upland cotton genome database (cDNA, G. hirsutum (AD1), NAU) using the BLAST tool with the default parameters. The result showed that two neighboring upland cotton genes were hit: Gh_A07G1555 and GhCAT7 (Gh_A07G1556), respectively (Figure S1). Additionally, the alignment result of the CDS of GbCAT7 (GOBAR_AA20422) and Gh_A07G1555 supported our speculation, indicating that the sequence of GbCAT7 CDS annotated two genes in the upland cotton genome (Figure S2). Subsequently, we designed four primer pairs for PCR amplification of the actual GbCAT7 ORF using the cDNA of the two-week-old Hai7124′s leaf as a template. The four forward primers (F, F1, F2 and F3, the primer sequence see Table S2) were located at the TSS of GbCAT7 (GOBAR_AA20422), the upstream 31 bp of the first TSS that we conjectured, the first TSS that we conjectured, and the second TSS that we conjectured, respectively (Figure S1). Agarose gel electrophoresis showed that only the fourth primer pair (F2 and R) specifically amplified the objective band, suggesting that the actual TSS of GbCAT7 was the ATG contained by the F2 forward primer. The PCR product was verified by sequencing (Figure S1). These results confirmed our speculation, and the assembly of GOBAR_AA20422 in the database (G. barbadense (AD2), NAU) contained two gene transcripts; one was GbCAT7, and the other was the orthologous gene of Gh_A07G1555.

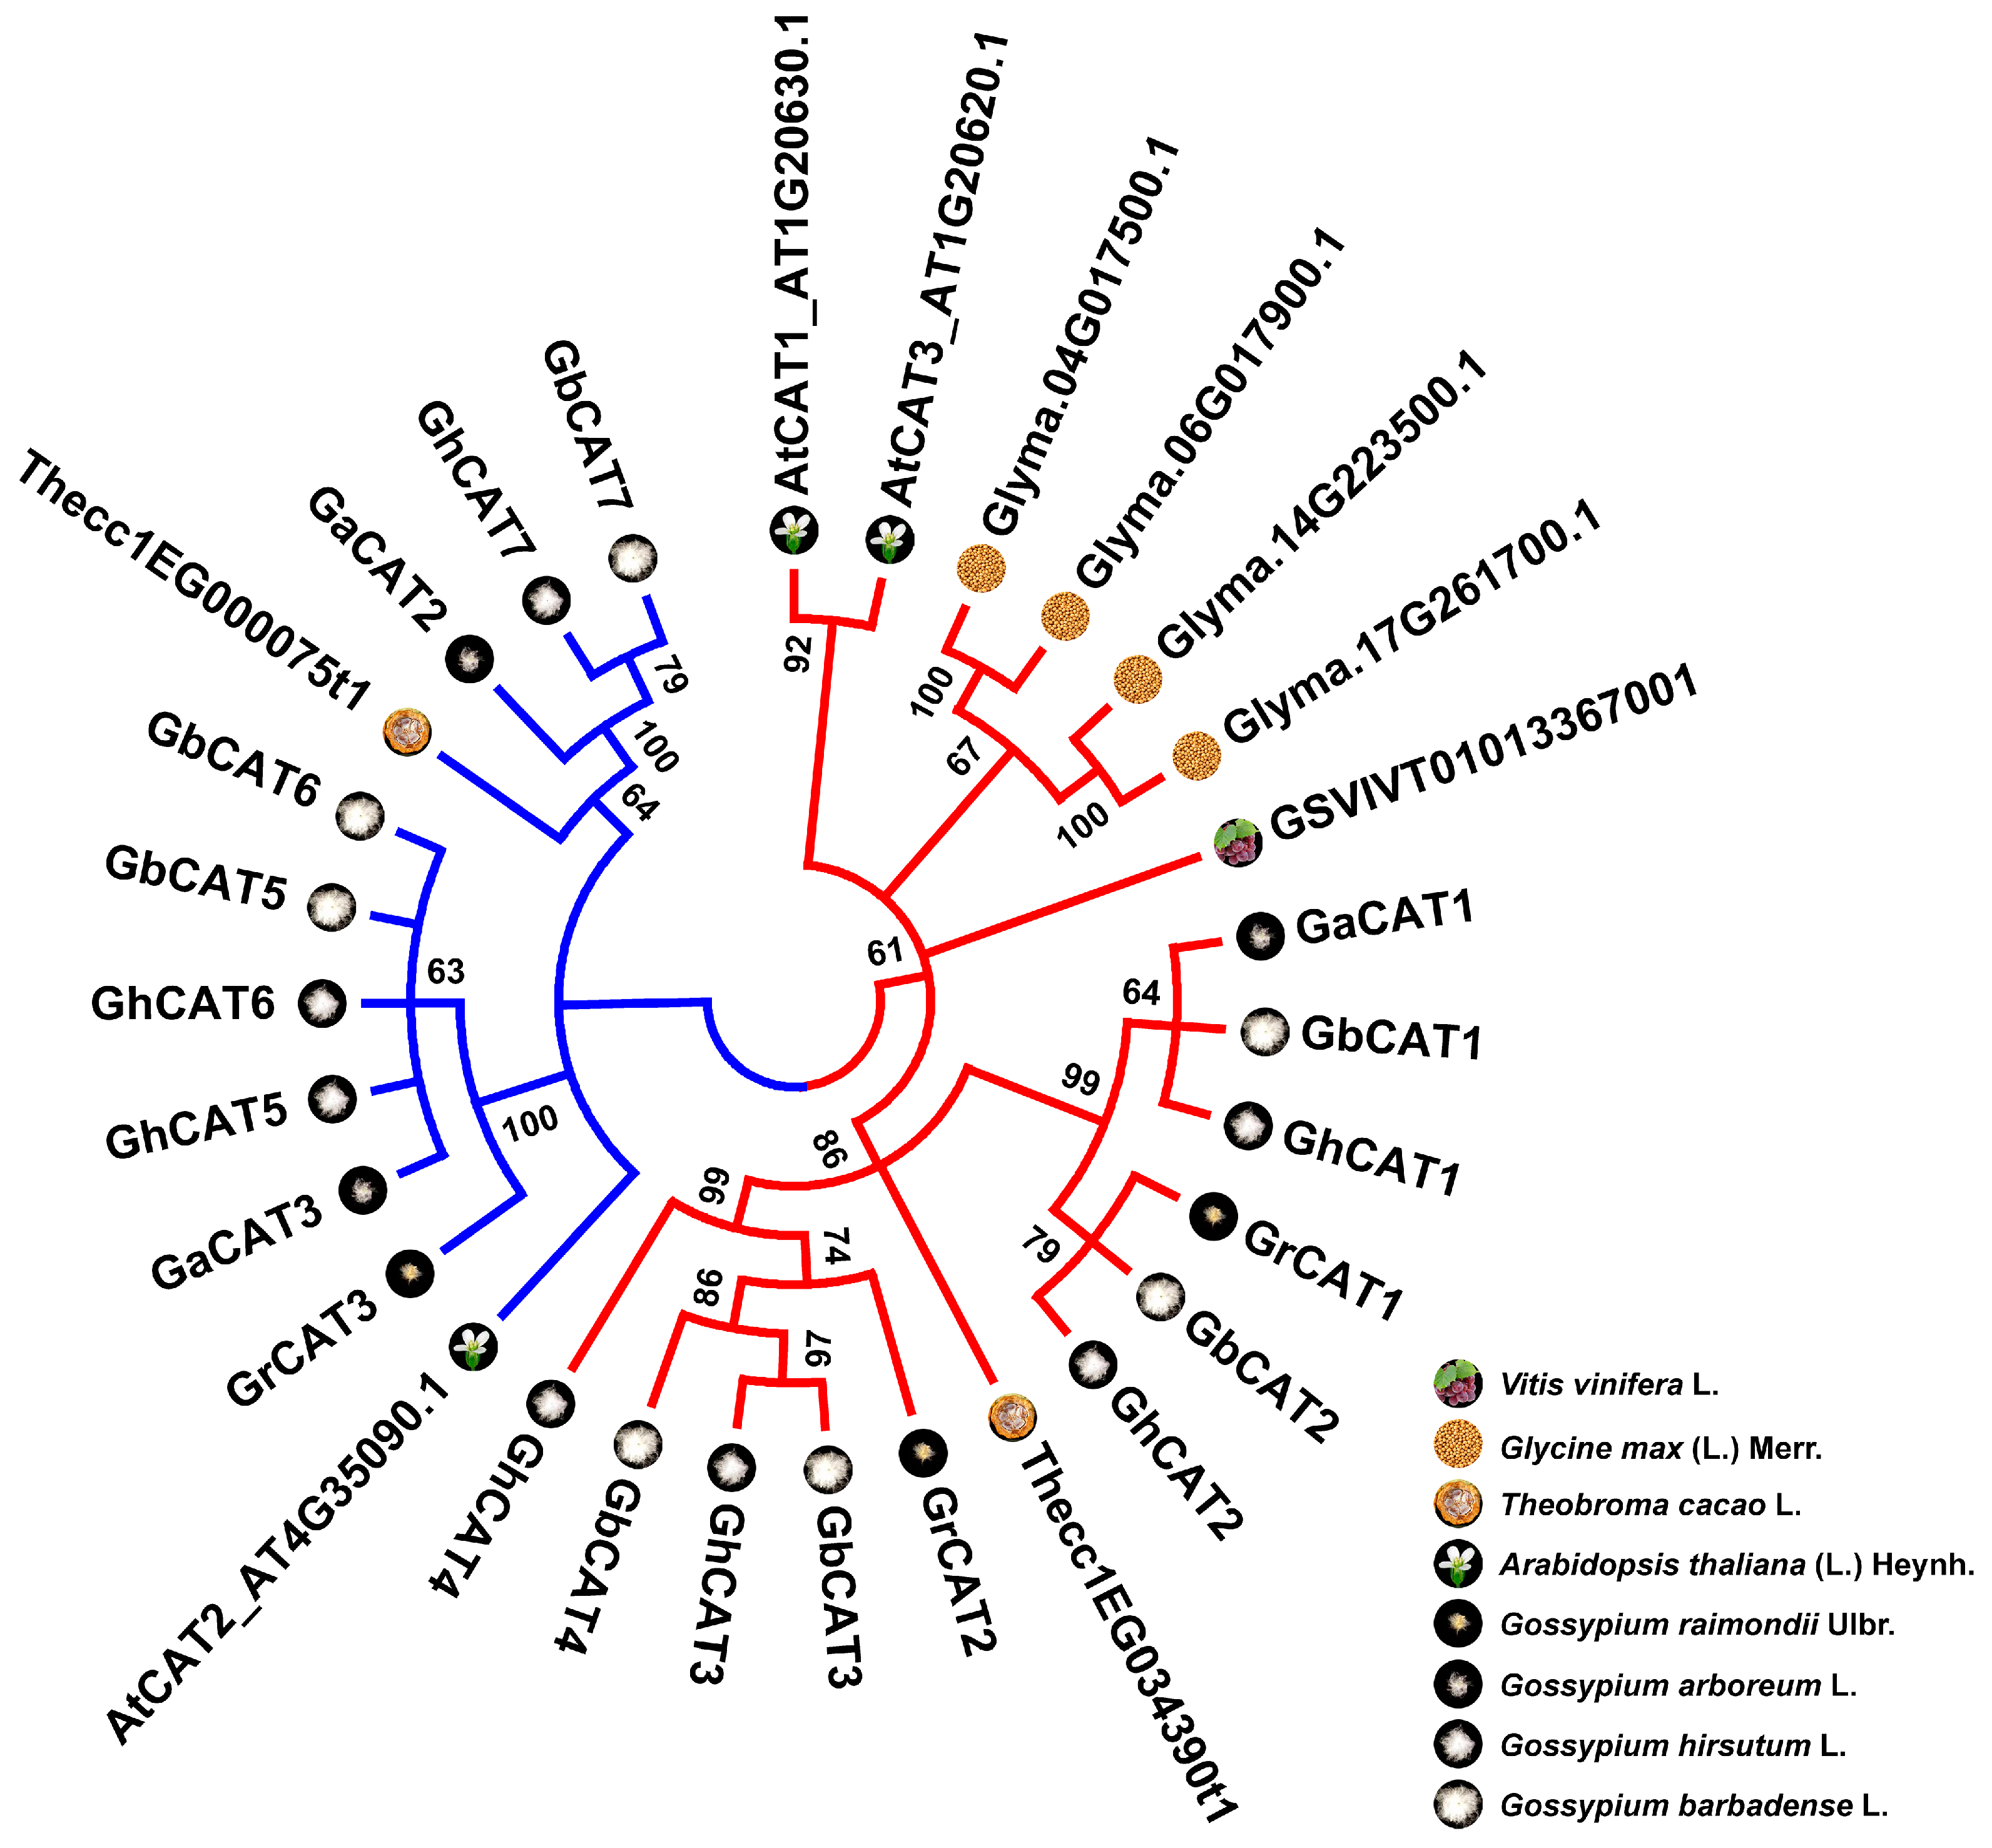
3.3. Phylogenetic Analysis of CAT Gene Family

To investigate the relationship of the plant evolution and CAT gene family expanding, using the same method identifying CAT genes in Gossypium genomes, we also searched for CAT genes in the genome of 4 other plants descended from the common eudicot genome ancestor in Rosids. Among these plants, the number of CATs was one in Vitis vinifera L., 4 in G. max (Linn.) Merr., 3 in A. thaliana (Linn.) Heynh., 2 in T. cacao L., 3 in G. arboreum L. and 3 in G. raimondii Ulbr., respectively (Figure S3 and Table S3). These CAT genes were clustered into two groups, which showed basic accordance with previous phylogenetic analyses of plant CATs (Figure 1A and Figure 2) [55]. Previous studies had revealed that, based on a phylogenetic analysis among prokaryotic and eukaryotic catalases, CATs could be classified into 3 clades. Clade 1 contained small subunit catalases from plants and a subset of bacteria; clade 2 contained large subunit catalases from fungi and a second subset of bacteria; and clade 3 contained small subunit catalases from bacteria, fungi, protists, animals, and plants [55].
Among the four species of Gossypium, the total CAT gene number of the two diploid cotton types, which were regarded as an A-genome ancestor and D-genome ancestor of the two allotetraploid cotton types, were basically equal to G. hirsutum L. and G. barbadense L. Additionally, the CATs consisting in the At-subgenome of upland cotton and sea-island cotton were mainly clustered with the CATs of G. arboreum L., and the CATs consisting in the Dt-subgenome were mainly clustered with the CATs of G. raimondii Ulbr. (Figure 2). The result was consistent with the hypothetical consequence of two diploid cotton species reunited geographically and followed by polyploidization to form the allopolyploid cotton types approximately 1–2 million years ago (Mya) [39,40], suggesting that the CAT gene family of allotetraploid cotton types might expand by the hybridization and subsequent polyploidization event.
In terms of the eight species in Rosids, the gene number and phylogeny of CATs were basically consistent with the genome paleo-history (Figure 2 and Figure S3). Rosids had been shown to evolve through rounds of paleo-polyploidy [56,57], and two types of events—an ancestral event (referenced as γ) and lineage-specific events (referenced as α, β and 1 to 4)—have been reported in the literature for Rosids (Figure S3). The result showed that the evolution and expanding of the CAT gene family in Rosids might be driven by whole-genome duplication (WGD), or polyploidy, followed by gene loss and diploidization.

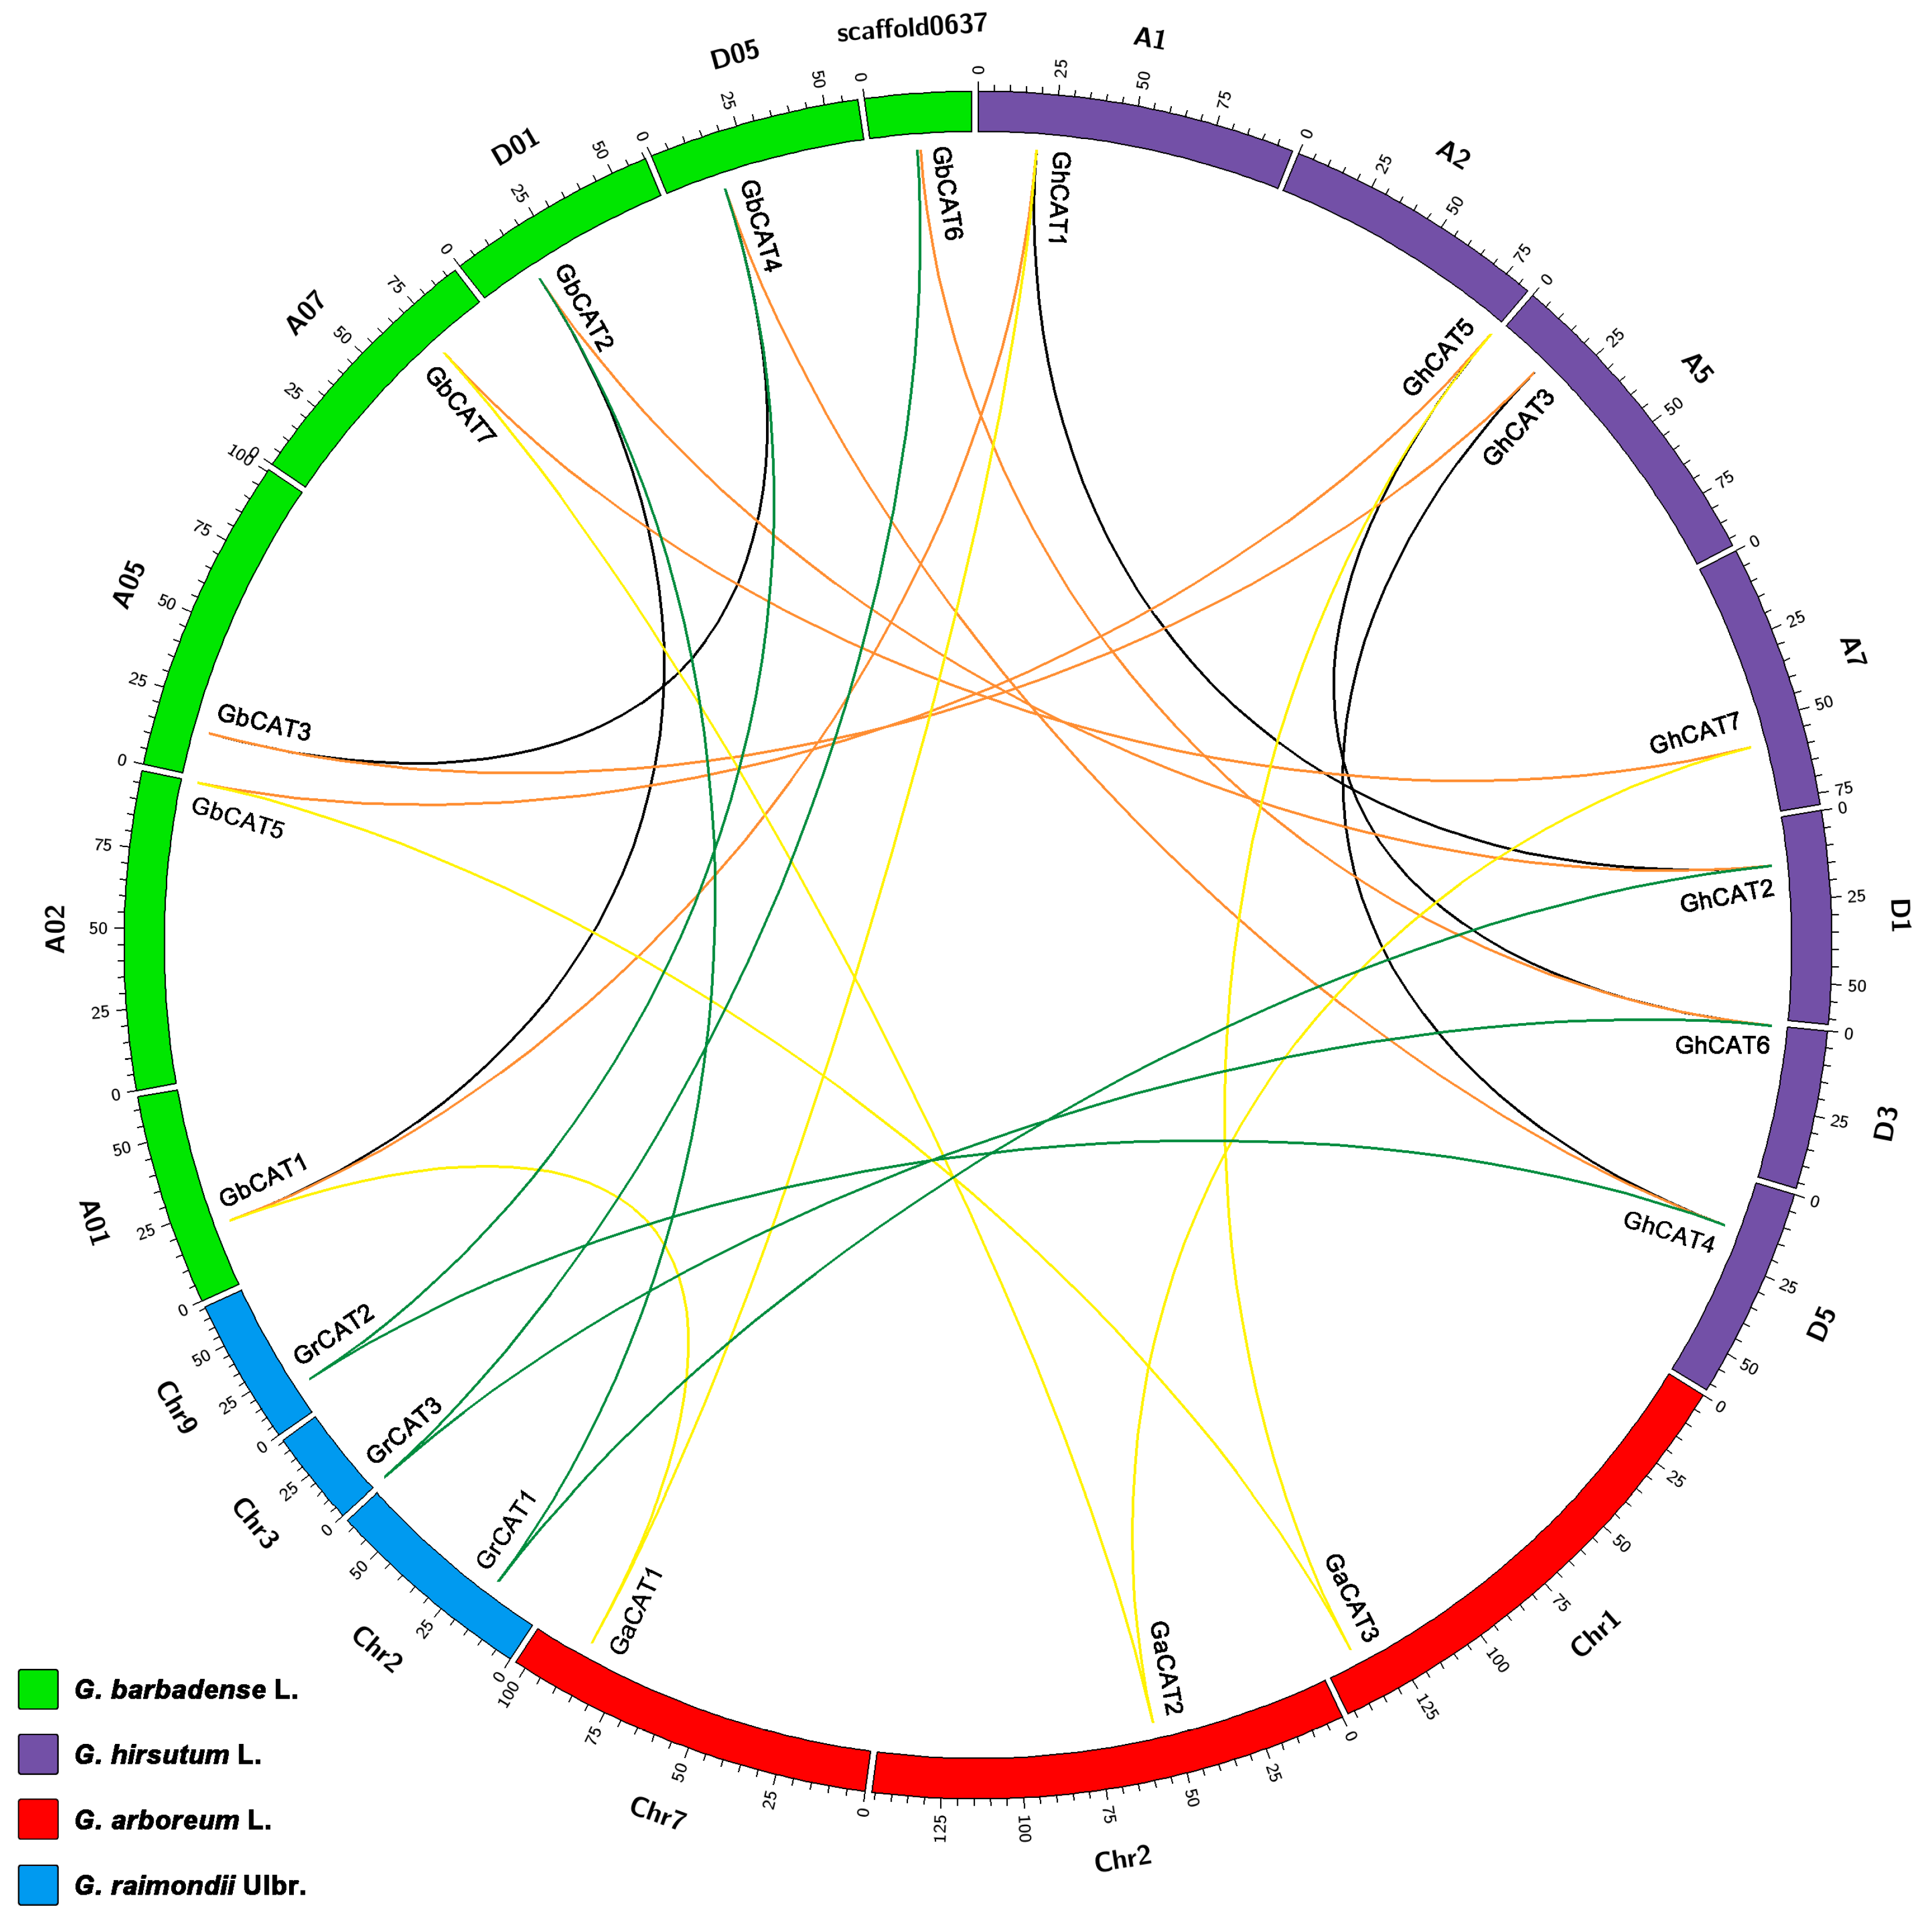
3.4. Synteny Analysis of CAT Genes between Gossypium

To analyze the synteny and collinearity relationships of CAT genes between the two allotetraploid cotton types and two diploid cotton types, we identified the orthologous and paralogous genes among these released cotton genomes (Figure 3 and Table S4). Among the candidate upland cotton CAT genes, 6 GhCATs had orthologous genes in the two diploid cotton types, and 3 genes (GhCAT1/5/7) showed an A genome origin and 3 genes (GhCAT2/4/6) showed a D genome origin. Among the candidate sea-island cotton CAT genes, 6 GbCATs had orthologous genes in the two diploid cotton types, and 3 genes (GbCAT1/5/7) showed an A genome origin and 3 genes (GbCAT2/4/6) showed a D genome origin. Additionally, all 7 GhCAT genes were the orthologous genes of the 7 GbCATs, and there were no orthologous genes between the two diploid cotton types (Figure 3 and Table S4). In addition, to analyze the gene duplication events of the Gossypium CAT gene family, we characterized three paralogous gene pairs (GhCAT1/2, GhCAT3/4 and GhCAT5/6) of CATs in the upland cotton genome, two pairs (GbCAT1/2 and GbCAT3/4) in the sea-island cotton genome, and no paralogous genes in the two diploid cotton types (Figure 3). The duplicate genes of the CAT gene family in the two allotetraploid cotton types were all classified into WGD/segmental duplicates, and the other duplicate mechanisms which might make different contributions to evolution, such as tandem, proximal and/or dispersed duplications, were not detected (Figure 3 and Table S4). These results suggested that the WGD/segmental duplications might mainly contribute to the expansion of the CAT gene family during Gossypium evolution.

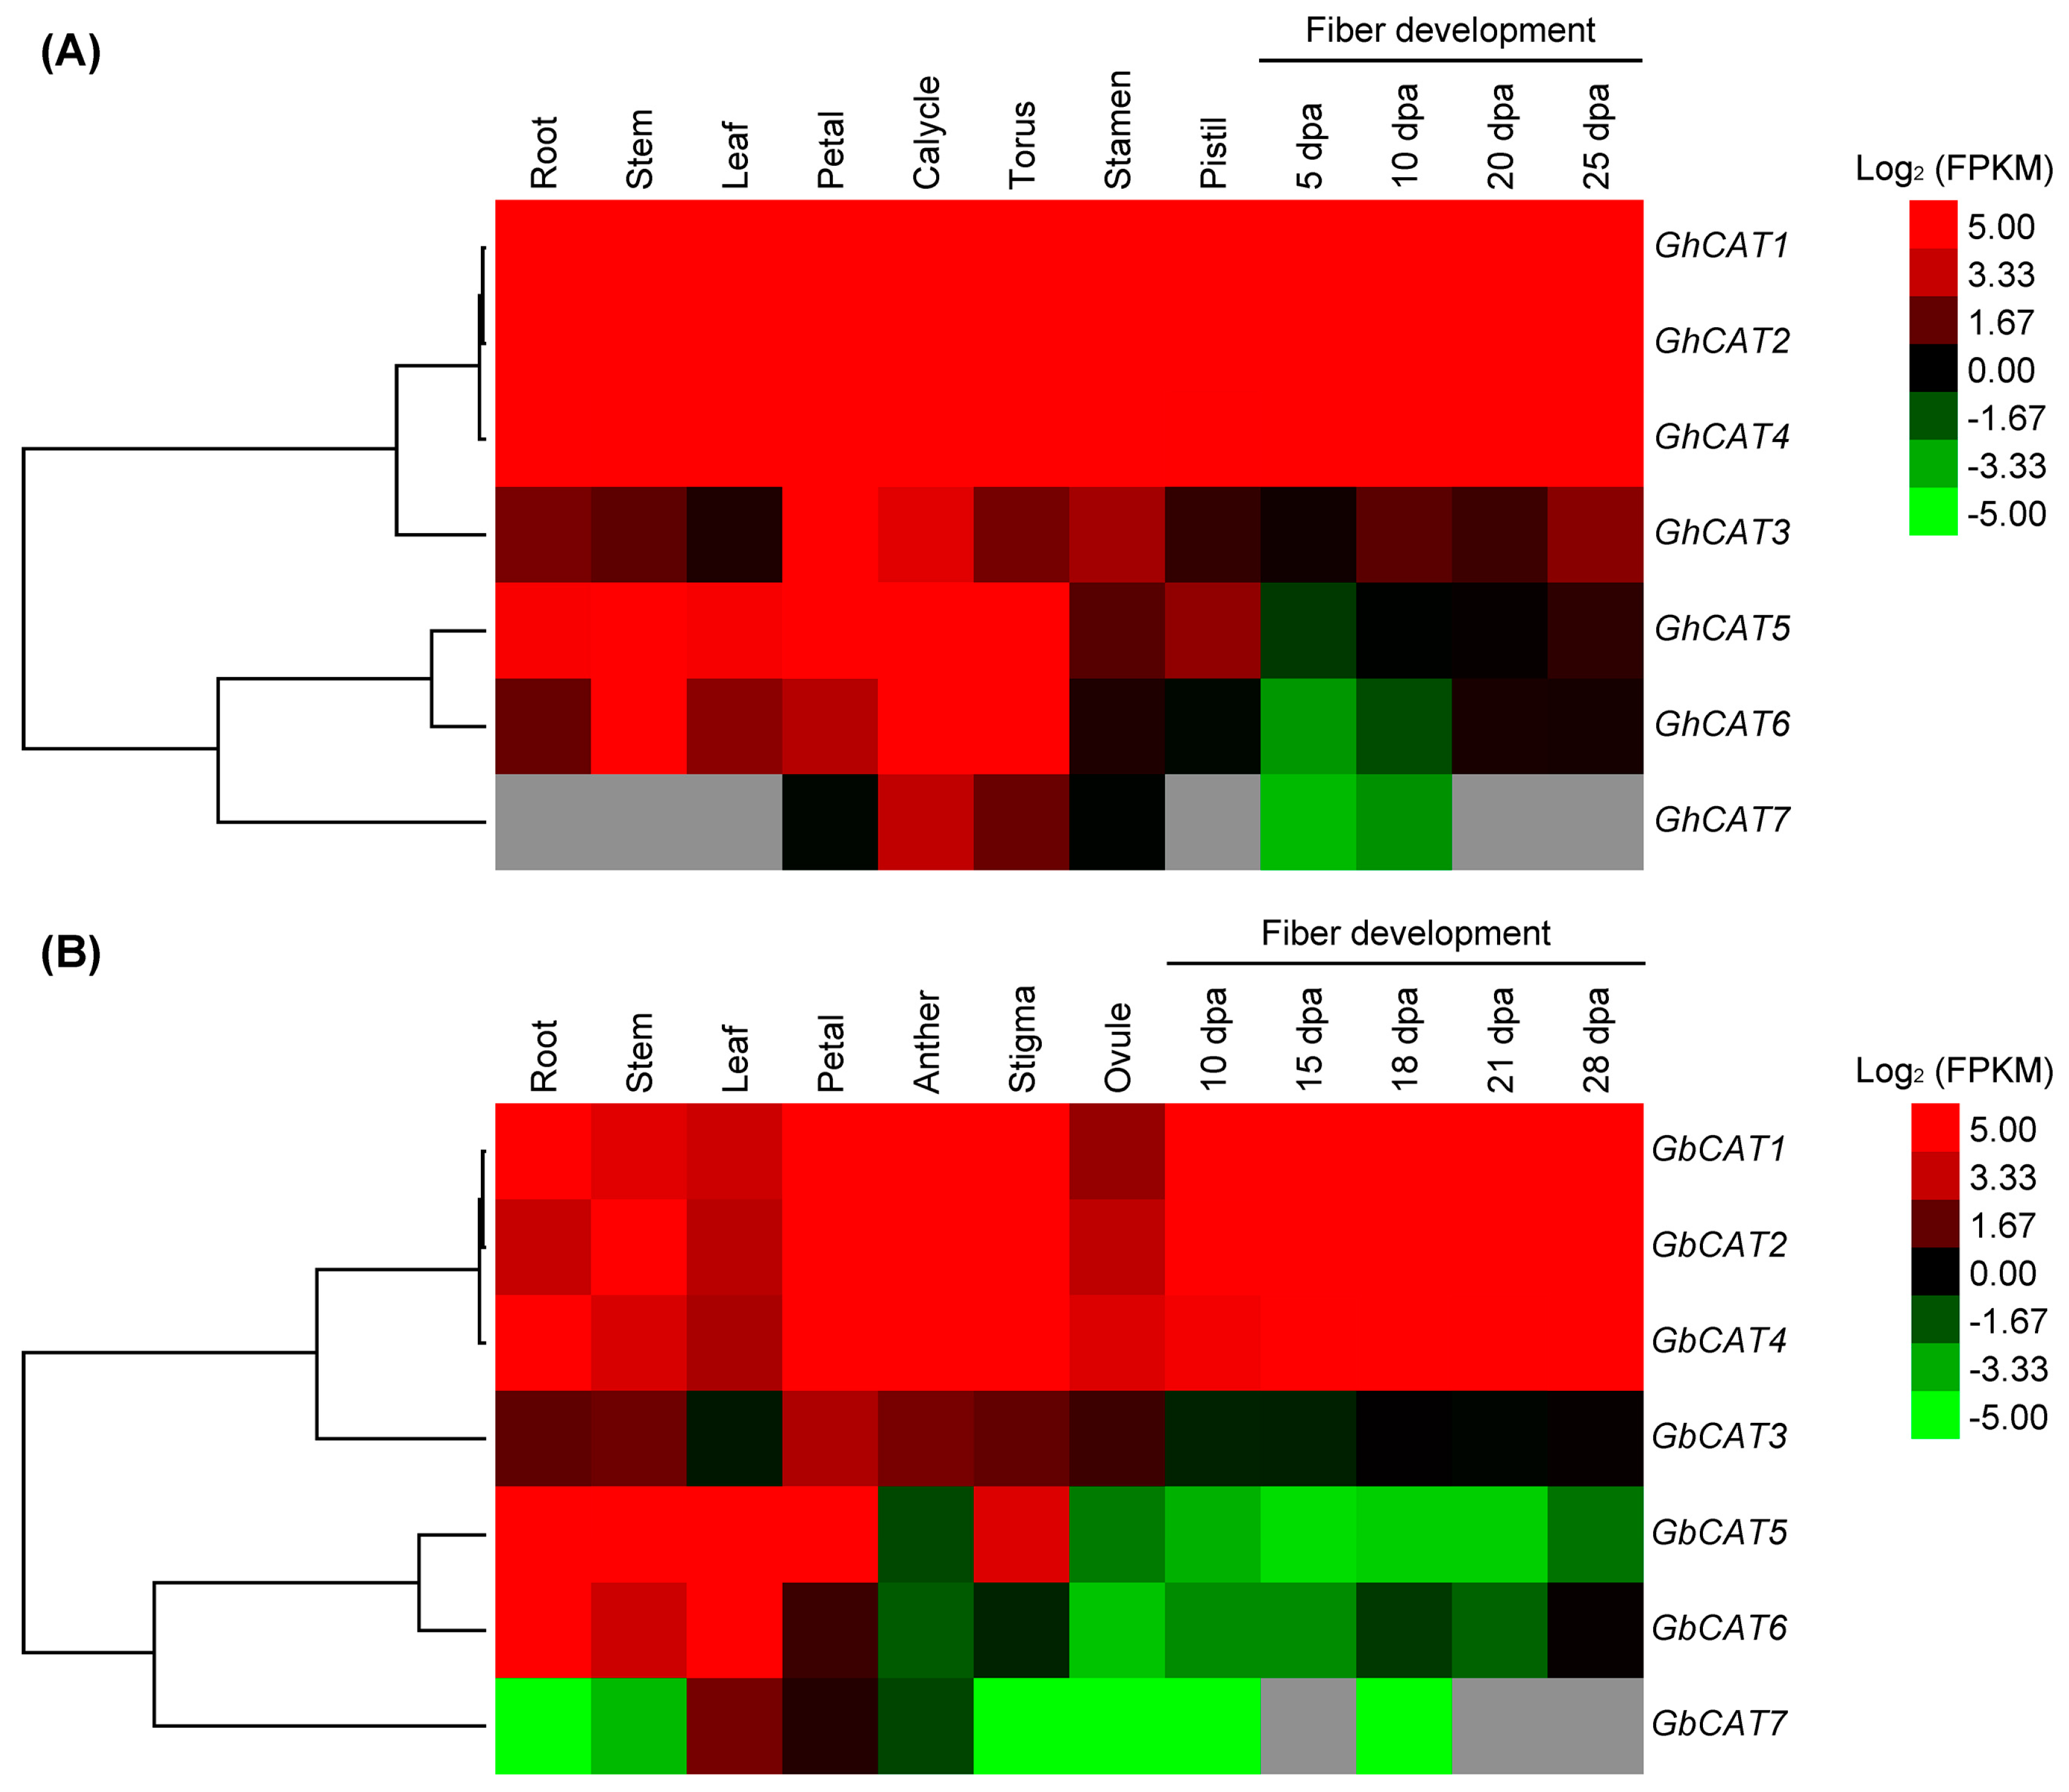
3.5. Expression Analysis of GhCATs and GbCATs in Different Tissues/Organs and Fiber Development Stages

Gene functions closely correlated with gene expression patterns. To further investigate the biological functions of the CAT gene family in the two allotetraploid cotton types, we gathered the transcriptome data of different tissues/organs and fiber development stages that were published with the two-cotton whole genome sequencing [39,40] (Table S5). Generally, the expression levels of the upland cotton CAT gene family were higher than that of the sea-island cotton CAT genes; and among the members of the upland cotton CAT gene family, the genes clustering in group I (GhCAT1/2/3/4) showed higher expression levels than those in group II (GhCAT5/6/7), and sea-island cotton CAT genes had a similar expression pattern (Figure 4 and Table S5). Remarkably, GhCAT3 and GbCAT3, which were in group I, showed a lower expression than other genes of group I; and, GhCAT7 and GbCAT7 were expressed at very low levels or even barely detectable in all the tissues/organs and fiber development stages (Figure 4 and Table S5). So, we suggested that CAT1/2/4 of upland cotton and sea-island cotton can constitutively contribute catalase activity in normal conditions. Our findings indicated that the developmental and spatial-expression specificity of the CAT gene family might be involved in the growth and development of different tissues or organs in upland cotton and sea-island cotton.

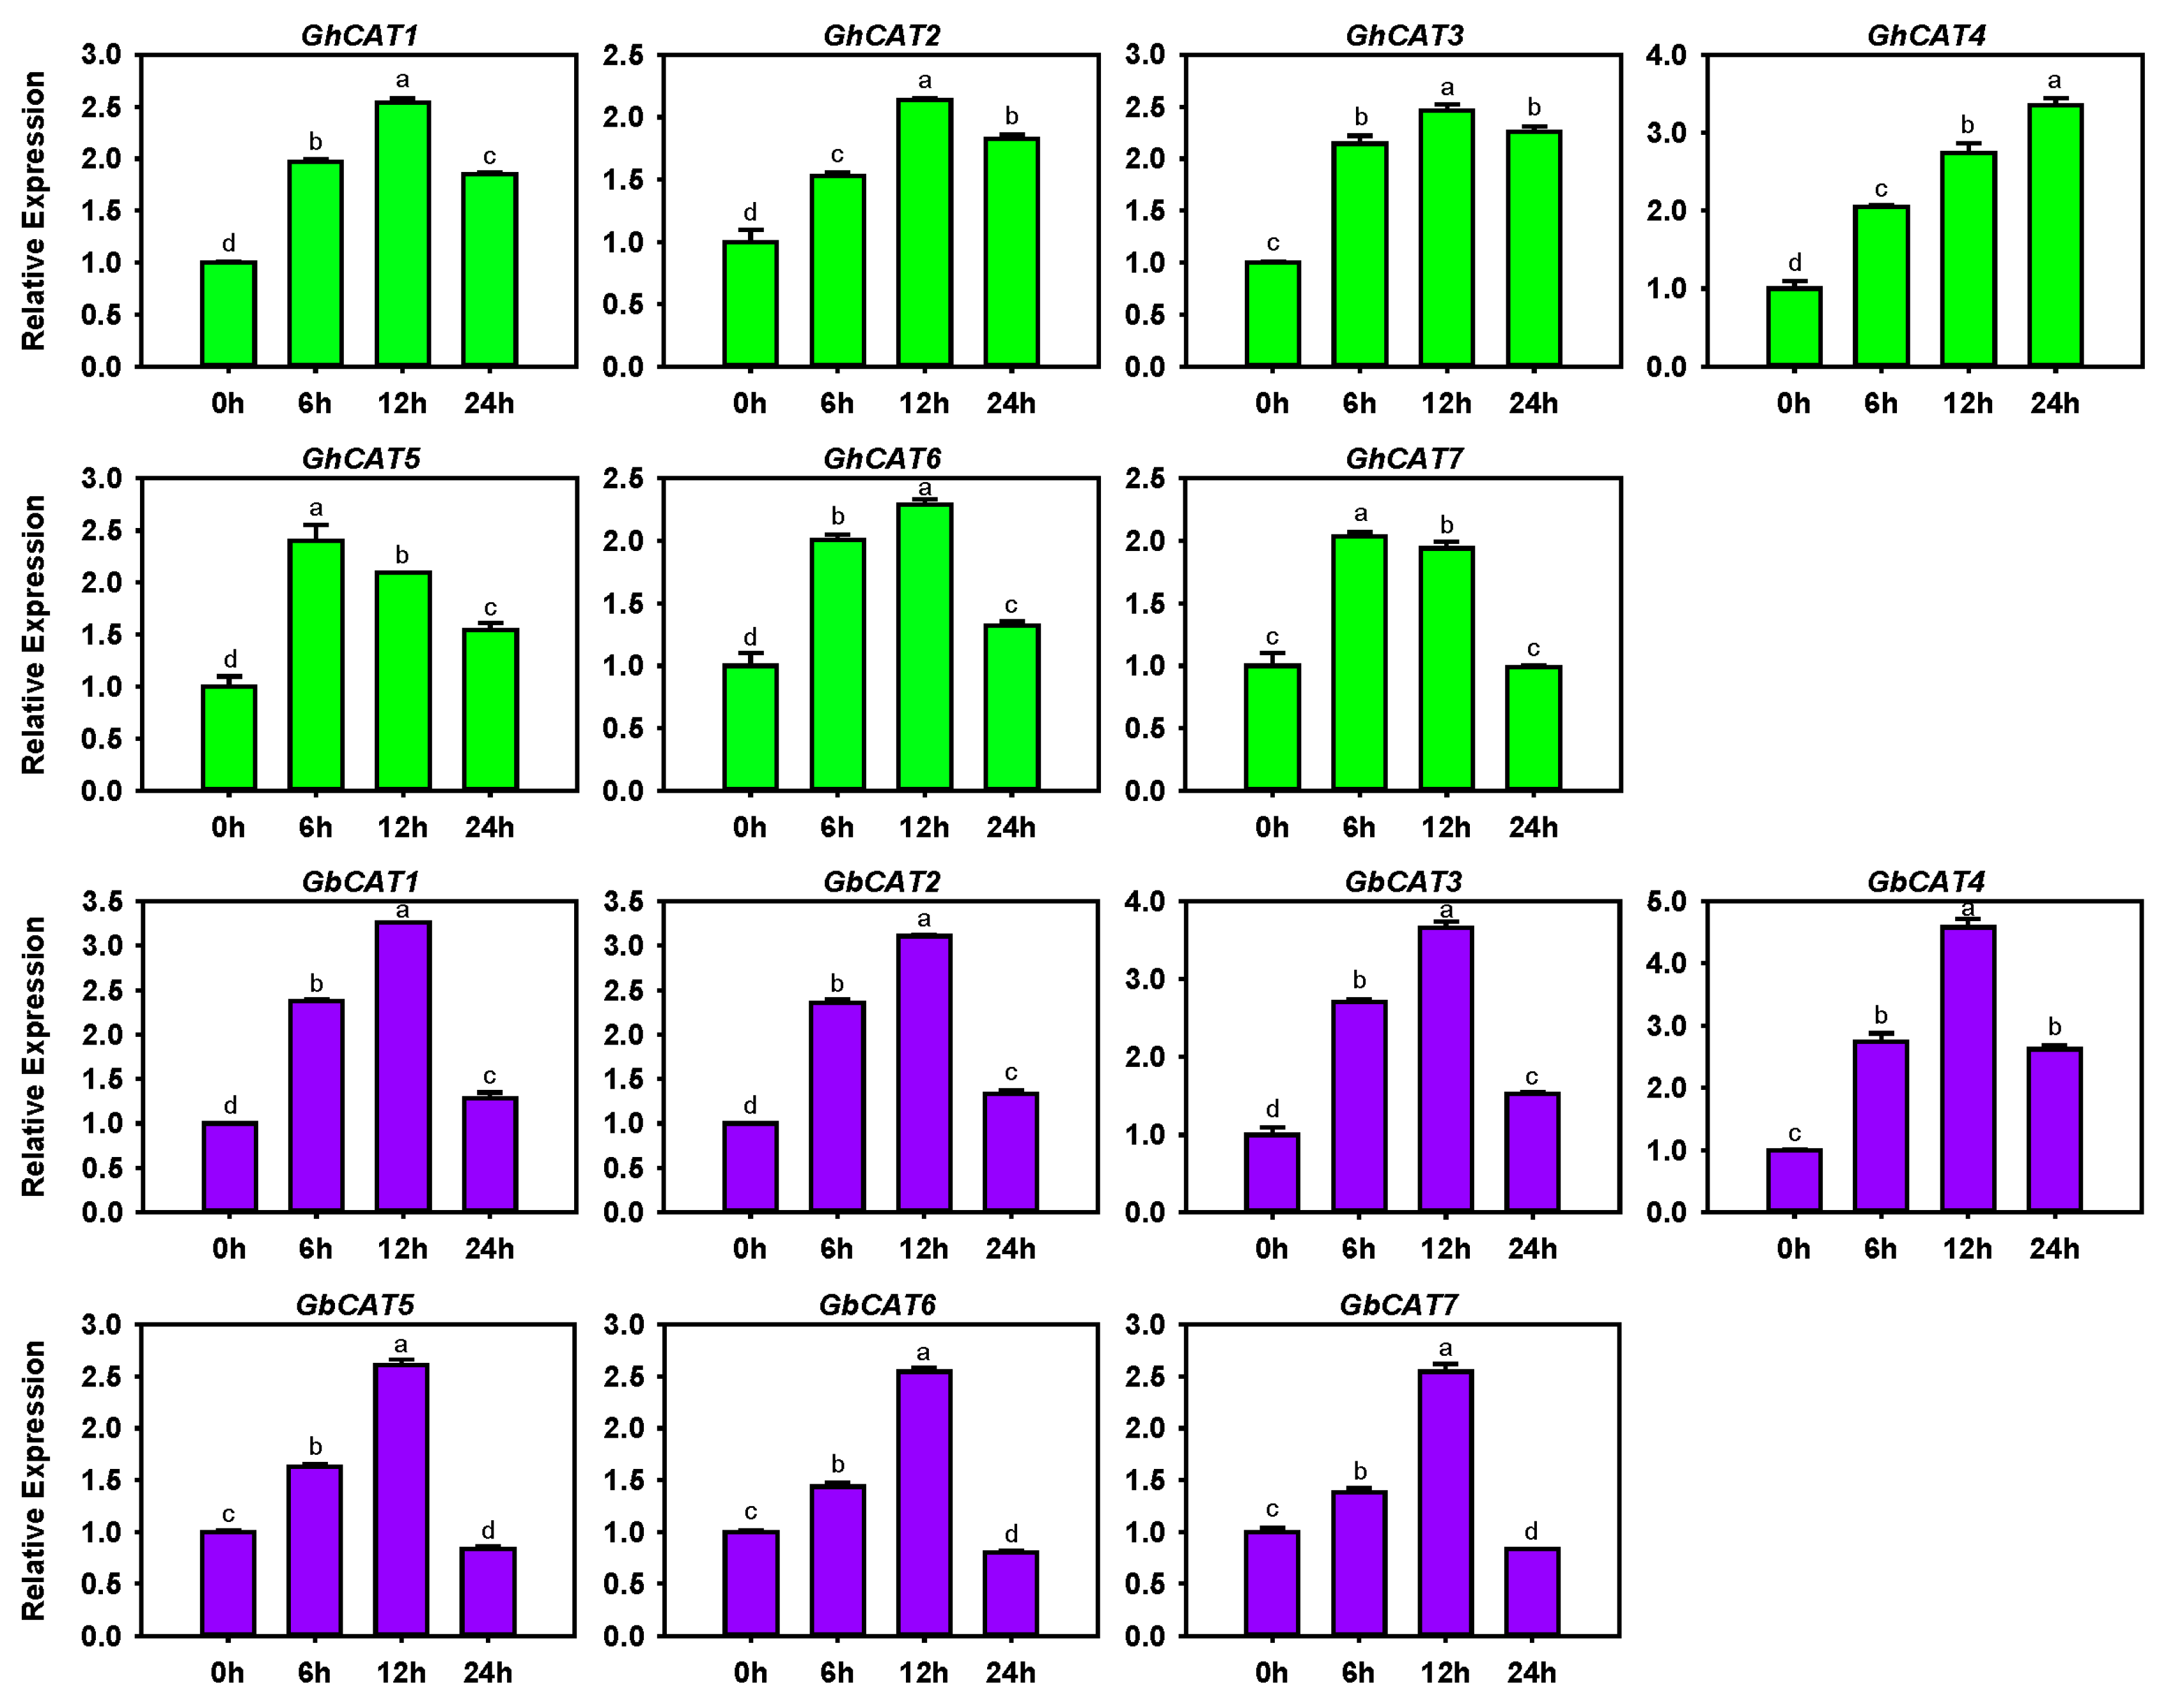
3.6. Transcription Levels of GhCATs and GbCATs under V. dahliae Treatment

As previously reported, plant CAT genes played crucial roles in the resistance to pathogen infection [27]. To determine the functions of CAT genes in plant defenses against VW, we analyzed the expression patterns of the CAT gene family after V. dahliae strain Vd414 inoculation in upland cotton SF06 and sea-island cotton Hai7124, which exhibited susceptibility and resistance to V. dahliae, respectively (Figure 5). Further, these CATs were significantly induced by V. dahliae and quickly reached peak expression levels at different time points in the two allotetraploid cotton types (Figure 5). In addition, we found that the average Ct values of four CAT genes (GhCAT3, GhCAT7, GbCAT3 and GbCAT7) were smaller than that of others during V. dahliae treatment (data not shown). This finding indicated that the four CAT genes showed a relatively low expression during V. dahliae treatment, which was basically consistent with the results showed in Figure S4 and Table S5. These data suggested that CAT genes might be involved in defense against V. dahliae, and the CAT-mediated regulating of ROS signaling might be related to the difference of resistance to VW between sea-island cotton and upland cotton. However, we need further investigations to verify which one or more genes among the family may be putative resistance components to VW and the regulatory mechanisms.

3.7. Predictions of Putative Molecular Regulatory Mechanisms of Cotton CATs

The previous parts have discussed the expression of cotton CAT gene family and their potential functions in VW resistance. However, how the steady-state levels of CATs are altered for mediating ROS metabolism is yet to be elucidated. In the present part, the predictions of transcriptional related components involving TFs and posttranscriptional regulation mediated by alternative splicing (AS) and miRNAs may provide an insight into the putative molecular regulatory mechanism of cotton CATs gene expression and their functional multiplicity.

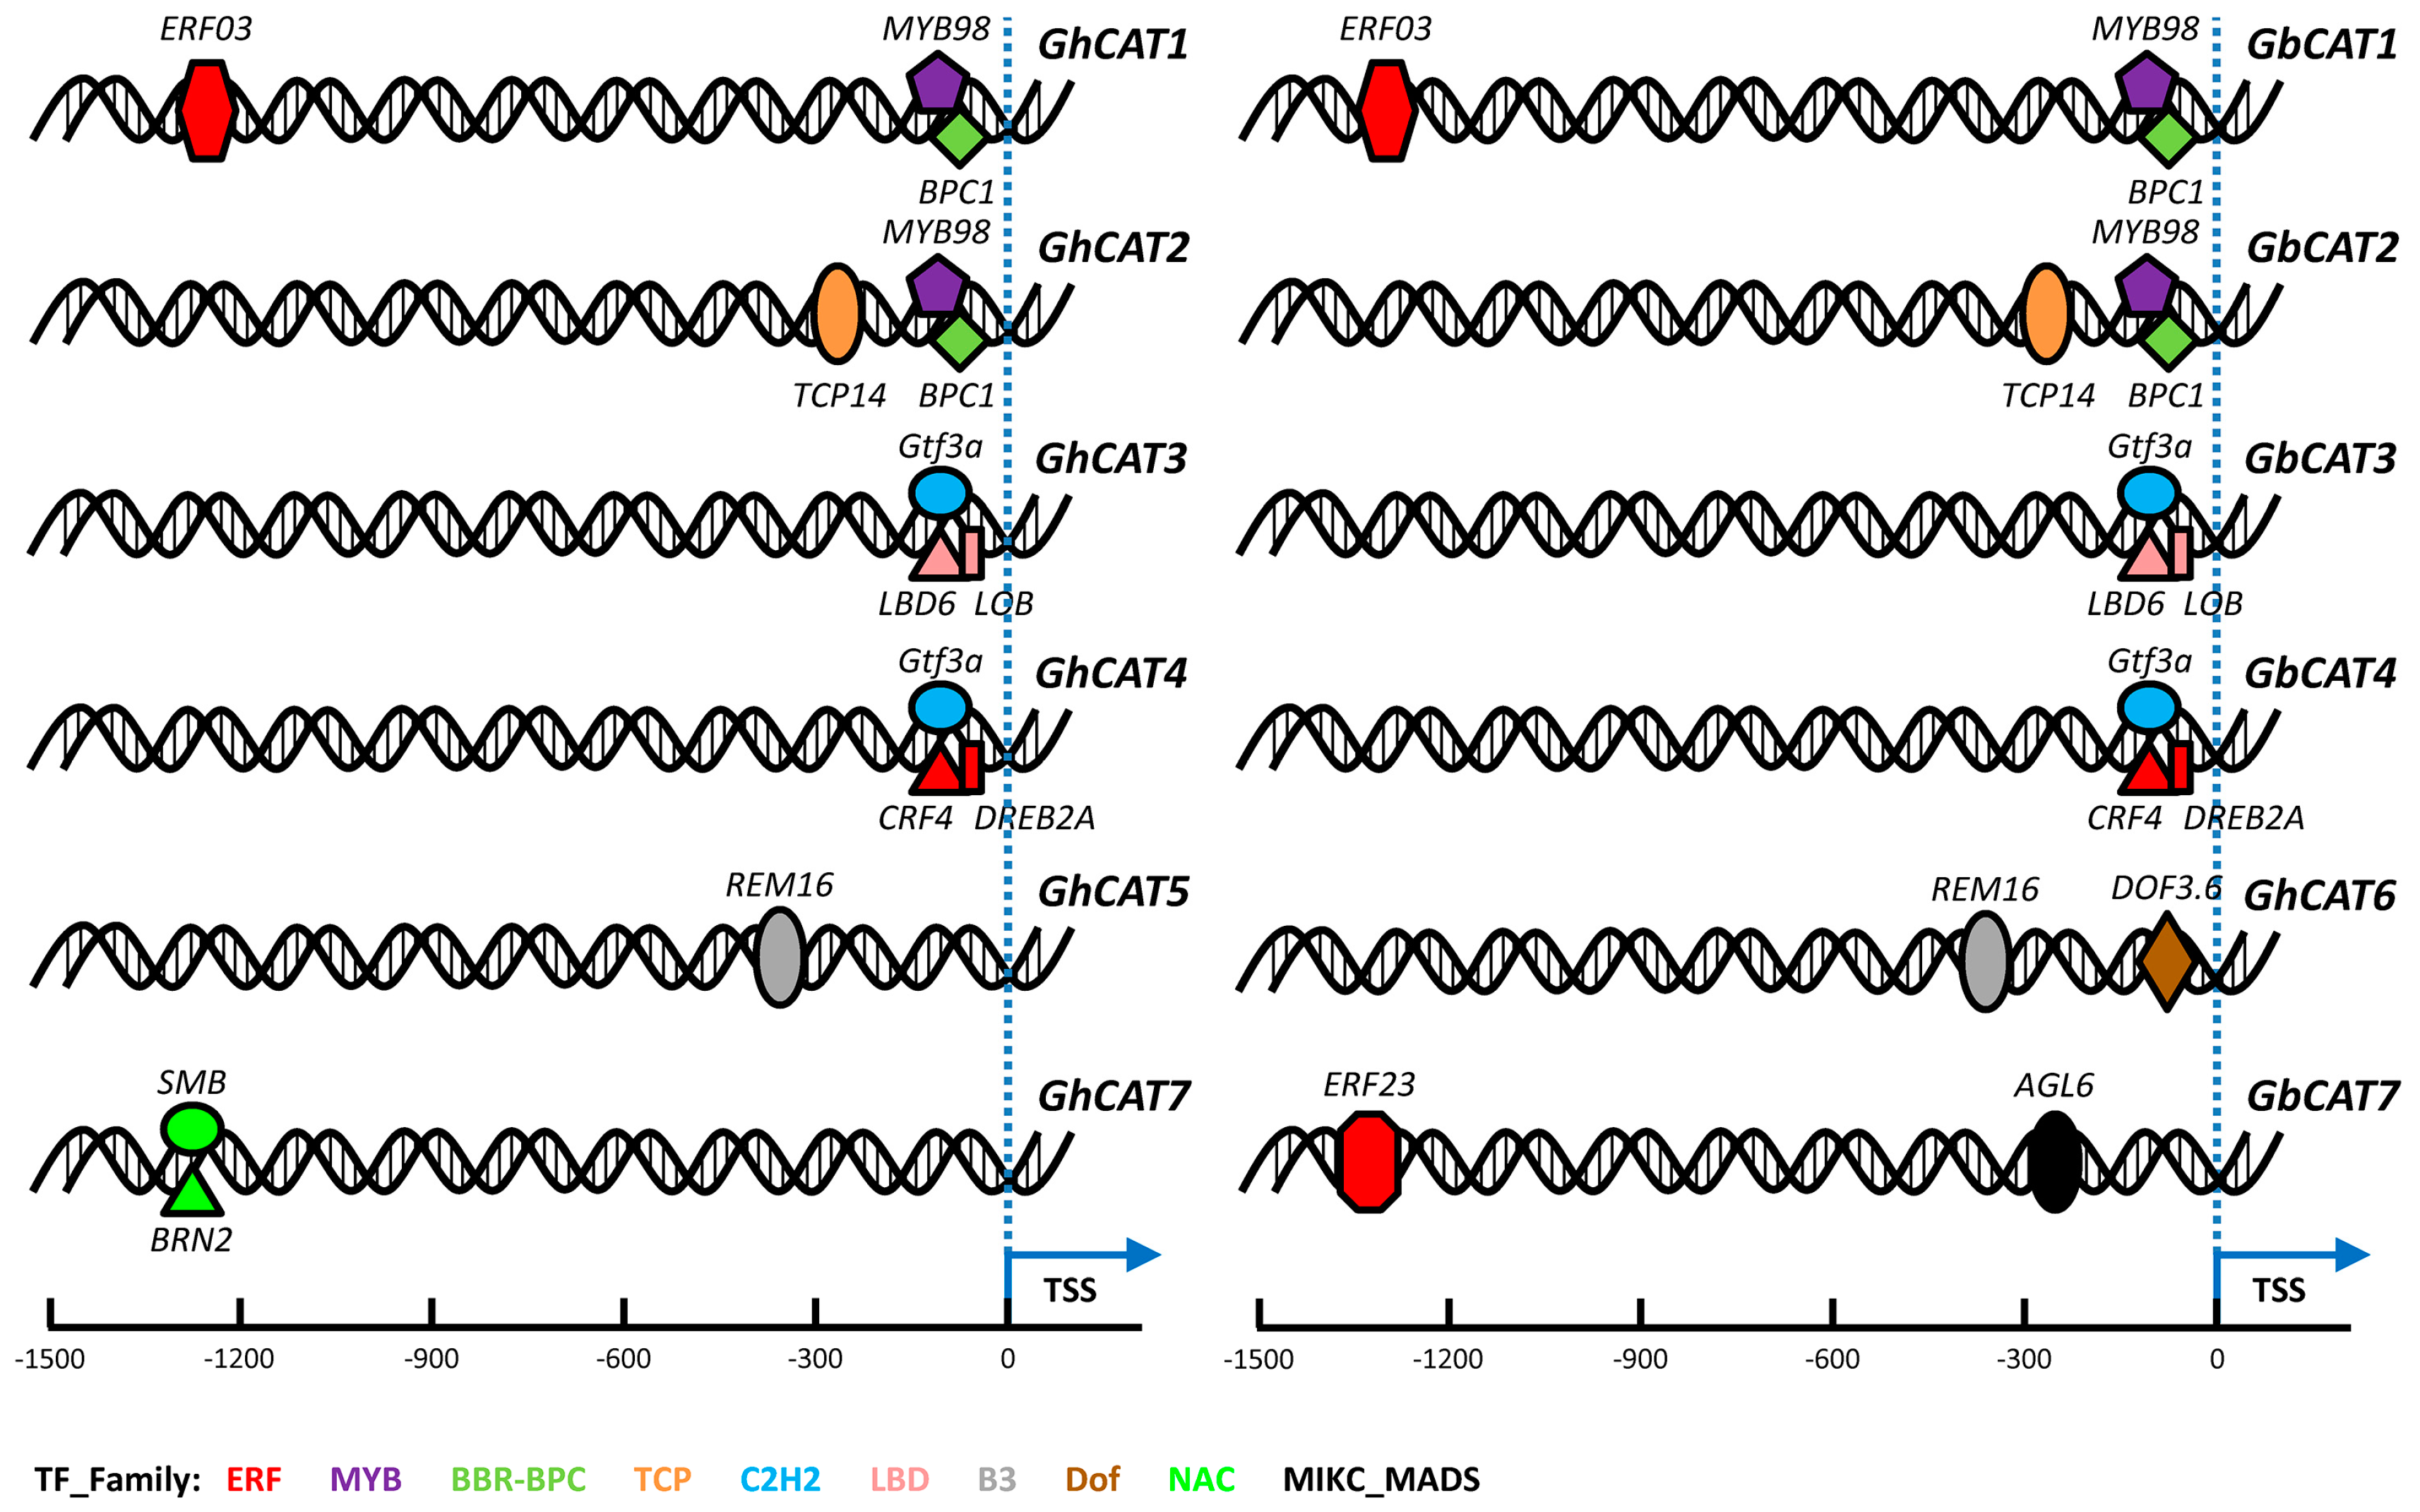
3.7.1. Prediction of Transcription Factor Binding Sites

TFs temporarily and spatially regulate the transcription of their target genes through binding certain upstream elements. To explore regulatory interactions between TFs and cotton CATs, we collected the upstream 1.5 kb genomic sequences relative to the TSS of upland cotton and sea-island cotton CAT genes as putative promoter regions and searched for highly conserved TFBSs in these promoter regions using the Binding Site Prediction server. In terms of upland cotton, 15 TFs belonging to 9 families might bind to the putative promoter regions of 7 GhCATs (GhCAT1/2/3/4/5/6/7). Like upland cotton CATs, the 13 TFs belonging to 7 families might bind to the 5 GbCATs (GhCAT1/2/3/4/7) (Figure 6 and Table S6). Among these TF families, many were also found in bacteria, yeast and animals, such as the C2H2, ERF, MYB and MADS families. However, other classes of transcription factors are plant-specific, such as the B3, BBR-BPC, Dof, LBD, NAC and TCP families. Numerous discoveries have emphasized that these TF families play crucial roles in plant stress response and during plant growth and development, such as in the carbohydrate metabolism, the regulation of the circadian clock, seed germination, gametophyte development, hormone pathways, leaf development, embryo development, flower development, cell cycle regulation, and response to biotic and abiotic stresses [58,59,60,61,62,63]. Furthermore, we carried out GO annotation of the TFs binding to the upland cotton and sea-island cotton CAT genes’ putative promoter regions based on their cellular location, molecular function, and biological process. The results showed that these TF families were involved in some metabolic process (GO:0009058, GO:0071704, GO:0044237, GO:0019222, GO:0006807 and GO:0044238) and in the regulation of the biological process (GO:0050789) and cellular process (GO:0009987) (Figure S5). The putative promoters of upland cotton and sea-island cotton CAT genes presented different types and numbers of TFBSs, which indicated that CAT genes might be regulated by these TF families at the transcriptional level and might be involved in some growth and development progresses as well as responding to various stresses, including VW pathogen infections.

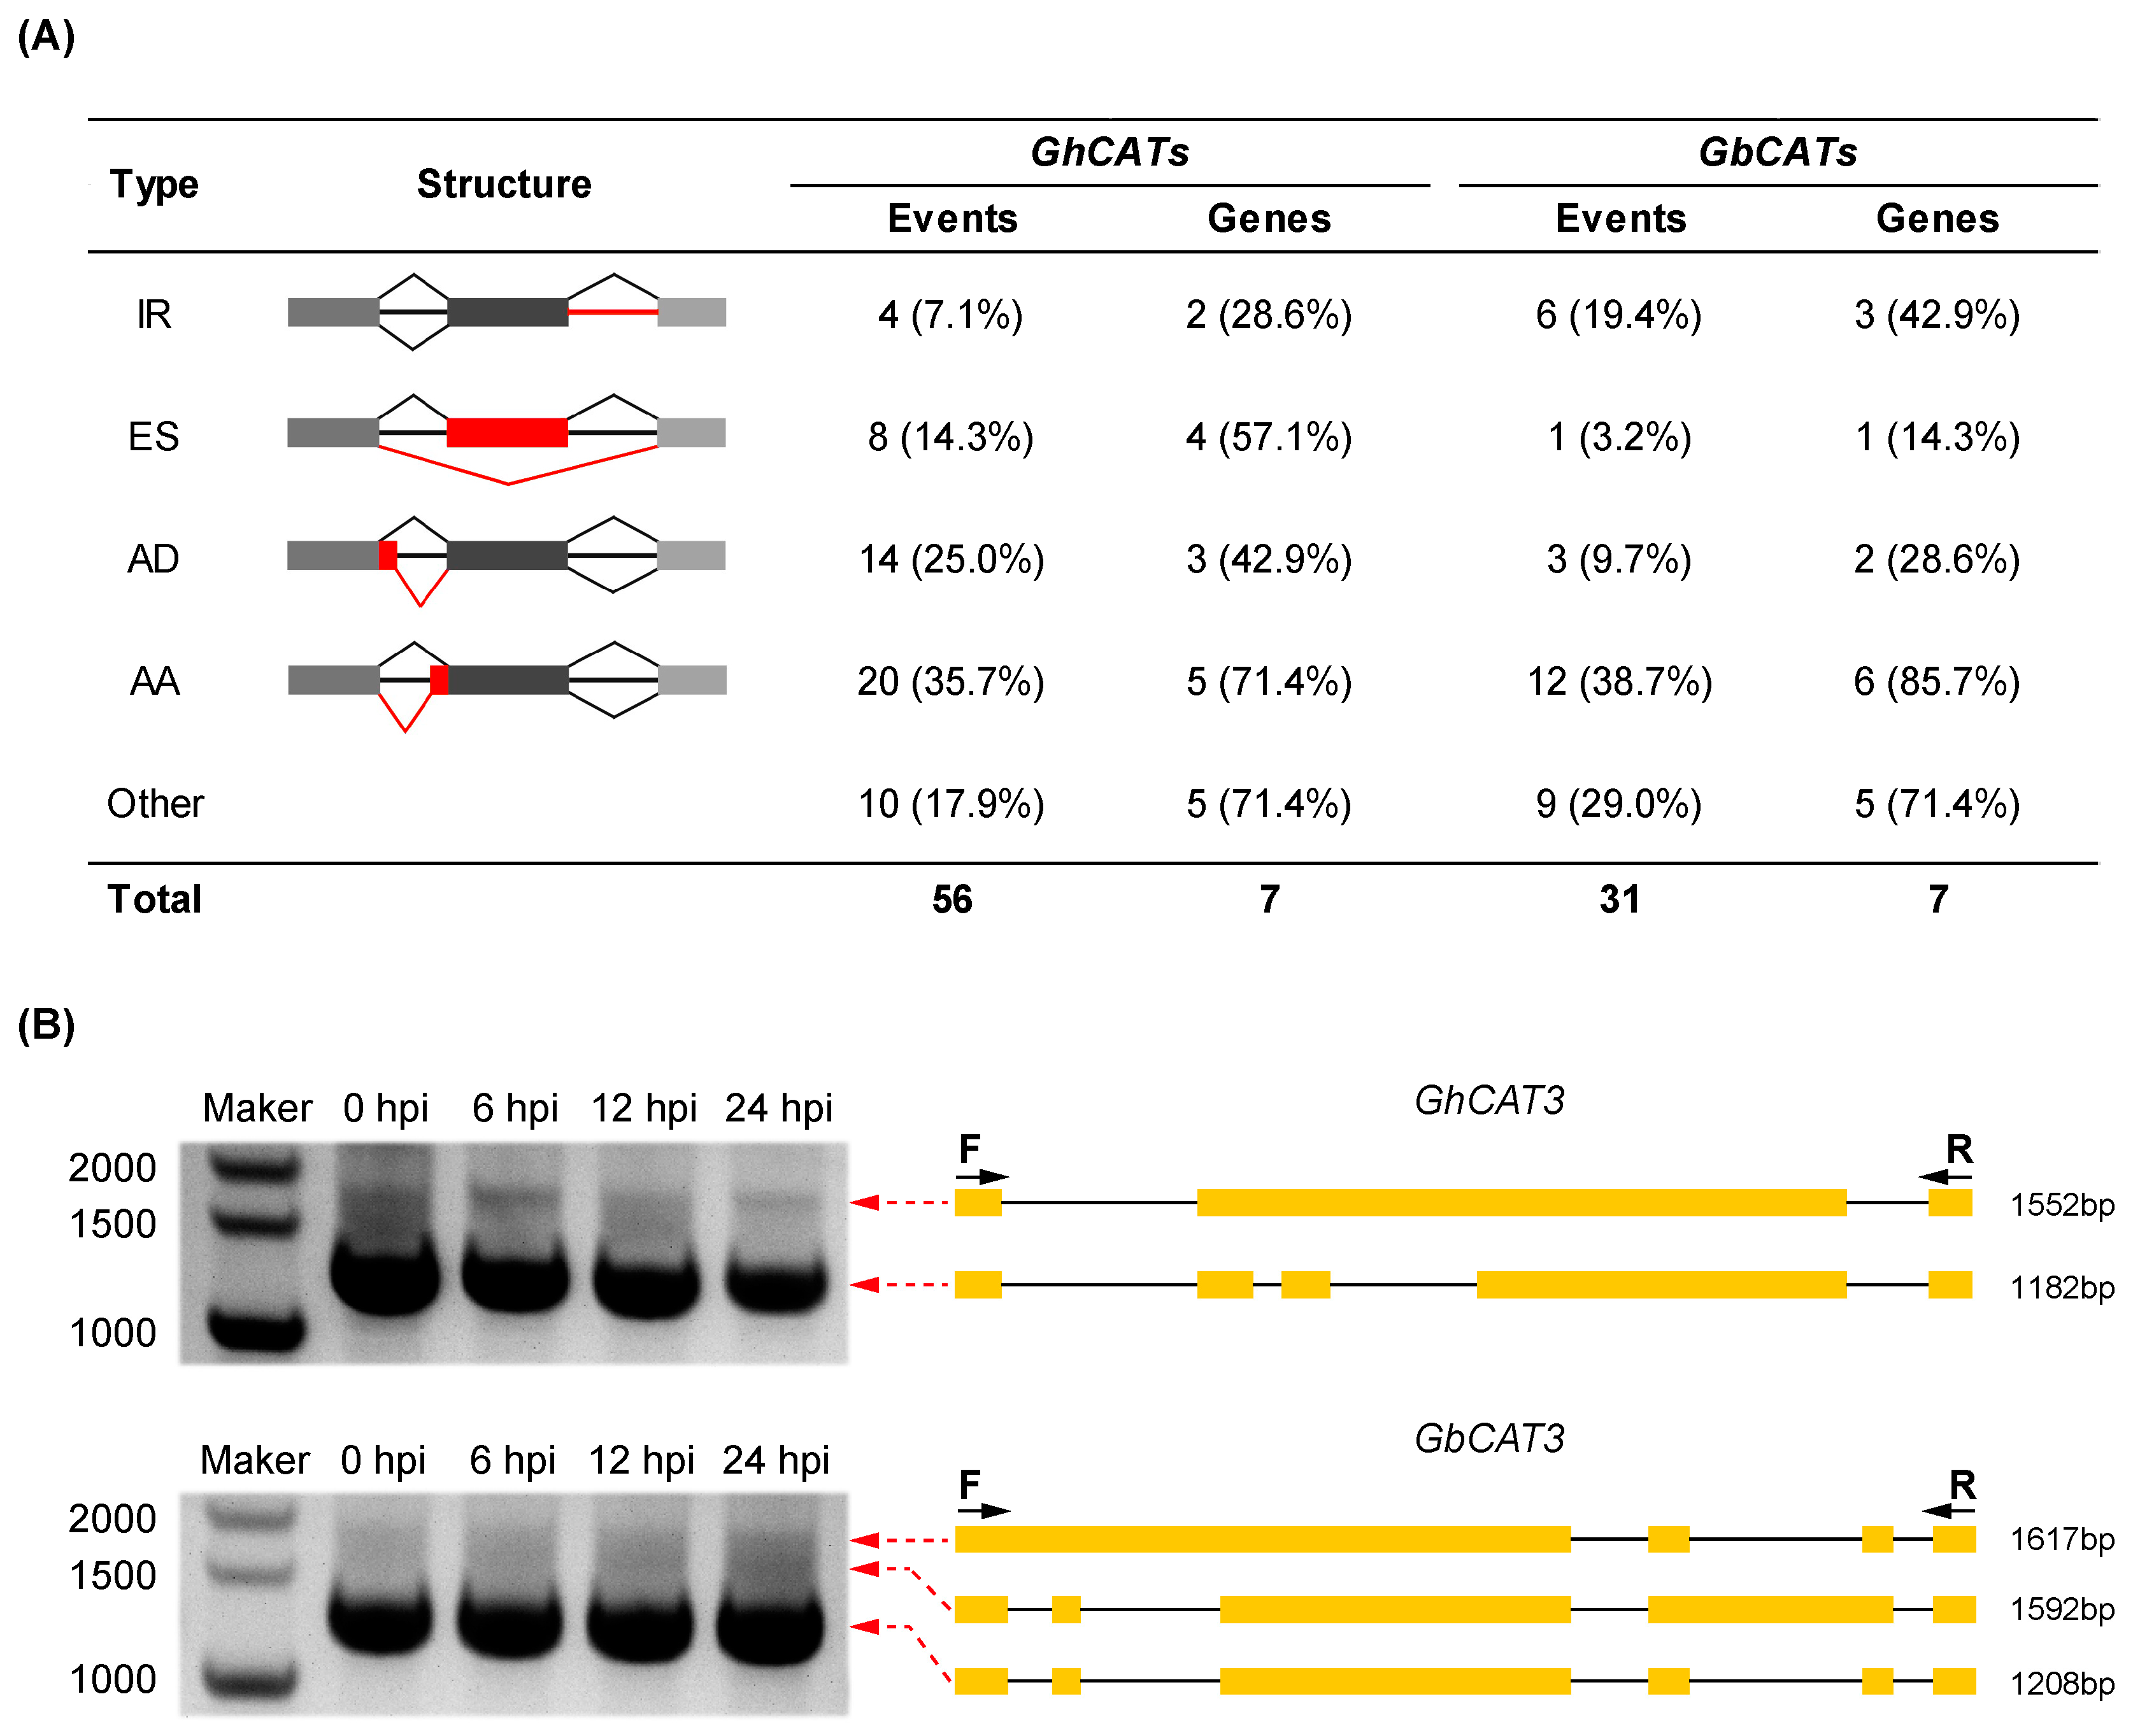
3.7.2. Survey of Alternative Splicing

The AS of precursor mRNAs (pre-mRNAs), which generates multiple transcripts from a single gene, is an important modulator of gene expression that can increase transcriptome and proteome diversity [64]. It has been estimated that, in humans, ~95% of multi-exonic genes were alternatively spliced, and >60% of multiple exons containing genes in Arabidopsis were subject to AS [65]. In plants, this post-transcriptional mechanism is markedly induced in response to environmental stress, and recent studies have identified alternative splicing events that allow for rapid adjustment of the abundance and function of key stress-response components [66]. To explore the potential relationship between the AS of the CAT gene family and VW resistance in upland and sea-island cotton types, we analyzed potentially alternatively spliced isoforms by integration of the mRNA-seq data. Four major AS events were observed, including intron retention (IR), exon skipping (ES), alternative 5′ donor sites (AD) and alternative 3′ acceptor sites (AA). The statistics of the AS events of the CAT gene family and the corresponding gene models in G. hirsutum L. and G. barbadense L. were shown in Figure 7A and Figure S6. We found that all CAT genes underwent AS events and the number of AS events in GhCATs (56) was nearly twice as many as that in GbCATs (31) (Figure 7 and Figure S6). Compared with CATs clustering in group I, CAT5 and CAT6 had fewer potentially alternative spliced isoforms (Figure S6). Additionally, CAT3 and CAT7, which expressed at very low levels or even barely detectable in the developmental stages and during stress treatments (Figure 4, Figure 5, and Figure S4), underwent more AS events. Hence, we inferred that AS might regulate the expression of the CAT gene family at the post-transcriptional level. In addition, splice junctions (SJs) were first characterized by investigating the terminal dinucleotide signature. We found that the GT-AG type occupied all of the intron borders and no other types, such as AT-AC and GC-AG (data not shown). Our findings indicated that the GT-AG type SJs might be associated with the production of different transcript isoforms.
We selected GhCAT3 and GbCAT3 to validate the accuracy of the AS events using RT-PCR with the corresponding designed primers (Table S2). We found that the size of each amplified fragment was consistent with that of the expected fragment (Figure 7B). The amplified fragments were then ligated into the pEASY®-Blunt (TransGen) for Sanger sequencing. We observed sequence consistency between the cloned fragments and predicted sequences based on the mRNA-seq data.

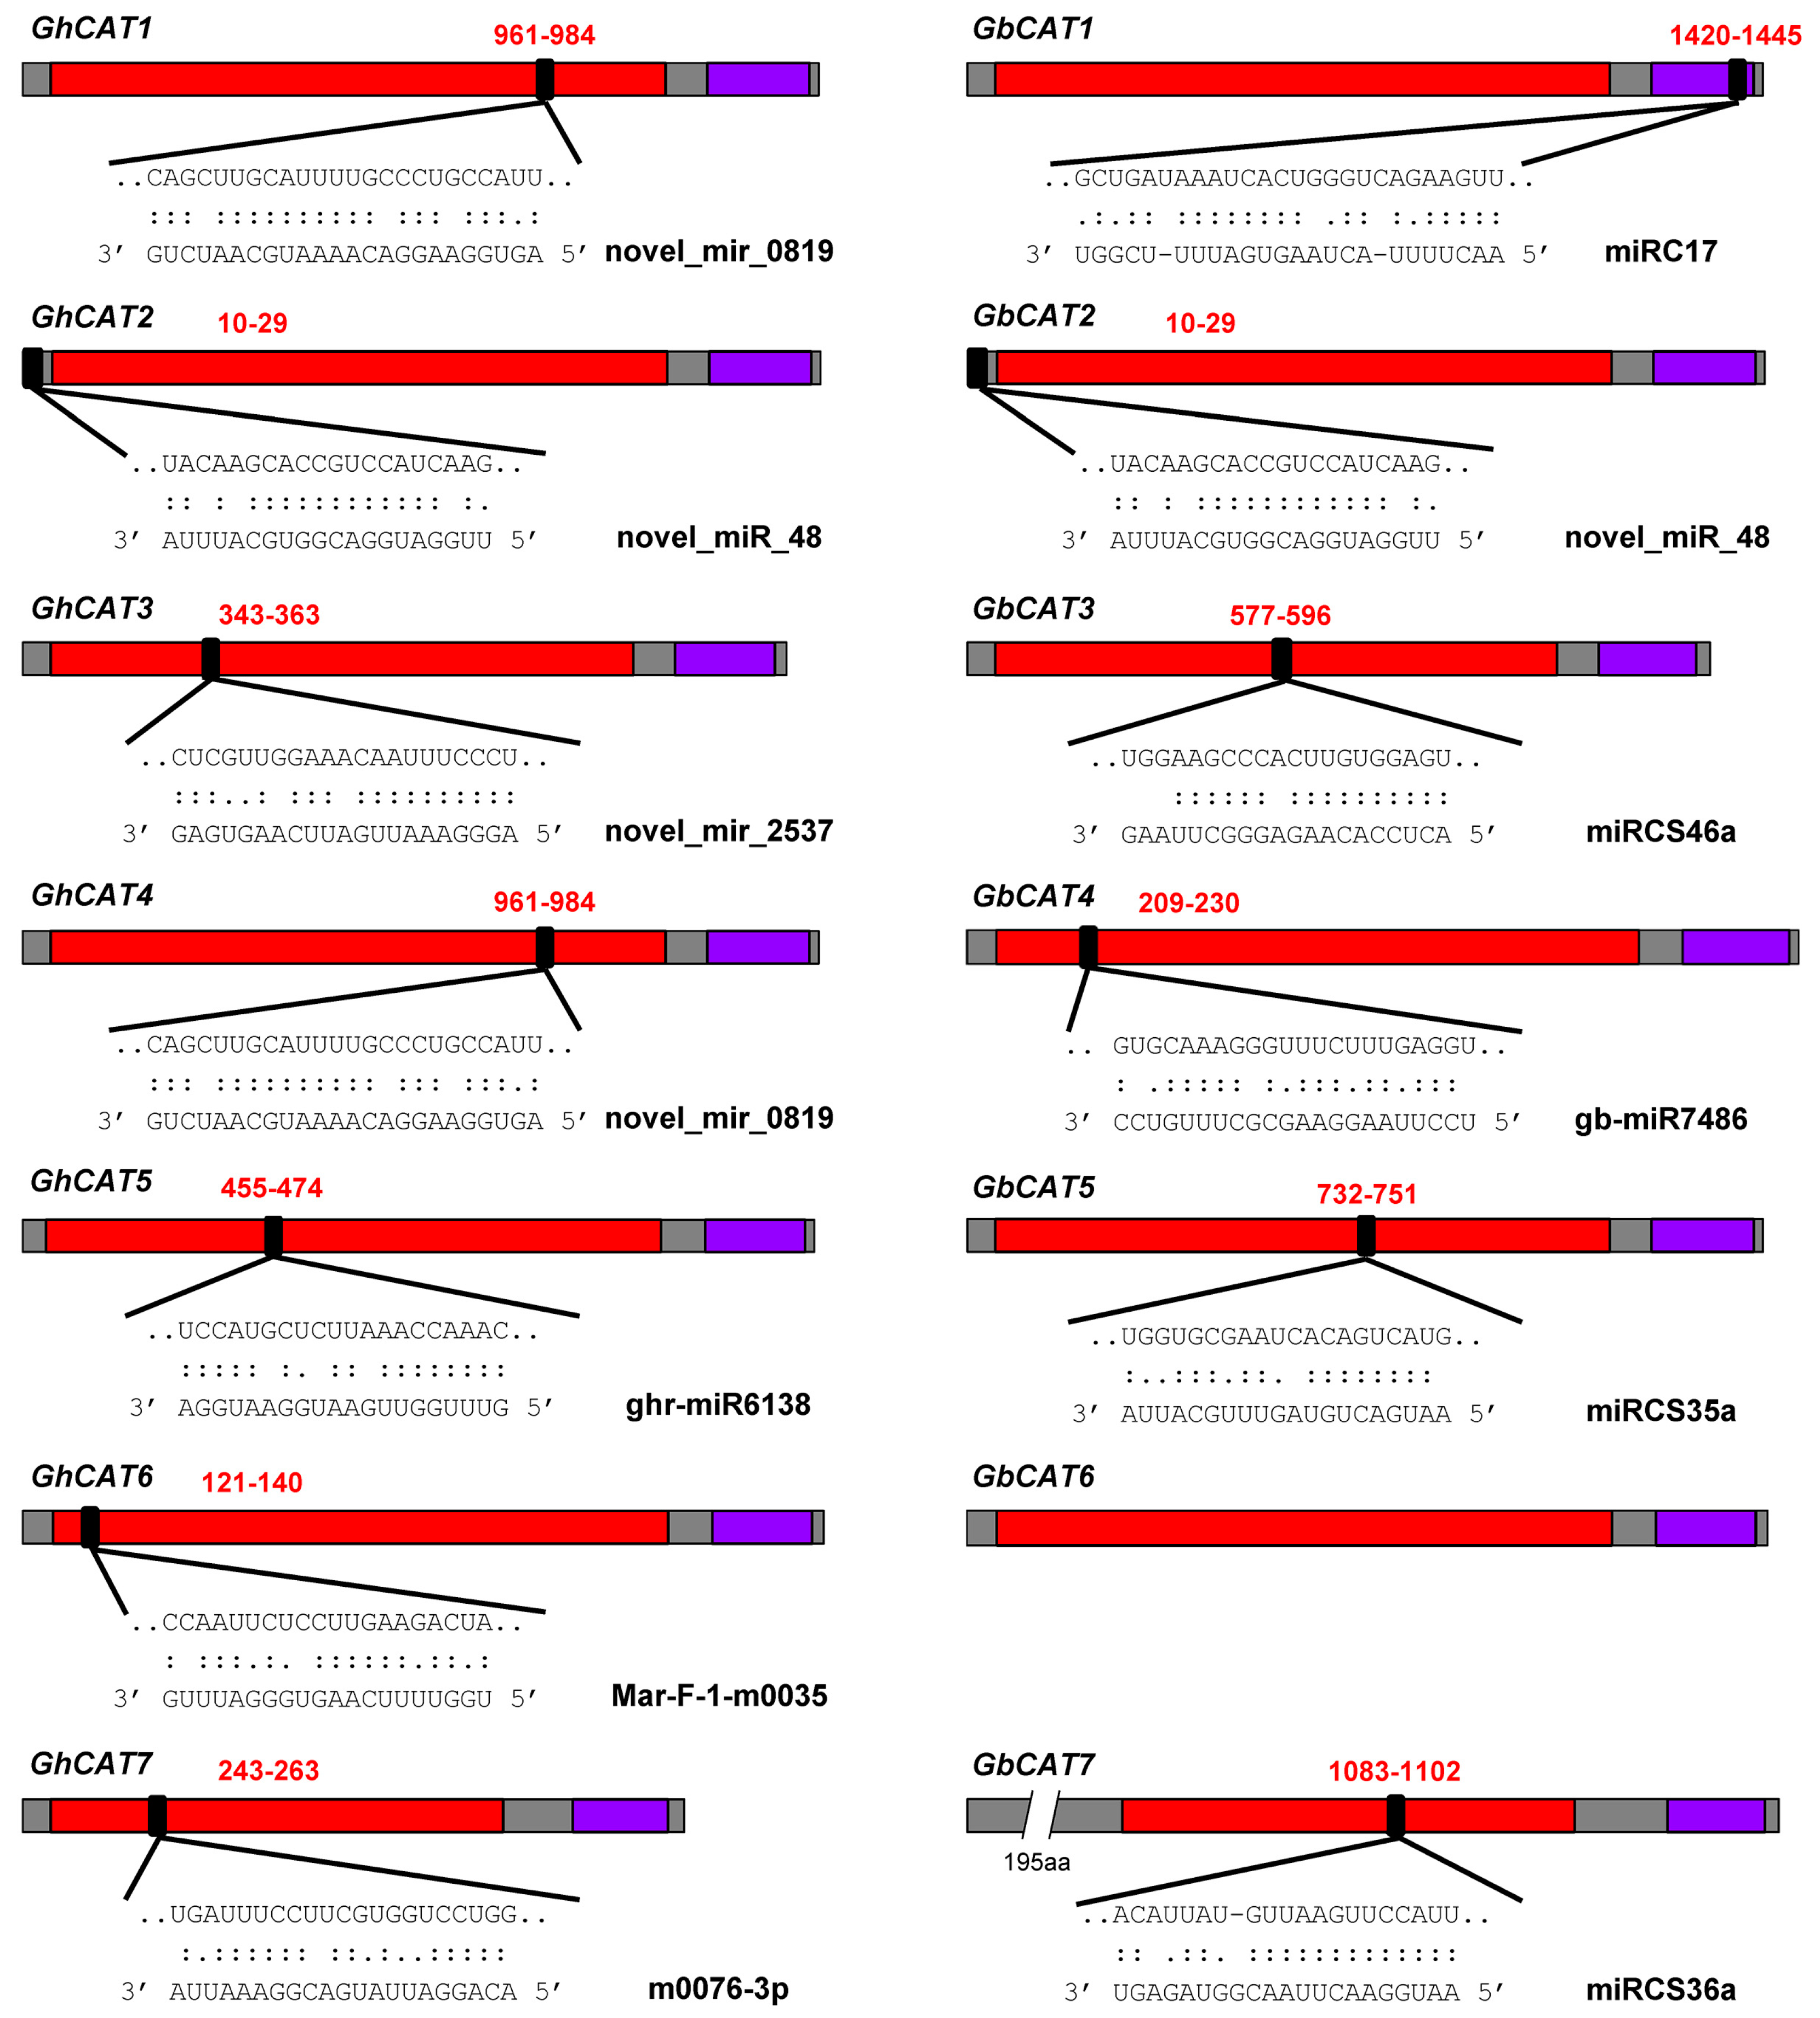
3.7.3. Prediction of miRNA Target Sites

To preliminarily explore the miRNA-mediated posttranscriptional regulatory mechanisms of the CAT gene family in upland cotton and sea-island cotton, we searched CDS for putative target sites of cotton miRNAs using the psRNATarget server. The results showed that 10 upland cotton miRNAs targeted 7 GhCATs and 8 sea-island cotton miRNAs targeted 6 GbCATs (Figure 8 and Table S7). As shown in Figure 8, GhCAT1 and GbCAT1 were targeted by novel_mir_0819 and miRC17 with sites in the Catalase domain and Catalase-rel domain, respectively; GhCAT2 and GbCAT2 were both targeted by novel_miR_48 with sites in the 5′-end of CDS; GhCAT3 and GbCAT3 were targeted by novel_mir_2537 and miRCS46a with sites both in the Catalase domain, respectively; GhCAT4 and GbCAT4 were targeted by novel_mir_0819 and miRCS46a/gb-miR7486 with sites both in the Catalase domain, respectively; GhCAT5 and GbCAT5 were targeted by ghr-miR6138 and miRCS35a with sites both in the Catalase domain, respectively; GhCAT6 was targeted by Mar-F-1-m0035 with the site in the Catalase domain; GhCAT7 and GbCAT7 were targeted by m0076-3p and miRCS36a with sites both in the Catalase domain, respectively (Figure 8). In addition to the target sites mentioned above, we also found that upland cotton novel_mir_0819 targeted the GhCATs in group I (GhCAT1/2/3/4) with the site in the Catalase domain (Figure 1). Upland cotton ghr-miR6138 and Mar-F-1-m0035 both targeted GhCAT5 and GhCAT6 in the Catalase domain. Additionally, novel_miR_48 that was both probably in upland cotton and sea-island cotton and induced by V. dahliae inoculation [48], targeted GhCAT2 and GbCAT2 (Table S7). Our findings suggested that the miRNA-mediated regulation of the CAT gene family was possibly conserved in the two allotetraploid cotton types, but the actual posttranscriptional regulatory relationships between cotton miRNAs and CATs need to be detected and verified in further experiments through relative molecular biology techniques.

3.7.4. Regulation of Isoforms by miRNAs

To investigate how miRNAs interact with isoforms, we predicted the target sites for the two allotetraploid cotton miRNAs using all CAT full-length isoforms. In upland cotton, 47 isoforms from all 7 GhCAT genes (including a total of 48 isoforms) were identified to be putative targets of 14 ghr-miRNAs, and only one isoform transcribed from GhCAT2 was not targeted by the miRNAs (Table S8). In sea-island cotton, we also found that 27 isoforms from 6 GbCAT genes (including a total of 30 isoforms) were putative targets of 11 gb-miRNAs, and only one isoform transcribed from GbCAT2 was not targeted by the miRNAs (Table S8). In addition, GbCAT6 was not transcript targeted by miRNAs. Our findings indicated that some isoforms transcribed from the same gene might escape regulation by miRNAs.
We also examined the effect of AS on the gain/loss of miRNA target sites among all CAT isoforms regulated by miRNAs, and all examples associated with miRNAs were shown in Figure S6. Specifically, GhCAT1 was predicted with nine isoforms, of which five and eight were targets of novel_miR_48 and novel_mir_0819, respectively (Figure S6). This gene underwent an ES event to produce three and one isoforms losing the novel_miR_48 and novel_mir_0819 target site, respectively. GhCAT2 transcribes nine isoforms, of which four were found to lose the target sites of novel_miR_48, ghr-miR5298, ghr-miR163, novel_mir_0819 and ghr-miR7502bp from an ES and/or AD event. GhCAT3 was found to transcribe four isoforms, of which one gained the target site of ghr-miR2645 by an IR event. GhCAT4 was found to transcribe eight isoforms, of which two gained the target sites of m0028 by an AA event. GhCAT7 was predicted to have fourteen isoforms, of which one and five gained the m0356 and m0149 target sites by an IR event and an AS event, respectively (Figure S6). GbCAT2 transcribes three isoforms, of which one was found to lose the target sites of novel_miR_48 by an ES event. GbCAT3 was found to transcribe seven isoforms, of which two gained the target sites of gb-miR7486 by an IR event. GbCAT7 was predicted to have five isoforms, of which two and two gained the miRC14 and miRC25 target sites by an AA event and anAS event, respectively (Figure S6). Collectively, these results indicated that miRNAs can couple with AS to regulate gene expression at the isoform level.

4. Discussion

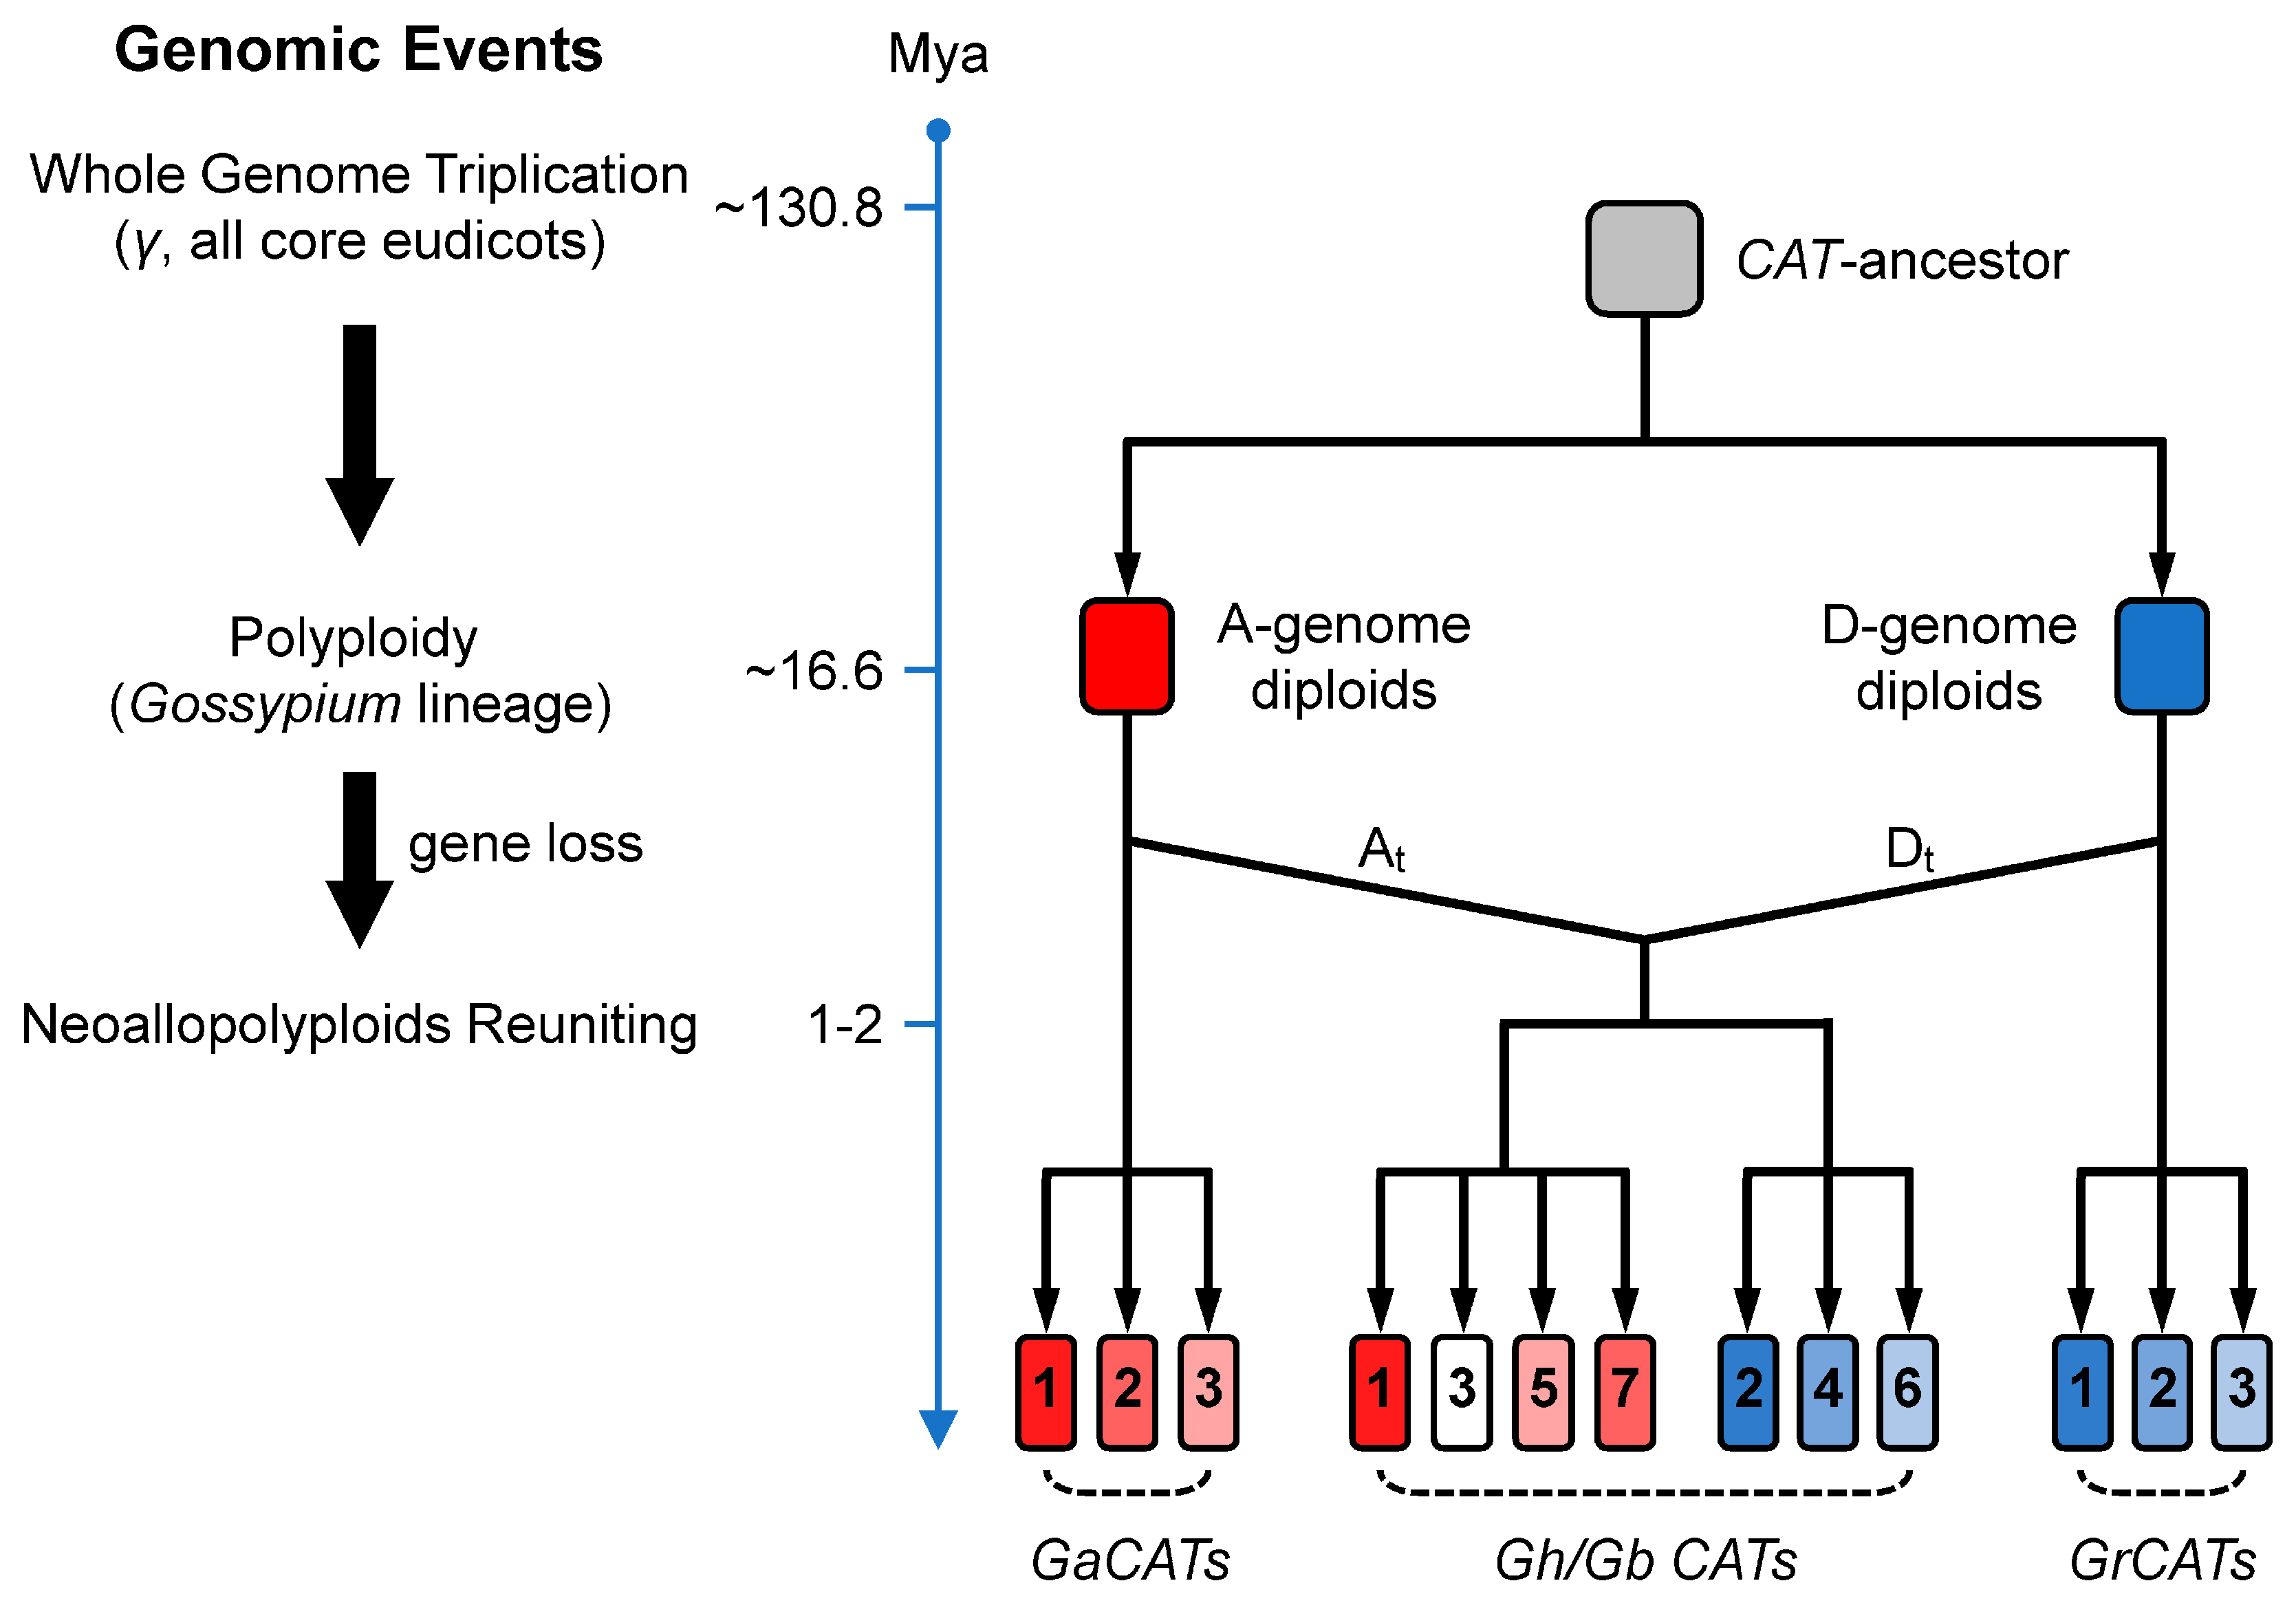
4.1. Evolutionary History of the CAT Gene Family in Gossypium Spp.

In the present study, we identified 7 GhCAT genes and 7 GbCAT genes from the genomes of upland cotton and sea-island cotton, respectively. We also searched CAT genes in two sequenced diploid cotton types and four other Rosids plant genomes, which were at key evolutionary nodes. The results showed that the gene number and phylogeny of CATs were basically consistent with the genome paleo-history (Figure S3), which suggested that these plant genomes have become more complexed during evolution and the CAT gene family expanded. Then, we identified genomic events in the progress of Rosids plants and investigated the synteny and collinearity relationships of CAT genes in Gossypium spp. The results indicated that WGD or polyploidy events had played a major role in the CAT gene family expansion in the Rosids. By combining several lines of evidence provided by phylogenetic analysis, and gene synteny for large-scale identification of CAT genes within eight Rosids genomes (Figure 3 and Figure S3), we built a tentative evolution model of the CAT gene family loci during the evolutionary history of Gossypium spp. (Figure 9). In the model, Gossypium CATs descended from one common ancestor, which expanded in diploid cotton types by one penta- or hexa-ploid duplication event in the Gossypium lineage after splitting from the cacao lineage ~16.6 Mya. Then, through the evolution of the cotton species following the gene loss, the GaCAT and GrCAT gene families formed, containing 3 members respectively. On the other side, when two diploid cotton species reunited geographically and were followed by polyploidization to form the allopolyploid cotton approximately 1–2 Mya, the CAT gene families of A-genome diploids and D-genome diploids also combined and formed the expanding gene family in neoallopolyploids. Among the GhCATs and GbCATs, CAT1/5/7, located on the At-subgenome, originated from GaCAT1/3/2, respectively; CAT2/4/6, located on the Dt-subgenome, originated from GrCAT1/2/3, respectively. Additionally, we propose that the donor gene of GhCAT3/GbCAT3 was lost during the evolution of the D-genome diploids (Figure 9).

4.2. Cotton CAT Genes Probably Function in Defense against Biotic Stress by Mediating ROS Metabolism

CAT is a strong antioxidant enzyme that mediates the ROS-scavenging process and thus plays a critical role in the development and plant responses to abiotic stresses [67]. It has been investigated in many plant species, including Arabidopsis [68,69,70,71], rice [9,14,72], cucumber [16,73], sugarcane [74] and sweet potato [75]. In Arabidopsis, drought-, and salt stress-induced AtCAT1 expression was mediated by an Arabidopsis MAPK kinase AtMEK1 and, furthermore, the triggering of ROS production might be involved in these processes [69]. Transcription of AtCAT2 was repressed by WRKY75 to enhance the ROS accumulation to accelerate leaf senescence [68]. Expression of AtCAT2 was suppressed to trigger endogenous ROS production in response to Pb stress [70]. AtCAT3 was phosphorylated by a calcium-dependent protein kinases CPK8 to mediate ROS homeostasis in the peroxisome of guard cells and was associated with a classical drought stress response, and the overexpression of AtCAT3 enhanced its tolerance to drought stress [71]. In rice, OsCatA, OsCatB, and OsCatC were involved in the environmental stress response; the regulation of ROS levels or homeostasis related to root growth regulation and photorespiration; and the overexpression of OsCatA and OsCatC conferred tolerance to drought stress in transgenic rice [14]. In the stress tolerant genotype of rice, OsCatA and OsCatB were the most responsive to high salinities and cold, while in the sensitive genotype, OsCatA and OsCatC responded positively to saline stress, as did OsCatA and OsCatB to low temperatures [72]. OsCatC was phosphorylated and activated by a salt tolerance receptor-like cytoplasmic kinase to regulate ROS homeostasis and improve salt tolerance in rice [9]. In cucumber, CsCAT1 was only activated by abscisic acid treatment, CsCAT2 transcription was reduced in response to droughts, CsCAT3 transcription was enhanced under salt and drought stress conditions and reduced under ABA stress conditions, and the overexpression of CsCAT3 in Escherichia coli could increase the tolerance to heat, cold, salinity and osmotic conditions. These results indicated that the activation of cucumber CsCATs might differ in response to different abiotic stresses [16,73]. In sugarcane, the expression of ScCAT1 can be induced by different kinds of stresses, including oxidative, heavy metal, drought and NaCl stresses [74]. In sweet potato, the expression of IbCAT2 was regulated by PEG6000 and NaCl treatments, and the overexpression of IbCAT2 conferred salt and drought tolerance in E. coli and Saccharomyces cerevisiae [75]. Taken together, these studies suggest that CATs were important in the triggering of the ROS metabolism, and the activation of plant responses to abiotic stresses. However, little research was carried out to investigate the relationship between CAT and the V. dahliae infection in cotton.
In the present study, to investigate the roles of the cotton CAT gene family in responses to biotic stress, we analyzed their transcript levels under the V. dahliae infection treatment and found that the expression of the cotton CAT gene family was up-regulated, which might be involved in the defense against V. dahliae (Figure 5). As for which member(s) mainly contributed to the biotic stress response preliminarily, the functional analysis of cotton CAT gene family needs to be further explored using the assays of over-expression and loss of functions.

4.3. The Potential Regulatory Mechanisms of Cotton CAT Gene Expression

Based on the results presented here as well as those reported previously [10,11,24], CAT-dependent ROS metabolism plays important functional roles in response to various stresses, including abiotic and biotic stresses. There were some publications that described the regulation of CATs [76]. However, the potential regulatory mechanisms of CAT gene expression are yet to be elucidated in cotton. In the resent study, we predicted the TFBSs, AS events and miRNA-mediated regulations which might provide an insight into the potential regulatory mechanisms of cotton CAT gene expression and their functional multiplicity.
Through regulating target gene expression accurately, TFs, which generally consisted of a DNA-binding domain and transcriptional activation (or inhibition) domain, operate as important switches of transcription networks and control multiple cellular processes [77], including plant growth and development [58,62,68], and response to stresses [78]. We predicted the TFBSs in the promoter regions of the cotton CAT gene family and found that some famous plant TFs might bind to cotton CAT genes and potentially regulate their expression. These TFs belonged to different families such as MYB, NAC and TCP (Table S6, Figure 6 and Figure S5). In Arabidopsis, Guo et al. found that WRKY75, a WRKY TF, repressed ROS scavenging by suppressing CAT2 transcription involved in the regulation of leaf senescence [68]. In rice, a recent study provided the rare combination of TFs and ROS burst that constituted a novel molecular mechanism employed by rice blast resistance [78]. More concretely, a natural allele of a C2H2-type transcription factor causes a single nucleotide mutation in the promoter, which resulted in the reduced expression of the gene through the binding of the repressive MYB transcription factor and, consequently, an inhibition of ROS degradation by decreasing the peroxide accumulation and enhanced disease resistance [78]. In cotton, recent studies have demonstrated that by regulating ROS metabolism networks, many of these TFs were involved in different aspects of plant developmental processes, including leaf senescence [79], anther/pollen development [80] and fiber development [81], as well as in stress responses, such as drought tolerance [82], salt tolerance [83] and pathogen inoculation [84]. However, how CAT-mediated ROS metabolism is regulated by TFs involved in both abiotic and biotic stresses in cotton remains unknown and needs to be further investigated in our following research with the help of newly developed technologies, such as GWAS, ATAC-seq, FAIRE-seq and ChIP-seq. It is a topic that we plan to report on comprehensively elsewhere.
In the present study, we found that under non-stress and stress conditions, the expression levels of cotton CAT3 and CAT7 were extremely low. Phylogenetic and synteny analysis revealed that the evolution of CAT3 and CAT7, clustering to group I and group II, respectively, might be driven by gene duplication. It was generally known that gene redundancy, which most often resulted from gene duplication, generally had overlapping functions. Thus, we suspected that CAT3 and CAT7 were disrupted by a mechanism and there could only be a little effect on phenotype because of gene redundancy. Meanwhile, we noticed that compared with other CATs, GhCAT7, GbCAT3 and GbCAT7 existed more putative in AS events (Figure S6). Hence, we hypothesized that AS might be one of the potential mechanisms in the regulation of CAT3 and CAT7 expressions. AS of pre-mRNAs from multiexon genes allows for organisms to increase their coding potential and regulate their gene expression through multiple mechanisms [85]. Compared with constitutive splicing, more alternatively spliced isoforms exhibited cell-, tissue- or condition-specific expression patterns, and AS often generated transcripts with premature termination codons (PTC), which would be selectively degraded by a non-sense-mediated mRNA decay (NMD) process [86]. NMD was a cytoplasmic RNA degradation system, which occurs on ribosomes on the first round of translation. NMD triggered transcript decay when translation termination was perturbed [85]. During cloning ORFs of CATs, apart from CAT3 and CAT7, the other CAT genes were cloned correctly from cDNA libraries of cotton infected by V. dahliae. Additionally, we had obtained multiple types of transcripts of CAT3 and CAT7, which were all with PTC. Take the upland cotton example, 24 and 48 clones of GhCAT3 and GhCAT7 were randomly selected to be sequenced, respectively, and 2 and 14 types transcripts were obtained. Sanger sequencing showed that all these alternatively spliced isoforms contained PTC. We selected the largest-rate transcripts of GhCAT3 and GhCAT7 shown in Figure S8. According to our findings, the coupling of AS to mRNA stability through NMD might be one of the reasons why the expression levels of cotton CAT3 and CAT7 were extremely low under normal conditions and under stress treatments.
miRNAs, a class of single-stranded noncoding small RNAs, have been shown to be regulatory of gene expression by targeting endogenous and/or exogenous genes [87,88]. Growing evidence reveals that miRNA-guided regulation of ROS-related genes at the post-transcriptional level is essential for normal growth and development [89] and the adaptation to stress conditions [48,90] including drought, salinity, high light, heavy metals, and many bacterial and fungal pathogen infections. However, seldom reports had been found on the CAT gene expression and regulation mediated by miRNAs under V. dahliae infection. In our study, we predicted the miRNA-mediated posttranscriptional regulation of cotton CATs and found some putative target sites of cotton miRNAs (Table S7 and Figure 8). To preliminarily verify the target relationship of cotton CATs and miRNAs, we tested their expression patterns with Vd414 infection treatment by qPCR (Figure S7). There were 4 ghr-miRNAs and 2 gb-miRNAs and its target cotton CAT mRNAs showed a negative regulation relationship during the V. dahliae infection, respectively. This indicated that these cotton miRNAs might play crucial roles in the VW pathogen infection by regulating the CAT genes.
Recently, attention has been focused on mobile miRNAs that mediate cross-kingdom regulation in plant-pathogen interactions [87,88]. miRNAs from the plant pathogenic fungus, such as Botrytis cinerea Pers. and Puccinia striiformis f. sp. tritici Westend., targeted host mRNAs to suppress plant immunity during infection [91,92], and host-induced gene silencing (HIGS) that targeted dicer-like mRNAs in B. cinerea reduced the pathogen virulence [93]. Conversely, plant miRNAs were exported from cotton into the fungal pathogen V. dahliae to inhibit pathogen virulence gene expression to enhance the disease resistance of cotton plants [94]. Although miRNA-mediated bidirectional cross-kingdom regulation existed widely in plant-pathogen interactions, a genome-scale characterization analysis and the relationship between cross-kingdom regulation and ROS metabolism have not yet been reported. In view of this, combining previous studies of our laboratory [45,48], we constructed the sRNA library of V. dahliae cultured from hyphae recovered from infected cotton plants to investigate the topic using a high-throughput sequencing technology and the bioinformatics analysis. Some preliminary results have been obtained, and it is a topic that we plan to report on comprehensively elsewhere.
Recently, with the development of omics, high-throughput sequencing and bioinformatics, the arsenal of modern molecular biology technology was significantly expanded with iTRAQ, Hi-C, GWAS, CRISPR-mediated gene editing, and so on and so forth. These weapons had been applied to many areas of agriculture and life sciences, and important progress has been made. In fact, plant growth and development, disease resistance and the interactions between plants and their environment were regulated by many molecular mechanisms and metabolic pathways, which formed a complex and interrelated network. Therefore, we thought that finding out how to integrate these advanced technologies organically to investigate complex networks would reveal the nature of life in larger scales, though there is still a long way to go.

5. Conclusions

Various studies suggested that ROS, as the second cellular messengers of plants, played a crucial role in a variety of biotic stress responses. CAT, the first antioxidant enzyme to be discovered and characterized, maintained the balance of cellular redox biology by scavenging ROS. Here, we focused on the cotton CAT gene family, which coded CAT proteins and was involved in ROS metabolism by catalyzing H2O2 to water and oxygen. We identified 7 and 7 CAT genes in upland cotton and sea-island cotton genomes, respectively. WGD or polyploidy events contributed to the expansion of the Gossypium CAT gene family during the evolutionary process. Gossypium CAT genes showed different expression patterns in different tissues and developmental stages and under different stress treatments. Moreover, we predicted the putative molecular regulatory mechanisms of the Gossypium CAT gene family. Based on the analysis and preliminary verification results, we hypothesized that the CAT gene family might be regulated by TFs, AS events and miRNAs at different levels. Generally, our analysis of the Gossypium CAT gene family broadens our insight into the roles of CAT genes in plant stress responses and the ROS metabolism and provides the foundation for further functional characterization of the GhCAT and GbCAT gene families and for potential applications towards the genetic improvement of cotton.

Supplementary Materials

The following are available online at https://www.mdpi.com/2073-4409/8/2/86/s1, Table S1: Summary of some plant CAT genes in relation to the biotic and abiotic stress resistance, Table S2: Primers used in this study, Table S3: Gene numbers of CAT gene family in four other genomes descended from common eudicot genome ancestor with Gossypium in Rosids, Table S4: Orthologous CAT gene pairs among G. arboreum L., G. raimondii Ulbr., G. hirsutum L. and G. barbadense L., Table S5: The details of GhCAT and GbCAT gene family expression difference in different tissues and/or organs, at developmental processes of ovules and fibers, and under different stress treatments, Table S6: List of identified TFBSs in the putative promoter regions of GhCAT and GbCAT gene family using PlantTFDB 4.0 (http://planttfdb.cbi.pku.edu.cn/), Table S7: The predicted details of miRNA-mediated targeting regulatory relations with the principle transcripts of CAT gene family in upland cotton and sea-island cotton using the psRNATarget web server (http://plantgrn.noble.org/psRNATarget/home), Table S8: The predicted details of miRNA-mediated targeting regulatory relations with all full-length isoforms of CAT gene family in upland cotton and sea-island cotton using the psRNATarget web server (http://plantgrn.noble.org/psRNATarget/home). Figure S1: (A) Blast hits of GbCAT7 (GOBAR_AA20422) in the upland cotton genome database [cDNA, G. hirsutum (AD1), NAU] and the location of the designed primer pairs for cloning the actual ORF of GbCAT7. (B) PCR result shows that the actual TSS of GbCAT7 is the ATG contained by the F3 forward primer (green dotted underline in A). (C) Verification of the amplified line in Figure S1 (B) by PCR-based sequencing, Figure S2: The supporting alignment result of the coding sequence of GbCAT7 (GOBAR_AA20422) and Gh_A07G1555. Query, the coding sequence of GbCAT7; Subject, the coding sequence of Gh_A07G1555, Figure S3: Phylogenetic tree of Gossypium and four other genomes descended from common eudicot genome ancestor in Rosids and the number of CAT genes identified from the genomes of these plants, Figure S4: Transcriptional profiling of GhCATs under different abiotic stress treatments, Figure S5: Gene Ontology (GO) annotation of the TFs binding to the upland cotton and sea-island cotton CAT genes’ putative promoter regions based on their cellular component, molecular function, and biological process, Figure S6: All potentially alternative spliced isoform structure of GhCATs and GbCATs full-length transcripts and identification of full-length isoforms targeted by cotton miRNAs, Figure S7: The relative expression levels of miRNAs and their putative targeting CAT genes under V. dahliae infection treatment, Figure S8: (A, B) Amplification of GhCAT3 (Gh_A05G1539) and GhCAT7 (Gh_A07G1556) by PCR with the designed primer pairs for cloning their transcripts. PCR results were aligned with gene structure annotation and were verified by Sanger sequencing.

Author Contributions

W.W. and F.S. conceived and designed the research; W.W., Y.C., D.C., D.L. and M.H. performed the experiments; X.Z. and L.S. contributed analysis tools; W.W. analyzed the data, prepared figures, and wrote the manuscript; F.S. and J.D. performed English editing; and all authors reviewed the manuscript.

Funding

This research was mainly supported by National Key R&D Program of China (Grant Nos. 2018YFD0100303) and China Major Projects for Transgenic Breeding (Grant Nos. 2016ZX08005-004).

Acknowledgments

We are grateful to Zujun Yin (The Institute of Cotton Research, Chinese Academy of Agricultural Sciences) for proving seeds of G. barbadense L. cv. Hai7124.

Conflicts of Interest

The authors declare no conflict of interest.

References

  1. Choudhury, F.K.; Rivero, R.M.; Blumwald, E.; Mittler, R. Reactive oxygen species, abiotic stress and stress combination. Plant J. 2017, 90, 856–867. [Google Scholar] [CrossRef]
  2. Mittler, R. Ros are good. Trends Plant Sci. 2016, 22, 11–19. [Google Scholar] [CrossRef]
  3. Ma, H.; Xiang, G.; Li, Z.; Wang, Y.; Dou, M.; Su, L.; Yin, X.; Liu, R.; Wang, Y.; Xu, Y. Grapevine vppr10.1 functions in resistance to plasmopara viticola through triggering a cell death-like defence response by interacting with vpvdac3. Plant Biotechnol. J. 2018, 16, 1488–1501. [Google Scholar] [CrossRef]
  4. Fan, J.; Bai, P.; Ning, Y.; Wang, J.; Shi, X.; Xiong, Y.; Zhang, K.; He, F.; Zhang, C.; Wang, R.; et al. The monocot-specific receptor-like kinase SDS2 controls cell death and immunity in rice. Cell Host Microbe 2018, 23, 498–510. [Google Scholar] [CrossRef]
  5. Del Pozo, J.C. Reactive oxygen species: From harmful molecules to fine-tuning regulators of stem cell niche maintenance. PLoS Genet. 2016, 12, e1006251. [Google Scholar] [CrossRef]
  6. Wang, W.; Xia, M.X.; Chen, J.; Yuan, R.; Deng, F.N.; Shen, F.F. Gene expression characteristics and regulation mechanisms of superoxide dismutase and its physiological roles in plants under stress. Biochem. Moscow 2016, 81, 465–480. [Google Scholar]
  7. Mittler, R. Oxidative stress, antioxidants and stress tolerance. Trends Plant Sci. 2002, 7, 405–410. [Google Scholar] [CrossRef]
  8. Wang, W.; Zhang, X.; Deng, F.; Yuan, R.; Shen, F. Genome-wide characterization and expression analyses of superoxide dismutase (sod) genes in gossypium hirsutum. BMC Genom. 2017, 18, 376. [Google Scholar] [CrossRef]
  9. Zhou, Y.-B.; Liu, C.; Tang, D.-Y.; Yan, L.; Wang, D.; Yang, Y.-Z.; Gui, J.-S.; Zhao, X.-Y.; Li, L.-G.; Tang, X.-D.; et al. The receptor-like cytoplasmic kinase strk1 phosphorylates and activates catc, thereby regulating h2o2 homeostasis and improving salt tolerance in rice. Plant Cell 2018, 30, 1100–1118. [Google Scholar] [CrossRef]
  10. Mhamdi, A.; Queval, G.; Chaouch, S.; Vanderauwera, S.; Van Breusegem, F.; Noctor, G. Catalase function in plants: A focus on arabidopsis mutants as stress-mimic models. J. Exp. Bot. 2010, 61, 4197–4220. [Google Scholar] [CrossRef]
  11. Du, Y.-Y.; Wang, P.-C.; Chen, J.; Song, C.-P. Comprehensive functional analysis of the catalase gene family in arabidopsis thaliana. J. Integr. Plant Biol. 2008, 50, 1318–1326. [Google Scholar] [CrossRef] [PubMed]
  12. Willekens, H.; Villarroel, R.; Van Montagu, M.; Inzé, D.; Van Camp, W. Molecular identification of catalases from nicotiana plumbaginifolia (L.). FEBS Lett. 1994, 352, 79–83. [Google Scholar] [CrossRef]
  13. Guan, L.; Scandalios, J.G. Developmentally related responses of maize catalase genes to salicylic acid. Proc. Natl. Acad. Sci. USA 1995, 92, 5930–5934. [Google Scholar] [CrossRef] [PubMed]
  14. Joo, J.; Lee, Y.H.; Song, S.I. Rice CatA, CatB, and CatC are involved in environmental stress response, root growth, and photorespiration, respectively. J. Plant Biol. 2014, 57, 375–382. [Google Scholar] [CrossRef]
  15. Esaka, M.; Yamada, N.; Kitabayashi, M.; Setoguchi, Y.; Tsugeki, R.; Kondo, M.; Nishimura, M. cDNA cloning and differential gene expression of three catalases in pumpkin. Plant Mol. Biol. 1997, 33, 141–155. [Google Scholar] [CrossRef] [PubMed]
  16. Hu, L.; Yang, Y.; Jiang, L.; Liu, S. The Catalase gene family in cucumber: Genome-wide identification and organization. Genet. Mol. Biol. 2016, 39, 408–415. [Google Scholar] [CrossRef] [PubMed]
  17. Skadsen, R.W.; Schulze-Lefert, P.; Herbst, J.M. Molecular cloning, characterization and expression analysis of two catalase isozyme genes in barley. Plant Mol. Biol. 1995, 29, 1005–1014. [Google Scholar] [CrossRef] [PubMed]
  18. Chen, H.-J.; Wu, S.-D.; Huang, G.-J.; Shen, C.-Y.; Afiyanti, M.; Li, W.-J.; Lin, Y.-H. Expression of a cloned sweet potato catalase spcat1 alleviates ethephon-mediated leaf senescence and h2o2 elevation. J. Plant Physiol. 2012, 169, 86–97. [Google Scholar] [CrossRef] [PubMed]
  19. González, E. The c-terminal domain of plant catalases implications for a glyoxysomal targeting sequence. Eur. J. Biochem. 1991, 199, 211–215. [Google Scholar] [CrossRef] [PubMed]
  20. Drory, A.; Woodson, W.R. Molecular cloning and nucleotide sequence of a cDNA encoding catalase from tomato. Plant Physiol. 1992, 100, 1605–1606. [Google Scholar] [CrossRef]
  21. Inaba, J.-I.; Kim, B.M.; Shimura, H.; Masuta, C. Virus-induced necrosis is a consequence of direct protein-protein interaction between a viral RNA-silencing suppressor and a host catalase. Plant Physiol. 2011, 156, 2026–2036. [Google Scholar] [CrossRef] [PubMed]
  22. Hackenberg, T.; Juul, T.; Auzina, A.; Gwiżdż, S.; Małolepszy, A.; Van Der Kelen, K.; Dam, S.; Bressendorff, S.; Lorentzen, A.; Roepstorff, P.; et al. Catalase and NO CATALASE ACTIVITY1 promote autophagy-dependent cell death in Arabidopsis. Plant Cell 2013, 25, 4616–4626. [Google Scholar] [CrossRef]
  23. Singh, S.; Braus-Stromeyer, S.A.; Timpner, C.; Valerius, O.; von Tiedemann, A.; Karlovsky, P.; Druebert, C.; Polle, A.; Braus, G.H. The plant host Brassica napus induces in the pathogen Verticillium longisporum the expression of functional catalase peroxidase which is required for the late phase of disease. Mol. Plant Microbe Interact. 2011, 25, 569–581. [Google Scholar] [CrossRef] [PubMed]
  24. Queval, G.; Issakidis-Bourguet, E.; Hoeberichts, F.A.; Vandorpe, M.; Gakière, B.; Vanacker, H.; Miginiac-Maslow, M.; Van Breusegem, F.; Noctor, G. Conditional oxidative stress responses in the arabidopsis photorespiratory mutant cat2 demonstrate that redox state is a key modulator of daylength-dependent gene expression, and define photoperiod as a crucial factor in the regulation of h2o2-induced cell death. Plant J. 2007, 52, 640–657. [Google Scholar]
  25. Contento, A.L.; Bassham, D.C. Increase in catalase-3 activity as a response to use of alternative catabolic substrates during sucrose starvation. Plant Physiol. Biochem. 2010, 48, 232–238. [Google Scholar] [CrossRef] [PubMed]
  26. Niewiadomska, E.; Polzien, L.; Desel, C.; Rozpadek, P.; Miszalski, Z.; Krupinska, K. Spatial patterns of senescence and development-dependent distribution of reactive oxygen species in tobacco (Nicotiana tabacum) leaves. J. Plant Physiol. 2009, 166, 1057–1068. [Google Scholar] [CrossRef] [PubMed]
  27. Polidoros, A.N.; Mylona, P.V.; Scandalios, J.G. Transgenic tobacco plants expressing the maize Cat2 gene have altered catalase levels that affect plant-pathogen interactions and resistance to oxidative stress. Transgenic Res. 2001, 10, 555–569. [Google Scholar] [CrossRef]
  28. Chen, Z.J.; Scheffler, B.E.; Dennis, E.; Triplett, B.A.; Zhang, T.; Guo, W.; Chen, X.; Stelly, D.M.; Rabinowicz, P.D.; Town, C.D.; et al. Toward sequencing cotton (Gossypium) genomes. Plant Physiol. 2007, 145, 1303–1310. [Google Scholar] [CrossRef]
  29. Rathore, K.; Campbell, L.; Sherwood, S.; Nunes, E. Cotton (Gossypium hirsutum L.). In Agrobacterium Protocols; Wang, K., Ed.; Springer: New York, NY, USA, 2015; Volume 1224, pp. 11–23. [Google Scholar]
  30. Paterson, A.H.; Wendel, J.F.; Gundlach, H.; Guo, H.; Jenkins, J.; Jin, D.; Llewellyn, D.; Showmaker, K.C.; Shu, S.; Udall, J.; et al. Repeated polyploidization of Gossypium genomes and the evolution of spinnable cotton fibres. Nature 2012, 492, 423–427. [Google Scholar] [CrossRef]
  31. Berlanger, I.; Powelson, M.L. Verticillium wilt. Plant Health Instr. 2000, 151, 109–110. [Google Scholar] [CrossRef]
  32. Li, C.; He, X.; Luo, X.; Xu, L.; Liu, L.; Min, L.; Jin, L.; Zhu, L.; Zhang, X. Cotton wrky1 mediates the plant defense-to-development transition during infection of cotton by Verticillium dahliae by activating Jasmonate zim-domain1 expression. Plant Physiol. 2014, 166, 2179–2194. [Google Scholar] [CrossRef]
  33. Li, Y.-B.; Han, L.-B.; Wang, H.-Y.; Zhang, J.; Sun, S.-T.; Feng, D.-Q.; Yang, C.-L.; Sun, Y.-D.; Zhong, N.-Q.; Xia, G.-X. The thioredoxin gbnrx1 plays a crucial role in homeostasis of Apoplastic reactive oxygen species in response to Verticillium dahliae infection in cotton. Plant Physiol. 2016, 170, 2392–2406. [Google Scholar] [CrossRef] [PubMed]
  34. Zhang, Y.; Wang, X.; Rong, W.; Yang, J.; Li, Z.; Wu, L.; Zhang, G.; Ma, Z. Histochemical analyses reveal that stronger intrinsic defenses in Gossypium barbadense than in G. Hirsutum are associated with resistance to Verticillium dahliae. Mol. Plant Microbe Interact. 2017, 30, 984–996. [Google Scholar] [CrossRef]
  35. Sun, L.; Zhu, L.; Xu, L.; Yuan, D.; Min, L.; Zhang, X. Cotton cytochrome P450 CYP82D regulates systemic cell death by modulating the octadecanoid pathway. Nat. Commun. 2014, 5, 5372. [Google Scholar] [CrossRef] [PubMed] [Green Version]
  36. Yang, C.-L.; Liang, S.; Wang, H.-Y.; Han, L.-B.; Wang, F.-X.; Cheng, H.-Q.; Wu, X.-M.; Qu, Z.-L.; Wu, J.-H.; Xia, G.-X. Cotton major latex protein 28 functions as a positive regulator of the ethylene responsive factor 6 in defense against Verticillium dahliae. Mol. Plant 2014, 8, 399–411. [Google Scholar] [CrossRef] [PubMed]
  37. Li, F.; Fan, G.; Wang, K.; Sun, F.; Yuan, Y.; Song, G.; Li, Q.; Ma, Z.; Lu, C.; Zou, C.; et al. Genome sequence of the cultivated cotton Gossypium arboreum. Nat. Genet. 2014, 46, 567–572. [Google Scholar] [CrossRef] [PubMed]
  38. Wang, K.; Wang, Z.; Li, F.; Ye, W.; Wang, J.; Song, G.; Yue, Z.; Cong, L.; Shang, H.; Zhu, S.; et al. The draft genome of a diploid cotton Gossypium raimondii. Nat. Genet. 2012, 44, 1098–1103. [Google Scholar] [CrossRef]
  39. Zhang, T.; Hu, Y.; Jiang, W.; Fang, L.; Guan, X.; Chen, J.; Zhang, J.; Saski, C.A.; Scheffler, B.E.; Stelly, D.M.; et al. Sequencing of allotetraploid cotton (Gossypium hirsutum L. Acc. TM-1) provides a resource for fiber improvement. Nat. Biotechnol. 2015, 33, 531–537. [Google Scholar] [CrossRef]
  40. Liu, X.; Zhao, B.; Zheng, H.-J.; Hu, Y.; Lu, G.; Yang, C.-Q.; Chen, J.-D.; Chen, J.-J.; Chen, D.-Y.; Zhang, L.; et al. Gossypium barbadense genome sequence provides insight into the evolution of extra-long staple fiber and specialized metabolites. Sci. Rep. 2015, 5, 14139. [Google Scholar] [CrossRef]
  41. Zhu, T.; Liang, C.; Meng, Z.; Sun, G.; Meng, Z.; Guo, S.; Zhang, R. CottonFGD: An integrated functional genomics database for cotton. BMC Plant Biol. 2017, 17, 101. [Google Scholar] [CrossRef]
  42. Kumar, S.; Nei, M.; Dudley, J.; Tamura, K. Mega: A biologist-centric software for evolutionary analysis of DNA and protein sequences. Brief. Bioinform. 2008, 9, 299–306. [Google Scholar] [CrossRef] [PubMed]
  43. Van Bel, M.; Diels, T.; Vancaester, E.; Kreft, L.; Botzki, A.; Van de Peer, Y.; Coppens, F.; Vandepoele, K. Plaza 4.0: An integrative resource for functional, evolutionary and comparative plant genomics. NAR 2018, 46, D1190–D1196. [Google Scholar] [CrossRef] [PubMed]
  44. Yang, X.; Wang, L.; Yuan, D.; Lindsey, K.; Zhang, X. Small RNA and degradome sequencing reveal complex mirna regulation during cotton somatic embryogenesis. J. Exp. Bot. 2013, 64, 1521–1536. [Google Scholar] [CrossRef] [PubMed]
  45. Yin, Z.; Li, Y.; Han, X.; Shen, F. Genome-wide profiling of miRNAs and other small non-coding RNAs in the Verticillium dahlia-inoculated cotton roots. PLoS ONE 2012, 7, e35765. [Google Scholar]
  46. Yin, Z.; Li, Y.; Yu, J.; Liu, Y.; Li, C.; Han, X.; Shen, F. Difference in miRNA expression profiles between two cotton cultivars with distinct salt sensitivity. Mol. Biol. Rep. 2012, 39, 4961–4970. [Google Scholar] [CrossRef] [PubMed]
  47. Wang, Z.M.; Xue, W.; Dong, C.J.; Jin, L.G.; Bian, S.M.; Wang, C.; Wu, X.Y.; Liu, J.Y. A comparative mirnaome analysis reveals seven fiber initiation-related and 36 novel mirnas in developing cotton ovules. Mol. Plant 2012, 5, 889–900. [Google Scholar] [CrossRef]
  48. Zhang, Y.; Wang, W.; Chen, J.; Liu, J.; Xia, M.; Shen, F. Identification of miRNAs and their targets in cotton inoculated with Verticillium dahliae by high-throughput sequencing and degradome analysis. Int. J. Mol. Sci. 2015, 16, 14749–14768. [Google Scholar] [CrossRef]
  49. Xie, F.; Wang, Q.; Sun, R.; Zhang, B. Deep sequencing reveals important roles of micrornas in response to drought and salinity stress in cotton. J. Exp. Bot. 2015, 66, 789–804. [Google Scholar] [CrossRef]
  50. Hu, H.; Yu, D.; Liu, H. Bioinformatics analysis of small RNAs in pima (Gossypium barbadense L.). PLoS ONE 2015, 10, e0116826. [Google Scholar] [CrossRef]
  51. Liu, N.; Tu, L.; Tang, W.; Gao, W.; Lindsey, K.; Zhang, X. Small RNA and degradome profiling reveals a role for miRNAs and their targets in the developing fibers of Gossypium barbadense. Plant J. 2014, 80, 331–344. [Google Scholar] [CrossRef]
  52. Maojun, W.; Pengcheng, W.; Fan, L.; Zhengxiu, Y.; Jianying, L.; Chao, S.; Liuling, P.; Feng, W.; Jiang, H.; Lili, T.; et al. A global survey of alternative splicing in allopolyploid cotton: Landscape, complexity and regulation. New Phytol. 2018, 217, 163–178. [Google Scholar]
  53. Lu, K.; Li, T.; He, J.; Chang, W.; Zhang, R.; Liu, M.; Yu, M.; Fan, Y.; Ma, J.; Sun, W.; et al. qPrimerDB: A thermodynamics-based gene-specific qPCR primer database for 147 organisms. Nucleic Acids Res. 2018, 46, D1229–D1236. [Google Scholar] [CrossRef] [PubMed]
  54. Sang, J.; Wang, Z.; Li, M.; Cao, J.; Niu, G.; Xia, L.; Zou, D.; Wang, F.; Xu, X.; Han, X.; et al. ICG: A wiki-driven knowledgebase of internal control genes for RT-qPCR normalization. Nucleic Acids Res. 2018, 46, D121–D126. [Google Scholar] [CrossRef] [PubMed]
  55. Klotz, M.G.; Klassen, G.R.; Loewen, P.C. Phylogenetic relationships among prokaryotic and eukaryotic catalases. Mol. Biol. Evol. 1997, 14, 951–958. [Google Scholar] [CrossRef] [Green Version]
  56. Tang, H.; Bowers, J.E.; Wang, X.; Ming, R.; Alam, M.; Paterson, A.H. Synteny and collinearity in plant genomes. Science 2008, 320, 486–488. [Google Scholar] [CrossRef]
  57. Jiao, Y.; Wickett, N.J.; Ayyampalayam, S.; Chanderbali, A.S.; Landherr, L.; Ralph, P.E.; Tomsho, L.P.; Hu, Y.; Liang, H.; Soltis, P.S.; et al. Ancestral polyploidy in seed plants and Angiosperms. Nature 2011, 473, 97–100. [Google Scholar] [CrossRef]
  58. Ma, J.; Liu, F.; Wang, Q.; Wang, K.; Jones, D.C.; Zhang, B. Comprehensive analysis of TCP transcription factors and their expression during cotton (Gossypium arboreum) fiber early development. Sci. Rep. 2016, 6, 21535. [Google Scholar] [CrossRef]
  59. Zhang, Z.; Li, H.; Qin, G.; He, C.; Li, B.; Tian, S. The mads-box transcription factor bcmads1 is required for growth, sclerotia production and pathogenicity of Botrytis cinerea. Sci. Rep. 2016, 6, 33901. [Google Scholar] [CrossRef]
  60. Cosio, C.; Ranocha, P.; Francoz, E.; Burlat, V.; Zheng, Y.; Perry, S.E.; Ripoll, J.J.; Yanofsky, M.; Dunand, C. The class III peroxidase PRX17 is a direct target of the mads-box transcription factor AGAMOUS-LIKE15 (AGL15) and participates in lignified tissue formation. New Phytol. 2017, 213, 250–263. [Google Scholar] [CrossRef]
  61. Liu, J.; Osbourn, A.; Ma, P. MYB transcription factors as regulators of phenylpropanoid metabolism in plants. Mol. Plant 2015, 8, 689–708. [Google Scholar] [CrossRef]
  62. Kim, H.J.; Nam, H.G.; Lim, P.O. Regulatory network of NAC transcription factors in leaf senescence. Curr. Opin. Plant Biol. 2016, 33, 48–56. [Google Scholar] [CrossRef] [PubMed]
  63. Chen, Z.-Y.; Guo, X.-J.; Chen, Z.-X.; Chen, W.-Y.; Liu, D.-C.; Zheng, Y.-L.; Liu, Y.-X.; Wei, Y.-M.; Wang, J.-R. Genome-wide characterization of developmental stage- and tissue-specific transcription factors in wheat. BMC Genom. 2015, 16, 125. [Google Scholar] [CrossRef] [PubMed]
  64. Nilsen, T.W.; Graveley, B.R. Expansion of the eukaryotic proteome by alternative splicing. Nature 2010, 463, 457. [Google Scholar] [CrossRef] [PubMed]
  65. Pan, Q.; Shai, O.; Lee, L.J.; Frey, B.J.; Blencowe, B.J. Deep surveying of alternative splicing complexity in the human transcriptome by high-throughput sequencing. Nat. Genet. 2008, 40, 1413. [Google Scholar] [CrossRef] [PubMed]
  66. Laloum, T.; Martín, G.; Duque, P. Alternative splicing control of abiotic stress responses. Trends Plant Sci. 2018, 23, 140–150. [Google Scholar] [CrossRef] [PubMed]
  67. Leung, D.W.M. Studies of catalase in plants under abiotic stress. In Antioxidants and Antioxidant Enzymes in Higher Plants; Gupta, D.K., Palma, J.M., Corpas, F.J., Eds.; Springer International Publishing: Cham, Switzerland, 2018; pp. 27–39. [Google Scholar]
  68. Guo, P.; Li, Z.; Huang, P.; Li, B.; Fang, S.; Chu, J.; Guo, H. A tripartite amplification loop involving the transcription factor WRKY75, salicylic acid, and reactive oxygen species accelerates leaf senescence. Plant Cell 2017, 29, 2854–2870. [Google Scholar] [CrossRef]
  69. Xing, Y.; Jia, W.; Zhang, J. Atmek1 mediates stress-induced gene expression of cat1 catalase by triggering H2O2 production in Arabidopsis. J. Exp. Bot. 2007, 58, 2969–2981. [Google Scholar] [CrossRef] [PubMed]
  70. Corpas, F.J.; Barroso, J.B. Lead-induced stress, which triggers the production of nitric oxide (no) and superoxide anion (O2·−) in arabidopsis peroxisomes, affects catalase activity. Nitric Oxide 2017, 68, 103–110. [Google Scholar] [CrossRef]
  71. Zou, J.-J.; Li, X.-D.; Ratnasekera, D.; Wang, C.; Liu, W.-X.; Song, L.-F.; Zhang, W.-Z.; Wu, W.-H. Arabidopsis CALCIUM-DEPENDENT PROTEIN KINASE8 and CATALASE3 function in abscisic acid-mediated signaling and H2O2 homeostasis in stomatal guard cells under drought stress. Plant Cell 2015, 27, 1445–1460. [Google Scholar] [CrossRef]
  72. Vighi, I.L.; Benitez, L.C.; do Amaral, M.N.; Auler, P.A.; Moraes, G.P.; Rodrigues, G.S.; da Maia, L.C.; Pinto, L.S.; Braga, E.J. Changes in gene expression and catalase activity in Oryza sativa L. Under abiotic stress. Genet. Mol. Res. 2016, 15. [Google Scholar] [CrossRef]
  73. Zhou, Y.; Liu, S.; Yang, Z.; Yang, Y.; Jiang, L.; Hu, L. Cscat3, a catalase gene from cucumis sativus, confers resistance to a variety of stresses to Escherichia coli. Biotechnol. Biotechnol. Equip. 2017, 31, 886–896. [Google Scholar] [CrossRef]
  74. Liu, Y.; Hu, X.; Yao, Y.; Xu, L.; Xing, S. Isolation and expression analysis of catalase genes in Erianthus arundinaceus and sugarcane. SugarTech 2016, 18, 468–477. [Google Scholar] [CrossRef]
  75. Yong, B.; Wang, X.; Xu, P.; Zheng, H.; Fei, X.; Hong, Z.; Ma, Q.; Miao, Y.; Yuan, X.; Jiang, Y.; et al. Isolation and abiotic stress resistance analyses of a catalase gene from Ipomoea batatas (L.) lam. BioMed Res. Int. 2017, 2017, 10. [Google Scholar] [CrossRef] [PubMed]
  76. Ye-Qin, H.; Sheng, L.; Hong-Mei, Y.; Jing, L.; Da-Wei, Y.; Jian-Feng, Z.; Ying-Tang, L. Functional comparison of catalase genes in the elimination of photorespiratory h2o2 using promoter- and 3′-untranslated region exchange experiments in the Arabidopsis Cat2 photorespiratory mutant. Plant Cell Environ. 2010, 33, 1656–1670. [Google Scholar]
  77. Yamasaki, K.; Kigawa, T.; Seki, M.; Shinozaki, K.; Yokoyama, S. DNA-binding domains of plant-specific transcription factors: Structure, function, and evolution. Trends Plant Sci. 2013, 18, 267–276. [Google Scholar] [CrossRef] [PubMed]
  78. Li, W.; Zhu, Z.; Chern, M.; Yin, J.; Yang, C.; Ran, L.; Cheng, M.; He, M.; Wang, K.; Wang, J.; et al. A natural allele of a transcription factor in rice confers broad-spectrum blast resistance. Cell 2017, 170, 114–126. [Google Scholar] [CrossRef] [PubMed]
  79. Lin, M.; Pang, C.; Fan, S.; Song, M.; Wei, H.; Yu, S. Global analysis of the Gossypium hirsutum L. Transcriptome during leaf senescence by RNA-Seq. BMC Plant Biol. 2015, 15, 43. [Google Scholar] [CrossRef]
  80. Li, Y.; Jiang, J.; Du, M.-L.; Li, L.; Wang, X.-L.; Li, X.-B. A cotton gene encoding myb-like transcription factor is specifically expressed in pollen and is involved in regulation of late anther/pollen development. Plant Cell Physiol. 2013, 54, 893–906. [Google Scholar] [CrossRef]
  81. Sun, H.; Hu, M.; Li, J.; Chen, L.; Li, M.; Zhang, S.; Zhang, X.; Yang, X. Comprehensive analysis of NAC transcription factors uncovers their roles during fiber development and stress response in cotton. BMC Plant Biol. 2018, 18, 150. [Google Scholar] [CrossRef]
  82. Chen, T.; Li, W.; Hu, X.; Guo, J.; Liu, A.; Zhang, B. A cotton MYB transcription factor, GbMYB5, is positively involved in plant adaptive response to drought stress. Plant Cell Physiol. 2015, 56, 917–929. [Google Scholar] [CrossRef]
  83. Xu, F.-C.; Liu, H.-L.; Xu, Y.-Y.; Zhao, J.-R.; Guo, Y.-W.; Long, L.; Gao, W.; Song, C.-P. Heterogeneous expression of the cotton R2R3-MYB transcription factor GbMYB60 increases salt sensitivity in transgenic Arabidopsis. Plant Cell 2018, 133, 15–25. [Google Scholar] [CrossRef]
  84. He, X.; Zhu, L.; Xu, L.; Guo, W.; Zhang, X. GhATAF1, a NAC transcription factor, confers abiotic and biotic stress responses by regulating phytohormonal signaling networks. Plant Cell Rep. 2016, 35, 2167–2179. [Google Scholar] [CrossRef] [PubMed]
  85. Reddy, A.S.N.; Marquez, Y.; Kalyna, M.; Barta, A. Complexity of the alternative splicing landscape in plants. Plant Cell 2013, 25, 3657–3683. [Google Scholar] [CrossRef] [PubMed]
  86. Lewis, B.P.; Green, R.E.; Brenner, S.E. Evidence for the widespread coupling of alternative splicing and nonsense-mediated mrna decay in humans. Proc. Natl. Acad. Sci. USA 2003, 100, 189–192. [Google Scholar] [CrossRef] [PubMed]
  87. Hua, C.; Zhao, J.-H.; Guo, H.-S. Trans-kingdom RNA silencing in plant–fungal pathogen interactions. Mol. Plant 2018, 11, 235–244. [Google Scholar] [CrossRef] [PubMed]
  88. Wang, W.; Liu, D.; Zhang, X.; Chen, D.; Cheng, Y.; Shen, F. Plant microRNAs in cross-kingdom regulation of gene expression. Int. J. Mol. Sci. 2018, 19, 2007. [Google Scholar] [CrossRef] [PubMed]
  89. Ma, C.; Burd, S.; Lers, A. Mir408 is involved in abiotic stress responses in Arabidopsis. Plant J. 2015, 84, 169–187. [Google Scholar] [CrossRef] [PubMed]
  90. Jagadeeswaran, G.; Saini, A.; Sunkar, R. Biotic and abiotic stress down-regulate miR398 expression in Arabidopsis. Planta 2009, 229, 1009–1014. [Google Scholar] [CrossRef] [PubMed]
  91. Weiberg, A.; Wang, M.; Lin, F.-M.; Zhao, H.; Zhang, Z.; Kaloshian, I.; Huang, H.-D.; Jin, H. Fungal small RNAs suppress plant immunity by hijacking host RNA interference pathways. Science 2013, 342, 118–123. [Google Scholar] [CrossRef]
  92. Wang, B.; Sun, Y.; Song, N.; Zhao, M.; Liu, R.; Feng, H.; Wang, X.; Kang, Z. Puccinia striiformis f. sp. Tritici microRNA-like RNA 1 (Pst-milR1), an important pathogenicity factor of Pst, impairs wheat resistance to Pst by suppressing the wheat pathogenesis-related 2 gene. New Phytol. 2017, 215, 338–350. [Google Scholar] [CrossRef]
  93. Wang, M.; Weiberg, A.; Lin, F.-M.; Thomma, B.P.H.J.; Huang, H.-D.; Jin, H. Bidirectional cross-kingdom rnai and fungal uptake of external rnas confer plant protection. Nat. Plants 2016, 2, 16151. [Google Scholar] [CrossRef] [PubMed]
  94. Zhang, T.; Zhao, Y.-L.; Zhao, J.-H.; Wang, S.; Jin, Y.; Chen, Z.-Q.; Fang, Y.-Y.; Hua, C.-L.; Ding, S.-W.; Guo, H.-S. Cotton plants export microRNAs to inhibit virulence gene expression in a fungal pathogen. Nat. Plants 2016, 2, 16153. [Google Scholar] [CrossRef] [PubMed]
Figure 1. The sequence analysis of two allotetraploid cotton CAT genes. (A) Exon–intron structures. Yellow boxes and grey horizontal lines indicated exons and introns, respectively. Intron phases were shown by 0, 1 and 2. The CATs of two allotetraploid cotton clustered into two groups. Group I and II represented by green and blue, respectively. (B) Conserved domain compositions. Catalase core domain (Catalase, PF00199) and catalase-related immune-responsive domain (Catalase-rel, PF06628) were shown in the red and purple boxes, respectively.
Cells 08 00086 g001
Figure 2. The neighbor-joining (NJ) phylogenetic tree of CATs in cotton, cacao, Arabidopsis, soybean, and grape. The tree was constructed with predicted full-length amino acid sequences of identified CAT genes from in G. barbadense L. (Gb), G. hirsutum L. (Gh), G. arboreum L. (Ga), G. raimondii Ulbr. (Gr), A. thaliana (Linn.) Heynh. (At), T. cacao L., G. max (Linn.) Merr. and V. vinifera L. Bootstrap values from 1000 replicates were shown above nodes. Branches corresponding to partitions reproduced in <60% of bootstrap replicates were collapsed in the phylogenetic trees. They were classified into two groups. Group I and II represented by red and blue, respectively.
Cells 08 00086 g002
Figure 3. The synteny relationships of CAT genes among four sequenced cotton species. G. arboreum L., G. raimondii Ulbr., G. hirsutum L. and G. barbadense L. chromosomes are indicated in red, blue, purple, and green, respectively. The putative orthologous CAT genes between G. arboreum L. and two tetraploids species, between G. raimondii Ulbr. and two tetraploids species, and between G. hirsutum L. and G. barbadense L., are connected by yellow, dark green and orange lines, respectively. Black lines connect the putative paralogous genes.
Cells 08 00086 g003
Figure 4. Transcriptional profiling of GhCATs and GbCATs in different tissues/organs and fiber development stages. The log2 of FPKMs (fragments per kilobase per million reads) values were calculated by RNA-Seq data to show the expression levels of the CAT genes in upland cotton and sea-island cotton. The colors indicated in the scale were represented by the relative expression levels. FPKMs data were obtained from the databases of ccNET (http://structuralbiology.cau.edu.cn/gossypium/) and CottonFGD (https://cottonfgd.org/). (A) The heat-map showed the hierarchical clustering of the relative expression of 7 GhCATs in root, stem, leaf, petal, calycle, torus, stamen, pistil, and fibers at 5, 10, 20 and 25 dpa. (B) The heat-map showed the hierarchical clustering of the relative expression of 7 GbCATs in root, stem, leaf, petal, anther, stigma, ovule, and fibers at 10, 15, 18, 21 and 28 dpa.
Cells 08 00086 g004
Figure 5. The expression patterns of GhCATs (filled green) and GbCATs (filled purple) under V. dahliae treatment. Different stress treatment times are shown on the x-axis and the relative expression levels on the y-axis. The expression levels of CATs are normalized to that of the cotton UBQ7 gene and are compared with the control (0 h). The expression level was calculated using the 2−ΔΔCT (ΔΔCT = (CT, CATs—CT, UBQ7) treatments at different times—(CT, CATs—CT, UBQ7) 0 h) method. Error bars represented standard deviations of the mean values from three independent experiments. ANOVA (analysis of variance) was calculated using DPS and p  <  0.05 was considered statistically significant.
Cells 08 00086 g005
Figure 6. The schematic diagram of the highly conserved transcription factor binding sites (TFBSs) relative to that of the upland cotton and sea-island cotton CAT gene transcription start site (TSS). The information of potential TFBS was predicted using the Binding Site Prediction tool in PlantTFDB 4.0 with a stricter parameter: threshold p-value ≤ 1 × 10⁻⁶ (http://planttfdb.cbi.pku.edu.cn/).
Cells 08 00086 g006
Figure 7. The characterization of alternative splicing (AS) events and the validation of full-length isoforms using the reverse transcription polymerase chain reaction (RT)-PCR. (A) Classification of AS events. Cartoons show AS events: intron retention (IR), exon skipping (ES), alternative 5′ donor sites (AD) and alternative 3′ acceptor sites (AA). The numbers of AS events and associated genes are shown. The numbers in the parentheses show the proportions of CATs occupying the gene family undergoing AS; (B) RT-PCR validation of AS events for GhCAT3 and GbCAT3. Gel bands in each figure show the DNA makers and PCR results in four samples (hpi, hour post inoculation). The transcript structure of each isoform is shown in the right panel. Yellow boxes show exons and lines with arrows show introns. PCR prime pairs (F, forward and R, reverse) are shown on the isoforms of each gene. The length of each full-length isoform is shown after the transcript structure.
Cells 08 00086 g007
Figure 8. The miRNA-mediated targeting regulatory relationships of CATs in upland cotton and sea-island cotton. Heavy grey boxes represent the ORFs (open reading frames) of CATs. Catalase domain (Catalase, PF00199) and catalase-related immune-responsive domain (Catalase-rel, PF06628) are shown in red and purple boxes, respectively. miRNA complementary sites (black filling) with the nucleotide positions of CATs are indicated. The RNA sequence of each complementary site from 5′ to 3′ and the miRNA sequence from 3′ to 5′ are shown in the expanded regions.
Cells 08 00086 g008
Figure 9. The scheme of the CAT gene family loci during the evolutionary history of Gossypium spp. The hypothetic succession of genomic events occurring at or including cotton CATs was proposed on the right. The evolution time was given from the top to the bottom in Mya. The scheme of the emergence of the 7 cotton CATs genes was given at the left.
Cells 08 00086 g009
Table 1. The details of two allotetraploid cotton CAT genes.
Gene NameLocus IDGene FeaturesTranscript FeaturesProtein Statistics
Genomic PositionLength (bp)CDS Length (bp)CDS GC Content (%)Exon NumberProtein Length (aa)Molecular Weight (kDa)Isoelectric Point (pI)GRAVYPredicted Subcellular Localization
GhCAT1Gh_A01G0845A01:19440294-19443475 −3182147946.9849256.8297.173−0.533Peroxisome
GhCAT2Gh_D01G0873D01:14348913-14352092 −3180147947.0849256.8177.173−0.538Peroxisome
GhCAT3Gh_A05G1539A05:15642154-15645557 −3404141946.1947254.7067.068−0.561Peroxisome
GhCAT4Gh_D05G1710D05:15409889-15413267 −3379147946.5849256.9577.413−0.587Peroxisome
GhCAT5Gh_A02G1698A02:83178810-83181326 +2517147045.4748956.5287.454−0.546Peroxisome
GhCAT6Gh_D03G0021D03:171438-173963 −2526148545.5749457.2857.310−0.543Peroxisome
GhCAT7Gh_A07G1556A07:57094046-57096383 +2338123046.0940946.9626.869−0.498Peroxisome
GbCAT1GOBAR_AA22711A01:19685673-19688948 −3276147947.0849256.8457.173−0.539Peroxisome
GbCAT2GOBAR_DD08701D01:16738967-16742318 +3352147947.0849256.8177.173−0.538Peroxisome
GbCAT3GOBAR_AA35088A05:14744651-14749782 −5132138046.7945953.2907.251−0.651Peroxisome
GbCAT4GOBAR_DD30012D05:16498614-16501993 +3380147946.6849256.9247.294−0.585Peroxisome
GbCAT5GOBAR_AA31934A02:98649356-98652362 +3007147945.4849256.9037.453−0.557Peroxisome
GbCAT6GOBAR_AA38517scaffold_0637.UKA:19604-22605 +3002147945.6849256.9397.453−0.567Peroxisome
GbCAT7GOBAR_AA20422A07:71313165-71323809 +10645180645.5960167.5046.286−0.662Peroxisome
Gb: G. barbadense L.; Gh: G. hirsutum L.; CAT: catalase; GRAVY: grand average of hydropathy.

