1. Introduction
With the large-scale commercialization of fifth-generation mobile communication technology (5G) [
1,
2,
3] and the continuous advancement of forward-looking research on sixth-generation mobile communication technology (6G) [
4,
5,
6,
7], next-generation communication technologies have evolved beyond purely engineering challenges and have begun to exert profound influences on social perception, public opinion, and policymaking [
8]. Compared with previous generations of mobile communication systems, 5G and 6G have triggered more extensive societal debates concerning high-frequency communications, electromagnetic radiation, network security, and privacy protection. As a result, public attitudes and emotions have gradually emerged as critical factors shaping technology adoption, governance, and regulatory decision-making [
9,
10].
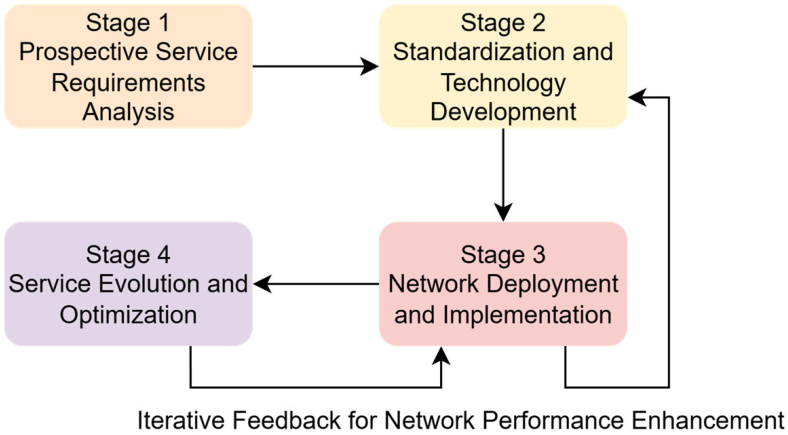
To provide a structured understanding of how next-generation communication technologies evolve from vision to societal impact,
Figure 1 presents a four-stage developmental framework. The process begins with prospective service requirement analysis, proceeds through standardization and technological development, and advances toward network deployment and implementation, followed by service evolution and optimization. Notably, iterative feedback between deployment outcomes and technological refinement plays a critical role in shaping subsequent development strategies. This cyclical process highlights that technological performance, economic viability, and public perception are interdependent, rather than isolated, factors in the diffusion of 5G and future 6G systems.
From a technological perspective, 5G has been widely promoted as a substantial leap beyond previous generations of mobile communication systems. It promises significantly higher data rates, reduced latency, and enhanced support for emerging applications such as industrial IoT and mission-critical services. In particular, low latency has been repeatedly emphasized as a core differentiator compared with 4G systems [
11]. These technical capabilities have positioned 5G as a foundational infrastructure for next-generation digital services.
However, the developmental trajectory of 5G reveals a more complex reality. Prior to full 5G commercialization, LTE-Advanced Pro (commonly referred to as 4.5G) had already achieved gigabit-level performance, raising both performance expectations and strategic pressure for 5G deployment [
12]. Because 4.5G could be deployed economically on existing infrastructure, it set a high benchmark for what 5G would need to surpass in practical and commercial terms [
12]. Many operators subsequently adopted non-standalone 5G architectures built upon existing 4G cores to reduce costs and accelerate rollout [
13]. While this approach enabled rapid coverage expansion, it constrained the realization of full 5G capabilities.
Moreover, empirical observations indicate that 5G performance has not consistently met early aspirational targets. Although the International Telecommunication Union once associated 5G with theoretical peak download speeds of 20 Gb/s, real-world user experience remains far below such values [
13]. In some regions, measured download and upload speeds have even declined compared with earlier phases of deployment, partly due to network congestion and limited millimeter-wave rollout [
13]. The high cost of densification and regulatory challenges associated with millimeter-wave spectrum have further complicated large-scale implementation [
13].
Beyond technical challenges, 5G also faces economic dilemmas. Historical experience suggests that improvements in network speed do not necessarily translate into proportional revenue growth for telecom operators [
11]. Despite dramatic increases in mobile data capacity, operator revenues in several markets have stagnated or declined during previous generational transitions [
11]. Analysts have therefore questioned whether 5G, though technologically advanced, can significantly reinvigorate the telecommunications business model [
11]. While enterprise applications and IoT services are often presented as key revenue drivers, their long-term financial contribution remains uncertain [
11].
Against this backdrop, public perception and user adoption become increasingly important. The gap between ambitious technological narratives and observable real-world performance has highlighted a disconnect between vision and practice [
13]. When expectations are elevated but tangible benefits appear incremental, societal skepticism may intensify. As a result, public attitudes and emotional responses toward 5G infrastructure deployment, health concerns, and regulatory policies have become critical non-technical factors influencing the diffusion of next-generation communication technologies.
The early experiences of 5G therefore provide important lessons for 6G development. The pressure created by high expectations, performance-reality gaps, infrastructure costs, and uncertain monetization pathways suggests that future communication systems must balance technological ambition with economic sustainability and realistic deployment strategies [
11,
12,
13]. Learning from the growing pains of 5G, 6G research and policymaking should integrate technical innovation with feasible business models and societal acceptance mechanisms.
A previous study [
14] conducted a preliminary investigation into public sentiment toward Beyond-5G deployment and explored strategies for reconstructing public confidence in future 6G wireless systems. That study emphasized the importance of integrating technological innovation with ethical AI governance and adaptive system reconfigurability to address societal concerns. The findings highlighted that public perception is not merely a passive response to technological advancement but an active factor influencing deployment strategies and regulatory decisions.
Building upon this foundation, the present study extends the empirical investigation by constructing a Twitter-based sentiment analysis dataset spanning multiple key communication-related events and systematically comparing deep learning-based and rule-based approaches. Rather than focusing on conceptual strategies, this work concentrates on classification performance, inference efficiency, and practical deployment value, while further introducing a lightweight LoRA-based fine-tuning experiment to examine domain adaptability in specialized communication scenarios.
Against this backdrop, social media platforms have become important channels through which the public expresses attitudes and emotions toward emerging communication technologies. Platforms such as Twitter are characterized by real-time information dissemination, broad user coverage, and naturally occurring language [
15,
16,
17], providing a large-scale and cost-effective data source for analyzing public sentiment toward 5G and 6G technologies. Automatically identifying users’ emotions and attitudes from massive, unstructured social media text has therefore become a key research problem in the fields of public opinion analysis and intelligent decision support [
18,
19].
Sentiment analysis [
20], as an important research direction in the field of natural language processing, aims to automatically identify emotional polarity and intensity from textual data. Early studies [
21,
22,
23] primarily relied on sentiment lexicons and manually designed rules, inferring sentiment tendencies by matching and weighting affective words within texts. Among these approaches, VADER (Valence Aware Dictionary and sEntiment Reasoner) represents a typical lexicon- and rule-based sentiment analysis method. It is specifically designed for social media texts by incorporating slang, emojis, and emphasis-related grammatical cues, thereby achieving high efficiency and interpretability in short-text sentiment analysis [
24]. However, such methods often suffer from limited generalization ability when confronted with semantically complex expressions, sarcasm, or domain-specific terminology.
In recent years, advances in deep learning have substantially promoted the development of sentiment analysis research. Pre-trained language models based on the Transformer architecture, such as BERT (Bidirectional Encoder Representations from Transformers) [
25] and its improved variant RoBERTa (Robustly Optimized BERT Pretraining Approach) [
26], leverage large-scale unsupervised pre-training and task-specific fine-tuning to achieve significant performance gains across a wide range of natural language processing tasks. To better address the informal and noisy nature of social media language, researchers have further proposed BERTweet, a Twitter-specific pre-trained language model trained on large-scale tweet corpora. BERTweet has demonstrated superior performance over general-purpose language models on multiple social media-related tasks [
27].
Beyond these representative models, recent studies on social media sentiment classification have explored a broader range of Transformer-based and domain-adapted approaches. Recent sentiment analysis research has increasingly moved beyond conventional encoder-only pre-trained language models toward large language model (LLM)-based and parameter-efficient adaptation paradigms. LLMs have been explored for sentiment classification under zero-shot and few-shot settings, showing promising generalization ability when labeled data are limited, but they also introduce challenges related to inference cost, deployment latency, prompt sensitivity, and evaluation reliability. For social media sentiment analysis, task-oriented resources such as TweetNLP [
28] remain practically useful because they provide efficient classifiers optimized for noisy, short, and platform-specific discourse. In parallel, domain adaptation has shifted from full fine-tuning and continued domain pre-training [
29] toward parameter-efficient fine-tuning methods. LoRA has become a widely used lightweight adaptation strategy, while more recent variants such as QLoRA [
30] and DoRA [
31] further reduce memory requirements or improve adaptation capacity for large pre-trained models.
These developments suggest that current state-of-the-art sentiment analysis includes two complementary directions: large instruction-tuned or generative models for flexible reasoning, and lightweight parameter-efficient adaptation for practical deployment. Within this context, the present study focuses on representative deployable methods and uses LoRA to examine lightweight domain adaptation for 5G/6G-related public discourse. Within this broader research landscape, the present study selects VADER, Twitter-RoBERTa, and BERTweet as representative baselines from rule-based, social media RoBERTa-based, and tweet-specific pre-trained paradigms, and further uses LoRA to examine lightweight domain adaptation in 5G/6G-related public discourse.
Although extensive progress has been made in sentiment analysis on social media, several limitations remain when focusing on the highly specialized and controversial domain of 5G and 6G communication technologies. On the one hand, texts related to communication technologies often contain a mixture of technical terminology, complaint-oriented expressions, and emotionally charged language, which substantially increases the difficulty of accurate sentiment identification. On the other hand, existing studies tend to emphasize accuracy-oriented evaluations of individual models, while systematic comparisons across different sentiment analysis approaches—particularly in terms of classification performance, inference efficiency, and practical deployment trade-offs—remain relatively underexplored. Moreover, from a practical engineering perspective, how to achieve an appropriate trade-off between sentiment recognition performance and computational resource consumption still lacks clear empirical evidence.
Based on the aforementioned challenges, this study focuses on user comments related to 5G and 6G technologies on the Twitter platform and constructs a sentiment analysis dataset spanning multiple key communication-related events. By incorporating two deep learning approaches based on pre-trained language models—twitter–roberta–base–sentiment and bertweet–base–sentiment–analysis—together with a classical rule-based method (VADER), we conduct a comparative analysis from multiple perspectives, including classification performance, inference efficiency, and practical deployment value. Through this systematic evaluation, the applicability and practical effectiveness of different sentiment analysis methods for social media texts in the 5G/6G communication domain are thoroughly assessed. In addition, a lightweight LoRA-based fine-tuning experiment is introduced to further examine domain adaptability in specialized communication scenarios.
The primary objective of this study is to examine how different sentiment analysis paradigms perform in the specialized context of 5G/6G-related public discourse, where texts often contain technical terminology, complaint-oriented expressions, and event-specific emotional responses. Rather than serving only as a benchmark of existing models, this study aims to provide empirical evidence on dataset construction, model selection, deployment efficiency, and lightweight domain adaptation for 5G/6G public opinion monitoring.
Accordingly, this study is guided by the following research questions:
RQ1: How do pre-trained language model-based methods and a rule-based method differ in sentiment classification performance on 5G/6G-related Twitter discourse?
RQ2: How do these models differ in inference efficiency under practical deployment-oriented settings?
RQ3: Can lightweight LoRA-based fine-tuning improve domain adaptability for 5G/6G-related sentiment expressions?
RQ4: Are the comparative patterns observed on the Twitter dataset consistent with those observed on a filtered Amazon review-style dataset?
The main contributions of this study are threefold. First, we construct a manually annotated Twitter dataset focused on 5G/6G-related public discourse across multiple event-centered time periods. Second, we provide a comparative evaluation of rule-based and pre-trained language model-based sentiment analysis methods, considering both classification performance and deployment-oriented inference efficiency. Third, we examine whether lightweight LoRA-based fine-tuning can improve domain adaptability for specialized 5G/6G sentiment expressions and evaluate whether the observed trends generalize to an external review-style dataset. The remainder of this paper is organized as follows.
Section 2 describes the data collection pipeline, the underlying principles of the sentiment analysis models, and the experimental setup.
Section 3 presents the sentiment analysis results and comparative evaluations across different models.
Section 4 discusses the experimental findings, summarizes the main conclusions, and outlines directions for future research.
2. Materials and Methods
This section presents the experimental methodology and evaluation approach from three perspectives: data acquisition, sentiment analysis methods, and multi-model comparison strategies.
2.1. Data Acquisition
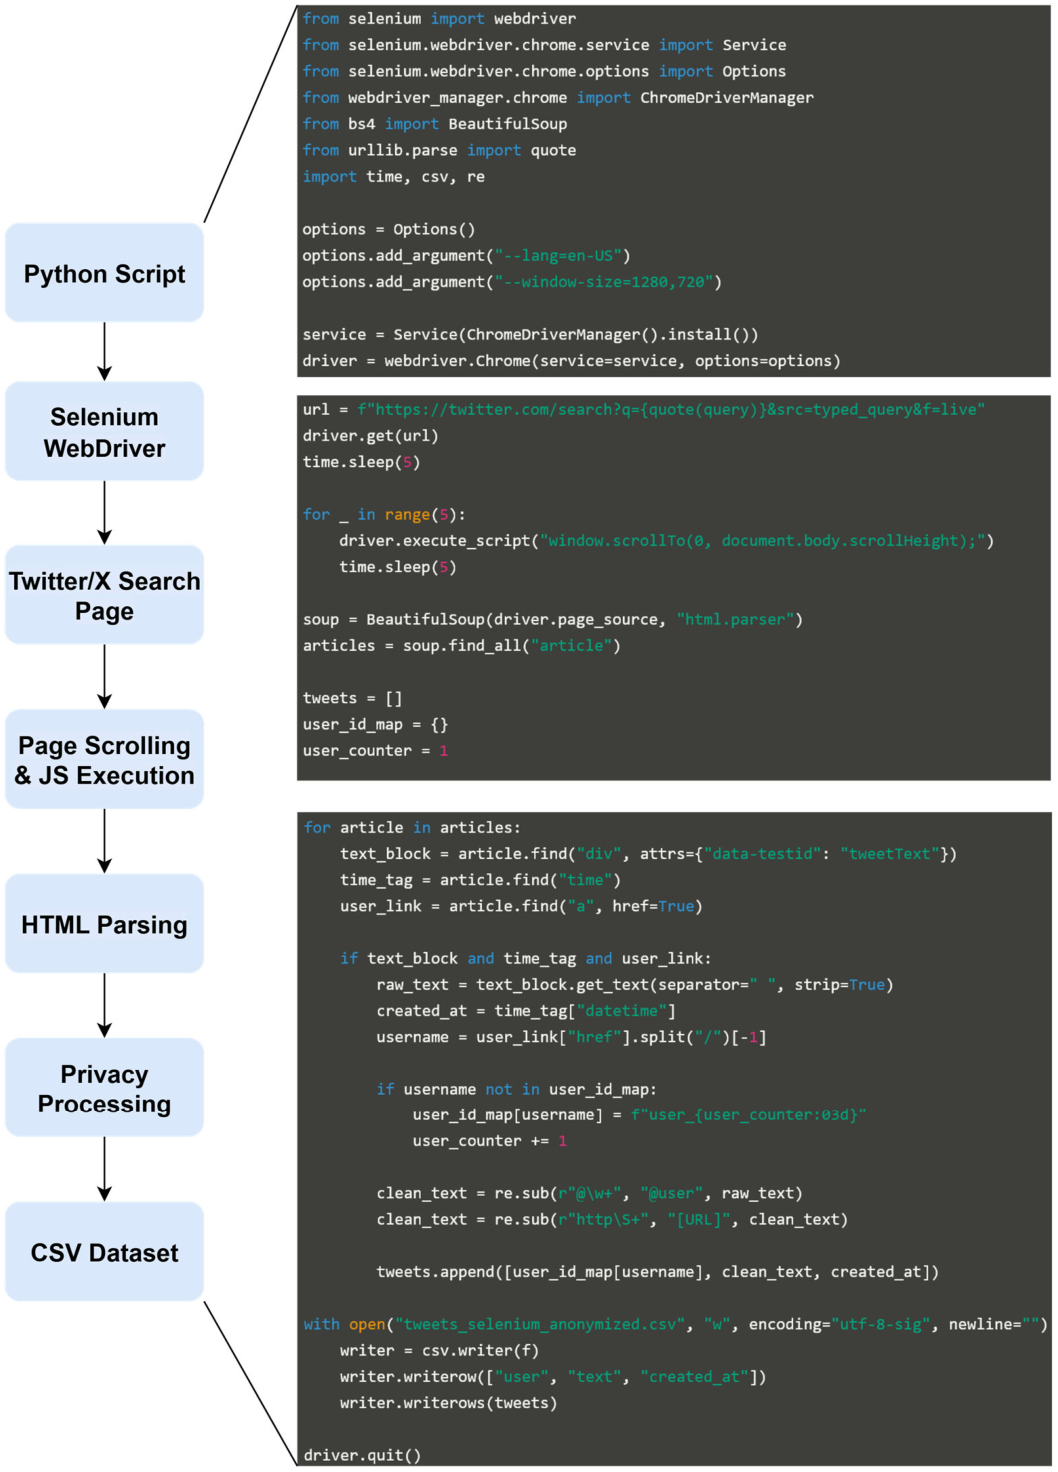
In this study, data were collected from Twitter user comments using a web scraping approach. Specifically, the Selenium [
32] tool was employed to simulate browser operations and capture search results based on predefined keywords. The collected comments were subsequently categorized by time intervals and anonymized to protect user privacy. Anonymization involved replacing usernames with “@user” and substituting hyperlinks with “[URL].” Finally, the processed data were stored in CSV format for subsequent analysis. Next, a brief overview of Selenium is provided.
The core mechanism of Selenium is to emulate user interactions within a web browser, such as opening comment sections and scrolling through pages, and then extracting the required information from the fully rendered HTML. The main workflow consists of the following steps:
Selenium communicates with the browser through a WebDriver (e.g., Chrome Driver), enabling the execution of operations such as clicking, text input, and page scrolling.
- 2.
Page Loading and Rendering
Once the browser loads the target page, it retrieves HTML, CSS, and JavaScript resources and executes the necessary JavaScript code to complete page rendering.
- 3.
User Interaction Simulation
User actions are simulated through commands such as .click() and .send_keys(), which replicate button clicks, text entry, page navigation, loading additional content, or triggering pop-up windows.
- 4.
Data Extraction
After the page has been fully rendered, data are extracted either from the complete HTML source (driver.page_source) or by directly locating elements using Selenium’s built-in APIs (find_element/find_elements). The retrieved content is then parsed and prepared for further processing. The overall Selenium-based data collection and anonymization workflow is shown in
Figure 2.
In this study, experimental data were automatically collected from Twitter webpages using Selenium-based web scraping. The data were retrieved across multiple event-centered time intervals, each corresponding to a major milestone, controversy, or discussion peak related to 5G and 6G development. The time windows for Twitter data collection were selected according to an event-oriented sampling strategy. Events were selected according to three inclusion criteria: (1) direct relevance to 5G/6G standardization, deployment, regulation, or commercialization; (2) relevance to public controversies involving wireless communication technologies, spectrum use, infrastructure deployment, or perceived technological risks; and (3) relevance to broader public discourse in which emerging communication technologies, satellite networks, wireless sensing, or future digital infrastructure were explicitly discussed. Events were therefore categorized as either direct 5G/6G milestones or indirect public-discourse cases related to communication-technology perception.
Among the selected events, several represent indirect public-discourse cases that remain relevant to 5G/6G perception and broader communication technology debates. For example, the Starlink satellite approval relates to spectrum sharing and satellite-terrestrial integration, which are key considerations for 6G development; the Orbital AI data center discussions touch upon space-based digital infrastructure and future network architectures; and the Pyramids discovery event, albeit unconventional, generated extensive social media discourse that linked underground structures to speculative 5G-related narratives, reflecting public engagement with communication technology themes. These indirect events were comprehensively included to capture the broader societal conversation around next-generation communication technologies beyond formal standardization and deployment milestones.
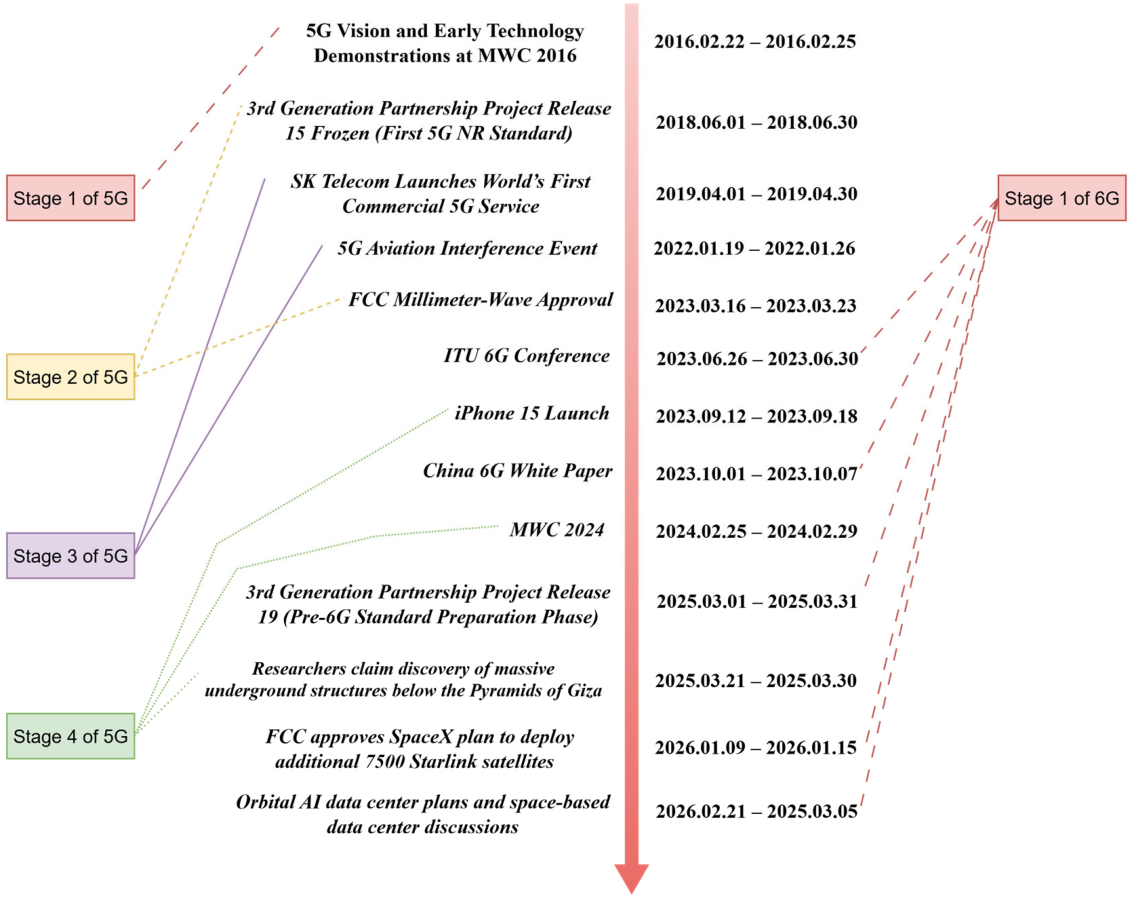
Specifically, we focused on representative milestones and discussion peaks related to 5G/6G development, including early vision-stage activities, standardization and regulatory events, large-scale deployment milestones, consumer-facing product releases, and public controversy events. This design was intended to capture public discourse under different developmental stages of communication technologies, rather than relying on randomly sampled posts from a single period. By aligning the selected events with the four-stage lifecycle framework shown in
Figure 1, the dataset provides a temporally structured view of how public sentiment evolves across different phases of 5G deployment and early 6G development.
The selected time intervals are listed as follows:
2016–02–22 to 2016–02–25: 5G Vision and Early Technology Demonstrations at MWC 2016—Stage 1 of 5G as per
Figure 1.
2018–06–01 to 2018–06–30: 3rd Generation Partnership Project Release 15 Frozen (First 5G NR Standard)—Stage 2 of 5G as per
Figure 1.
2019–04–01 to 2019–04–30: SK Telecom Launches World’s First Commercial 5G Service—Stage 3 of 5G as per
Figure 1.
2022–01–19 to 2022–01–26: 5G Aviation Interference Event—Stage 3 of 5G as per
Figure 1.
2023–03–16 to 2023–03–23: FCC Millimeter-Wave Approval—Stage 2 of 5G as per
Figure 1.
2023–06–26 to 2023–06–30: ITU 6G Conference—Stage 1 of 6G as per
Figure 1.
2023–09–12 to 2023–09–18: iPhone 15 Launch—Stage 4 of 5G as per
Figure 1.
2023–10–01 to 2023–10–07: China 6G White Paper—Stage 1 of 6G as per
Figure 1.
2024–02–25 to 2024–02–29: MWC 2024—Stage 4 of 5G as per
Figure 1.
2025–03–01 to 2025–03–31: 3rd Generation Partnership Project Release 19 (Pre-6G Standard Preparation Phase)—Stage 1 of 6G as per
Figure 1.
2025–03–21 to 2025–03–30: Researchers Claim Discovery of Massive Underground Structures below the Pyramids of Giza—Stage 4 of 5G as per
Figure 1.
2026–01–09 to 2026–01–15: FCC Approves SpaceX Plan to Deploy Additional 7500 Starlink Satellites—Stage 1 of 6G as per
Figure 1.
2026–02–21 to 2026–03–05: Orbital AI Data Center Plans and Space-Based Data Center Discussions—Stage 1 of 6G as per
Figure 1.
The temporal distribution of the collected data is illustrated in
Figure 3. Specifically,
Figure 3 presents the selected event-centered time intervals in chronological order and aligns them with the four developmental stages shown in
Figure 1 (Stage 1–Stage 4). Each time span corresponds to a representative phase in the evolution of 5G and the early progression toward 6G.
The earlier periods captured the Prospective Service Requirements Analysis stage, during which visions, expectations, and future-oriented discussions were dominant. Subsequent windows reflect the Standardization and Technology Development phase, marked by key regulatory decisions and technical milestones. Later periods correspond to the Network Deployment and Implementation stage, characterized by large-scale commercialization and real-world performance debates. Finally, recent and forward-looking time spans represent the Service Evolution and Optimization phase, as well as the emerging conceptualization and standard preparation of 6G.
To ensure that the collected data were relevant to the target domain and covered public discourse from different periods, a set of topic-related keywords reflecting positive, neutral, and negative opinions about 5G and 6G was used to retrieve English tweets, with retweets excluded. During preprocessing, commercial and promotional content was filtered out, and all tweets were anonymized to protect user privacy. After filtering and anonymization, a total of 1746 valid and labeled tweets were retained and stored in CSV format, organized by event category.
The collected Twitter samples were manually annotated into three sentiment categories: positive, neutral, and negative, based on the overall emotional polarity expressed in each tweet. Positive tweets indicate favorable or supportive attitudes toward 5G/6G-related technologies or services; negative tweets reflect complaints, criticism, dissatisfaction, or concerns; meanwhile, neutral tweets mainly correspond to factual descriptions or posts without clear emotional orientation. To improve annotation consistency, all samples were labeled according to a predefined annotation guideline, and ambiguous cases were further reviewed and discussed before assigning the final label. The annotation process was conducted by two independent annotators who first performed a pilot annotation on 50 tweets to calibrate their understanding of the guideline. Inter-annotator agreement was assessed using Cohen’s κ on a randomly selected subset of 200 tweets (11.45% of the dataset), yielding a score of 0.83 (95% CI: 0.78–0.88), demonstrating high inter-annotator reliability. Per-class agreement was also high, as evidenced by positive (κ = 0.81), neutral (κ = 0.85), and negative (κ = 0.82) categories. Disagreements were resolved through consensus discussion to produce the final gold-standard labels used in this study.
Representative samples of the dataset are shown in
Table 1. The first text serves as an example of positive sentiment, the second reflects negative sentiment, and the third corresponds to a neutral news-style statement.
The final annotated Twitter dataset contained 1746 samples. The class distribution was 539 positive samples (30.87%), 707 neutral samples (40.49%), and 500 negative samples (28.64%). This distribution was reported to support the interpretation of macro-averaged metrics and to make the potential effect of class imbalance explicit.
2.2. Sentiment Analysis
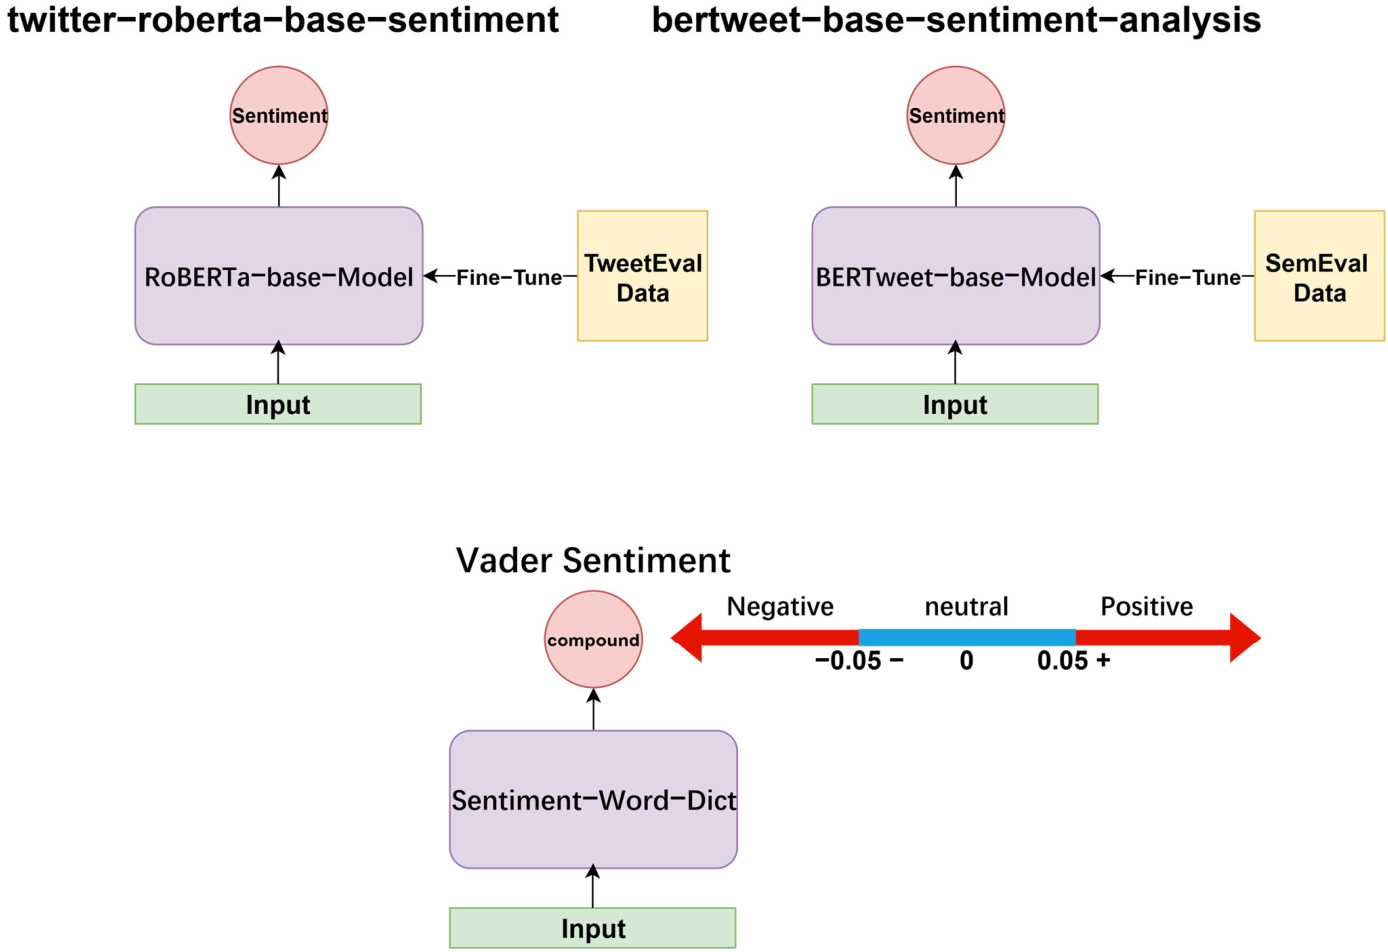
To support a deployment-oriented comparison, this study does not aim to exhaustively benchmark all available sentiment analysis systems. Instead, three representative methods were selected from practically relevant sentiment analysis paradigms: VADER as a lightweight lexicon- and rule-based method, Twitter-RoBERTa as a RoBERTa-based social media sentiment classifier, and BERTweet as a tweet-specific pre-trained language model. Together, these models enable a comparative analysis of classification performance, inference efficiency, and domain adaptability in 5G/6G-related public discourse. The collected user comments were processed by these three models to infer sentiment polarity and corresponding sentiment scores. Their overall architectures are illustrated in
Figure 4 and described in the following sections.
2.2.1. Deep Learning Models and Principles
The model adopted in this study is twitter–roberta–base–sentiment [
33], which is a RoBERTa-based model fine-tuned for sentiment analysis tasks. It was trained on approximately 124 million tweets collected between January 2018 and December 2021, providing extensive linguistic coverage of social media discourse. Fine-tuning was performed on the TweetEval benchmark, which optimized the model specifically for sentiment classification, thereby improving its accuracy and robustness.
The model is made accessible through the Hugging Face Transformers library, version 4.53.0, and is also available through the TweetNLP platform, which provides user-friendly interfaces for practical deployment [
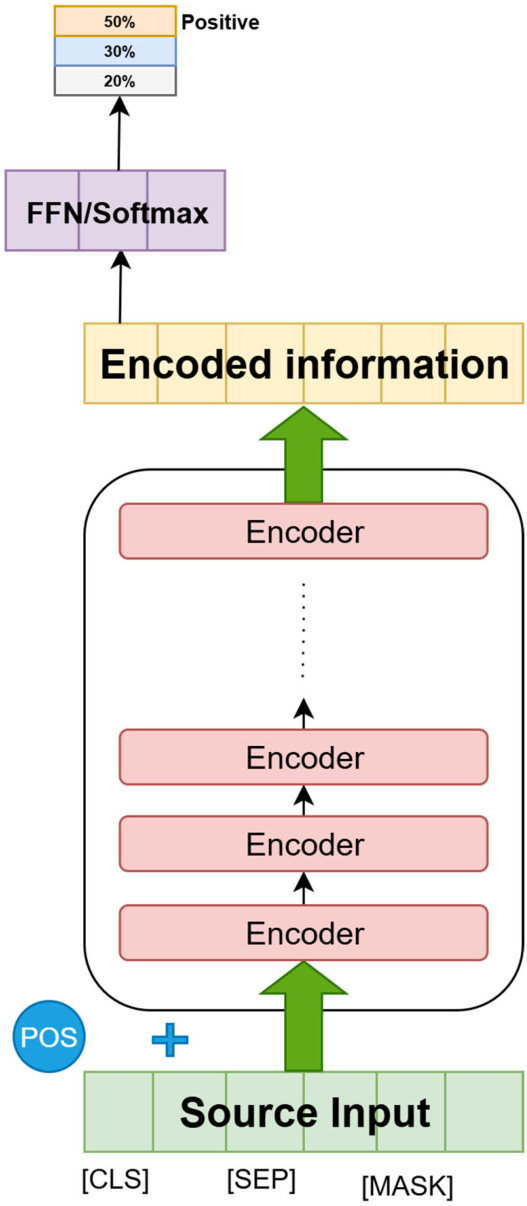
28]. In order to illustrate the theoretical foundation of the adopted model, the following section outlines the underlying Transformer architecture and its adaptation in the twitter–roberta–base–sentiment model. Because twitter–roberta–base–sentiment is built on RoBERTa, the model follows an encoder-only Transformer architecture rather than an encoder–decoder architecture. The revised architecture is shown in
Figure 5.
2.2.2. RoBERTa and Twitter–Roberta–Base–Sentiment Models
RoBERTa represents a robust optimization of the BERT architecture, distinguished by the removal of the Next Sentence Prediction (NSP) objective and the adoption of dynamic masking—a strategy that randomly masks 15% of tokens at each training iteration to enhance data diversity and generalization, contrasting with BERT’s static masking approach [
26]. Building on this advanced framework, the twitter–roberta–base–sentiment model, developed by CardiffNLP, adapts the RoBERTa–base architecture specifically for social media analysis. Pre-trained on a corpus of approximately 58 million English tweets and fine-tuned using the TweetEval benchmark, this model is specifically optimized to capture the informal and idiosyncratic linguistic patterns characteristic of Twitter discourse. Consequently, its combination of architectural robustness and domain-specific training renders it highly effective for the sentiment classification tasks in this study, while its accessibility via the Hugging Face Transformers library facilitates seamless integration into downstream applications.
2.2.3. BERTweet and Bertweet–Base–Sentiment–Analysis Models
BERTweet [
27] stands as the pioneering large-scale pre-trained language model tailored specifically for English tweets, adopting the BERT–base architecture while leveraging RoBERTa’s robust pre-training methodology on a massive corpus of approximately 850 million tweets. This domain-specific pre-training, coupled with normalization procedures for tweet-specific tokens (e.g., user mentions and URLs), enables the model to effectively process informal linguistic features such as abbreviations and emojis, thereby demonstrating superior performance over general-purpose baselines like RoBERTa and XLM–R [
34]. Built upon this specialized architecture, the bertweet–base–sentiment–analysis model utilized in this study is fine-tuned on the SemEval 2017 corpus, comprising roughly 40,000 tweets [
35]. By leveraging BERTweet’s capacity to extract domain-specific features, this fine-tuned model is optimized for three-way sentiment classification (positive, negative, and neutral), ensuring high efficacy in analyzing the nuances of social media text.
2.2.4. Rule-Based Model and Principle
VADER (Valence Aware Dictionary and sEntiment Reasoner) [
24] is a widely used rule-based sentiment analysis tool specifically designed for social media text. Its mechanism is primarily composed of two components:
VADER incorporates a sentiment lexicon (vader_lexicon.txt) containing more than 7500 lexical entries, including words, emoticons, and slang expressions. Each entry is assigned a valence score, which was derived through a combination of expert annotation and crowdsourcing-based averaging.
- 2.
Heuristics and Grammar Rules
To better capture the nuances of social media language, VADER integrates a set of linguistic heuristics and grammar-based rules. For instance, the use of uppercase letters is interpreted as an emphasis on emotional expression and is reflected by increasing the sentiment score. Similarly, repeated punctuation marks such as exclamation points (“!!!”) are treated as emotional intensifiers, amplifying the sentiment strength accordingly.
The principle of VADER can be summarized as a combination of lexicon-driven analysis, rule-based adjustment, and simple normalization computation. As a classic traditional sentiment analysis method, VADER is particularly suitable for use as a baseline model or for rapid deployment in practical applications.
As illustrated in the model architecture above, the final sentiment classification of VADER differs slightly from that of deep learning-based models. Specifically, VADER determines sentiment polarity based on the computed compound score. A compound score greater than 0.05 is classified as positive, a score lower than −0.05 is classified as negative, and scores falling between these thresholds are categorized as neutral.
2.2.5. Sentiment Analysis Implementation
For sentiment classification, this study employed the twitter–roberta–base–sentiment model, which was implemented using the open-source Transformers library provided by Hugging Face. The model was imported through the library interface, and a custom function was defined to perform sentiment inference on the collected tweets. The details of the model loading process and the sentiment analysis function are presented in
Table 2 below.
2.3. Experimental Comparison of Multiple Models
To comprehensively evaluate the practical performance of different sentiment analysis models in 5G/6G communication-related public opinion scenarios, this study conducts a comparative analysis from two perspectives: classification performance and inference efficiency. The evaluation metrics include accuracy, precision, recall, Macro-F1, per-sample inference time (ms/sample), and inference throughput (samples/second). This evaluation framework is intended to assess not only the predictive capability of different models, but also their feasibility for real-world deployment in communication-related public opinion monitoring systems.
2.3.1. Classification Performance Metrics
For the three-way sentiment classification task (positive, neutral, and negative), four standard evaluation metrics were adopted: Accuracy, Macro-precision, Macro-recall, and Macro-F1. To avoid bias caused by class imbalance, precision, recall, and Macro-F1 were calculated using the macro-averaging strategy, so that each sentiment category contributed equally to the final score.
Accuracy (1) measures the proportion of correctly classified samples among all samples and reflects the overall classification capability of the model:
where N denotes the total number of samples,
represents the true label of the i-th sample,
is the predicted label, and
is the indicator function, which equals 1 when the prediction is correct and 0 otherwise.
- 2.
Macro-precision (2) is defined as the arithmetic mean of class-wise precision scores across all sentiment categories:
- 3.
Macro-recall (3) is defined as the arithmetic mean of class-wise recall scores across all sentiment categories.
- 4.
Macro-F1 (4) is defined as the arithmetic mean of class-wise F1 scores, providing a balanced assessment of classification performance across all sentiment categories:
where C denotes the set of sentiment classes, namely positive, neutral, and negative; |C| is the number of classes; and
,
, and
denote the true positives, false positives, and false negatives for class c under a one-vs-rest setting, respectively.
2.3.2. Inference Efficiency Metrics
To evaluate the engineering feasibility of model deployment in real-time 5G/6G-related public opinion monitoring scenarios, two inference efficiency metrics were adopted: per-sample inference time and inference throughput.
Specifically, the inference speed was measured using a three-iteration warm-up and ten-run averaging protocol. After three warm-up iterations to stabilize runtime performance, ten repeated measurements were conducted to obtain the mean inference time. For GPU-accelerated experiments, torch.cuda.synchronize() was applied to ensure accurate timing, and time.perf_counter() was used as the high-resolution timer. The inference efficiency comparison in this study is deployment-oriented rather than hardware-normalized. VADER was executed on CPU because it is a lightweight lexicon- and rule-based method without neural computation graphs or GPU-accelerated tensor operations, whereas Transformer-based models were executed with GPU acceleration as their practical deployment setting.
- 5.
Per-sample inference time
(5) refers to the average time required by a model to process one text sample, reported in milliseconds per sample (ms/sample):
where
denotes the total inference time in milliseconds, and
is the total number of input samples.
- 6.
Inference throughput (6) refers to the number of text samples processed per second, reported in samples/second, and reflects the continuous processing capability of a model in large-scale batch scenarios:
where N is the total number of input samples, and
is the total inference time in seconds.
2.4. Experiment Design
To further evaluate the robustness and practical applicability of different sentiment analysis models beyond the self-collected Twitter dataset, this study introduces a keyword-filtered subset of the Amazon Reviews’23 dataset as a supplementary validation resource. Rather than serving as a general-domain benchmark, this external dataset was constructed to provide additional 5G/6G-related review-style texts for cross-platform and cross-text-type comparison. The purpose of this supplementary experiment is twofold: first, to examine whether the comparative performance patterns observed on the Twitter dataset remain stable in a larger external dataset; second, to assess the generalization ability of different models across different forms of 5G/6G-related discourse, including short social media posts and longer review-style texts. In this way, the supplementary experiment provides additional empirical support for understanding the applicability of deep learning-based and rule-based sentiment analysis approaches in different deployment scenarios within the 5G/6G communication domain. The following sections describe the dataset used in this experiment and the corresponding implementation procedure. It should be noted that the Amazon Reviews’23 subset is not intended to serve as a direct substitute for the Twitter dataset, because review-style product texts differ from social media posts in text length, communicative context, label source, and user expression patterns. Therefore, the Amazon results are interpreted as cross-text-type robustness evidence, rather than as identical-domain validation of social media sentiment analysis performance.
The Amazon Reviews’23 dataset is a large-scale corpus of Amazon product reviews collected in 2023 by the McAuley Lab [
36]. It encompasses a comprehensive set of features, including user reviews (with associated ratings, review text, helpfulness votes, etc.), item metadata (product descriptions, pricing, raw images, etc.), and relational links (user-item interaction graphs and frequently bought together association graphs). This dataset is pre-categorized by product type, resulting in multiple dedicated sub-datasets. For this experiment, two sub-datasets most relevant to communication products, namely Cell_Phones_and_Accessories and Electronics, were selected, and a targeted filtering procedure was performed to extract the most relevant user reviews.
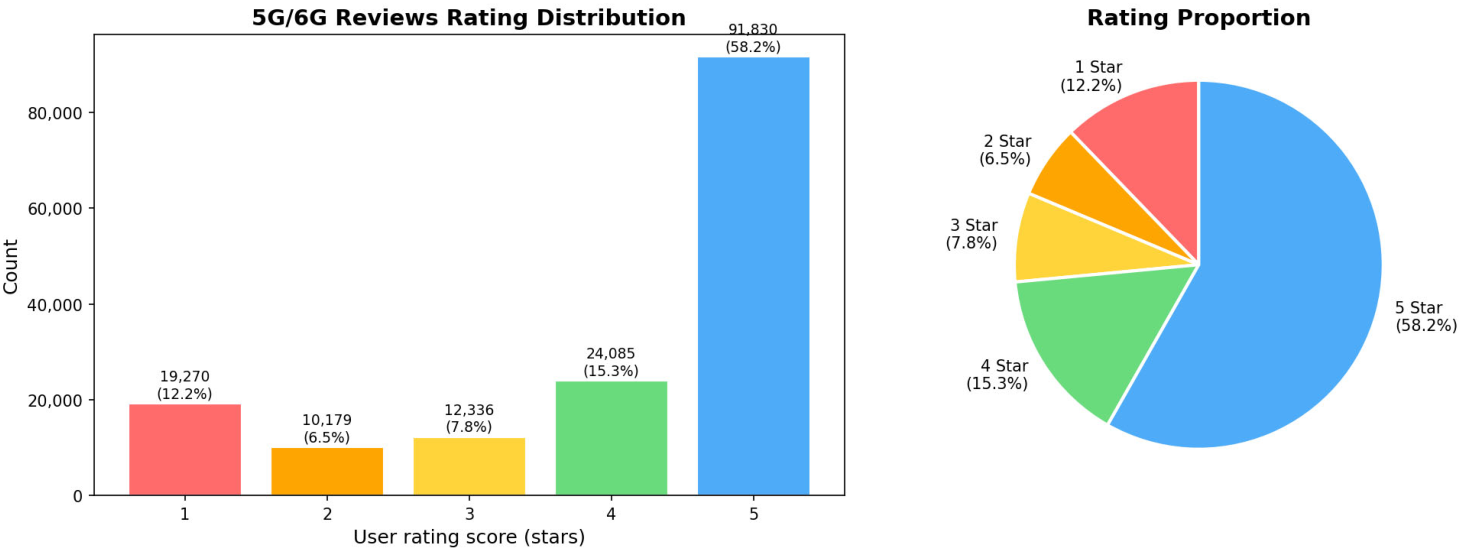
Specifically, from the 29.9 million entries of review content in these two sub-datasets, keyword-based filtering was performed, and 157,700 valid samples were finally obtained to support subsequent sentiment analysis. The specific keyword filtering rules are shown in
Table 3 below. The filtering script covers 13 categories with a total of 92 keyword patterns. Matching is performed on the merged content of the title and body text of each individual review, using case-insensitive regular expression matching for keyword retrieval.
After acquisition and preprocessing of the public dataset, sentiment analysis was conducted following the same procedure detailed in
Section 2.2, consistent with the workflow applied to the self-collected Twitter dataset.
For the labeled self-collected dataset, the experimental setup and multi-model comparison procedure remained identical to those presented above. To further examine whether lightweight adaptation can improve sentiment classification performance in the 5G/6G communication domain, this study conducted an additional Low-Rank Adaptation (LoRA)-based [
37] fine-tuning experiment using the Twitter-RoBERTa model. RoBERTa was selected as the base model because its pre-trained architecture and parameters are directly accessible, making it suitable for controlled parameter-efficient fine-tuning. By contrast, the BERTweet-based sentiment model used in this study was accessed through the pysentimiento library interface, which made direct fine-tuning less straightforward under the same experimental setting.
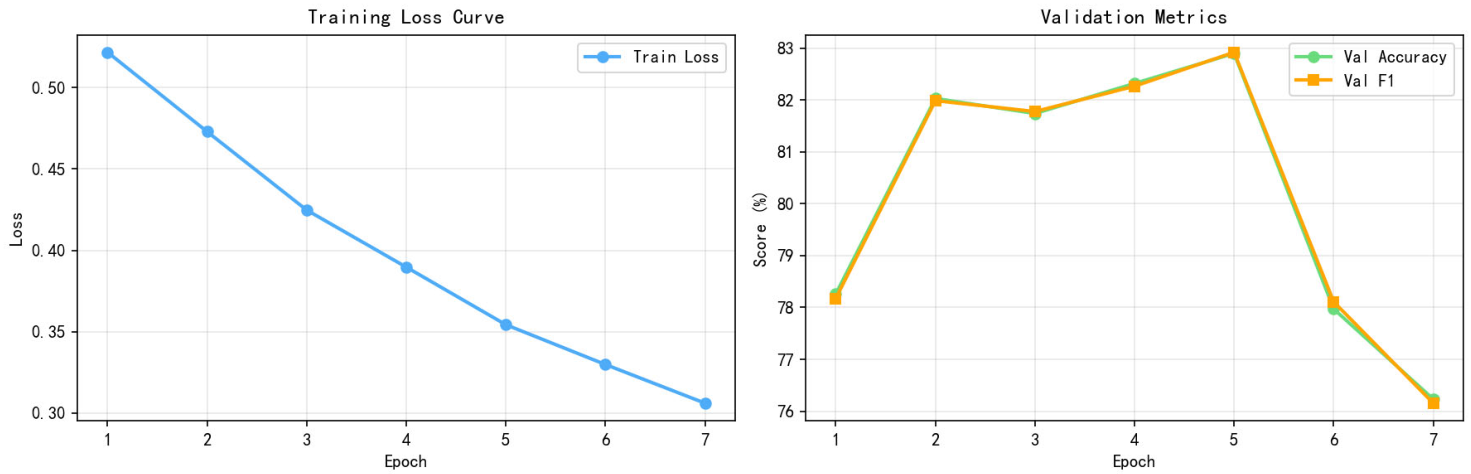
In this experiment, the Twitter dataset was divided into training and test sets with a ratio of 8:2. To improve data diversity and reduce overfitting to the relatively small self-collected dataset, the training set was augmented with an equal number of randomly sampled 5G/6G-related reviews from the filtered Amazon dataset. The fine-tuned model was then evaluated on two test sets: the held-out 20% portion of the Twitter dataset and an additional 5000 independently sampled Amazon reviews from the filtered Amazon dataset. The resulting fine-tuned model was subsequently compared with the three original models. Experimental procedures and results are presented in
Section 3 and
Section 4.
4. Discussions and Conclusions
4.1. Discussions
This study systematically evaluates three mainstream sentiment analysis methods (Twitter-RoBERTa, BERTweet, and VADER) on two datasets: a self-collected and labeled dataset of 1746 5G/6G-related Twitter posts, and a filtered Amazon Reviews’23 dataset. LoRA fine-tuning is further conducted on the RoBERTa model to enhance its domain adaptability for texts in the 5G/6G communication domain.
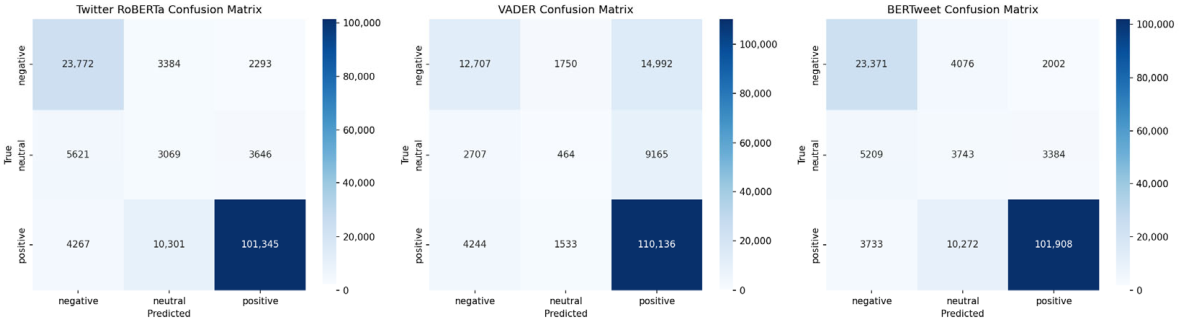
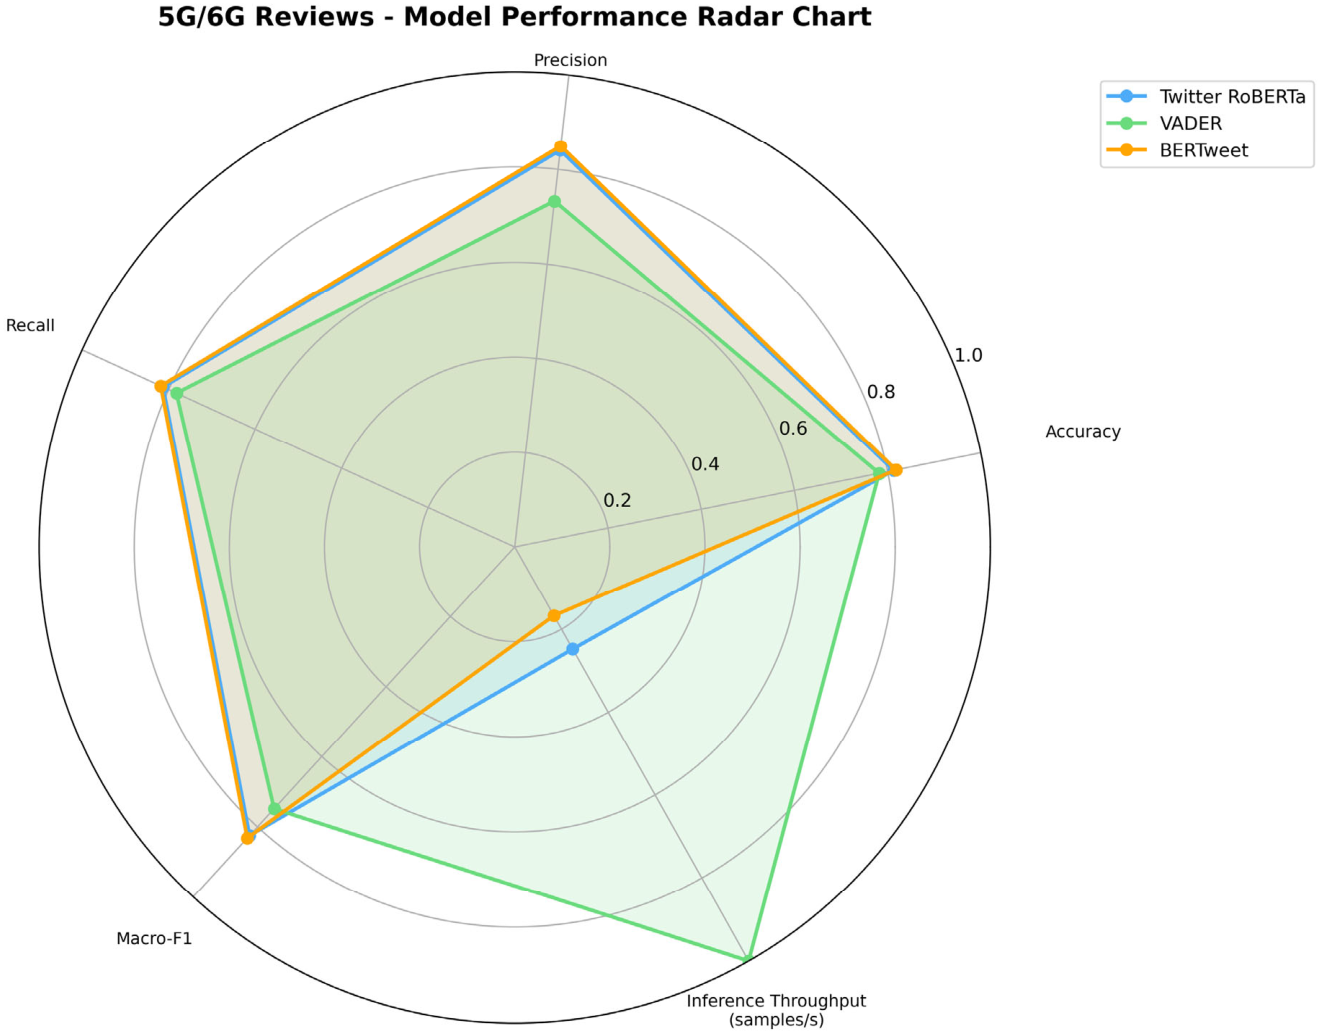
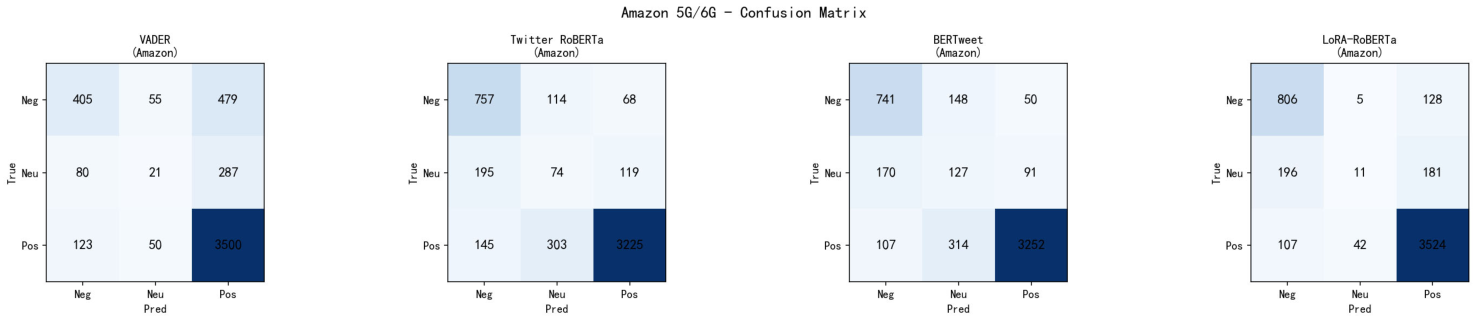
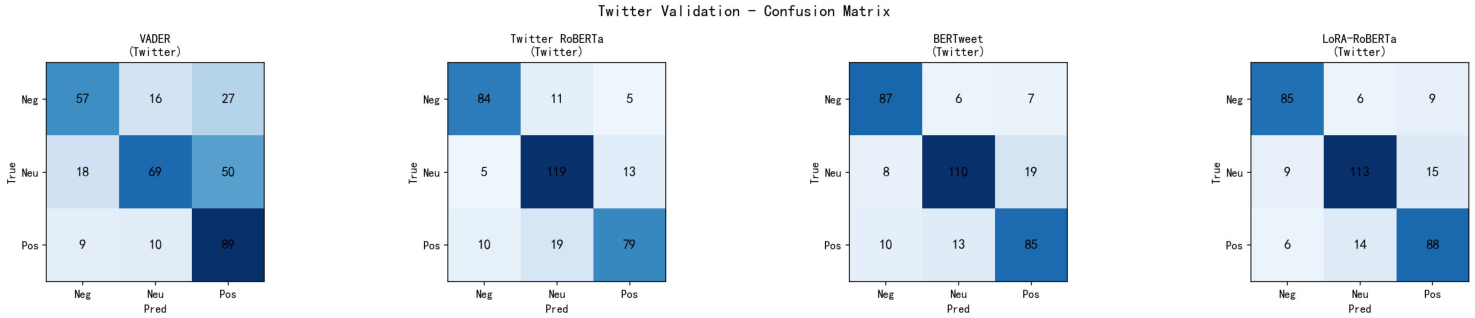
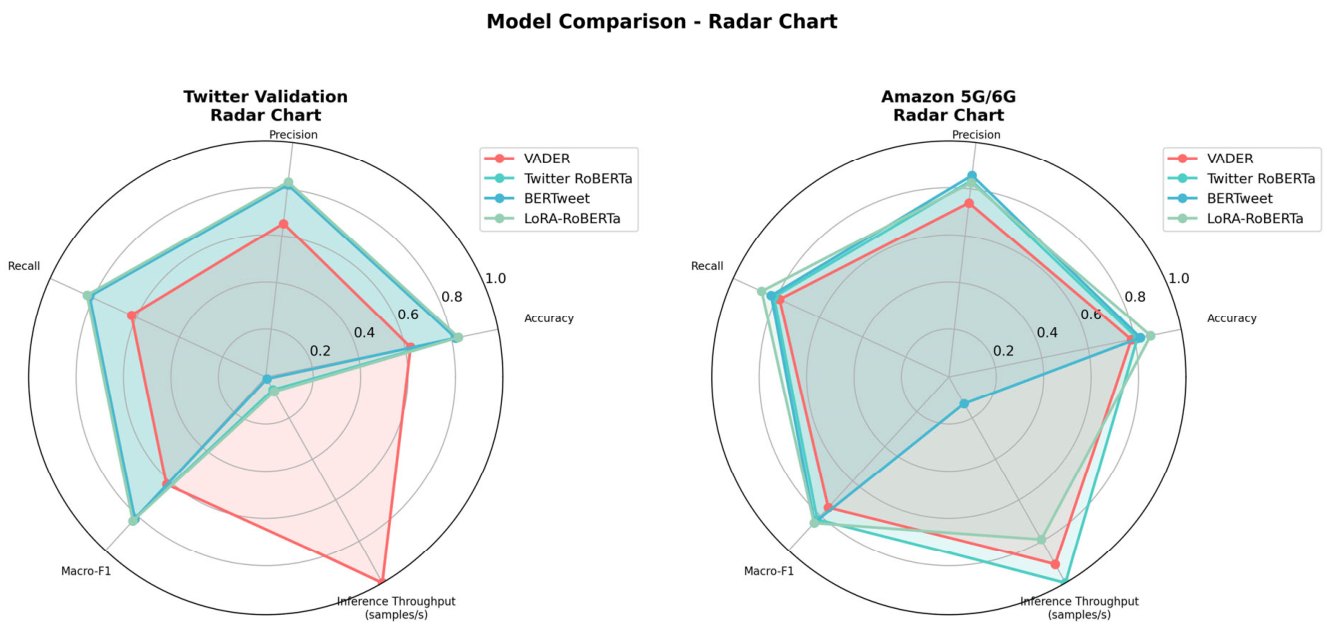
First, the experimental results demonstrate a clear trade-off between accuracy and efficiency across different model architectures. On both datasets, Transformer-based pre-trained language models significantly outperform the rule-based VADER model in classification accuracy, Macro-F1, and the ability to recognize complex domain-specific expressions. Specifically, BERTweet achieves the best baseline performance on the filtered public Amazon dataset (82.40% accuracy, 83.86% Macro-F1), while Twitter-RoBERTa exhibits stable performance on the short-text Twitter dataset. In contrast, the rule-based VADER model delivers lower classification accuracy, especially for neutral texts and technically sophisticated content, but possesses unparalleled advantages in inference speed for short social media texts.
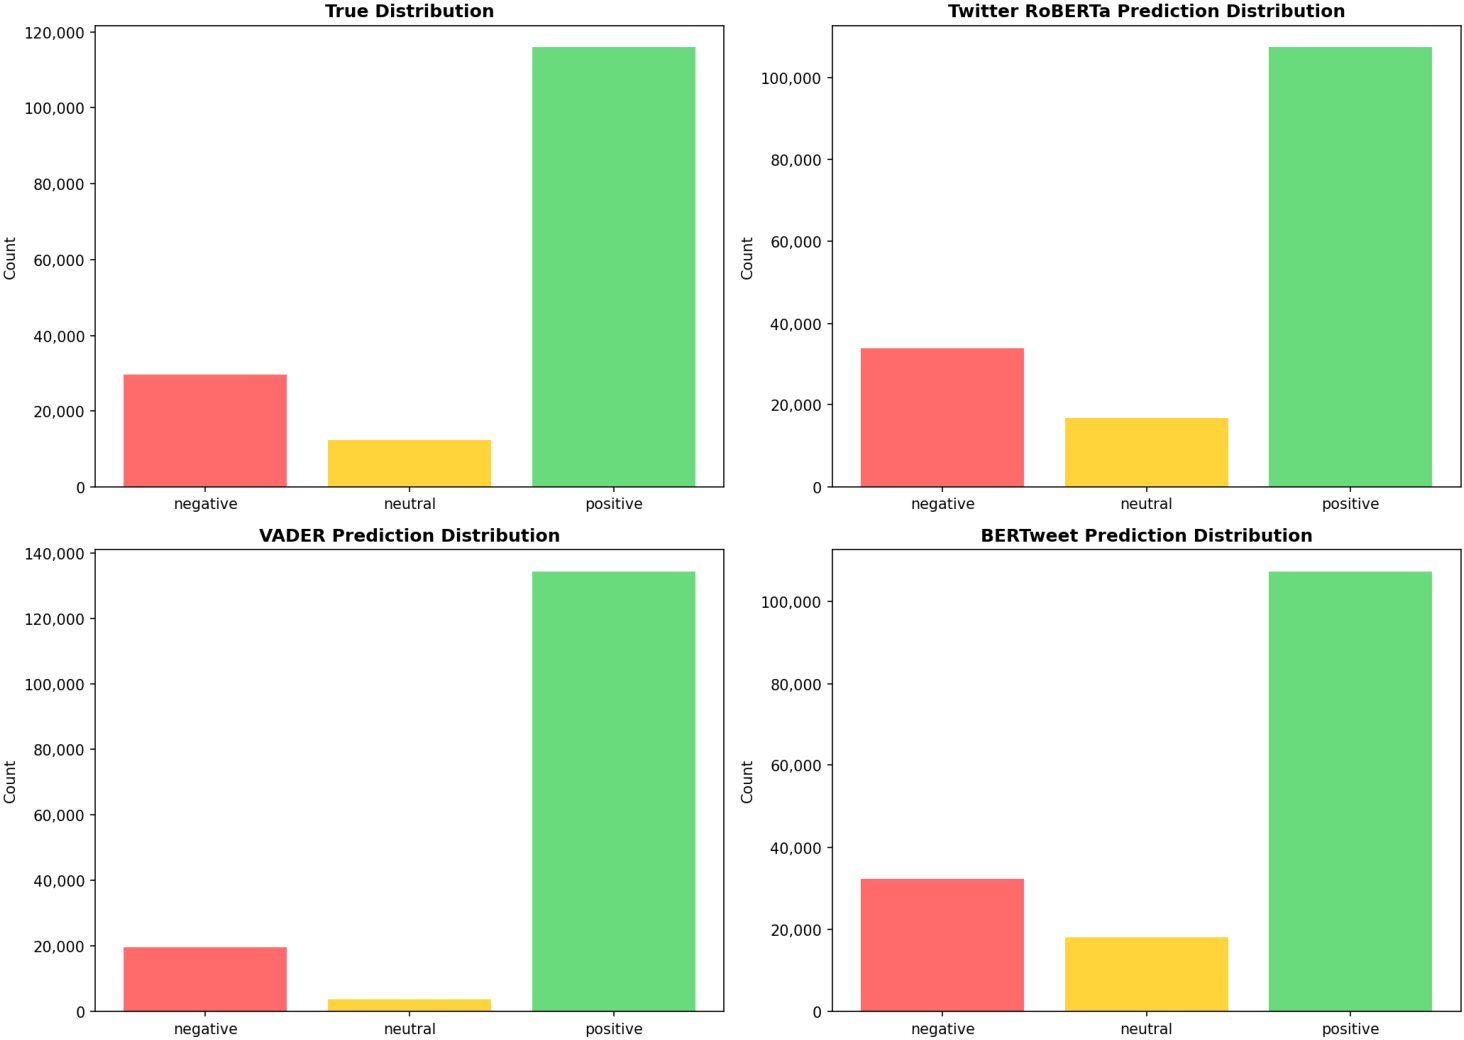
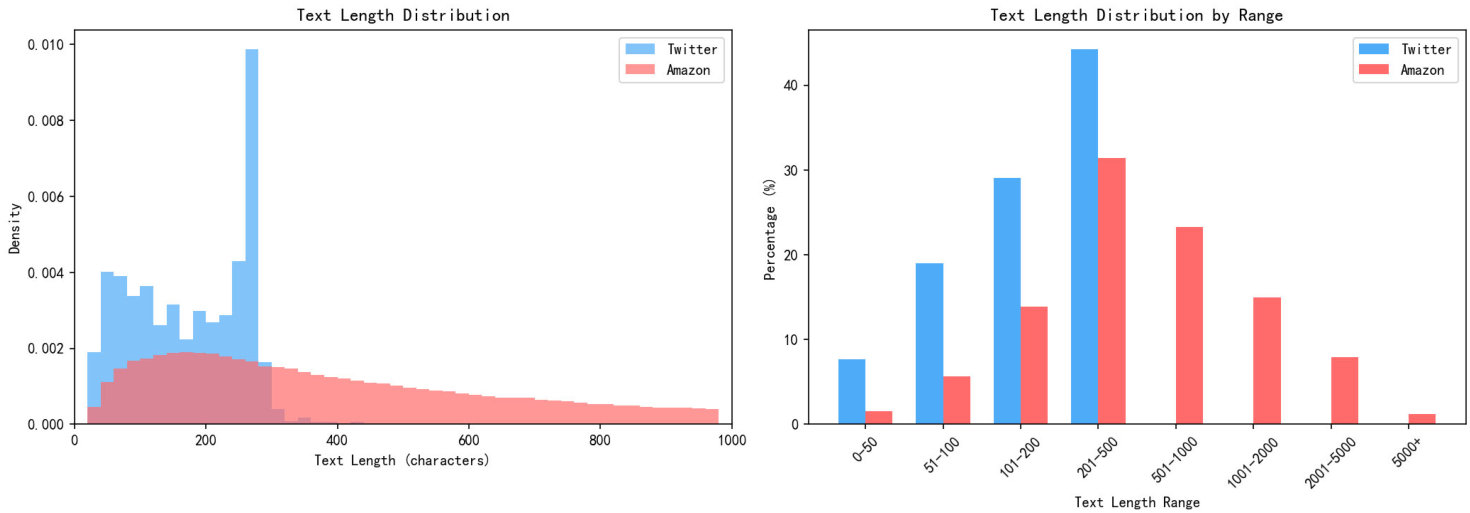
An important finding of this experiment is that text length has a clear impact on model inference efficiency. On the Twitter dataset dominated by short texts, VADER achieves the shortest per-sample inference time and the highest inference throughput, indicating strong deployment efficiency for short-text scenarios. On the Amazon dataset with a high proportion of long reviews, however, its inference throughput declines noticeably, narrowing the efficiency gap between VADER and the Transformer-based models. Dataset verification shows that all collected Twitter samples are short texts, while the Amazon dataset contains a large number of long samples, as indicated by the character-length distribution shown in
Figure 14. This discrepancy can be explained by the fundamental differences in model architectures: VADER is a linear rule-based model whose computational cost increases more directly with text length, whereas Transformer-based deep learning models rely on GPU parallel computing, making their inference latency less sensitive to text length within conventional ranges.
In addition, the relatively low inference efficiency of BERTweet stems from its dependence on the encapsulated pysentimiento library interface, which restricts optimization for customized deployment scenarios. It should also be emphasized that the inference efficiency comparison is deployment-oriented rather than hardware-normalized. VADER was evaluated on CPU because this is its natural deployment setting as a lightweight lexicon- and rule-based method, whereas Transformer-based models were evaluated with GPU acceleration to reflect their practical deployment configuration. Therefore, the reported throughput values should be interpreted as practical runtime observations under model-appropriate deployment settings, rather than as a strictly hardware-controlled speed benchmark.
Furthermore, the LoRA fine-tuned RoBERTa shows numerical performance improvements on both datasets, with statistically significant evidence observed on the Amazon dataset and a non-significant but positive trend on the Twitter dataset. Compared with the best baseline method, LoRA-RoBERTa achieves relative accuracy enhancements of 1.42% and 5.36% on the Twitter and Amazon datasets, respectively, with corresponding Macro-F1 enhancements of 1.43% and 0.33%. A plausible explanation for this improvement is that the self-collected Twitter dataset contains domain-specific expressions, technical terminology, and complaint patterns related to 5G/6G communication technologies that are not fully represented in general-purpose sentiment pre-training corpora. LoRA-based fine-tuning enables the model to adapt more effectively to these domain-specific sentiment cues without requiring full-parameter updating.
Moreover, the inclusion of filtered 5G/6G-related Amazon reviews in the training stage may have increased data diversity and improved the model’s robustness to varied expressions in the 5G/6G communication domain. These results suggest that parameter-efficient fine-tuning can be an effective approach for improving sentiment analysis performance in specialized communication scenarios while maintaining practical deployment feasibility.
It should also be noted that this study focuses on representative models from different sentiment analysis paradigms rather than an exhaustive benchmark of all recent state-of-the-art systems. Due to the scope and length constraints of the present manuscript, additional Transformer variants, instruction-tuned language models, and large-scale generative models were not included. Future work will extend the benchmark to a broader model set and conduct repeated multi-seed experiments to further assess the robustness of the observed performance-efficiency trade-offs.
4.2. Conclusions
This study investigates sentiment analysis of 5G/6G public discourse on social media through a comparative evaluation of deep learning-based and rule-based approaches. The experimental results show that pre-trained language models optimized for social media, such as Twitter-RoBERTa and BERTweet, achieve superior classification performance on 5G/6G-related texts, whereas the rule-based VADER model demonstrates clear advantages in short-text inference efficiency. These findings reveal a practical trade-off between predictive performance and deployment efficiency across different sentiment analysis paradigms.
The results further indicate that text length plays an important role in model efficiency. In particular, VADER performs efficiently on short Twitter texts but exhibits a notable decline in efficiency when applied to longer review data, while Transformer-based models maintain more stable inference behavior under varying text lengths. In addition, the LoRA-based fine-tuning experiment shows that lightweight parameter-efficient adaptation can further improve sentiment classification performance in the 5G/6G communication domain without imposing substantial additional deployment cost. These quantitative enhancements further confirm that LoRA-based fine-tuning improves domain adaptability for 5G/6G-related sentiment analysis.
Overall, this study provides empirical evidence that model selection for sentiment analysis in 5G/6G public opinion monitoring should consider not only classification accuracy but also inference efficiency and domain adaptability. The findings offer practical guidance for the deployment and optimization of sentiment analysis models in 5G/6G-related public opinion monitoring and decision-support systems. Rather than proposing a new model architecture, the scientific contribution of this study lies in identifying how representative sentiment analysis paradigms behave under the linguistic characteristics and deployment constraints of 5G/6G public discourse.