The Impact of the Thermal Comfort Models on the Prediction of Building Energy Consumption


1
School of Natural Resources Engineering and Management, German Jordanian University, P.O. Box 35247, Amman 11180, Jordan
2
Priority Research Centre for Frontier Energy Technologies and Utilisation, The University of Newcastle, Callaghan, NSW 2308, Australia
*
Author to whom correspondence should be addressed.
Sustainability 2018, 10(10), 3609; https://doi.org/10.3390/su10103609
Submission received: 13 September 2018
/
Revised: 5 October 2018
/
Accepted: 6 October 2018
/
Published: 10 October 2018
(This article belongs to the Special Issue Impact of Various Energy Efficiency Measures on the Thermal and Energy Performance of Buildings)
Abstract
:Building energy assessment software/programs use various assumptions and types of thermal comfort models to forecast energy consumption. This paper compares the results of using two major thermal comfort models (adaptive thermal comfort and the predicted mean vote (PMV) adjusted by the expectancy factor) to examine their influence on the prediction of the energy consumption for several full-scale housing experimental modules constructed on the campus of the University of Newcastle, Australia. Four test modules integrating a variety of walling types (insulated cavity brick (InsCB), cavity brick (CB), insulated reverse brick veneer (InsRBV), and insulated brick veneer (InsBV)) were used for comparing the time necessary for cooling and heating to maintain internal thermal comfort for both models. This research paper exhibits the benefits of adopting the adaptive thermal model for building structures. It shows the effectiveness of this model in helping to reduce energy consumption, increasing the thermal comfort level for the buildings, and therefore reducing greenhouse emissions.
1. Introduction
The building sector is considered to be a large contributor to climate change, since building energy consumption is responsible for releasing approximately 33% of worldwide greenhouse gas (GHG) emissions [1]. Climate change effects need to be reduced by lowering greenhouse gas emissions through engineering solutions and designs to build low-energy, or in other words, energy-efficient buildings. Many studies have shown that energy-efficient or low-consumption energy buildings require the use of passive design solutions to reduce energy consumption [2]. Applying passive design strategies can enhance indoor comfort conditions, while decreasing the energy consumption, by allowing the occupants to lengthen the non-heating and cooling period [3].
The accuracy of thermal comfort prediction is considered to be a beneficial approach, since it is economical and reduces energy consumption [4]. Seven air-conditioned buildings in South Korea were used to examine the effect of occupants’ apparent control in their thermal environments and its effects on cooling energy consumption. The results indicate that increasing occupants’ apparent level of control over their thermal environment could reduce cooling energy consumption by 9% without sacrificing the thermal comfort of the occupants [5].
The accurate thermal comfort design and operation of buildings and Heating, ventilation, and air conditioning (HVAC) systems required taking into account all of the involved factors. Often, building designers overlook or apply them in an incorrect way. Design input values from standards are often considered as universal values rather than suggested values to be used under particular environments. At the operational level, only a small number of variables are considered with unpredictable effects on the calculation of thermal comfort [6].
Thermal comfort is the human experience of satisfaction with the thermal environment, and it is based on inhabitant thermal sensation [7]. Thermal comfort is defined as a “condition of mind”, which is a psychological term. Occupants’ comfort level inside any surroundings may vary and adapt over time due to psychological factors. The individual perception of thermal comfort may be affected by the remembrance of previous experiences. Adaptation takes place when frequent experiences to a certain environment moderates future expectations. This is a significant element in understanding the variance in free-running mode buildings between field results and predicted mean vote (PMV) predictions [8]. Hard labor work in hot humid environments is an actual health and economic danger to millions of working people and their families in hot tropical and sub-tropical climates [9].
The comfort temperature is not a fixed value for everybody, since it is primarily driven by several factors, including air temperature, air speed, and direction, metabolic rate, clothing levels, mean radiant temperature, and humidity [6]. Inhabitant thermal comfort is calculated by measuring the comfort zone of a specific value in terms of occupants [10].
The American Society of Heating, Refrigerating, and Air-Conditioning Engineers (ASHRAE) has developed an industry standard, which is known as the Thermal Environmental Conditions for Human Occupancy/ASHRAE Standard 55-2017. This standard has presented an outline for the categorization of the combinations of interior thermal environment and its personal aspects, which creates thermal environments that are suitable for the mainstream of the inhabitants [10].
There are two main thermal comfort modules used by ASHRAE Standard 55-2010:
- The predicted mean vote (PMV) and the predicted percentage dissatisfied (PPD) models, which are also adopted by Comité European de Normalization (CEN) and by International Standardization Organization (ISO) standards.
- Adaptive thermal comfort models.
The largest energy consumer in the European Union (EU) is the building sector, and toward more energy efficient buildings, a new revised Energy Performance of Buildings Directive (EPBD) (EU) 2018/844 has been published in the European Union Official Journal (L156) and will take effect on 9 July 2018 in order to speed up the pace of new buildings and the cost-effective renovation of current buildings’ renovation on the way to more energy efficient buildings in all of the European Union (EU) countries. This will required the EU countries to transfer the new components of the EPBD into national law by March 2020 [11].
Under the new EPBD, all of the EU countries will have to create more solid “long-term renovation strategies” to decarbonizing the national building by 2050. These strategies need to include a firm financial element, and the new buildings will encourage smart buildings technologies in addition to the health and well-being of building occupants. E-mobility will also be reinforced by introducing minimum requirements for car parks over a certain period [12].
EN15251 specifies “indoor environmental input parameters for the design and assessment of [the] energy performance of buildings addressing indoor air quality, thermal environment, lighting, and acoustics” as the first European standard that contains standards for the four indoor environmental factors: thermal comfort, air quality, lighting, and acoustic. This standard has been broadly used in practice, and several scientific papers have been published dealing with issues related to the adequacy of the standard [13,14].
The European thermal adaptive comfort standard BS EN 15251 is based on ASHRAE 55, and the comfort temperature is calculated in the same way (similar equations but with different coefficients). As there is currently no Australian standard, ASHRAE 55 will be used [15].
REHVA is the Federation of European Heating, Ventilation, and Air Conditioning Associations, and includes more than 100,000 registered engineers. REHVA is devoted to the enhancement of the health, energy efficiency, and comfort in all of the buildings by assisting the knowledge interchange and related policies inside the EU to be implemented at the national level [16].
REHVA has submitted suggestions to revise the Energy Performance of Buildings Directive (EPBD) to promote the use of techniques to enhance the energy efficiency and the indoor environment quality. The EN15251 standard is an outcome of the EPBD, and identifies the standards, principles, and measures for attaining healthier indoor environmental conditions. Other standards are under improvement, such as ISO 17772-1 (ISO, 2017), which targets standardizing retrofits [17,18,19].
PMV thermal comfort is defined by six variables: air temperature, relative air velocity, mean radiant temperature, mean air humidity, clothing insulation, and metabolic rate. The first four of these variables can be obtained through sensors; however, the assessment of metabolic rate and clothing insulation are dependent on individual users: ISO 9920 (clothing), ISO 8996 (metabolic rate), and ISO 7726 (instruments and methods) [20].
The PMV is established using heat balance principles and data gathered in a controlled climate environment under steady-state conditions. The PMV index predicts the mean response of the general public, as outlined by the ASHRAE thermal sensation scale, as shown in Figure 1.
There are strengths and limitations for the PMV model. For instance [21], determining the predicted mean vote (PMV/PPD) is a limitation, since information about metabolic rates and clothing insulation are difficult to estimate with accuracy. The PMV for thermal comfort also attempts to find the response of occupants living in the environment in terms of the physiology and physics of heat transfer, which is a complex procedure. It does not consider the psychological factors, which play a significant part in determining the thermal comfort conditions. Many field studies have found that the PMV is challenging to use in the real world, and can lead to inaccuracies in terms of the prediction of comfortable conditions, as it is depends on the physiology and subjective perception of respondents [22]. A field study in an air-conditioned office building showed that the adaptive model better fitted occupants’ thermal acceptance than the PMV/PPD model with least energy consumption [23].
Surveys on many buildings have exposed that acceptable indoor environmental conditions are often not achieved. This proposes that the entire building industry needs more precise methods to study and design indoor environments [24,25,26]. Many studies focus on assisting building and HVAC systems designers and operators to deal with the various and complex standards for improving energy efficiency and indoor environmental quality [6].
As a result of the above complexities, a new method was developed. This method is known as adaptive thermal comfort, and helps building designers calculate the comfortable internal air temperature in free-running buildings. Noting that the adaptive thermal comfort method works only in free-running buildings and not in air-conditioned buildings, while the PMV/PPV works well only in air-conditioned buildings and not in free-running buildings [27].
This adaptive module was developed through several empirical and experimental investigations; it can successfully calculate the internal air temperature by considering several factors such as the interaction of the inhabitants with their surroundings, including when they change their clothes, opening/closing windows, the use of low-energy fans, drinking water, and drawing shades. One of the key outcomes of the adaptive theory is that individuals living in warmer climates can tolerate warmer indoor air temperatures than those who live in colder climates [28].
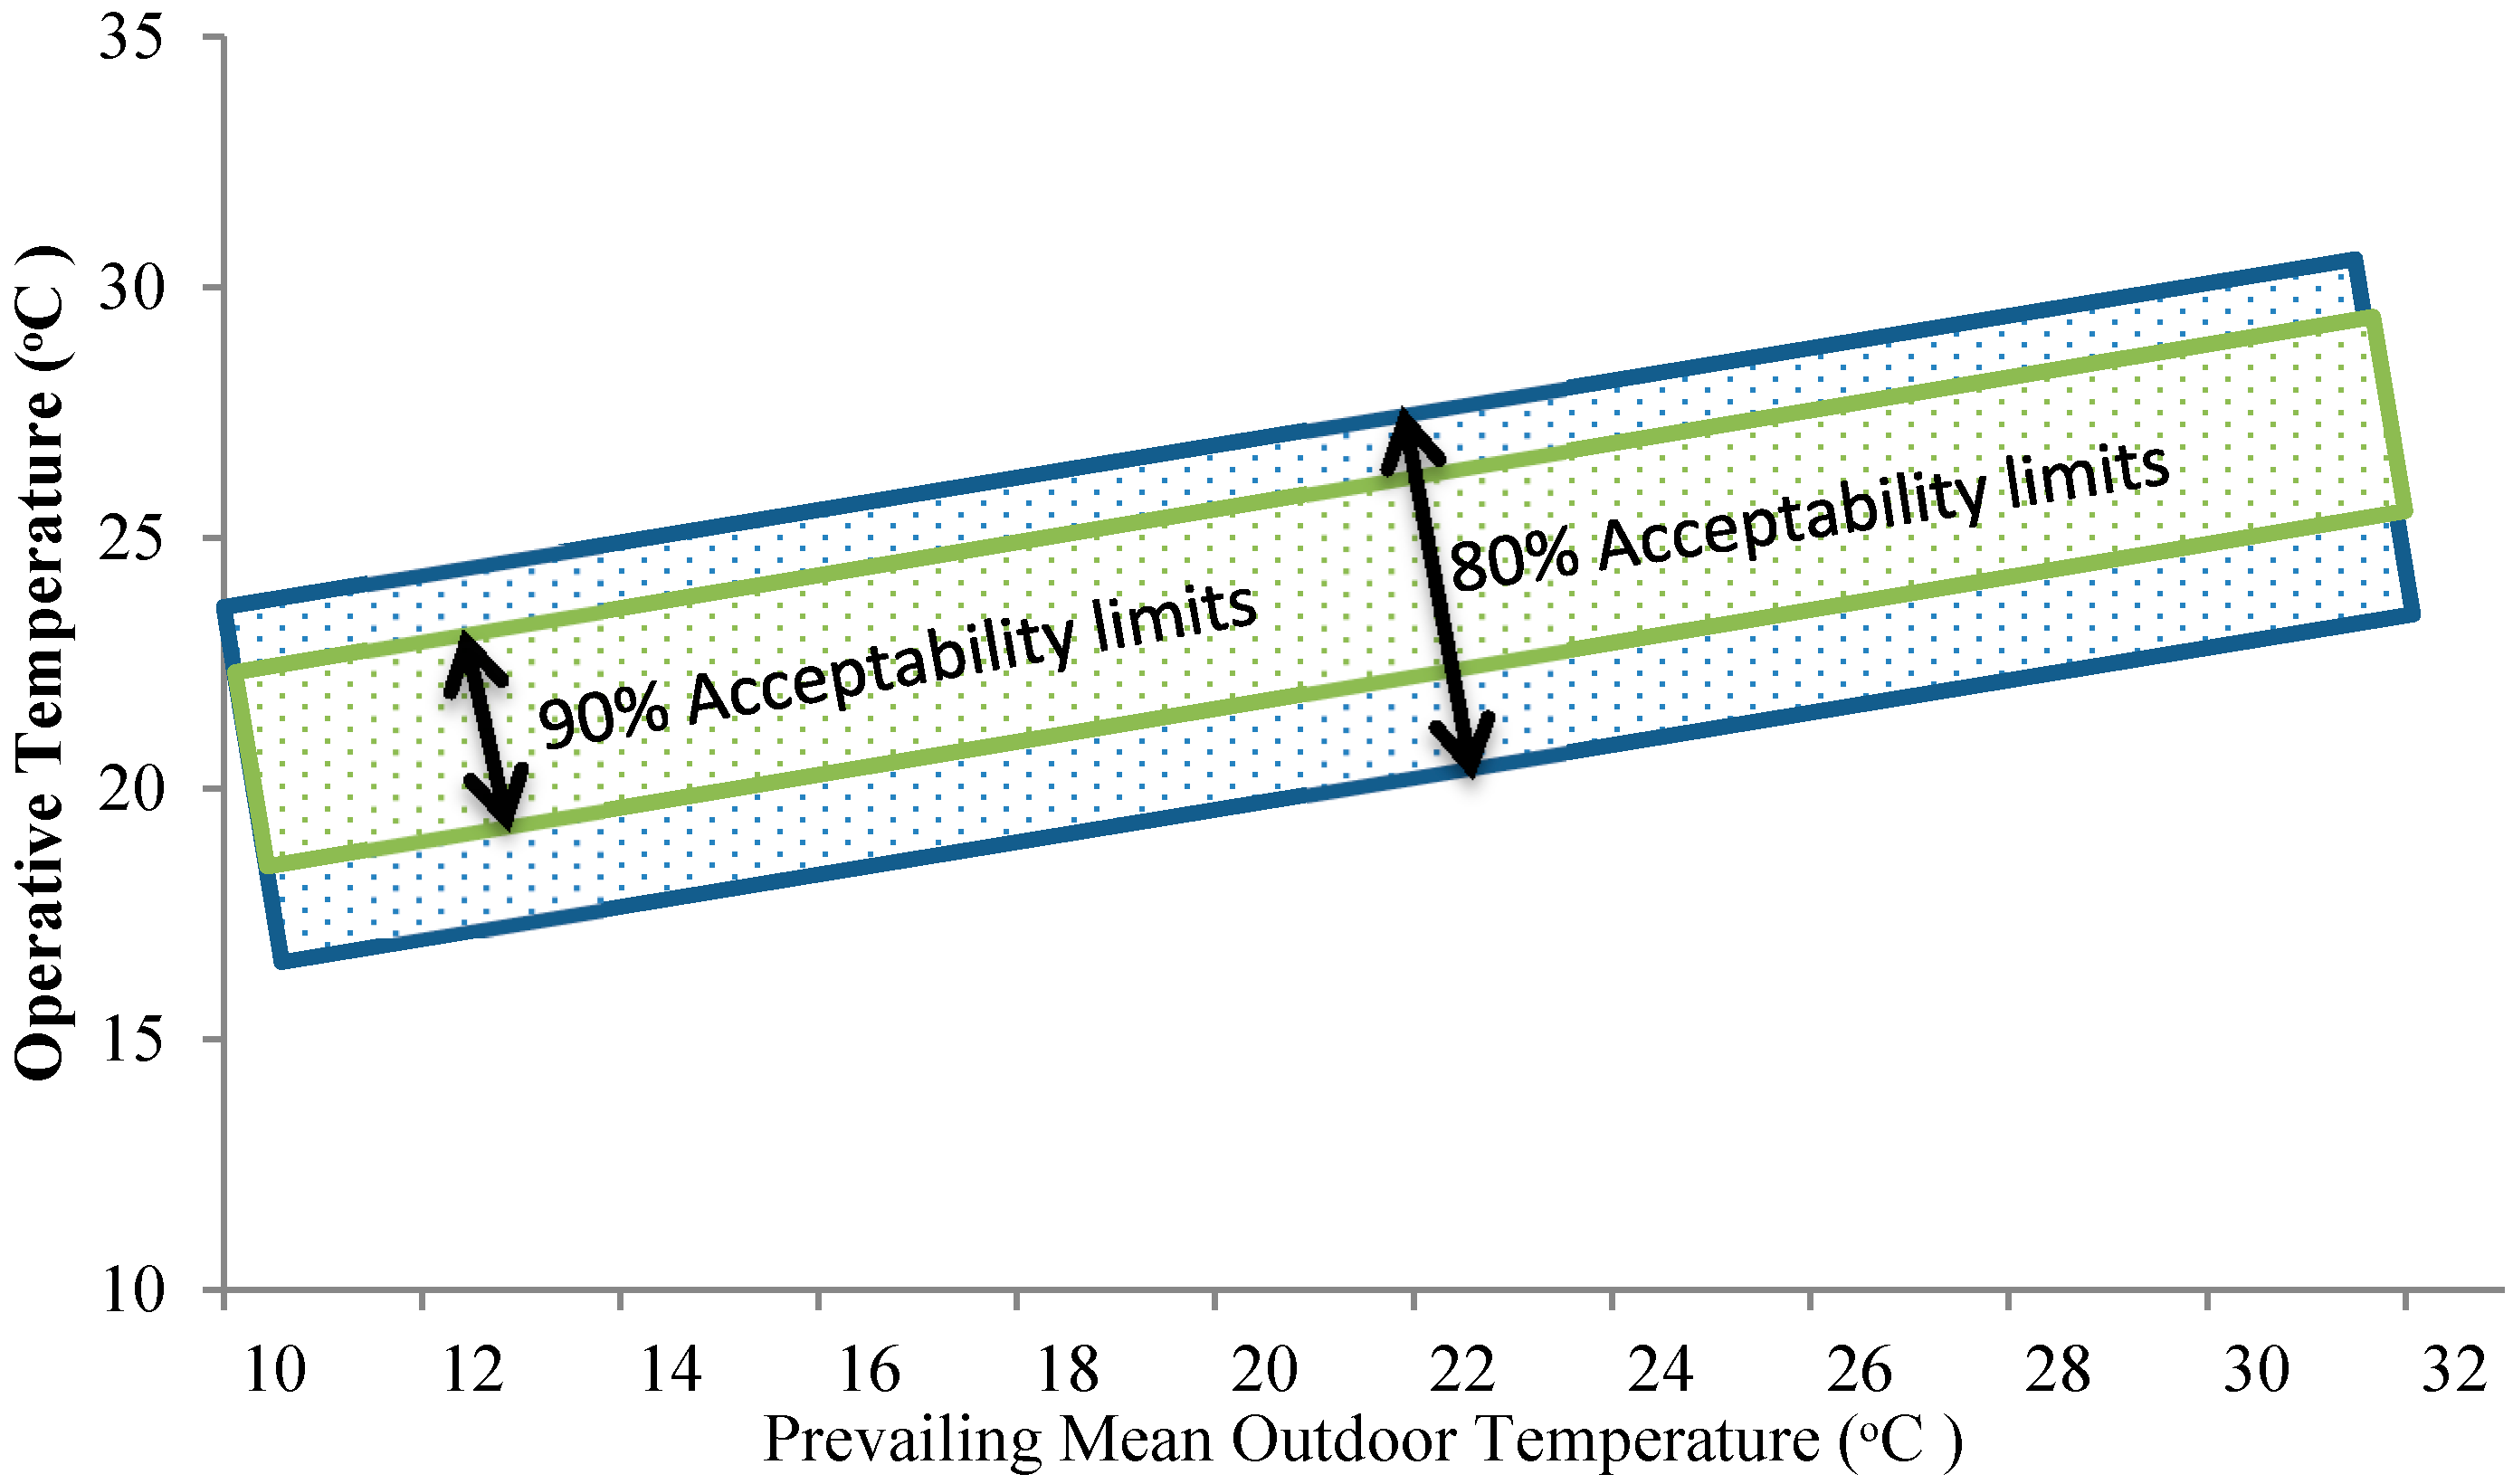
Comfort area is the area around the neutrality/comfort line and represents the upper and lower comfortable temperature. The 90% and 80% acceptability limits a comfort area with an ideal thermal comfort temperature of 2–3 °C on either side of the comfort line, which is considered to be an acceptable limit, as shown in Figure 2. If fans are available, another 2 °C can be added on both sides to calculate the comfort zone value for very hot, dry, climate conditions. For humid climates, 1 °C can be added on both sides to determine the comfort zone value [29]. The identified range of temperatures match 90% and 80% acceptability limits, and could reach around 30 °C following the adaptive model in the ASHRAE 91 55-2010 Standard [30].
The identified range of temperatures match 90% and 80% acceptability limits, and could reach around 30 °C following the adaptive model in the ASHRAE 55-2017 Standard, as shown in Figure 2.
Expanding the thermal comfort criteria by lowering the acceptability limits from 90% to 70% has a significant impact on space-cooling energy consumption (saving more than 40%) in tropical regions and regions with a hot summer climate [31].
One of the main advantages of the adaptive thermal comfort module is that it eliminates the requirements of calculating air speed and humidity. However, research suggests that in order to analyze the impact of these two factors on the occupant’s thermal comfort, data of the occupants related to windows and doors opened, or fans running, were considered in the analysis [32]. Field experiments were carried out in 26 air-conditioned, and 10 naturally ventilated classrooms using surveys and physical measurements, and indicated that humidity has a very low statistical impact on thermal comfort [33,34].
Naturally ventilated buildings normally consume less than half the energy of air-conditioned buildings because the inhabitants adapt to a considerably broader range of temperatures that fall out of the comfort zone defined by the PMV model [10]. The PMV model also predicts that inhabitants will feel hotter than they actually do, and therefore encourages the consumption of more air conditioning than needed [30].
The adaptive thermal comfort model (by ASHRAE Standard 55-2017 and EN 15251) is used for naturally ventilated buildings, while the PMV/PPD model can be applied in air-conditioned buildings, as it inaccurately directly compares the thermal comfort between the two models. Fanger recommended the expectancy factor, e, to grasp the mean thermal sensation vote of the inhabitants of the actual non-air-conditioned building in a warm climate. The factor “e” varies between 1 and 0.5. It is one for air-conditioned buildings. For non-air-conditioned buildings, the expectancy factor is expected to depend on the length of the warm weather over the year, and whether such buildings can be compared with many others in the region that are air-conditioned; it may be between 0.8–0.9 [35]. Heating and cooling can be reduced when occupants accept wider ranges of internal air temperature, which results in lower energy usage and running costs; therefore, it enhances the economic and environmental performance of the building [36,37].
Inhabitants with greater individual control over their environment have a tendency to accept wider ranges of indoor temperatures. On average, they accepted a 2.6 °C lower operative temperature and showed a lower motivation to modify their current environment (by using air conditioning) compared with those without personal control. It is recommended that inhabitants have a chance to interact with their thermal environment through openable windows and doors, low-energy fans, and minimizing the usage of controllable heating/cooling systems [38].
Using the adaptive thermal comfort model in free-running buildings over the predicted mean vote (PMV) and predicted percentage dissatisfied (PPD) models has proved to be more accurate [6]. The adaptive thermal comfort model saves more building-operated energy in naturally ventilated buildings, compared to air-conditioned buildings, since the occupants adjust to a wider range of internal air temperatures than the external thermal comfort zone, as determined by the PMV model [10]. The PMV model also assumes that occupants will feel hotter than they really are, which gives false data to the air-conditioning systems to lower the operational temperature, ultimately increasing the energy consumption [30]. A case study in the south of Spain of a skyscraper with high-tech energy-efficient features results in a saving of the occupation hours, which reduces the use of air-conditioning equipment by almost 28%, and will significantly reduce the overall skyscraper energy consumption [39].
Cooling and heating can be minimized when inhabitants adapt to wider zones of internal air temperature, leading to less energy consumption and consequently helping to enhance and improve the thermal performance of the building [37].
2. Methodology
This research describes the advantages of using an adaptive thermal comfort model approach to assess the building’s thermal performance over the PMV approach using four full-scale housing test modules located in Newcastle, Australia (cavity brick (CB), insulated cavity brick (InsCB), insulated brick veneer (InsBV), and insulated reverse brick veneer (InsRBV)) subjected to a range of seasonal conditions. The time required for heating or cooling using the adaptive thermal comfort and PMV approach was estimated.
2.1. The Mathematics Behind PMV
The predicted mean vote (PMV) model is considered to be the most widely used thermal comfort index today. The PMV equation only applies to humans exposed for a long period of time to steady-state conditions in terms of microclimate and activity. To calculate the PMV model, these equation could be used [40]:
where
- ta: Air temperature [°C]
- V: Relative air velocity inside the room [m/s]
- fcl: Clothing factor, accounting for the relative increase in the clothed body surface over that of the unclothed body
- Icl: Clothing insulation [clo]
- Rcl: Clothing thermal insulation (m2 K/W)
- hc: Convective heat transfer coefficient (W/m2)
- e: 10
- W: External work (assumed = 0 W/m2)
- tr: Mean radiant temperature [°C]
- Met: Metabolic index [58.2 W/m2] or [met]
- tcl: Surface temperature of clothing [°C]
- pa: Partial pressure of water [KPa].
The variables were collected from data recorded inside the site, while the pressure and humidity levels (air humidity equal to 80% could be over the range of water partial pressure required by the module) were obtained from the Bureau of Meteorology Australia [41] as the experimental modules in free-running moods and no inhabitants or activities inside it, as shown in Table 1.
PPD is defined as the proportion of inhabitants that are uncomfortable within their thermal environments. The suggested suitable PPD thermal comfort zone is less than 10% of occupants, who are dissatisfied with their situation [10]. PPD is a function of PMV (the average response of satisfaction among a large group of people). The empirical relationship between the PPD and the thermal environment is a function of the PMV [16] as following [42];
2.2. Adaptive Thermal Comfort
For this research, the adaptive thermal comfort temperature for free-running buildings has been adopted (mechanically cooled or heated buildings have been excluded because of two reasons: their complex nature and lesser stability). The relationship between the comfort temperature Tc and the outdoor temperature To for a temperate climate in Australia is as described below [29]:
where
Tc = 17.8 + 0.31To
- To: The average of the outdoor air temperature for the previous 30 days (°C).
- Tc: Comfortable temperature (°C).
To find the adaptive thermal comfort of 80% of the acceptability limit inside the building, the following equation is used [29]:
80% acceptability higher limits = Tc + 3.5 °C
80% acceptability lower limits = Tc − 3.5 °C
Equation (8) represents 80% of the acceptability limits, where at least 80% of the inhabitants are comfortable with these temperatures.
The main requirement of using this module is that the occupants are assumed to be inactive and that the mechanical cooling or heating system has not been installed. The metabolic rates should range between 1–1.3 Met (physical activities in winter will warm the body, but in summer, it will make them feel hotter). The occupants are encouraged to adjust their clothing according to the weather conditions, within a range of 0.5–1.0 Clo [10].
2.3. Full-Scale Test Modules
For the past 13 years, ongoing research has been underway in the Priority Research Centre for Energy at the University of Newcastle, Australia, on the thermal performance of housing in Australia. A part of this research has included the building of four full-scale housing modules, incorporating a range of typical walling systems and monitoring their thermal performance under different weather conditions.
All of the modules were constructed at the University of Newcastle, Callaghan Campus (Latitude: 32.89° S, Longitude: 151.71° E). The houses have been designed to represent the types of housing that are commonly constructed in Australia. Apart from the walling systems, all of the modules had a similar design, with a square floor plan of 6 m × 6 m and spaced 7 m apart to reduce wind obstruction and avoid shading (see Figure 3).
- Door; heavily insulated door in the southern wall, to eliminate any heat losses and allow easy access to the module.
- Window; in the northern wall of each module is a 6.38-mm laminated clear glass window, in a light-colored aluminum frame.
- Roof; 10 mm plasterboard ceiling with R3.5 glass wool batt insulation (thermal resistance of 3.5 m2·K/W) between rafters. Concrete and clay tiled roof with sarking insulation.
- Slab; concrete covers the whole building floor, with 100-mm thickness.
The only difference between the modules is the walling system, which is identified in the following:
1. Cavity Brick Module (CB)
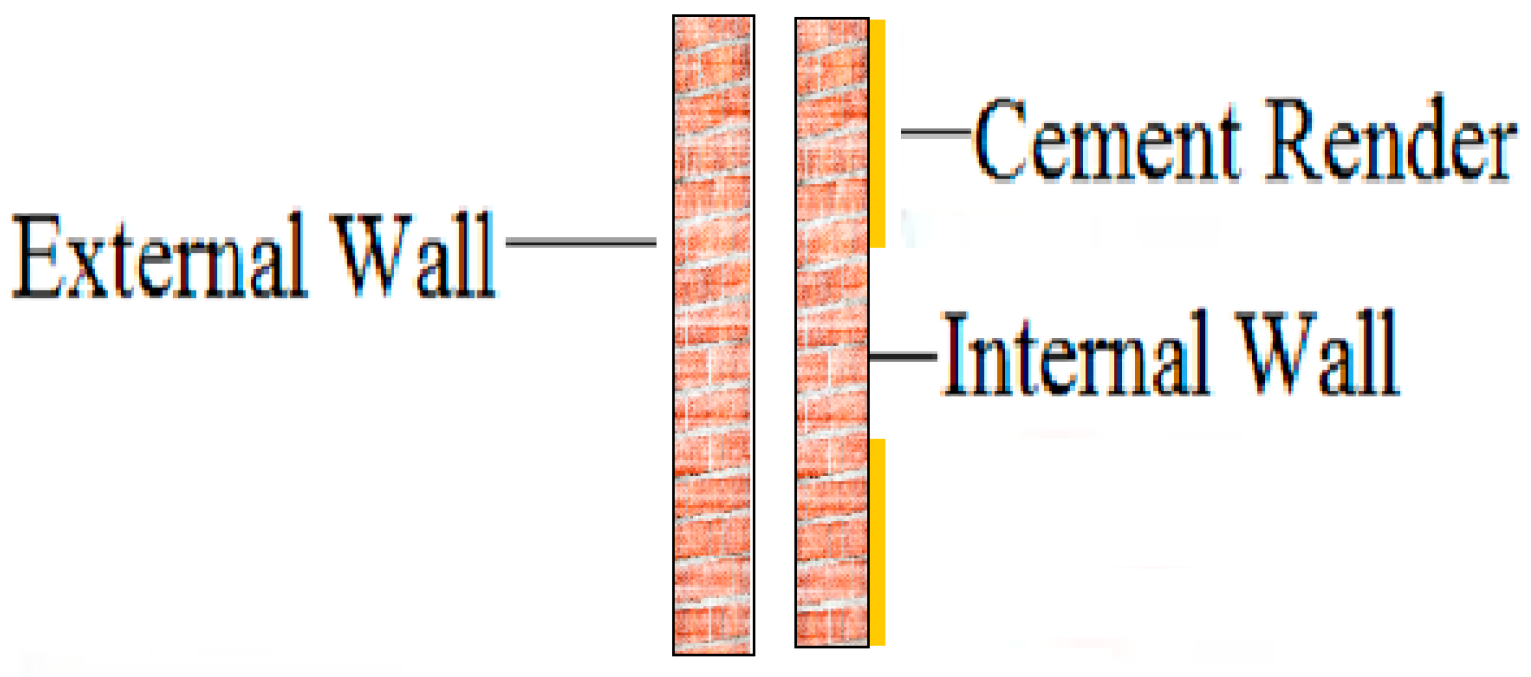
Walling for the CB module consisted of two 110-mm brickwork skins with 10-mm render covered internal walls and a 50-mm cavity between the walls, as shown in Figure 4.
2. Insulated Cavity Brick Module (InsCB)
For the InsCB module, two 110-mm brickwork skins and the internal walls were covered by 10 mm of internal render with a 50-mm cavity insulated by R1 polystyrene insulation, as shown in Figure 5.
3. Insulated Brick Veneer Module (InsBV)
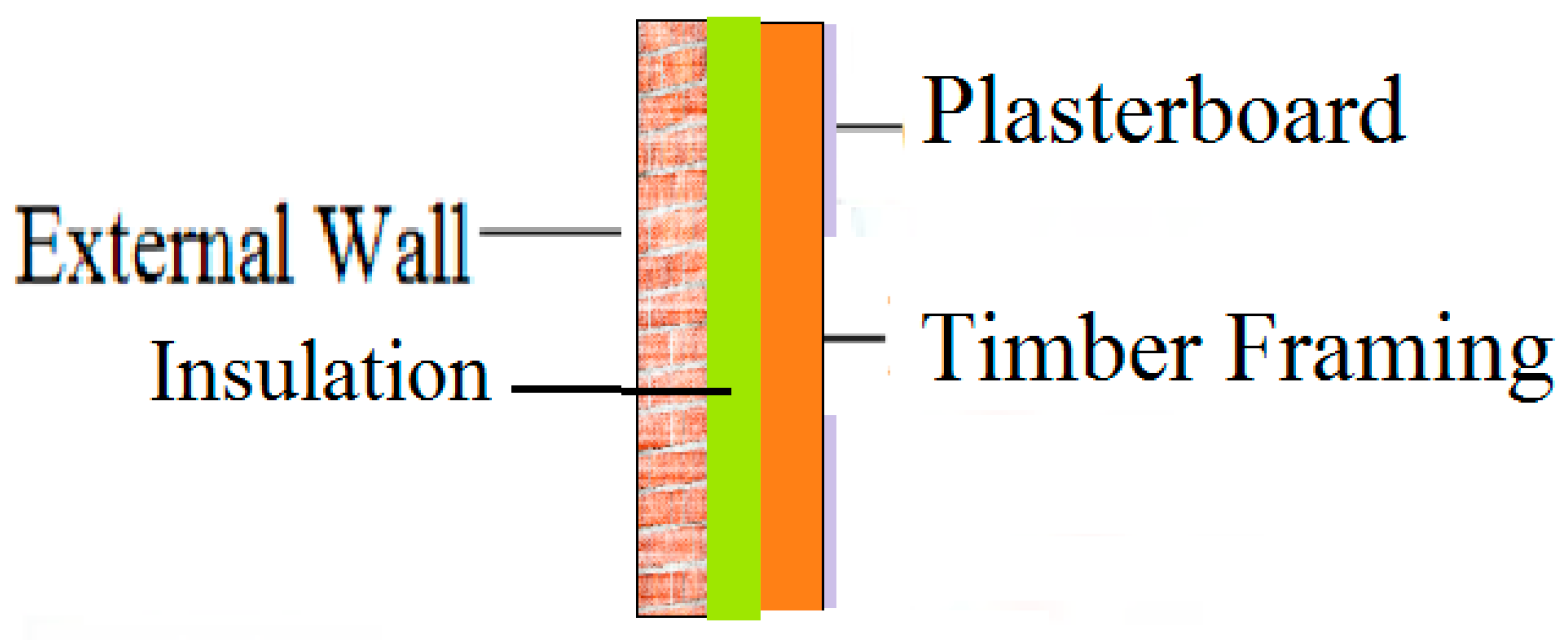
For the InsBV walls, the external walls were constructed using 110-mm brickwork skin, while the internal walls consisted of an internal timber frame covered with low-glare reflective foil and R1.5 glass wool batts, and covered by 10-mm plasterboard, as shown in Figure 6.
4. Insulated Reverse Brick Veneer Module (InsRBV)
For the external walls, 2–3 mm acrylic render on 7-mm fibrocement sheets were fixed on a timber stud frame, and insulated by R1.5 glass wool batts insulation. For the internal walls, a 110-mm brick skin was covered by a 10-mm internal render, as shown in Figure 7 [43,44,45,46,47,48,49].
First, 105 sensors were fitted in each module to record the internal and external conditions. The sensors were installed in each module with a minimum of 40 sensors as required by ASHRAE 55 to measure the thermal comfort performance of a small room. The sensors were distributed on the walls and in the middle of the module away from the occupied boundary, radiation, and diffusers. The data were recorded using Datataker DT600 data loggers every 5 min for 24 h/day over the testing period. All of the modules were air tight and left to “free float”, with the internal air temperature being influenced by the external weather conditions alone (no mechanical heating or cooling for all of the modules). The internal air temperature was logged at a height of 1200 mm inside the building. No mechanical ventilation was provided during the study period [43,44,45,46,47,48,49].
The accuracy of the PMV values is adequate only when the difference between the mean radiant temperature and the air temperature is less than 5 °C [20,50]. The difference between the mean radiant temperature and the air temperature within indoor environments is negligible during most periods [51].
In this research, the mean radiant temperature were calculated by finding the average temperature of all of the sensors located inside the room and the operative temperature calculated by finding the average air temperature for the sensors located in the middle of the building at different heights: 600 mm, 1200 mm, and 1800 mm.
The monthly average internal air temperature inside each module was recorded in order to find the PMV for each month and determine which months required heating and cooling to maintain thermal comfort. The equations to calculate the PMV have been implemented in a software tool that is available freely on: http://smap.cbe.berkeley.edu/comforttool. For the adaptive thermal comfort model, the total number of hours during which the internal air temperatures fell outside the occupants’ comfort range was calculated for each module using the 80% acceptability limits [52].
3. Results and Discussion
This research indicates the importance of using an appropriate thermal comfort model to predict the energy consumption inside any envelope; also, the assessment of the thermal performance using adaptive thermal comfort model simplifies the analysis and saves more building operation energy. On the other hand, using the predicted mean approach encourages energy consumption by using energy to sustain inhabitants’ thermal comfort and giving inaccurate energy needs predictions.
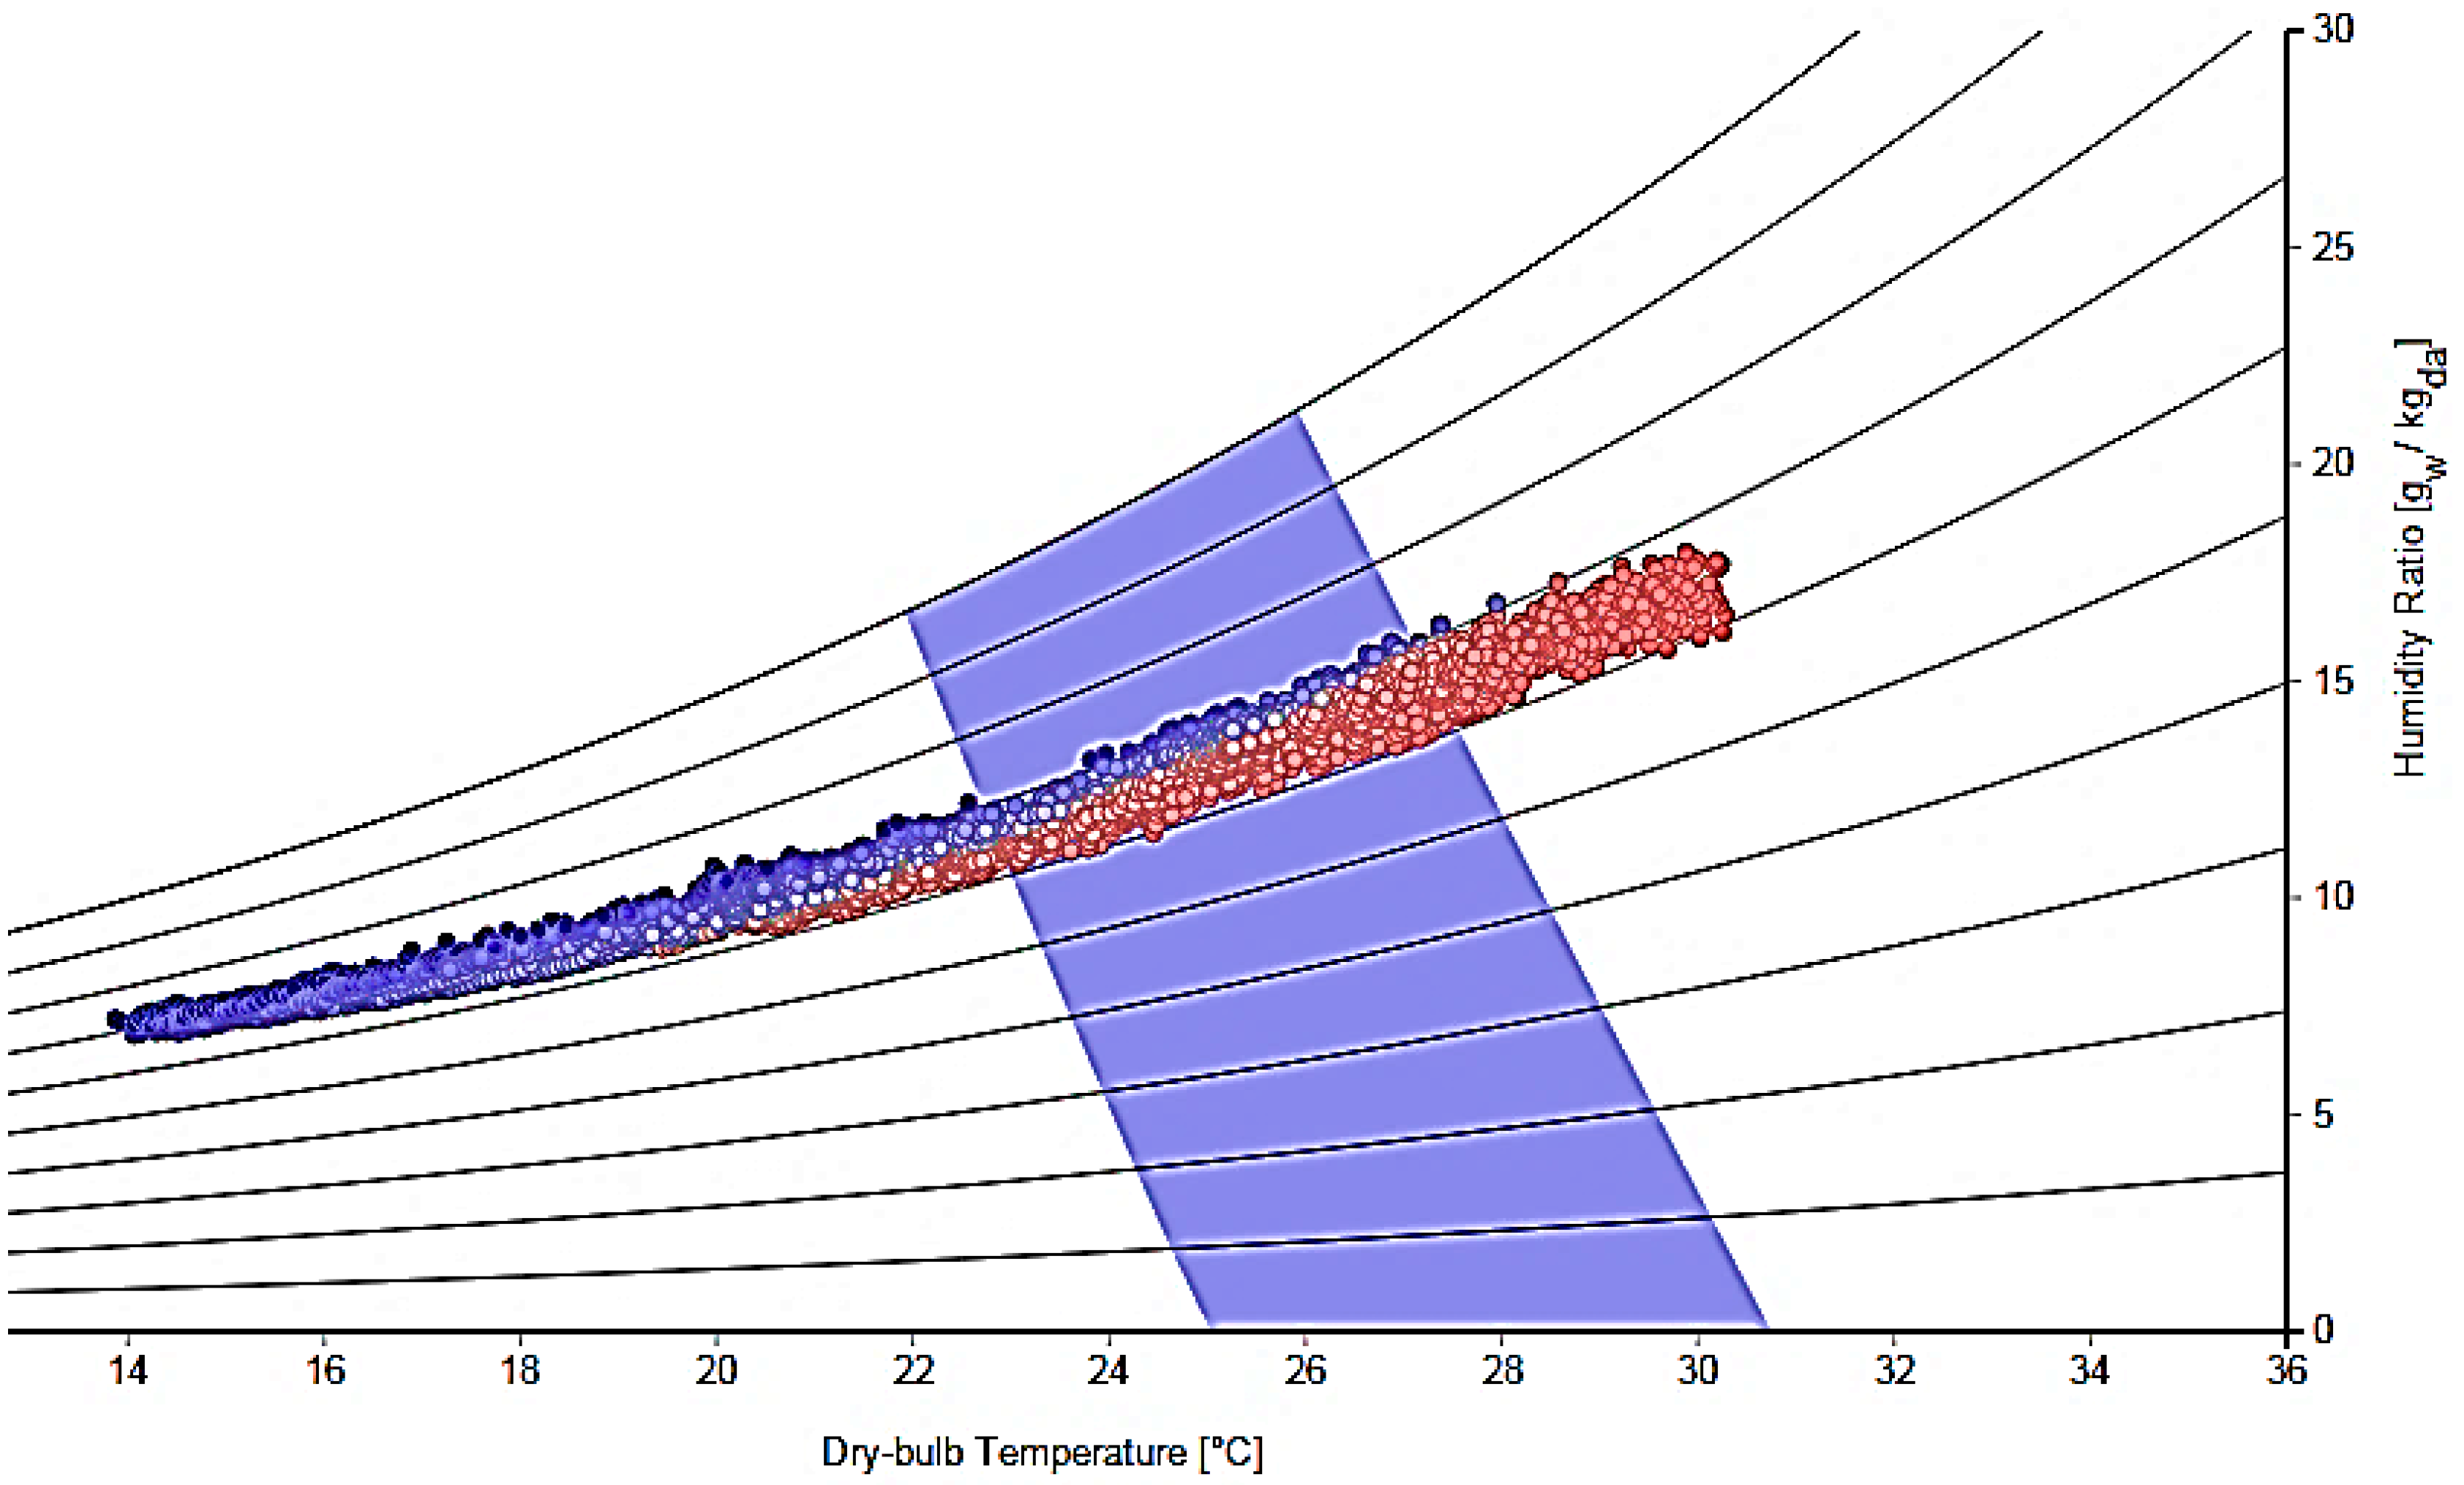
The predicted mean vote (PMV) was found for one year for all of the modules. The results of the cavity brick (CB) module are shown in the psychometric chart (see Figure 8), which presents the relationship between the air temperature and the humidity in graphical form. Data from the housing test modules are used, with the exception of humidity and pressure, which was obtained from the weather station on campus (as the building in free-running mode, and there are no occupants or any activities inside the modules).
There are many apps and web applications to calculate the PMV index compliant with ISO 7730 Standard. Unfortunately, limited apps take into account all six variables, so these tools have to be used with special care [53]. The equations to calculate the PMV have been implemented in a software tool that is available freely on: http://smap.cbe.berkeley.edu/comforttool [52].
As an example, the monthly average internal air temperature inside the cavity brick module was recorded to find the PMV for each month and determine which months required heating and cooling to maintain thermal comfort. In Figure 9, the entire months of May, June, July, August, September, and October, were outside the thermal comfort zone, indicating that half of the year required thermal heating for the CB module to sustain thermal comfort.
The PMV values were calculated using the same software tool for each hour, over one year, to find the number of hours for each module, which lay within the thermal comfort zone (as shown for Figure 9 for the CB module as an example). For each of the modules, the numbers of hours for each module where the internal temperature outside the thermal comfort zone were: 4993 h, 4292 h, 4205 h, and 4030 h per year, for the CB, InsCB, InsRBV, and InsBV modules, respectively.
The adaptive thermal comfort ranges of the 80% acceptability limits are shown in Figure 10 (CB modules). The external and internal temperature fluctuations inside/outside the buildings over one year are shown, where the green line represents the adaptive thermal comfort temperatures, and the red lines are the higher and lower 80% acceptability limits.
The 80% acceptability limits will broaden the thermal comfort zone, for example in January between 22.7 °C to 29.7 °C in summer and 19.6 °C to 26.6 °C in winter. These broader zones will potentially maintain significant amount of imposed, operational energy when incorporated into building assessment tools. However, some of the occupants may be slightly uncomfortable with the new temperature ranges; however, this can easily be overcome with extra actions to restore their thermal comfort (e.g., summer ventilation, shades, fans, physical activities, and suitable clothes for winter).
For all of the modules, the temperatures fall below the thermal comfort ranges in May, August, September, October, and most of June and July, while in November and December, the temperatures remain within the comfortable range.
It can be seen that mechanical heating or cooling would be required mainly for the winter months. The total number of hours during which the internal air temperatures fell outside the occupants’ comfort range were calculated for each module using the 80% acceptability limits for the adaptive thermal comfort model (these were 2623 h, 2499 h, 2199 h, and 1921 h per year for the cavity brick, insulated brick veneer, insulated reverse brick veneer, and insulated cavity brick modules, respectively). The results for the entire year are shown in Figure 11.
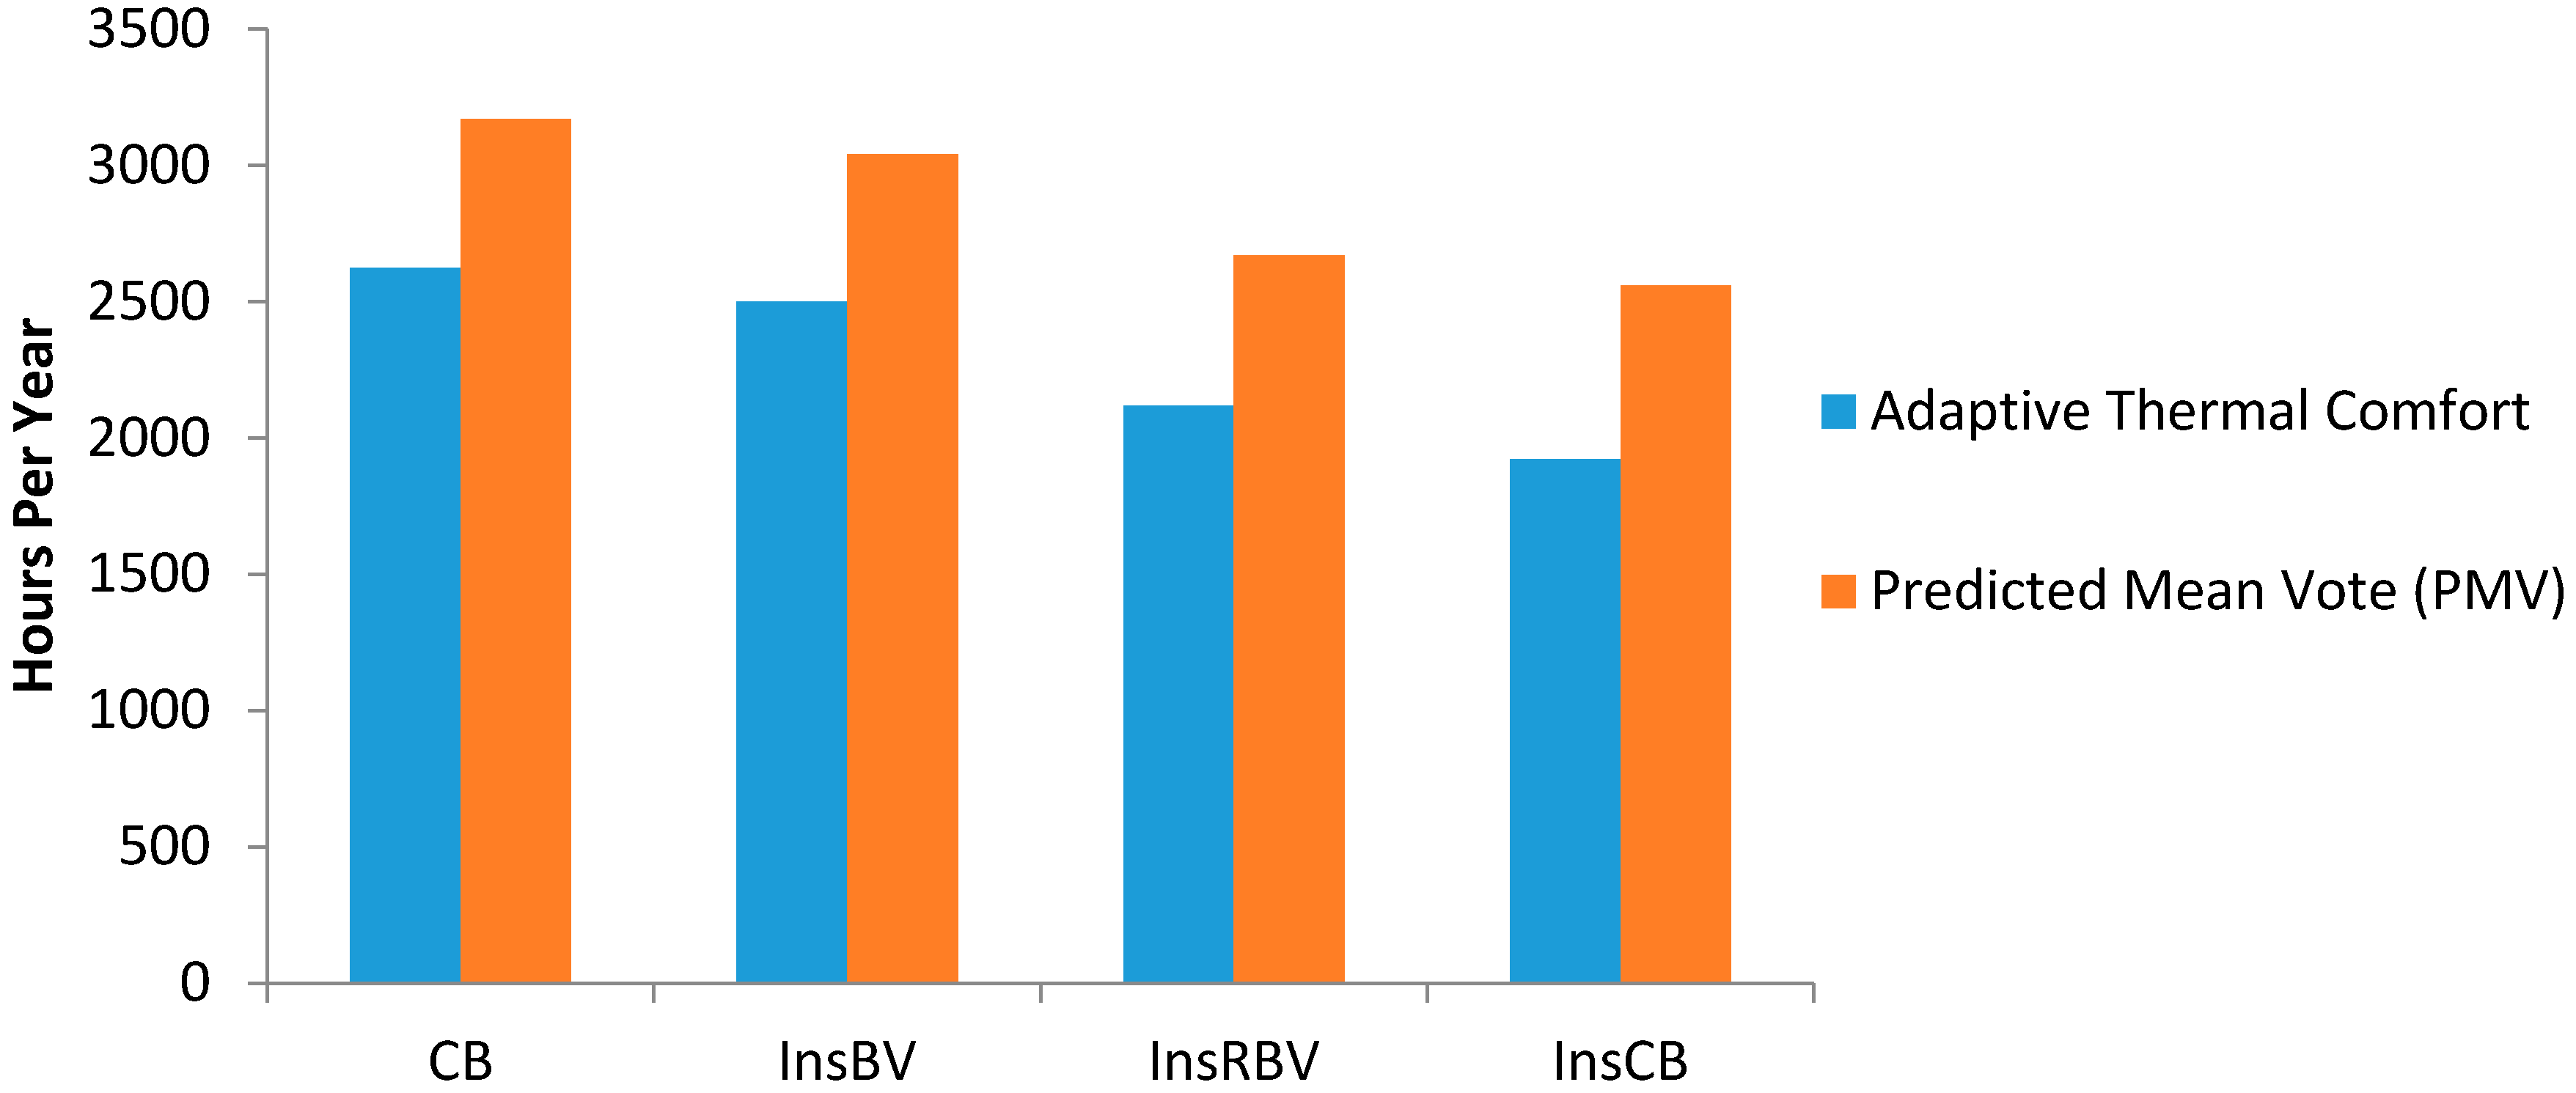
Utilizing the wider ranges of the adaptive thermal comfort model have reduced the predicted cooling and cooling loads compared with the PMV by 21%, 18%, 21%, and 25% for cavity brick, insulated brick veneer, insulated reverse brick veneer, and insulated cavity brick modules respectively, as shown in Figure 12.
Figure 12 indicates that there is a substantial potential saving of energy with the use of the adaptive thermal comfort approach. This can be applied to real-life situations to promote low-energy solutions to sustain thermal comfort by changing occupant behaviors with strategies such as the use of appropriate seasonal clothing, low-energy fans, sun shades, opening windows/doors, or even drinking more water instead of using HVAC systems.
One way of reducing electrical power consumption is through the use of modern energy-efficiency techniques in order to reduce the cost of utilizing a kilowatt-hour unit. The other method focuses on energy conservation and utilizing energy only when there is a demand for it; since a lot of energy is “lost” when there is a lack of energy conservation, this can be achieved by using the adaptive techniques. Various optimizing power management policies were studied and optimized [54].
An important part of any building energy assessment program is the use of an appropriate internal thermal comfort model; this is used to estimate heating and cooling energy requirements to ensure that an acceptable level of thermal comfort for the occupants is achieved with the least amount of energy. The accuracy of the thermal comfort prediction is considered to be a significant when designing any building, since it is economical and reduces energy consumption to a level of around 20%.
The main issue of applying an adaptive approach is the limitations of the adaptive thermal equation for each country and for each climate zone inside each country, which required more research to determine the comfortable temperature range for each climate zone. Also, the adaptive approach required occupants to perform small actions to maintain their thermal comfort, and failing to do so will result in thermally uncomfortable feeling. These results required further research to establish and facilitate the claim of the adaptive thermal comfort as a replacement thermal assessment model.
4. Conclusions
The accuracy of the simulation of the building’s thermal performance is known to have a significant impact on energy costs, energy consumption, and greenhouse gas emissions. Consequently, to overcome these issues, an appropriate thermal comfort model is needed to determine and measure the accurate and precise value of thermal performance.
The designing of energy-efficient buildings involves the use of thermal comfort models (such as the predicted mean vote or adaptive thermal comfort approaches). These models are used to determine the energy consumption (heating and cooling loads) of the building to reach an appropriate level of thermal comfort for the occupants. The use of an appropriate thermal comfort model will provide building designers with more reliable evidence on thermal building performance, when calculating the heating/cooling loads and selecting the most suitable HVAC system (heating, ventilation, and air conditioning).
The performance analysis of the four Newcastle (Australia) housing test modules was conducted by the use of the “free-floating” mode. The adaptive thermal comfort model was used to determine the cooling and heating time period, which were shown to be almost half of the values obtained by using the PMV model (21%, 18%, 21%, and 25% for the cavity brick, insulated brick veneer, insulated reverse brick veneer, and insulated cavity brick modules, respectively), since the adaptive model offers broader thermal comfort zones, ranging from 22.7 °C to 29.7 °C in summer and 19.6 °C to 26.6 °C in winter. These broader zones have the tendency to improve the energy efficiency of the building. Although slight discomfort may be experienced by the buildings’ occupants, due to new wider ranges of temperatures that could be outside the thermal comfort for some occupants, this can be overcome by using low-energy solutions (such as the choice of suitable clothing, the use of shades, ventilation, and/or fans, more physical activities in winter, and drinking more water), instead of reverting to the use of mechanical heating or cooling devices.
The final results showed that the use of the appropriate thermal comfort model to predict building’s energy consumption decreases the time that is essential for cooling or heating by almost 20% when compared with the PMV model through lengthening the non-heating and cooling period.
Author Contributions
Conceptualization, A.A. and D.A.; methodology, A.A. and D.A.; validation, A.A. and D.A.; formal analysis, A.A.; investigation, A.A. and D.A.; resources, A.A. and D.A.; data curation, A.A. and D.A.; writing; A.A. and preparation; A.A., D.A., A.P. and B.M.; writing—review and editing, A.A., D.A., A.P. and B.M.; visualization, A.A., D.A., A.P. and B.M.; supervision, A.A., D.A., A.P. and B.M.; project administration, A.A., D.A., A.P. and B.M.; funding acquisition, A.A., D.A., A.P. and B.M.
Funding
This research received no external funding.
Conflicts of Interest
The authors declare no conflicts of interest.
References
- Office of Energy Efficiency & Renewable Energy (EERE). Buildings Energy Data Book; US Department of Energy: Washington, DC, USA, 2009.
- Maleviti, E.; Wehrmeyer, W.; Mulugetta, Y. An Empirical Assessment to Express the Variability of Buildings’ Energy Consumption. Int. J. Energy Optim. Eng. 2013, 2, 55–67. [Google Scholar] [CrossRef]
- Yao, R.; Costanzo, V.; Li, X.; Zhang, Q.; Li, B. The effect of passive measures on thermal comfort and energy conservation. A case study of the hot summer and cold winter climate in the Yangtze River region. J. Build. Eng. 2018, 15, 298–310. [Google Scholar] [CrossRef]
- Ferreira, P.M.; Ruano, A.E.; Silva, S.; Conceicao, E.Z.E. Neural networks based predictive control for thermal comfort and energy savings in public buildings. Energy Build. 2012, 55, 238–251. [Google Scholar] [CrossRef] [Green Version]
- Yun, G.Y. Influences of perceived control on thermal comfort and energy use in buildings. Energy Build. 2018, 158, 822–830. [Google Scholar] [CrossRef]
- d’Ambrosio Alfano, F.R.; Olesen, B.W.; Palella, B.I.; Riccio, G. Thermal comfort: Design and Assessment of Energy Saving. Energy Build. 2014, 81, 326–336. [Google Scholar] [CrossRef]
- Yang, W.; Moon, H.J. Cross-modal effects of noise and thermal conditions on indoor environmental perception and speech recognition. Appl. Acoust. 2018, 141, 1–8. [Google Scholar] [CrossRef]
- De Dear, R.; Brager, G.S. Developing an Adaptive Model of Thermal Comfort and Preference; American Society of Heating, Refrigerating and Air-Conditioning Engineers: New York, NY, USA, 1998; Volume 104. [Google Scholar]
- Parsons, K. Human Thermal Environments: The effects of Hot, Moderate, and Cold Environments on Human Health, Comfort, and Performance; CRC Press: Boca Raton, FL, USA, 2014. [Google Scholar]
- ASHRAE Handbook. Fundamentals; American society of Heating, Refrigerating and Air-Conditioning Engineers: Atlanta, GA, USA, 2009; Available online: http://shop.iccsafe.org/media/wysiwyg/material/8950P217-toc.pdf (accessed on 9 October 2017).
- Directive (EU) 2018/844 of the European Parliament and of the Council of 30 May 2018 Amending Directive 2010/31/EU on the Energy Performance of Buildings and Directive 2012/27/EU on Energy Efficiency. Available online: https://eur-lex.europa.eu/legal-content/EN/TXT/?uri=uriserv:OJ.L_.2018.156.01.0075.01.ENG&toc=OJ:L:2018:156:FULL (accessed on 29 September 2018).
- Directive 2012/27/EU of the European Parliament and of the Council of 25 October 2012 on Energy Efficiency, Amending Directives 2009/125/EC and 2010/30/EU and Repealing Directives 2004/8/EC and 2006/32/EC. Available online: https://ec.europa.eu/energy/en/topics/energy-efficiency/buildings (accessed on 30 September 2018).
- EN 15251: 2007 Indoor Environmental Input Parameters for Design and Assessment of Energy Performance of Buildings Addressing Indoor Air Quality, Thermal Environment, Lighting and Acoustics.
- Olesen, B.W. Revision of EN 15251: Indoor environmental criteria. REHVA J. 2012, 49, 6–12. [Google Scholar]
- Moore, T.; Ridley, I.; Strengers, Y.; Maller, C.; Horne, R. Dwelling performance and adaptive summer comfort in low-income Australian households. Build. Res. Inf. 2016, 45, 443–456. [Google Scholar] [CrossRef]
- Jorissen, F.; Himpe, E.; Picard, D.; Buso, T.; Laverge, J.; Boydens, W.; Helsen, L. hybridGEOTABS project-MPC for controlling the power of the ground by integration. REHVA Eur. HVAC J. 2018, 55, 58–64. [Google Scholar]
- Zuhaib, S.; Manton, R.; Griffin, C.; Goggins, J. An Indoor Environmental Quality (IEQ) assessment of a partially-retrofitted university building. Build. Environ. 2018, 139, 49–85. [Google Scholar] [CrossRef]
- Ricciardi, P.; Buratti, C. Environmental quality of university classrooms: Subjective and objective evaluation of the thermal, acoustic, and lighting comfort conditions. Build. Environ. 2018, 127, 23–36. [Google Scholar] [CrossRef]
- ISO. ISO 17772-1—Energy performance of Buildings—Indoor Environmental Quality—Part 1: Indoor Environmental Input Parameters for the Design and Assessment of Energy Performance of Buildings. 2017. Available online: https://www.iso.org/standard/60498.html (accessed on 30 September 2018).
- International Standardization Organization. ISO 7730. Ergonomics of the Thermal Environment—Analytical Determination and Interpretation of Thermal Comfort Using Calculation of the PMV and PPD Indices and Local Thermal Comfort; International Standardization Organization: Geneva, Switzerland, 2005. [Google Scholar]
- Van Hoof, J. Forty years of Fanger’s model of thermal comfort: Comfort for all? Indoor Air 2008, 18, 182–201. [Google Scholar] [CrossRef] [PubMed]
- Nicol, J.F.; Humphreys, M.A. Adaptive thermal comfort and sustainable thermal standards for buildings. Energy Build. 2002, 34, 563–572. [Google Scholar] [CrossRef]
- Wu, T.; Cao, B.; Zhu, Y. A field study on thermal comfort and air-conditioning energy use in an office building in Guangzhou. Energy Build. 2018, 168, 428–437. [Google Scholar] [CrossRef]
- Mora, R.; Bean, R. Thermal Comfort: Designing for People. ASHRAE J. 2018, 60, 40–46. [Google Scholar]
- ASHRAE. Thermal environmental conditions for human occupancy. In ANSI/ASHRAE Standard 55; American Society of Heating, Refrigerating and Air Conditioning Engineers: Atlanta, GA, USA, 2017. [Google Scholar]
- ASHRAE. Guideline 10-2016—Interactions Affecting the Achievement of Acceptable Indoor Environments; American Society of Heating, Refrigerating and Air Conditioning: Atlanta, GA, USA, 2016. [Google Scholar]
- d’Ambrosio Alfano, F.R.; Olesen, B.W.; Palella, B.I.; Riccio, G. Povl Ole Fanger’s impact ten years later. Energy Build. 2017, 152, 243–249. [Google Scholar] [CrossRef]
- Soebarto, V.; Bennetts, H. Thermal comfort and occupant responses during summer in a low to middle income housing development in South Australia. Build. Environ. 2014, 75, 19–29. [Google Scholar] [CrossRef]
- De Dear, R.J.; Brager, G.S.; Reardon, J.; Nicol, F. Developing an adaptive model of thermal comfort and preference/discussion. ASHRAE Trans. 1998, 104, 145. [Google Scholar]
- Nicol, F.; Humphreys, M. Derivation of the adaptive equations for thermal comfort in free-running buildings in European standard EN15251. Build. Environ. 2010, 45, 11–17. [Google Scholar] [CrossRef]
- Ren, Z.; Chen, D. Modelling study of the impact of thermal comfort criteria on housing energy use in Australia. Appl. Energy 2018, 210, 152–166. [Google Scholar] [CrossRef]
- Hwang, R.L.; Lin, T.P.; Kuo, N.J. Field experiments on thermal comfort in campus classrooms in Taiwan. Energy Build. 2006, 38, 53–62. [Google Scholar] [CrossRef]
- Fanger, P.O. The effect of air humidity in buildings on man’s comfort and health. In Proceedings of the CISCO-ITBTP Seminar Humidity in Building, Saint Remy les Chevreuse, France, November 1982. [Google Scholar]
- Fanger, P.O. Air humidity, comfort and health. In Proceedings of the IIR Commission E1, Paris, France, 1983; pp. 192–195. [Google Scholar]
- Fanger, P.O.; Toftum, J. Extension of the PMV model to non-air-conditioned buildings in warm climates. Energy Build. 2002, 34, 533–536. [Google Scholar] [CrossRef]
- Moujalled, B.; Cantin, R.; Guarracino, G. Comparison of thermal comfort algorithms in naturally ventilated office buildings. Energy Build. 2008, 40, 2215–2223. [Google Scholar] [CrossRef]
- Holopainen, R.; Tuomaala, P.; Hernandez, P.; Häkkinen, T.; Piira, K.; Piippo, J. Comfort assessment in the context of sustainable buildings: Comparison of simplified and detailed human thermal sensation methods. Build. Environ. 2014, 71, 60–70. [Google Scholar] [CrossRef]
- Ji, W.; Cao, B.; Luo, M.; Zhu, Y. Influence of short-term thermal experience on thermal comfort evaluations: A climate chamber experiment. Build. Environ. 2017, 114, 246–256. [Google Scholar] [CrossRef]
- Castaño-Rosa, R.; Rodríguez-Jiménez, C.; Rubio-Bellido, C. Adaptive Thermal Comfort Potential in Mediterranean Office Buildings: A Case Study of Torre Sevilla. Sustainability 2018, 10, 3091. [Google Scholar] [CrossRef]
- Human Thermal Comfort Sustainability Workshop. Available online: sustainabilityworkshop.autodesk.com/buildings/human-thermal-comfort#sthash.sQcMOvnS.dpuf (accessed on 27 September 2017).
- Bureau of Meteorology Australia, Newcastle University Weather Station for Humidity, Site Number: 061390. Available online: http://www.bom.gov.au/climate/averages/tables/cw_061390.shtml (accessed on 28 September 2017).
- CEAE, Engineering Center. Predicting Thermal Comfort. University of Colorado at Boulder. Civil, Environmental, and Architectural Engineering ECCE 246, 428 UCB. Available online: http://ceae.colorado.edu/~brandem/aren3050/docs/ThermalComfort.pdf (accessed on 28 September 2017).
- Albatayneh, A.; Alterman, D.; Page, A.W.; Moghtaderi, B. Warming issues associated with the long term simulation of housing using cfd analysis. J. Green Build. 2016, 11, 57–74. [Google Scholar] [CrossRef]
- Albatayneh, A.; Alterman, D.; Page, A.; Moghtaderi, B. The significance of time step size in simulating the thermal performance of buildings. Adv. Res. 2015, 5, 1–12. [Google Scholar] [CrossRef]
- Albatayneh, A.; Alterman, D.; Page, A.; Moghtaderi, B. Assessment of the Thermal Performance of Complete Buildings Using Adaptive Thermal Comfort. Procedia-Soc. Behav. Sci. 2016, 216, 655–661. [Google Scholar] [CrossRef]
- Albatayneh, A.; Alterman, D.; Page, A.; Moghtaderi, B. The Significance of Temperature Based Approach Over the Energy Based Approaches in the Buildings Thermal Assessment. Environ. Clim. Technol. 2017, 19, 39–50. [Google Scholar] [CrossRef] [Green Version]
- Albatayneh, A.; Alterman, D.; Page, A.; Moghtaderi, B. Thermal Assessment of Buildings Based on Occupants Behavior and the Adaptive Thermal Comfort Approach. Energy Procedia 2017, 115, 265–271. [Google Scholar] [CrossRef]
- Albatayneh, A.; Alterman, D.; Page, A.; Moghtaderi, B. Discrepancies in Peak Temperature Times using Prolonged CFD Simulations of Housing Thermal Performance. Energy Procedia 2017, 115, 253–264. [Google Scholar] [CrossRef]
- Albatayneh, A.; Alterman, D.; Page, A.; Moghtaderi, B. Temperature versus energy based approaches in the thermal assessment of buildings. Energy Procedia 2017, 128, 46–50. [Google Scholar] [CrossRef]
- d’Ambrosio Alfano, F.R.; Palella, B.I.; Riccio, G. The role of measurement accuracy on the thermal environment assessment by means of PMV index. Build. Environ. 2011, 46, 1361–1369. [Google Scholar] [CrossRef]
- Walikewitz, N.; Jänicke, B.; Langner, M.; Meier, F.; Endlicher, W. The difference between the mean radiant temperature and the air temperature within indoor environments: A case study during summer conditions. Build. Environ. 2015, 84, 151–161. [Google Scholar] [CrossRef]
- Tyler, H.; Stefano, S.; Alberto, P.; Dustin, M.; Kyle, S. CBE Thermal Comfort Tool. Center for the Built Environment, University of California Berkeley. 2013. Available online: http://cbe.berkeley.edu/comforttool (accessed on 28 September 2017).
- d’Ambrosio Alfano, F.R.; Palella, B.I.; Riccio, G. Notes on the calculation of the PMV index by means of apps. Energy Procedia 2016, 101, 249–256. [Google Scholar] [CrossRef]
- Pieroni, A.; Iazeolla, G. Engineering QoS and Energy Saving in the Delivery of ICT Services. In Sustaining Power Resources through Energy Optimization and Engineering; IGI Global: Hershey, PA, USA, 2016; pp. 208–226. [Google Scholar]
Figure 1.
American Society of Heating, Refrigerating, and Air-Conditioning Engineers (ASHRAE) thermal sensation scale (−1 = slightly cool, −2 = cool, −3 = cold, 0 = neutral, +1 = slightly warm, +2 = warm, +3 = hot). Note: The acceptable thermal comfort range for predicted mean vote (PMV) from the ASHRAE 55-2010 is between −0.85 and +0.85 [10].
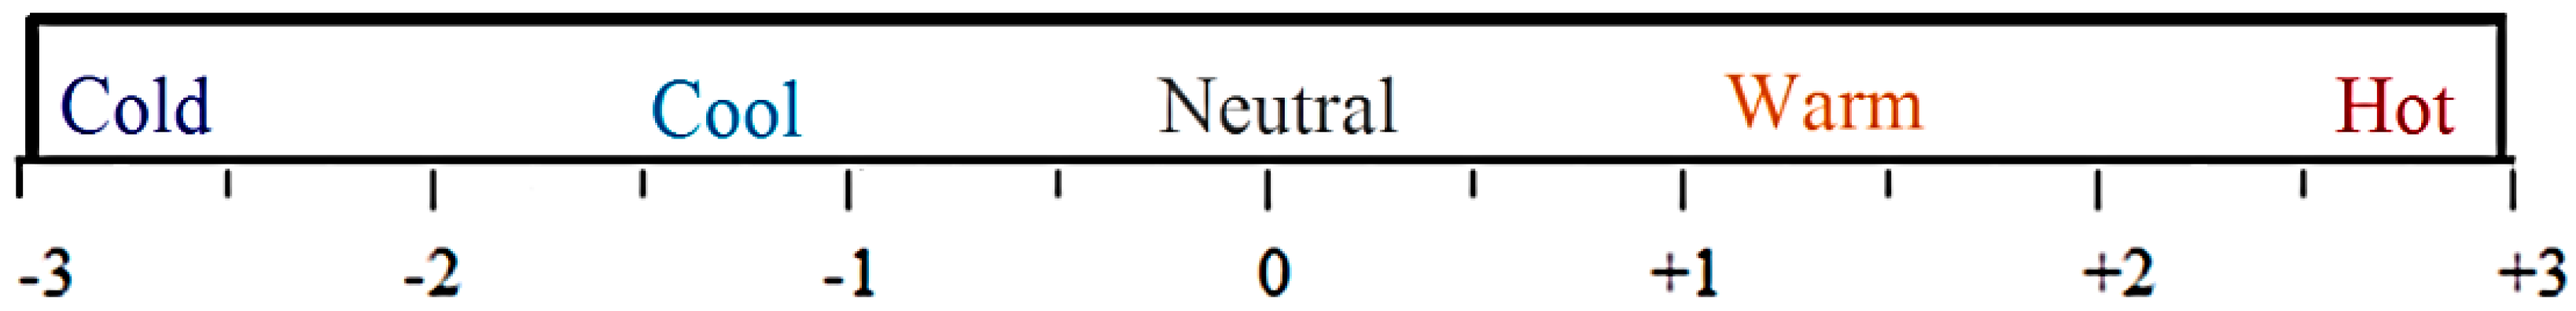
Figure 2.
The 90% and 80% acceptability limits for indoor operative temperature based on the prevailing mean outside temperature.
Figure 2.
The 90% and 80% acceptability limits for indoor operative temperature based on the prevailing mean outside temperature.

Figure 3.
(a) Full-scale test modules; (b) north and (c) south plans for all of the modules [17,18,19,20,21,22,23].
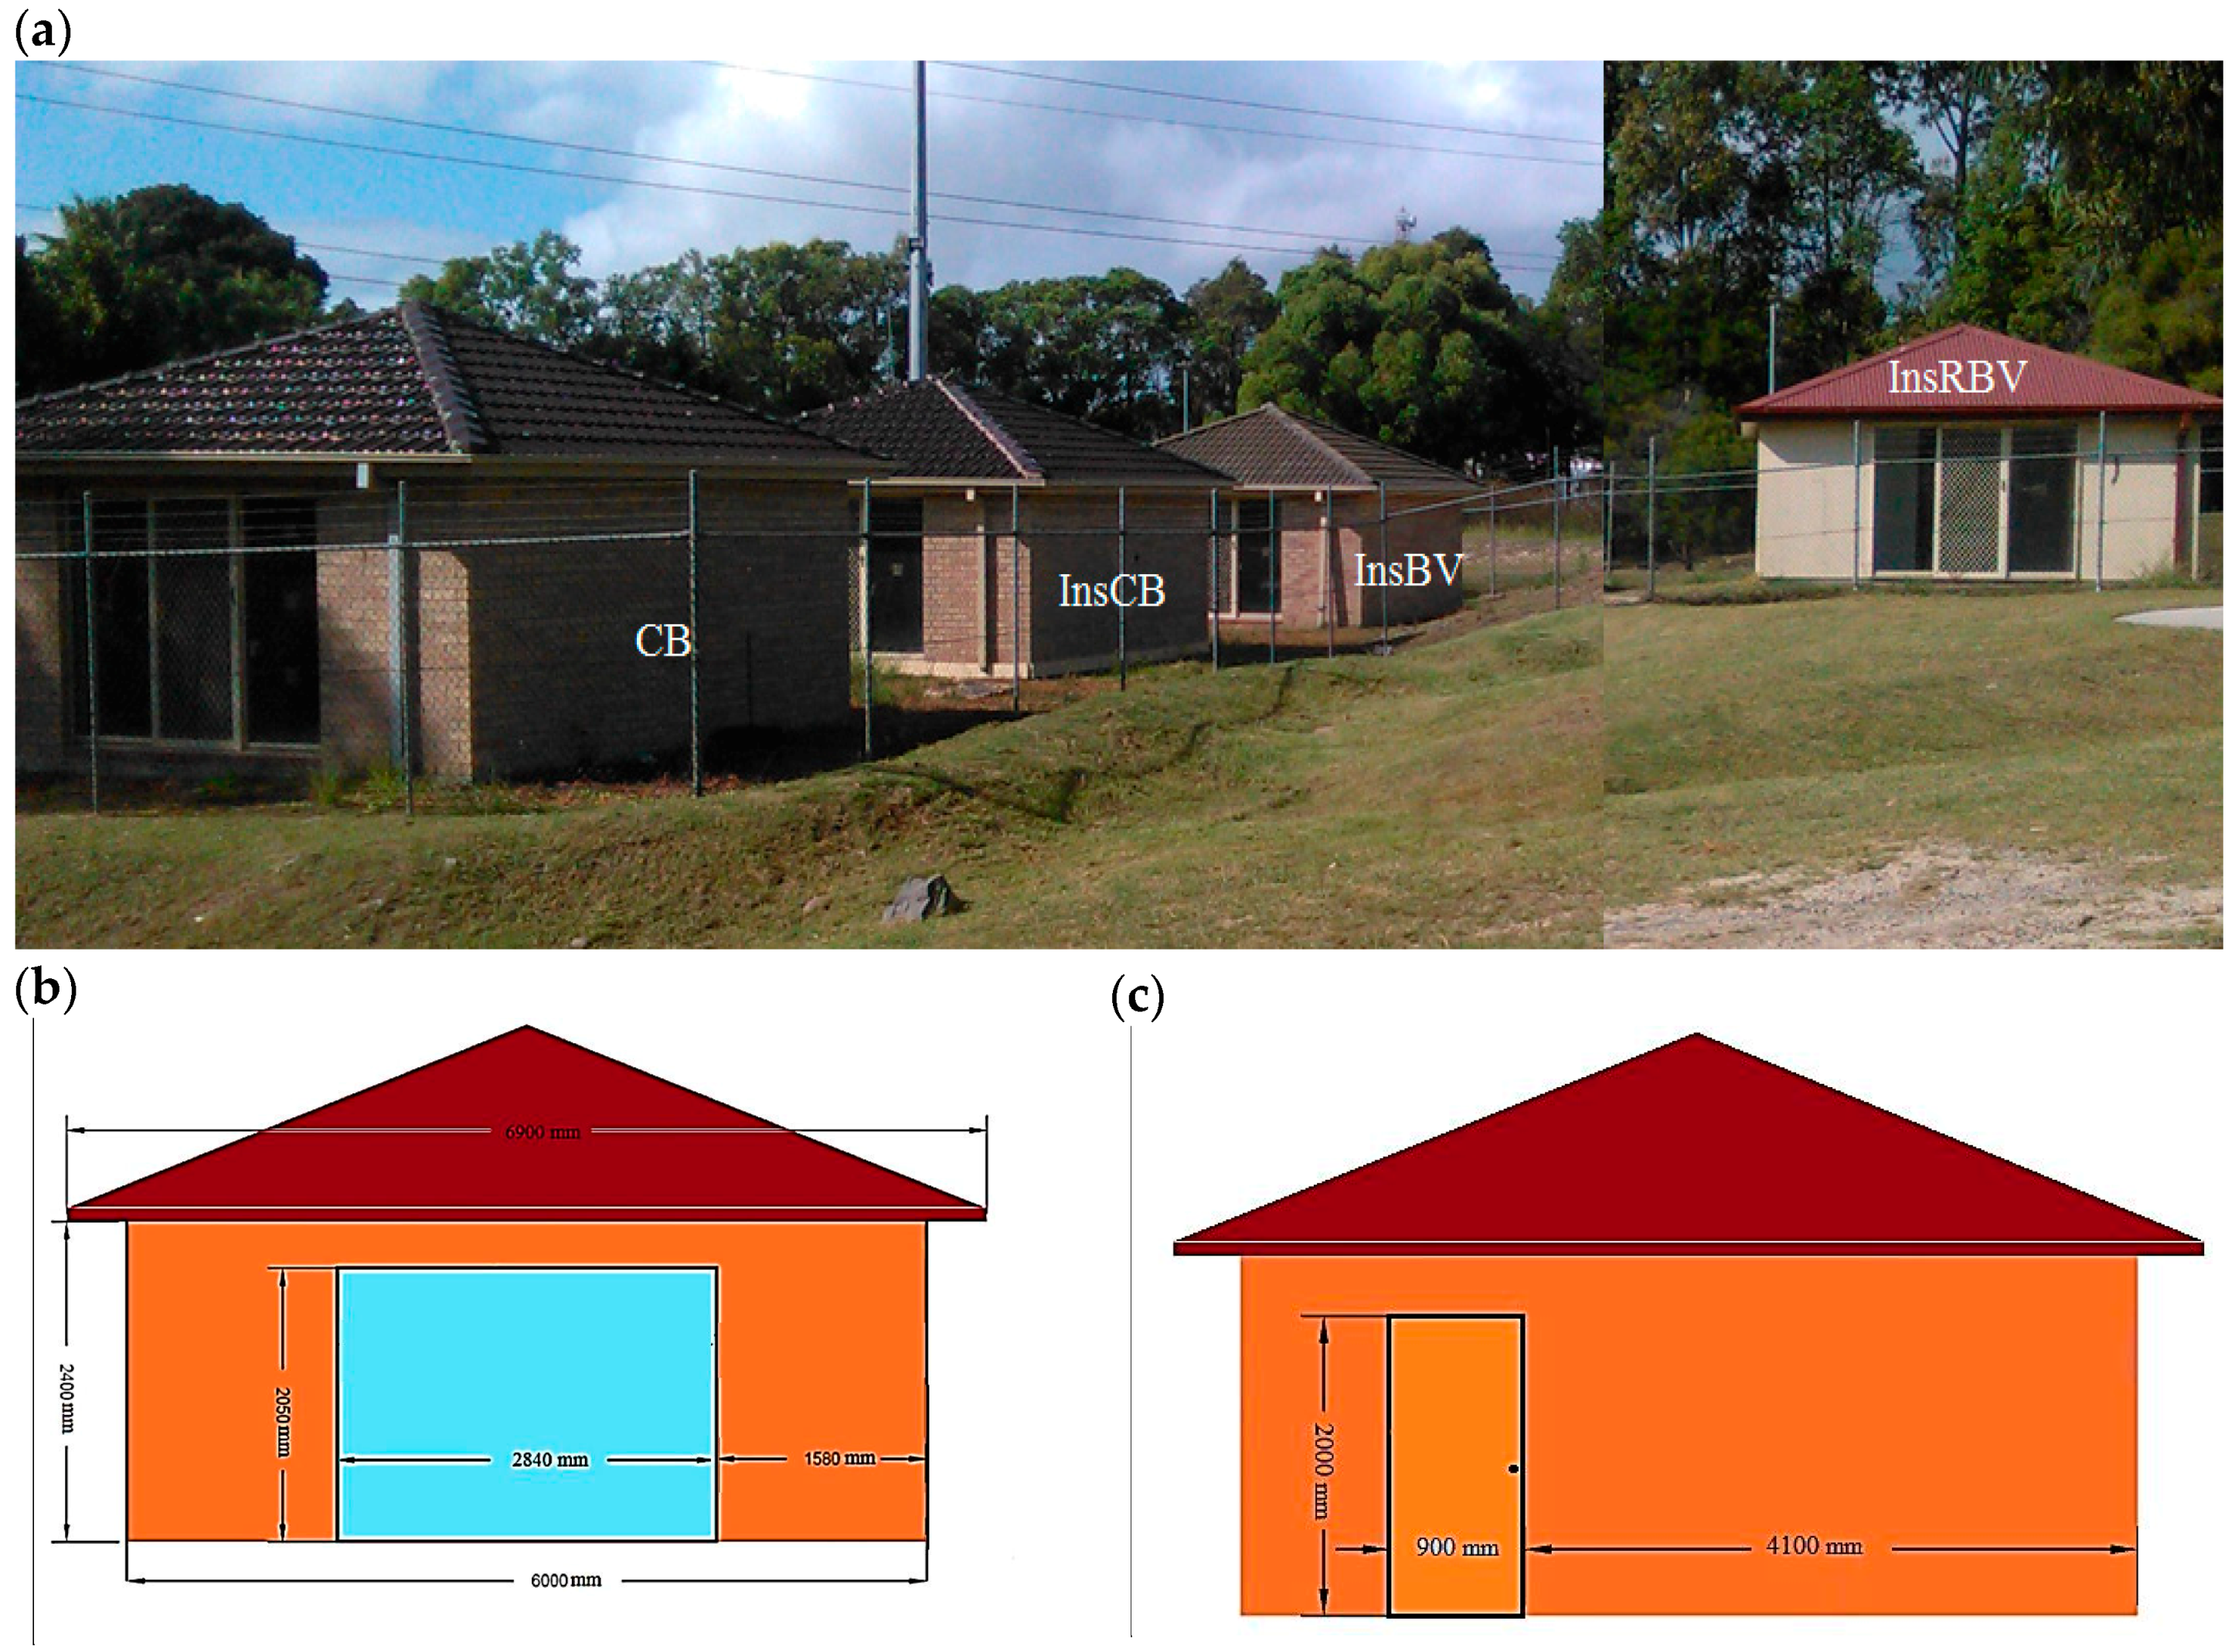
Figure 4.
Cavity brick module walling system.

Figure 5.
Insulated cavity brick module walling system.
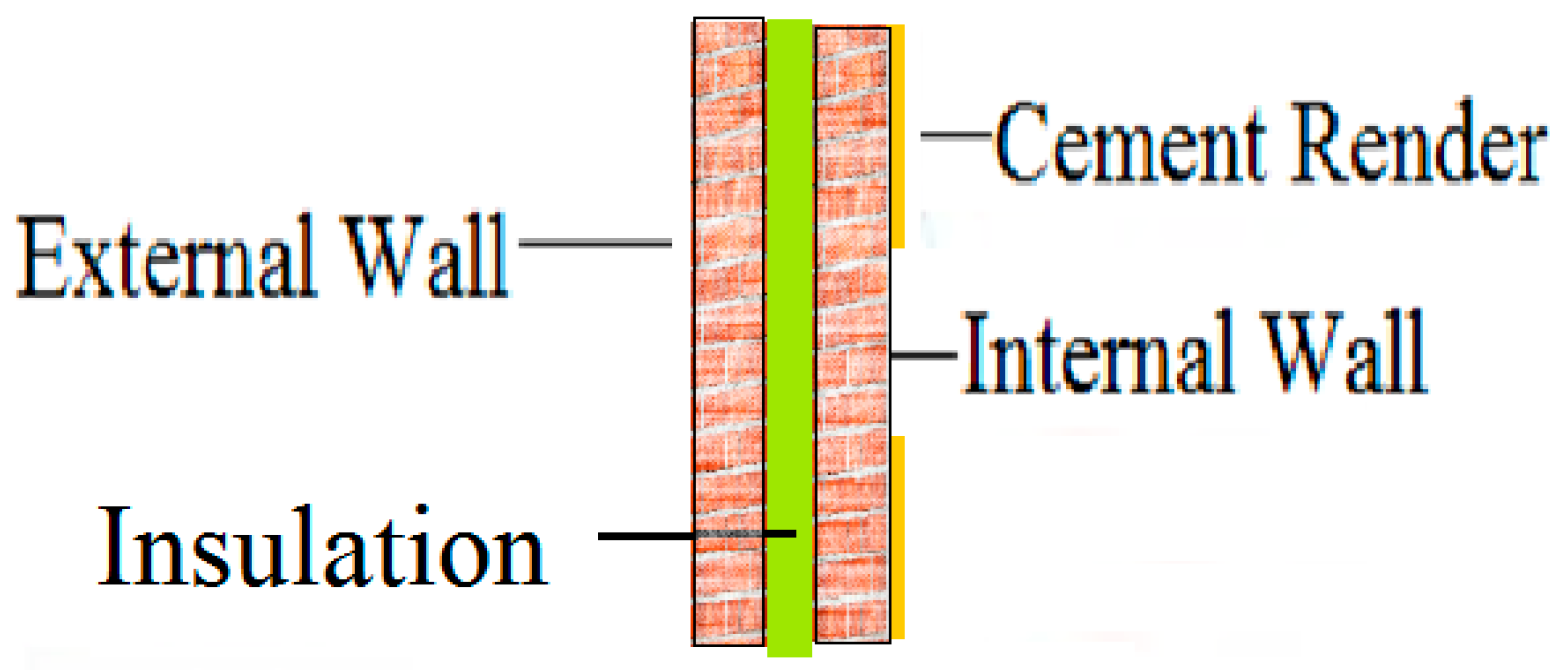
Figure 6.
Insulated brick veneer module walling system.

Figure 7.
Insulated reverse brick veneer module walling system.
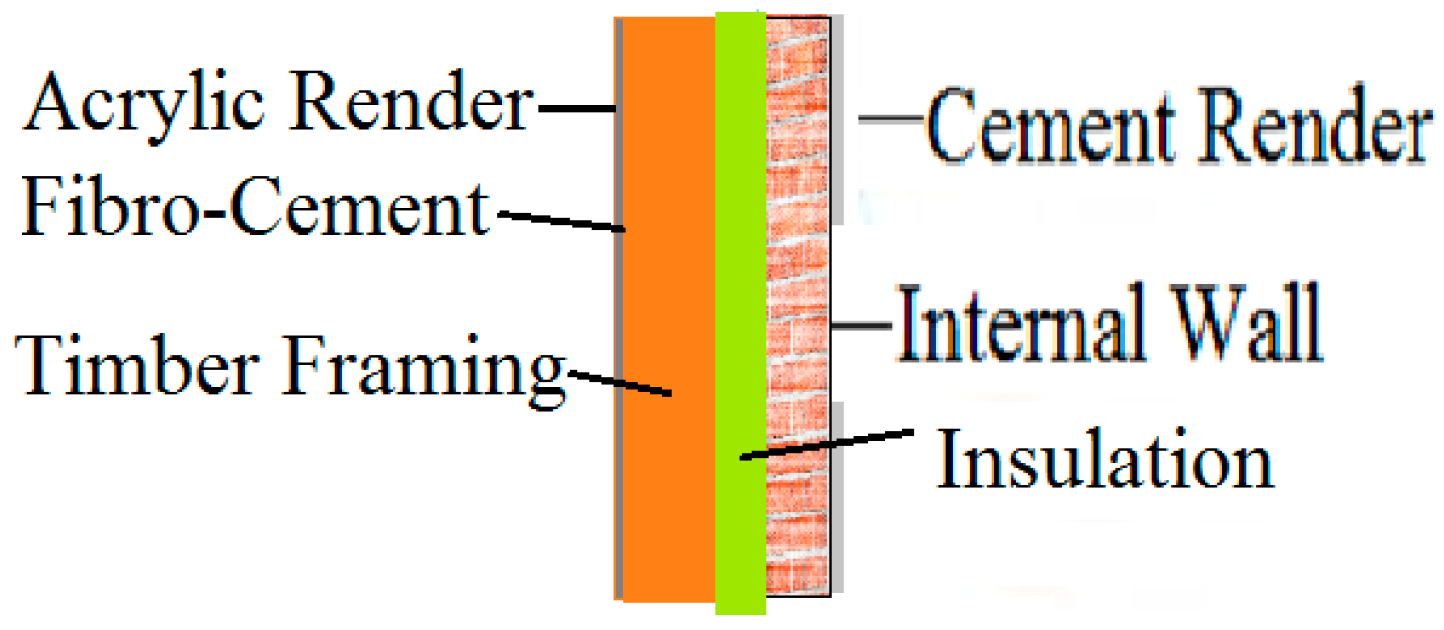
Figure 8.
Psychometric chart for average monthly temperature outside the thermal comfort zone for the cavity brick (CB) module. Note: the blue region indicates the comfort zone.
Figure 8.
Psychometric chart for average monthly temperature outside the thermal comfort zone for the cavity brick (CB) module. Note: the blue region indicates the comfort zone.
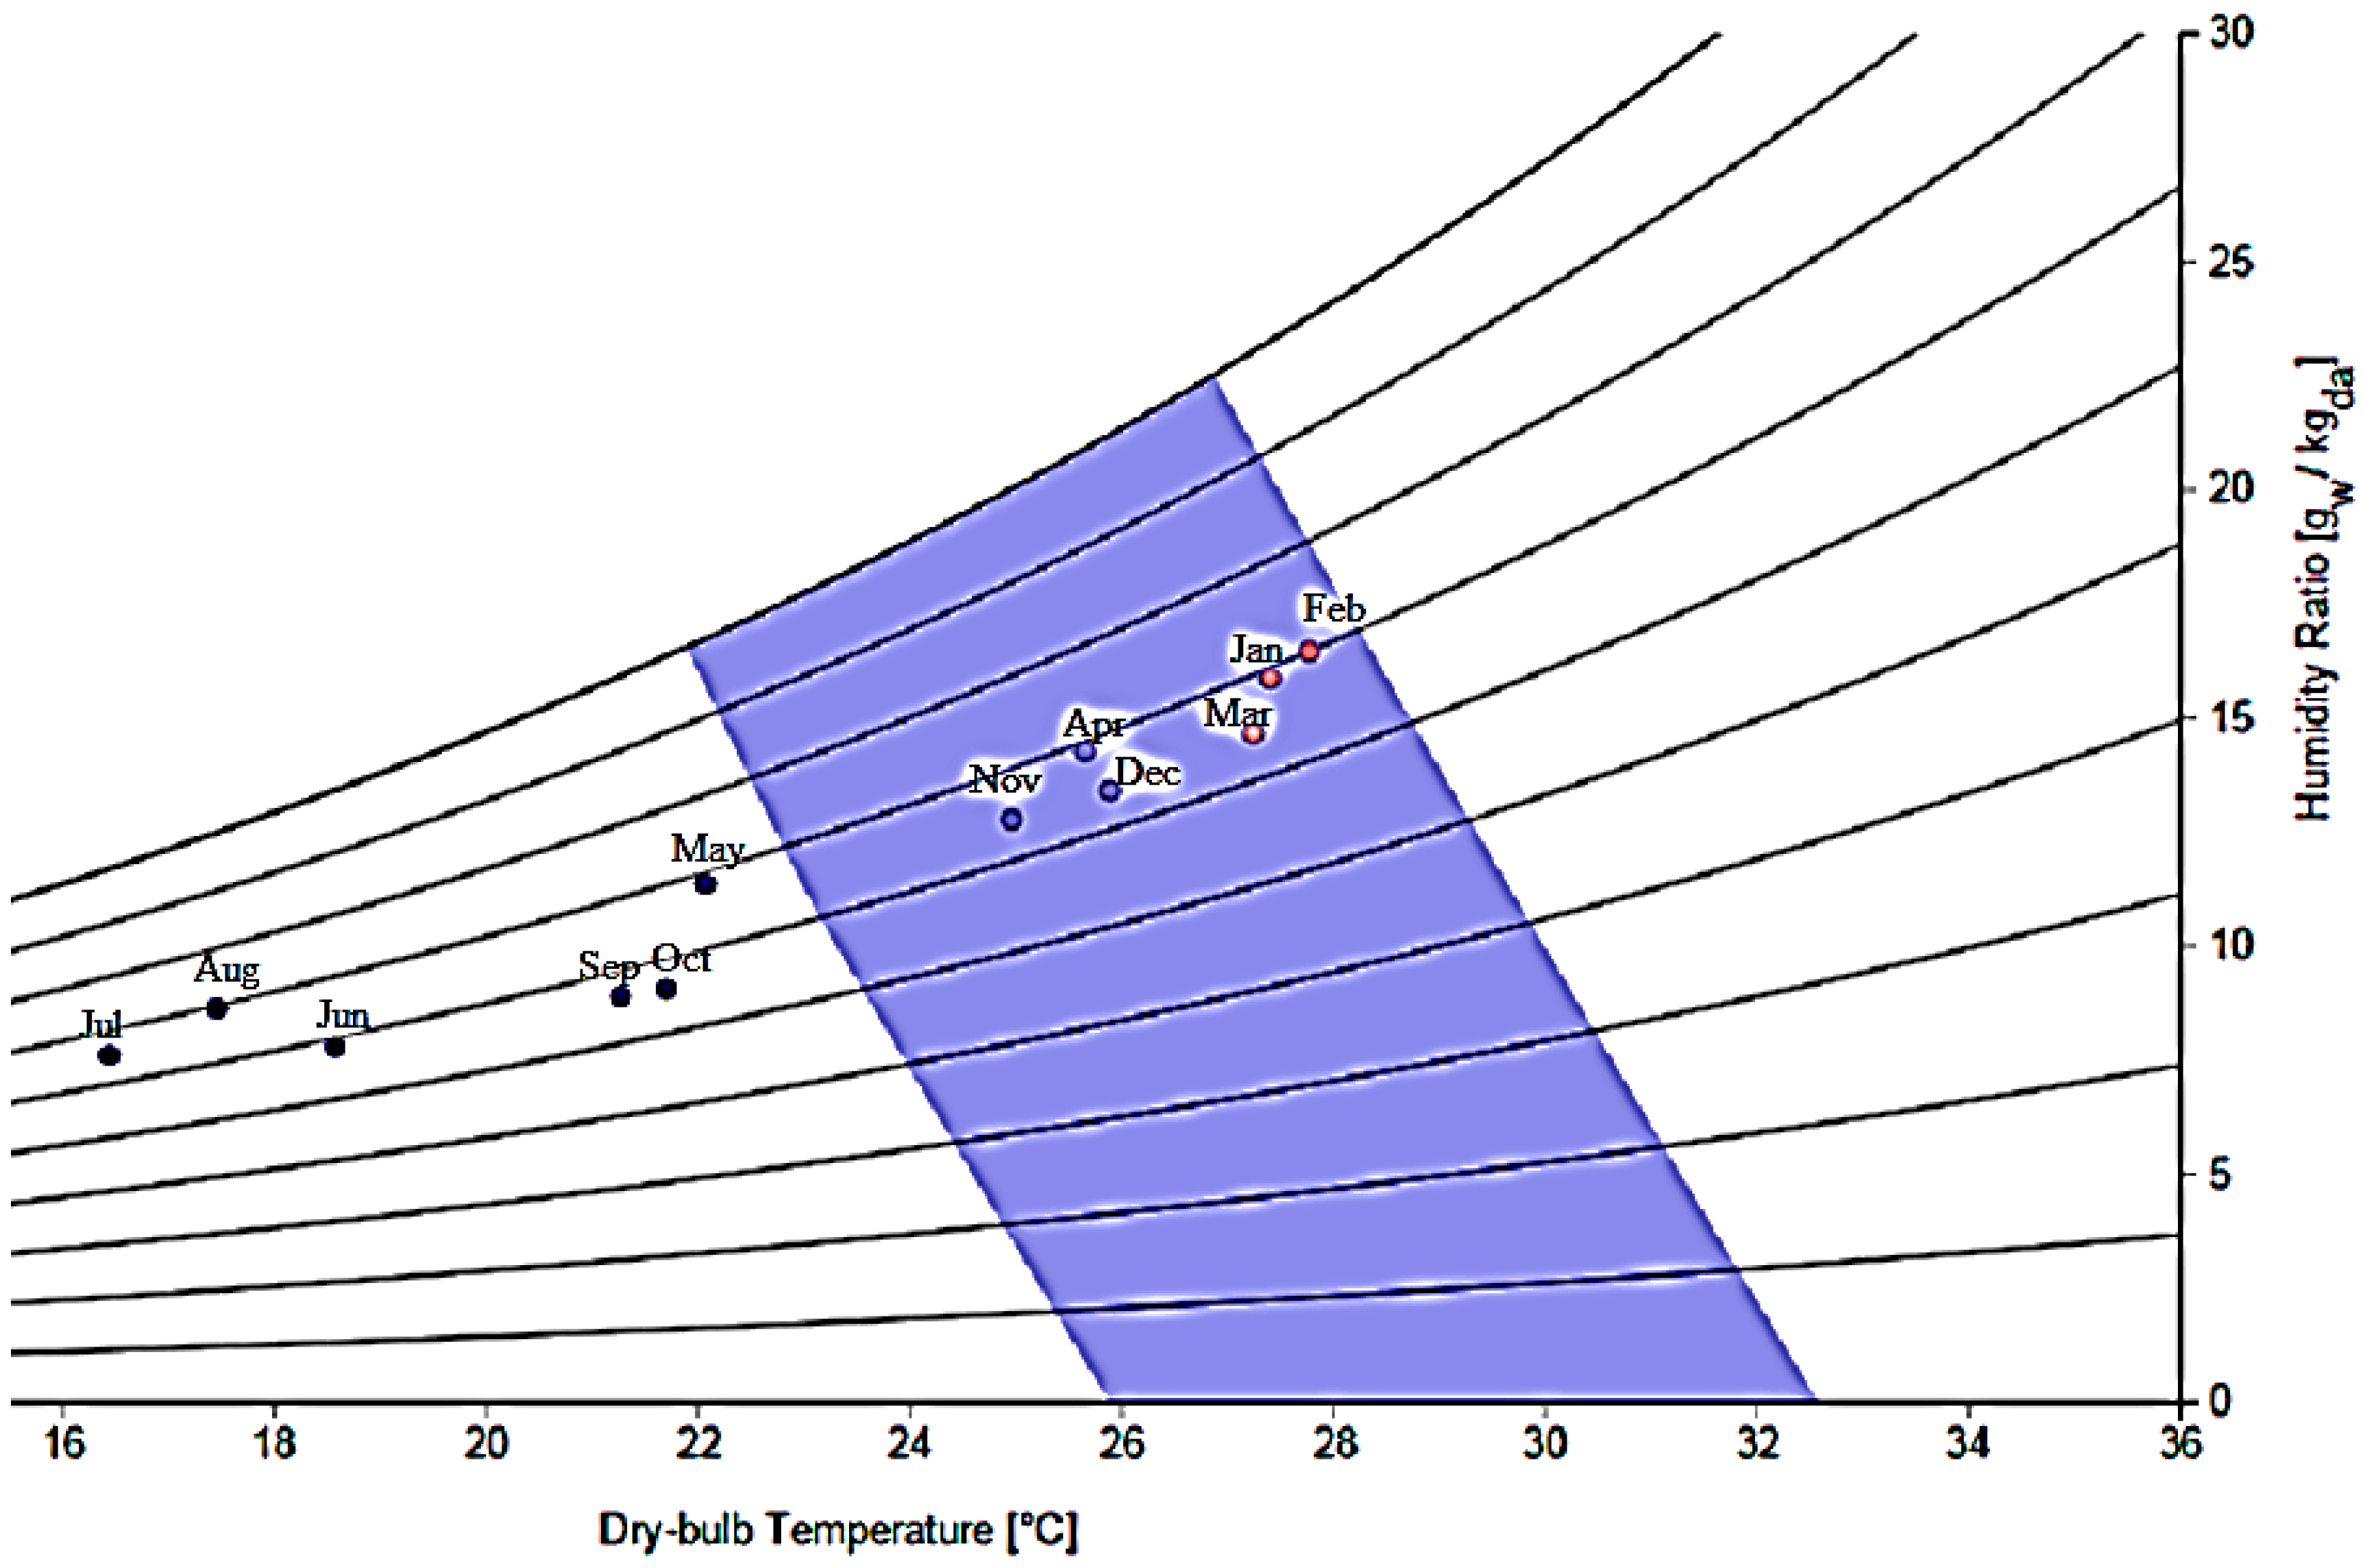
Figure 9.
Psychometric chart presents the hourly temperature for the CB module within the thermal comfort zone.
Figure 9.
Psychometric chart presents the hourly temperature for the CB module within the thermal comfort zone.

Figure 10.
Internal, external air temperatures and the adaptive thermal comfort ranges of the 80% acceptability limits for the CB module.
Figure 10.
Internal, external air temperatures and the adaptive thermal comfort ranges of the 80% acceptability limits for the CB module.
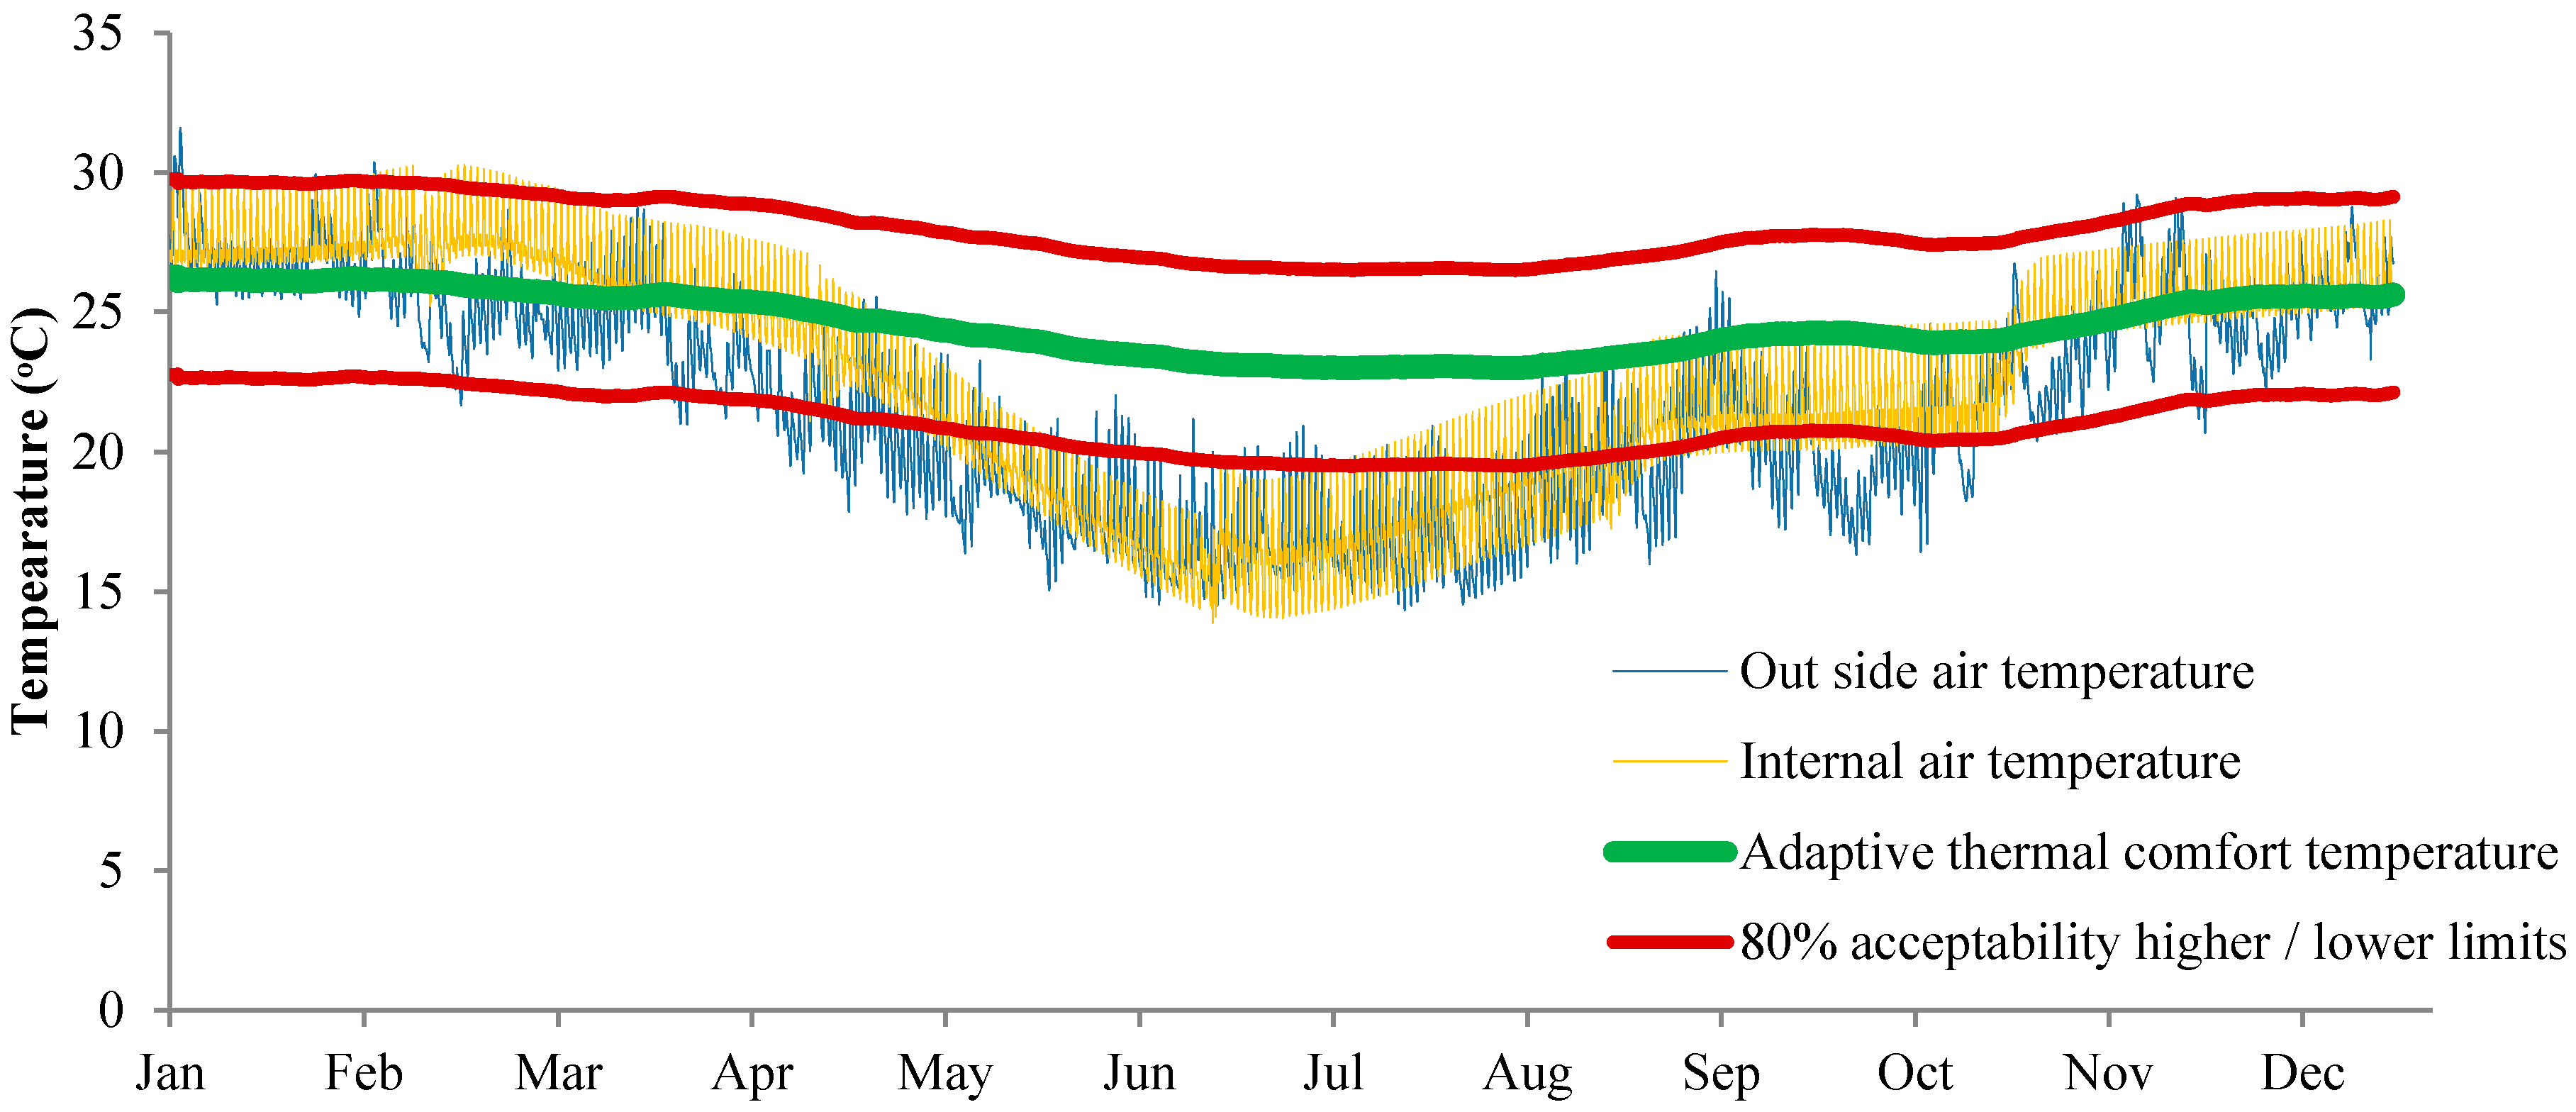
Figure 11.
Total numbers of hours where mechanical heating or cooling were required using adaptive thermal comfort.
Figure 11.
Total numbers of hours where mechanical heating or cooling were required using adaptive thermal comfort.
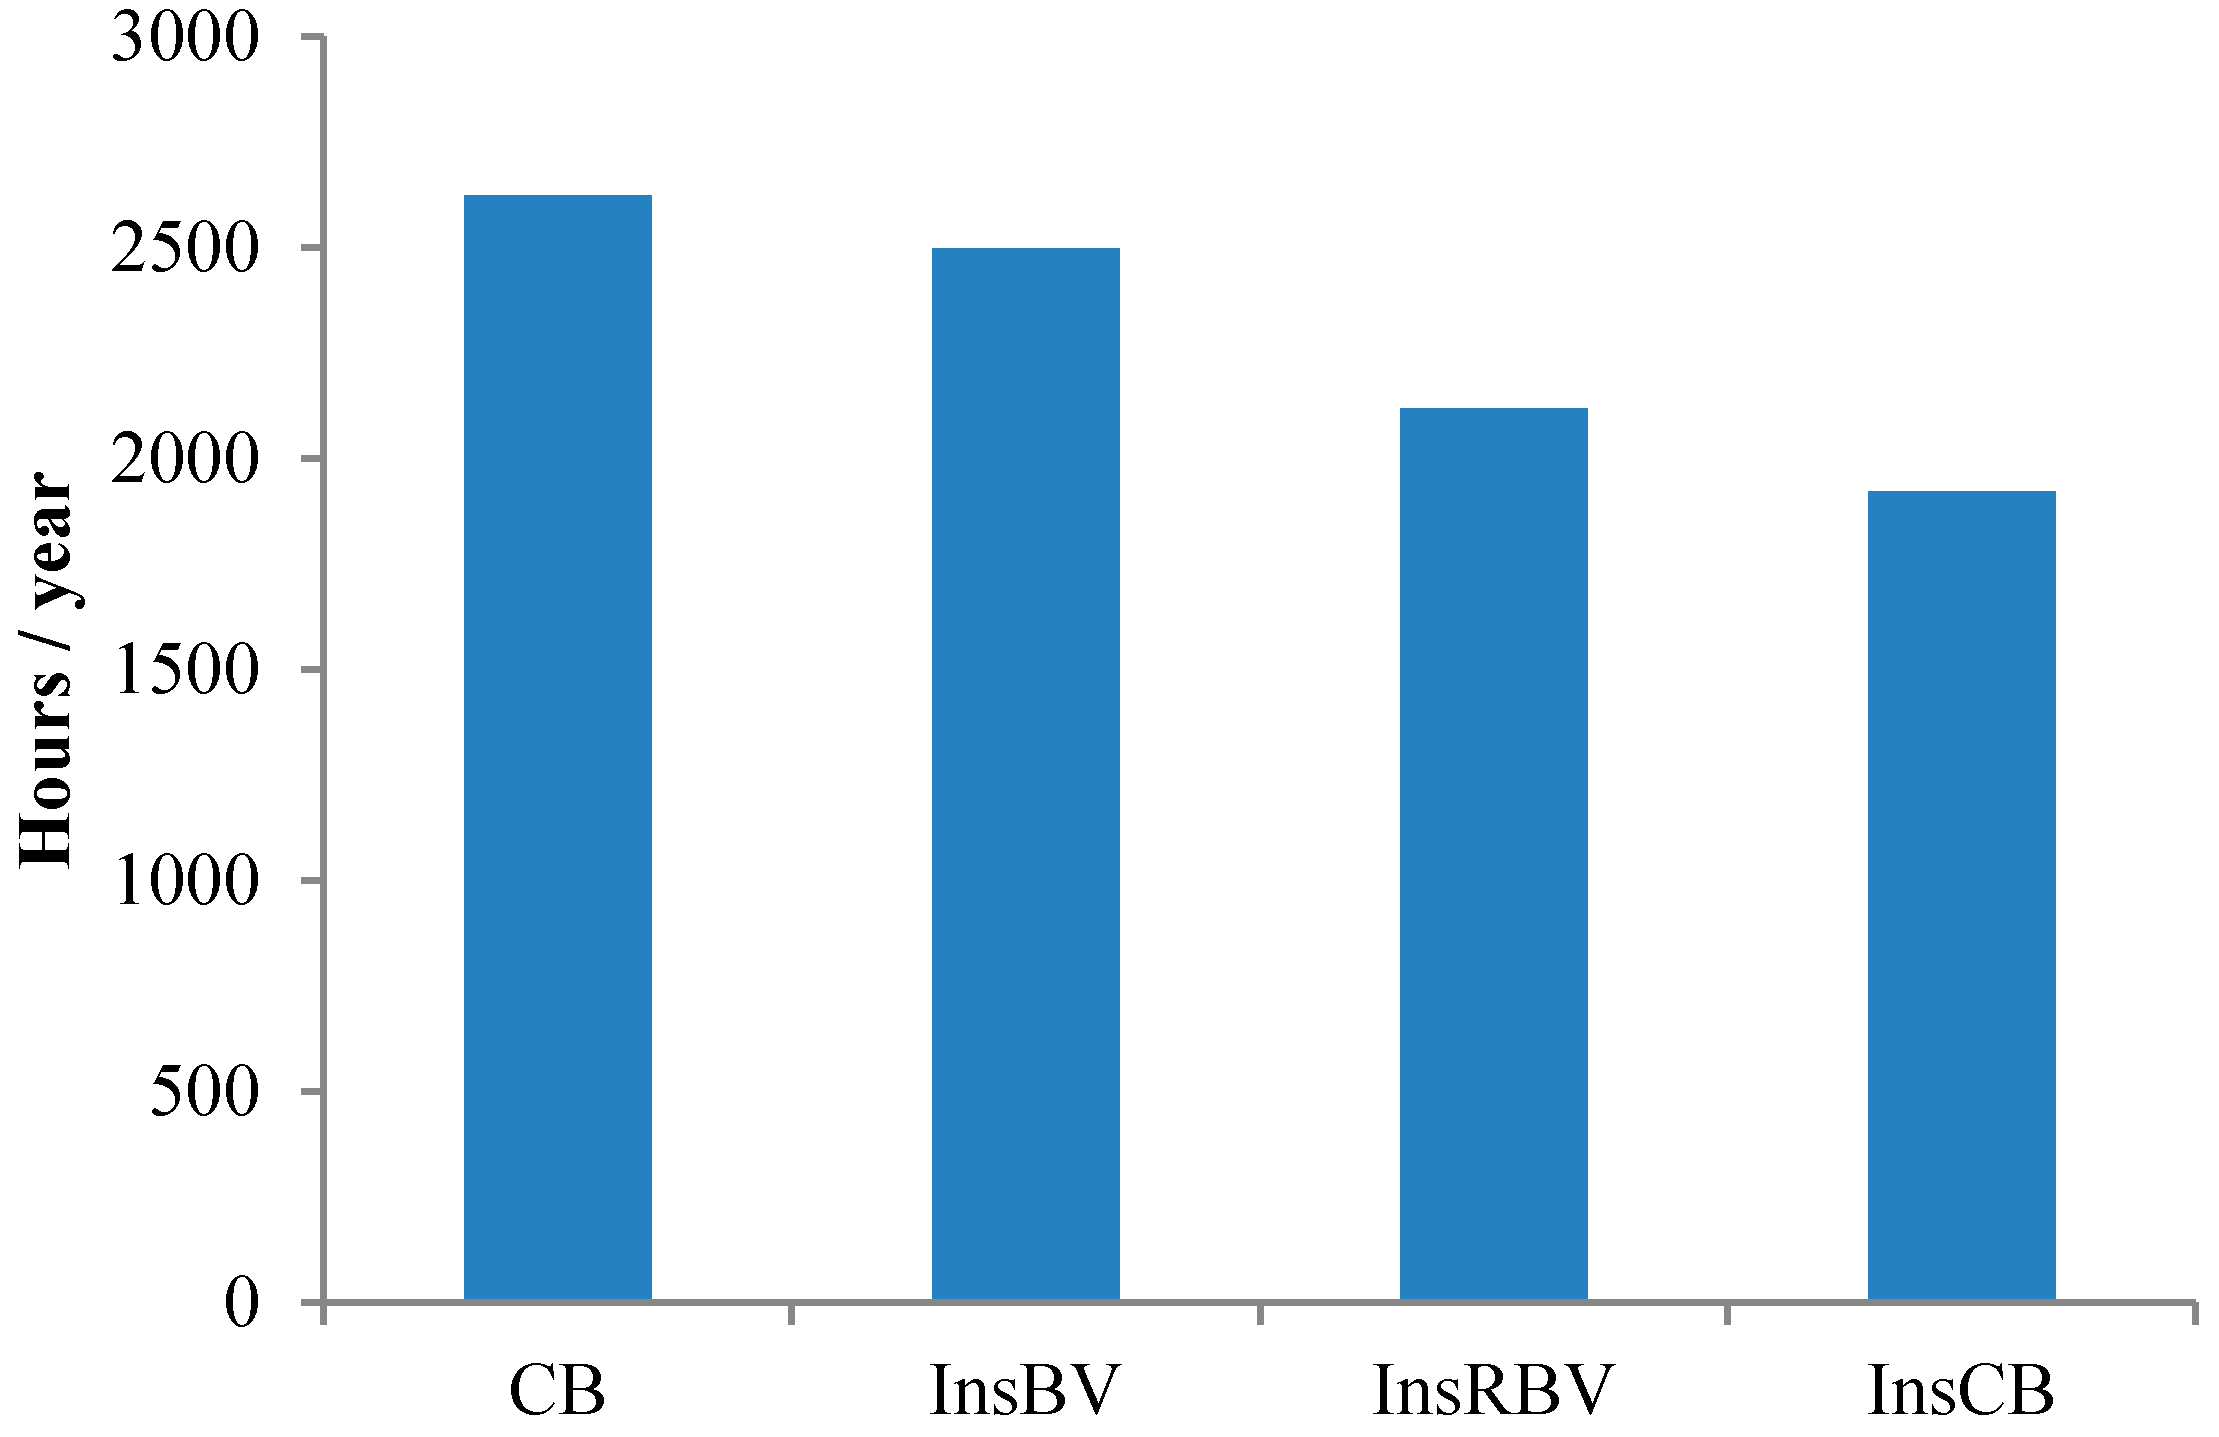
Figure 12.
Total numbers of hours where mechanical heating or cooling was required for PMV and the adaptive thermal comfort.
Figure 12.
Total numbers of hours where mechanical heating or cooling was required for PMV and the adaptive thermal comfort.

Table 1.
Variables that define predicted mean vote (PMV) thermal comfort [10].
Table 1.
Variables that define predicted mean vote (PMV) thermal comfort [10].
| Parameter | Unit | Range of PMV/PPD (ISO Standard 7730) | Note |
|---|---|---|---|
| Metabolic rate | Met (W/m2) | 0.8–4.0 | 1 for seated and 1.7 for cooking |
| Clothing insulation | Clo (m2 K/W) | 0.0–2.0 | 0.5 for the hot days and 1.3 for the cold |
| Mean radiant temperature | °C | 10.0–30.0 | Close to the outside air temperature |
| Air temperature | °C | 10.0–30.0 | Recorded inside each module |
| Air velocity | m/s | 0.0–1.0 | Main driver for air is natural circulation |
| Air humidity | % | 55–80 | Recorded at 9 a.m. and 3 p.m. |
© 2018 by the authors. Licensee MDPI, Basel, Switzerland. This article is an open access article distributed under the terms and conditions of the Creative Commons Attribution (CC BY) license (http://creativecommons.org/licenses/by/4.0/).
Share and Cite
MDPI and ACS Style
Albatayneh, A.; Alterman, D.; Page, A.; Moghtaderi, B. The Impact of the Thermal Comfort Models on the Prediction of Building Energy Consumption. Sustainability 2018, 10, 3609. https://doi.org/10.3390/su10103609
AMA Style
Albatayneh A, Alterman D, Page A, Moghtaderi B. The Impact of the Thermal Comfort Models on the Prediction of Building Energy Consumption. Sustainability. 2018; 10(10):3609. https://doi.org/10.3390/su10103609
Chicago/Turabian StyleAlbatayneh, Aiman, Dariusz Alterman, Adrian Page, and Behdad Moghtaderi. 2018. "The Impact of the Thermal Comfort Models on the Prediction of Building Energy Consumption" Sustainability 10, no. 10: 3609. https://doi.org/10.3390/su10103609
Note that from the first issue of 2016, this journal uses article numbers instead of page numbers. See further details here.