1. Introduction
The consumption of vegetable oils has increased in recent years due to their nutritional value and health-promoting properties [
1]. The prominent compounds found in vegetable oils are triacylglycerols, and along with the important minority fraction—including phytosterols, polyphenols, and tocopherols—they collectively define their chemical profile [
2]. This biochemical composition is essential for human metabolic activities and primarily serves as a substantial source of energy [
3].
In the case of extra virgin oil (EVOO), an important oil of the Mediterranean diet, its unique composition provides strong antioxidant protection, largely due to its high concentration of polyphenolic compounds (oleuropein, tyrosol, hydroxytyrosol, and several hydroxybenzoic acids including ferulic, syringic, caffeic, and
p-coumaric acids) [
4]. These phenolics are the primary contributors to EVOO’s radical-scavenging activity. Olive oil also contains a high quantity of unsaturated fatty acids, especially monounsaturated fatty acids (MUFAs) [
5], which further contribute to its stability and bioactivity.
Edible vegetable oils, including EVOO, are prone to oxidation, leading to a significant loss of nutritional quality and generation of odorous oxidation by-products. The degree of unsaturation of fatty acids, the absence of antioxidant compounds, and metal-chelating reactions could accelerate the oxidation process of edible vegetable oils [
6,
7]. However, the unique chemical composition of EVOO—rich in phenolic compounds, tocopherols, and MUFAs—renders it more resistant to oxidation than other vegetable oils (e.g., sunflower or soybean oil), which contain substantially lower levels of natural antioxidants. Despite this inherent stability, EVOO can still undergo oxidation during storage, leading to the formation of secondary oxidation products that negatively affect its sensory attributes and consumer acceptance [
8].
To limit quality deterioration, the food industry commonly employs synthetic antioxidants such as butylated hydroxytoluene (BHT). These compounds are effective, but their use has been increasingly scrutinized due to potential health concerns [
9]. Consequently, there is a growing demand for natural antioxidant alternatives. Such compounds may act as healthier replacements for synthetic additives and can be derived from plant extracts [
10]. For instance, Sousa et al. [
11] employed dried plants (oregano, laurel, hot chili peppers, and pepper) to flavor and further enrich olive oils from cv. Cobrançosa, producing a clean-label end product with enhanced bioactivity and improved oxidative stability.
Essential oils (EOs) are naturally occurring phytochemicals that are mainly composed of volatile compounds (VCs) and contribute to several health-promoting activities, including antioxidant and antimicrobial properties. The chemical profile of EOs typically contains phenols, aldehydes, ketones, alcohols, and a wide range of terpenes [
11]. Their antioxidant and antibacterial effects are primarily derived from synergistic interactions amongst multiple minor constituents, rather than from a single dominant compound. Several naturally extracted EOs have been employed for their bioactivities over the years. Oregano EO is extensively used in the food sector and is reported to contain high levels of carvacrol and thymol, among other health-promoting compounds [
12,
13,
14]. Rosemary EO is also widely used due to its strong antioxidant potential, largely attributed to monoterpenes such as 1,8-cineole [
15].
Flavoring EVOO with bioactive compounds is an attractive procedure that can significantly enhance the oxidative stability and shelf life of oils. The nutritional quality of flavored oils is also positively affected [
16]. The addition of EOs is an effective way to flavor vegetable oils and can substantially influence the sensory profile of the final product. Several recent studies have explored the use of EOs in oil flavoring [
17,
18], demonstrating that high-quality flavored vegetable oils can be produced.
In the present study, we enriched EVOO with five common EOs (orange, lemon, black pepper, oregano, and rosemary) and evaluated their effectiveness in enhancing oxidative stability and prolonging shelf life. These EOs were selected based on their chemical diversity, their prevalence in Mediterranean cuisine, and their known bioactive properties. Their distinct compositions—particularly the presence of polyphenolic monoterpenes and oxygenated terpenes—may differentially influence oxidation mechanisms within the oil matrix [
19].
Moreover, although flavored EVOOs are commercially available, comparative studies assessing multiple EOs at different concentrations under identical accelerated oxidation conditions remain limited. This work therefore provides a comprehensive evaluation of natural antioxidant alternatives that may be preferable to consumers seeking clean-label products with enhanced health-promoting attributes.
2. Materials and Methods
2.1. Reagents, Chemicals, and Materials
High-purity ethanol (99.8%) was purchased from Fischer Scientific (Loughborough, UK). Tocopherol standards and malondialdehyde were purchased from Merck Ltd. (Darmstadt, Germany). Trolox (6-hydroxy-2,5,7,8-tetramethylchroman-2-carboxylic acid) was from Glentham Life Sciences (Corsham, UK). Several acids, including hydrochloric acid (37%), trichloroacetic acid, thiobarbituric acid (TBA), and glacial acetic acid, along with ammonium iron (II) sulfate and acetone, were all purchased from Panreac (Barcelona, Spain). Sodium chloride, ammonium thiocyanate, and chloroform were purchased from Penta (Prague, Czech Republic). Ethyl acetate, isooctane, and dichloromethane were obtained from Carlo Erba (Vaul de Reuil, France). Hydrogen peroxide (35%) was obtained from Chemco (Malsch, Germany). Butylated hydroxytoluene (BHT), cyclohexane, p-anisidine, 2-octanol, and 2-propanol were purchased from Sigma Aldrich (Burlington, MA, USA).
Orange, lemon, and rosemary EOs were provided by Apivita (Athens, Greece), whereas black pepper and oregano EOs were purchased from UMake Cosmetics (Athens, Greece). Fresh EVOO was obtained from a local market in Karditsa city (Thessaly, Greece). The rationale behind the chosen EOs lies in both the chemical diversity and culinary uses in Mediterranean cuisine. For instance, citrus-based EOs are abundant in limonene and provide a citrus-like scent in EVOO [
20]. Black pepper EO is rich in
β-caryophyllene and sabinene and provides a more spicy tone in the final product [
21]. Finally, oregano and rosemary EOs are abundant in potent antioxidant monoterpenes carvacrol and 1,8-cineole, respectively [
22]. All EOs could provide different bioactivities in flavored EVOOs in terms of antioxidant/antimicrobial activity or increased oxidative stability. The oil sample was immediately analyzed after opening. The EVOO used in this study had the following quality parameters, as reported on the product label: peroxide value 1.62 mmol H
2O
2/kg, free acidity 0.38% (as oleic acid), and a fatty acid profile typical of Greek EVOO (C18:1 ~74%, C16:0 ~12%, C18:2 ~8%).
2.2. Instrumentation and Software
The oxidation of EVOO samples was conducted in an ARGOLab CH 250-CLIMATEST climatic chamber from Giorgio Bormac S.r.l. (Carpi, Italy). For the spectrophotometric determination of thiobarbituric acid reactive species assay, the heating process was done in a Heidolph hotplate (Heidolph Instruments GmbH and Co. KG, Schwabach, Germany), whereas centrifugation was conducted in a NEYA 16R (Remi Elektrotechnik Ltd., Palghar, India) centrifuge apparatus. All oxidative stability assays were conducted in a Shimadzu UV-1900i UV/Vis spectrophotometer (Kyoto, Japan), wherein quartz cells (10 mm, 1400 μL) were used. The quantitation of tocopherols was feasible through a Shimadzu CBM-20A (Shimadzu Europa GmbH, Duisburg, Germany) high-performance liquid chromatography (HPLC), which was equipped with a SIL-20AC model autosampler and a CTO-20AC column oven. The equipment was coupled with a Shimadzu RF-10AXL fluorescence detector. The separation of tocopherols was done in a Waters μ-Porasil (Milford, MA, USA) column (125 Å, 10 μm, 3.9 mm × 300 mm). Volatile compounds were separated through an Agilent Technologies (Santa Clara, CA, USA) Gas Chromatograph model 7890A, which was coupled to a mass selective detector model 5975C, equipped with an Agilent J&W DB-1 capillary column (30 m × 320 μm × 0.25 μm) (Folsom, CA, USA). The chemical composition of oil samples was feasible using Attenuated Total Reflectance (ATR) equipment with a ZnSe crystal trough plate, which was used to acquire the Fourier-Transform Infrared (FTIR) spectra from a Prestige21 spectrophotometer purchased from Shimadzu (Kyoto, Japan). The equipment involved a potassium bromide beam splitter, a ceramic light source, high-energy throughput optical elements, and a deuterated triglycine sulphate doped with L-alanine. Shimadzu IRsolution (version 1.60) application was employed to process each FTIR spectrum. Statistical processing was conducted using JMP Pro 16 (SAS Institute Inc., Cary, NC, USA).
2.3. Experimental Procedure
Briefly, a precise quantity of EVOO (100 g) was transferred into amber glass bottles. EOs from orange, lemon, black pepper, oregano, and rosemary were incorporated into EVOO samples at three concentrations (0.5, 1.0, and 2.0%
w/
w). These concentrations were chosen based on a two-tier rationale. First, they allow for comparison with earlier research, as they fall within the commonly reported range for EO-flavored edible oils (0.05–3.0%) [
23,
24,
25]. Second, a two-fold incremental pattern (0.5 → 1.0 → 2.0%) was selected to avoid exceeding 3.0%, which could overpower the characteristic sensory attributes of EVOO.
Positive control samples containing 200 ppm of BHT were included, while neat EVOO (without additives) served as the simple control. In total, 17 treatments were prepared, each in triplicate. All samples were placed in air-tight amber glass bottles to minimize oxygen ingress and prevent light exposure, and subsequently stored at 60 °C in a climatic chamber to initiate oxidation.
The incubation lasted 28 days, with sampling performed at day 0, day 14, and day 28 to evaluate oxidative stability over time. The use of 60 °C follows widely accepted accelerated oxidation protocols, as this temperature promotes autoxidation without inducing thermal degradation (>70 °C) or excessively slow reaction rates (<50 °C) [
26,
27]. Although accelerated oxidation provides reliable comparative data, it does not fully replicate real-time storage conditions due to temperature-dependent reaction kinetics. Therefore, real-time validation may be required for precise shelf-life estimation. All assays were conducted in triplicate.
2.4. Oxidative Stability Assays
2.4.1. Peroxide Value (PV)
A modified version of the International Dairy Federation standard technique 74A:1991 [
28] was employed to evaluate PV of all oil samples and evaluate the primary oxidation by-products formation [
29]. A precise quantity of oil (0.05 g) was mixed with 2 mL of a solvent consisting of dichloromethane/ethanol solvent (3:2,
v/
v) in a 2 mL polypropylene tube. The mixtures were subsequently vortexed to homogenize. Right after, precise volume (50 μL) of diluted sample extract was mixed with 25 μL of ammonium iron (II) sulfate solution (25.5 mM in 10 M hydrochloric acid), 25 μL of ammonium thiocyanate solution (4 M in water), and the solvent filled the 5 mL volumetric flask. The final mixture was shaken while a stable reddish complex of ammonium thiocyanate was formed, with its absorbance being measured at 500 nm after 5 min of storage in darkness. The calculation of PV was done using a calibration curve of hydrogen peroxide (H
2O
2), as shown in
Table A1. The equation that follows involves the concentration (
C) of H
2O
2, the measured mass (
w) and volume (
V):
2.4.2. Thiobarbituric Acid Reactive Substances (TBARS) Assay
A previously established methodology [
30] was employed to conduct TBARS assay and evaluate secondary oxidation by-products (specifically malondialdehyde) of flavored EVOOs [
29]. A precise quantity of oil sample (0.1 g) was mixed with 5 mL of thiobarbituric acid solution (consisting of 15 g of trichloroacetic acid, 0.375 g of TBA, and 1.76 mL of concentrated hydrochloric acid into a 100 mL volumetric flask filled with deionized water). The final mixture was left to incubate at 95 °C for 20 min and then stood in an ice bath for 5 in. Chloroform (0.2 mL) was added to precipitate the oily phase, whereas the biphasic mixture was centrifuged at 4500 rpm for 10 min. The absorbance of the supernatant liquid was recorded at 532 nm. A calibration curve, as shown in
Table A1, used several malondialdehyde concentrations to calculate TBARS, and the results involving volume (
V, in L) of the extraction medium and weight of oil sample (
w, in g) were expressed in (mmoL MDAE) per kg of oil as follows:
2.4.3. p-Anisidine Value
An established method of ISO 6885:2012 [
31] was used to quantify
p-anisidine value (
p-AnV). This assay quantifies aldehydic secondary oxidation by-products and is essential for calculating the Totox index [
32]. Isooctane was mixed with a quantity (0.5 g) of oil samples in a 10 mL volumetric flask. Precise volume (1 mL) of each diluted oil sample was mixed with 0.2 mL of glacial acetic acid (sample
A0). In addition, the same volume of diluted oil sample was mixed with 0.2 mL of
p-anisidine solution (sample
A1). Ultimately, a blank sample (
A2) consisting of 1 mL isooctane and 0.2 mL of
p-anisidine solution was also prepared. All samples were kept in the darkness for 10 min, and the absorbance of each sample was recorded at 350 nm. The calculation of
p-anisidine value was based on Lambert–Beer law and involved the mass (
m) of each examined oil (~0.5 g), the volume (
V, in L) of solvent, and
Q denotes the sample content of the measured solution (0.05 g/mL). The correction factor for 0.2 mL of the glacial acetic acid or the reagent dilution is 0.24 in the equation below:
2.4.4. Total Oxidation (Totox) Value
Total oxidation (Totox) value of all oil samples was determined using a mathematical equation that involves the sum of primary and secondary oxidation by-products as measured by PV and
p-AV, respectively, using an equation established by Galanakis et al. [
33]:
2.4.5. Conjugated Dienes/Trienes
An established methodology from Pegg et al. [
34] was used to calculate conjugated dienes and trienes. Cyclohexane was used to dilute 0.01 g of oil samples in a 5 mL volumetric flask. The absorbances of conjugated dienes and trienes were recorded at 232 and 270 nm, respectively.
The concentration of conjugated dienes (
CCD) and trienes (
CCT) was calculated through spectrophotometric measurement of 232 and 270 nm. The calculations involved the dilution factor (5 × 10
3) of solvent volume (5 mL), the molecular absorptivity of linoleic acid hydroperoxide (
ε, 2.525 × 10
4 M
−1 cm
−1), and the path length of the cuvette (
l, 1 cm). The content of CD and CT was expressed as mmol per kg of oil using the following equations:
2.5. Tocopherols Quantification
The determination of tocopherols was employed using an established methodology by Athanasiadis et al. [
35]. Precise quantity of oil (0.25 g) was diluted with
n-hexane into a 5 mL volumetric flask. Constant volume of 20 μL of diluted oil sample was directly injected into the HPLC equipment. A constant flow rate of 1 mL/min was kept, whereas the mobile phase included
n-hexane/2-propanol/absolute ethanol in a ratio of 97.5:2.0:0.5
v/
v/
v. The elution was isocratic, and the total run time was 10 min. The excitation (294 nm) and emission (329 nm) of the fluorescence detector were used to identify tocopherols. The concentration of tocopherols (
CT) process was conducted using an equation involving the volume of extraction medium (
V, in L) and the weight of oil samples (
w, in g). The tocopherol content (TC) was expressed as mg of each tocopherol per kg of oil:
2.6. Free-Radical Neutralization Activity
The antiradical activity of oil samples was measured using a previously discussed methodology [
36]. The rationale behind this method lies in the decolorization of a stable purplish ethyl acetate solution of DPPH
• after redox reactions with antioxidant compounds found in oil samples. Briefly, 50 μL of 10-fold diluted oil samples were mixed with 950 μL of DPPH
• solution (100 μM). The initial absorbance (
A515(i)) of the blank sample (devoid of oil) was recorded and compared with the corresponding absorbance of each oil sample (
A515(f)) after 30 min storage in the dark. A calibration curve involving Trolox equivalents was used to quantify the inhibition capacity of oil samples, as shown in
Table A1, using the following equation:
The obtained results were calculated as μmol Trolox equivalent antioxidant capacity (TEAC) per kg of oil using a corresponding calibration curve (
Table A1).
2.7. Determination of Aromatic Profile from EOs
A previous methodology from Tsitsirigka et al. [
37] was used to quantify volatile compounds (VCs) that contribute to the aromatic profile of essential oils. The volume of each essential oil (L) was diluted in
n-hexane into a 1.5 mL vial. The injector had a constant temperature of 240 °C in splitless mode. Helium was employed as the carrier gas (1.5 mL/min). The gradient oven program involved an initial temperature of 40 °C for 5 min, with a gradual rise to 140 °C (by 2 °C/min). The final step was to keep the temperature constant at 240 °C for 10 min (increasing 10 °C/min), while the whole program lasted 75 min. Regarding MSD parameters, the temperatures of source (230 °C) and quadrupole (150 °C) were kept constant, whereas the
m/
z range was 29–350, and electron acquisition mode had 69.9 eV. The sample composition was determined through normalization procedures from the obtained peaks (without correction factors).
2.8. ATR–FTIR Qualitative Analysis
The chemical composition of each oil sample was analyzed using a previous methodology [
38]. We incorporated ~800 μL into ATR–FTIR equipment and conducted 32 scans using a 4 cm
–1 resolution and covering 4000–400 cm
−1. The ATR crystal was meticulously soaked and cleaned with acetone before and after each analysis. The spectra were obtained after baseline correction and signal-to-noise ratio analysis.
FTIR spectroscopy was employed to monitor structural changes in the lipid matrix, including hydroperoxide formation (O–O stretching), carbonyl group evolution (C=O stretching), and alterations in unsaturation (C=C stretching). The fingerprint region (1500–1000 cm−1) was also examined for changes in C–O and C–H bending vibrations.
2.9. Statistical Processing
All statistical analyses were performed using JMP Pro 16 (SAS Institute Inc., Cary, NC, USA). Descriptive statistics (mean ± SD) and ANOVA with Tukey’s post-hoc test (p < 0.05) were applied to evaluate differences among treatments and storage times. Multivariate analyses included PCA (autoscaled variables) to explore major variance patterns, canonical discriminant analysis to assess treatment separation, and hierarchical cluster analysis using Ward’s method and Euclidean distance to identify natural groupings. The optimal number of clusters was determined using the Cubic Clustering Criterion. Graphical outputs (score plots, canonical plots, heatmaps, dendrograms) supported interpretation of the multivariate structure.
3. Results and Discussion
Mixing dried plants with vegetable oils is a prominent technique to produce flavored oils. Despite the straightforwardness and ease of the procedure called infusion, it could last for months in order to satisfactorily transfer bioactive compounds from plant to oil. In addition, undesirable compounds such as waxes could be transferred as well, a process that negatively affects the end product [
39]. To avoid such issues, oils could be flavored with EOs as an alternative approach; a trend that is continuously growing [
40].
Several novel flavored EVOOs are being established and placed on market shelves nowadays, given the increased nutritional quality, sensory profile, and enhanced bioactivities that are preferred by consumers. In a study from Kiralan et al. [
41], the authors flavored EVOO with corresponding EOs from peppermint, oregano, thyme, and laurel. The stability of the flavored end product was evaluated by employing thermal and photo-oxidation procedures. Barreca et al. [
42] conducted a similar study, which involved the enrichment of EVOO with EOs from medicinal aromatic plants growing in the Mediterranean (i.e., common sage, rosemary, oregano, and thyme). The ultimate goal was to find optimal EO concentration in order to enhance the oxidative stability of EVOO. To that end, it is observed that this procedure is thoroughly examined by the scientific community due to the increased quality of end products.
A comprehensive analytical workflow was applied to characterize both the oil samples and the essential oils used in the study. Classic oxidation and antioxidant markers (PV, TBARS, p-anisidine value, Totox, CDs, CTs, α-tocopherol, DPPH) provided a detailed assessment of primary and secondary oxidation processes during accelerated oxidation. Correlation analyses offered an integrated view of sample behavior, revealing clear temporal trends and treatment-specific patterns. Principal Component Analysis (PCA) was performed to highlight any possible correlation between the oxidation–antioxidant gradient and the distinct influence of CTs. Discriminant Analysis (DA) and Hierarchical Cluster Analysis (HCA) were conducted to examine possible discrimination among treatments. FT-IR spectroscopy was employed to enable direct comparison of the mid-IR profiles of all samples. Finally, implementation of GC–MS analysis of the pure essential oils was conducted to shed more light on their major volatile constituents, supporting the interpretation of their antioxidant effects in the oil matrix.
3.1. Oxidation Markers
Oxidation by-products determination is of major significance when it comes to oil quality deterioration [
7]. In our study, the oxidation markers were investigated to evaluate the efficacy of EOs in terms of increasing oxidative stability of EVOOs.
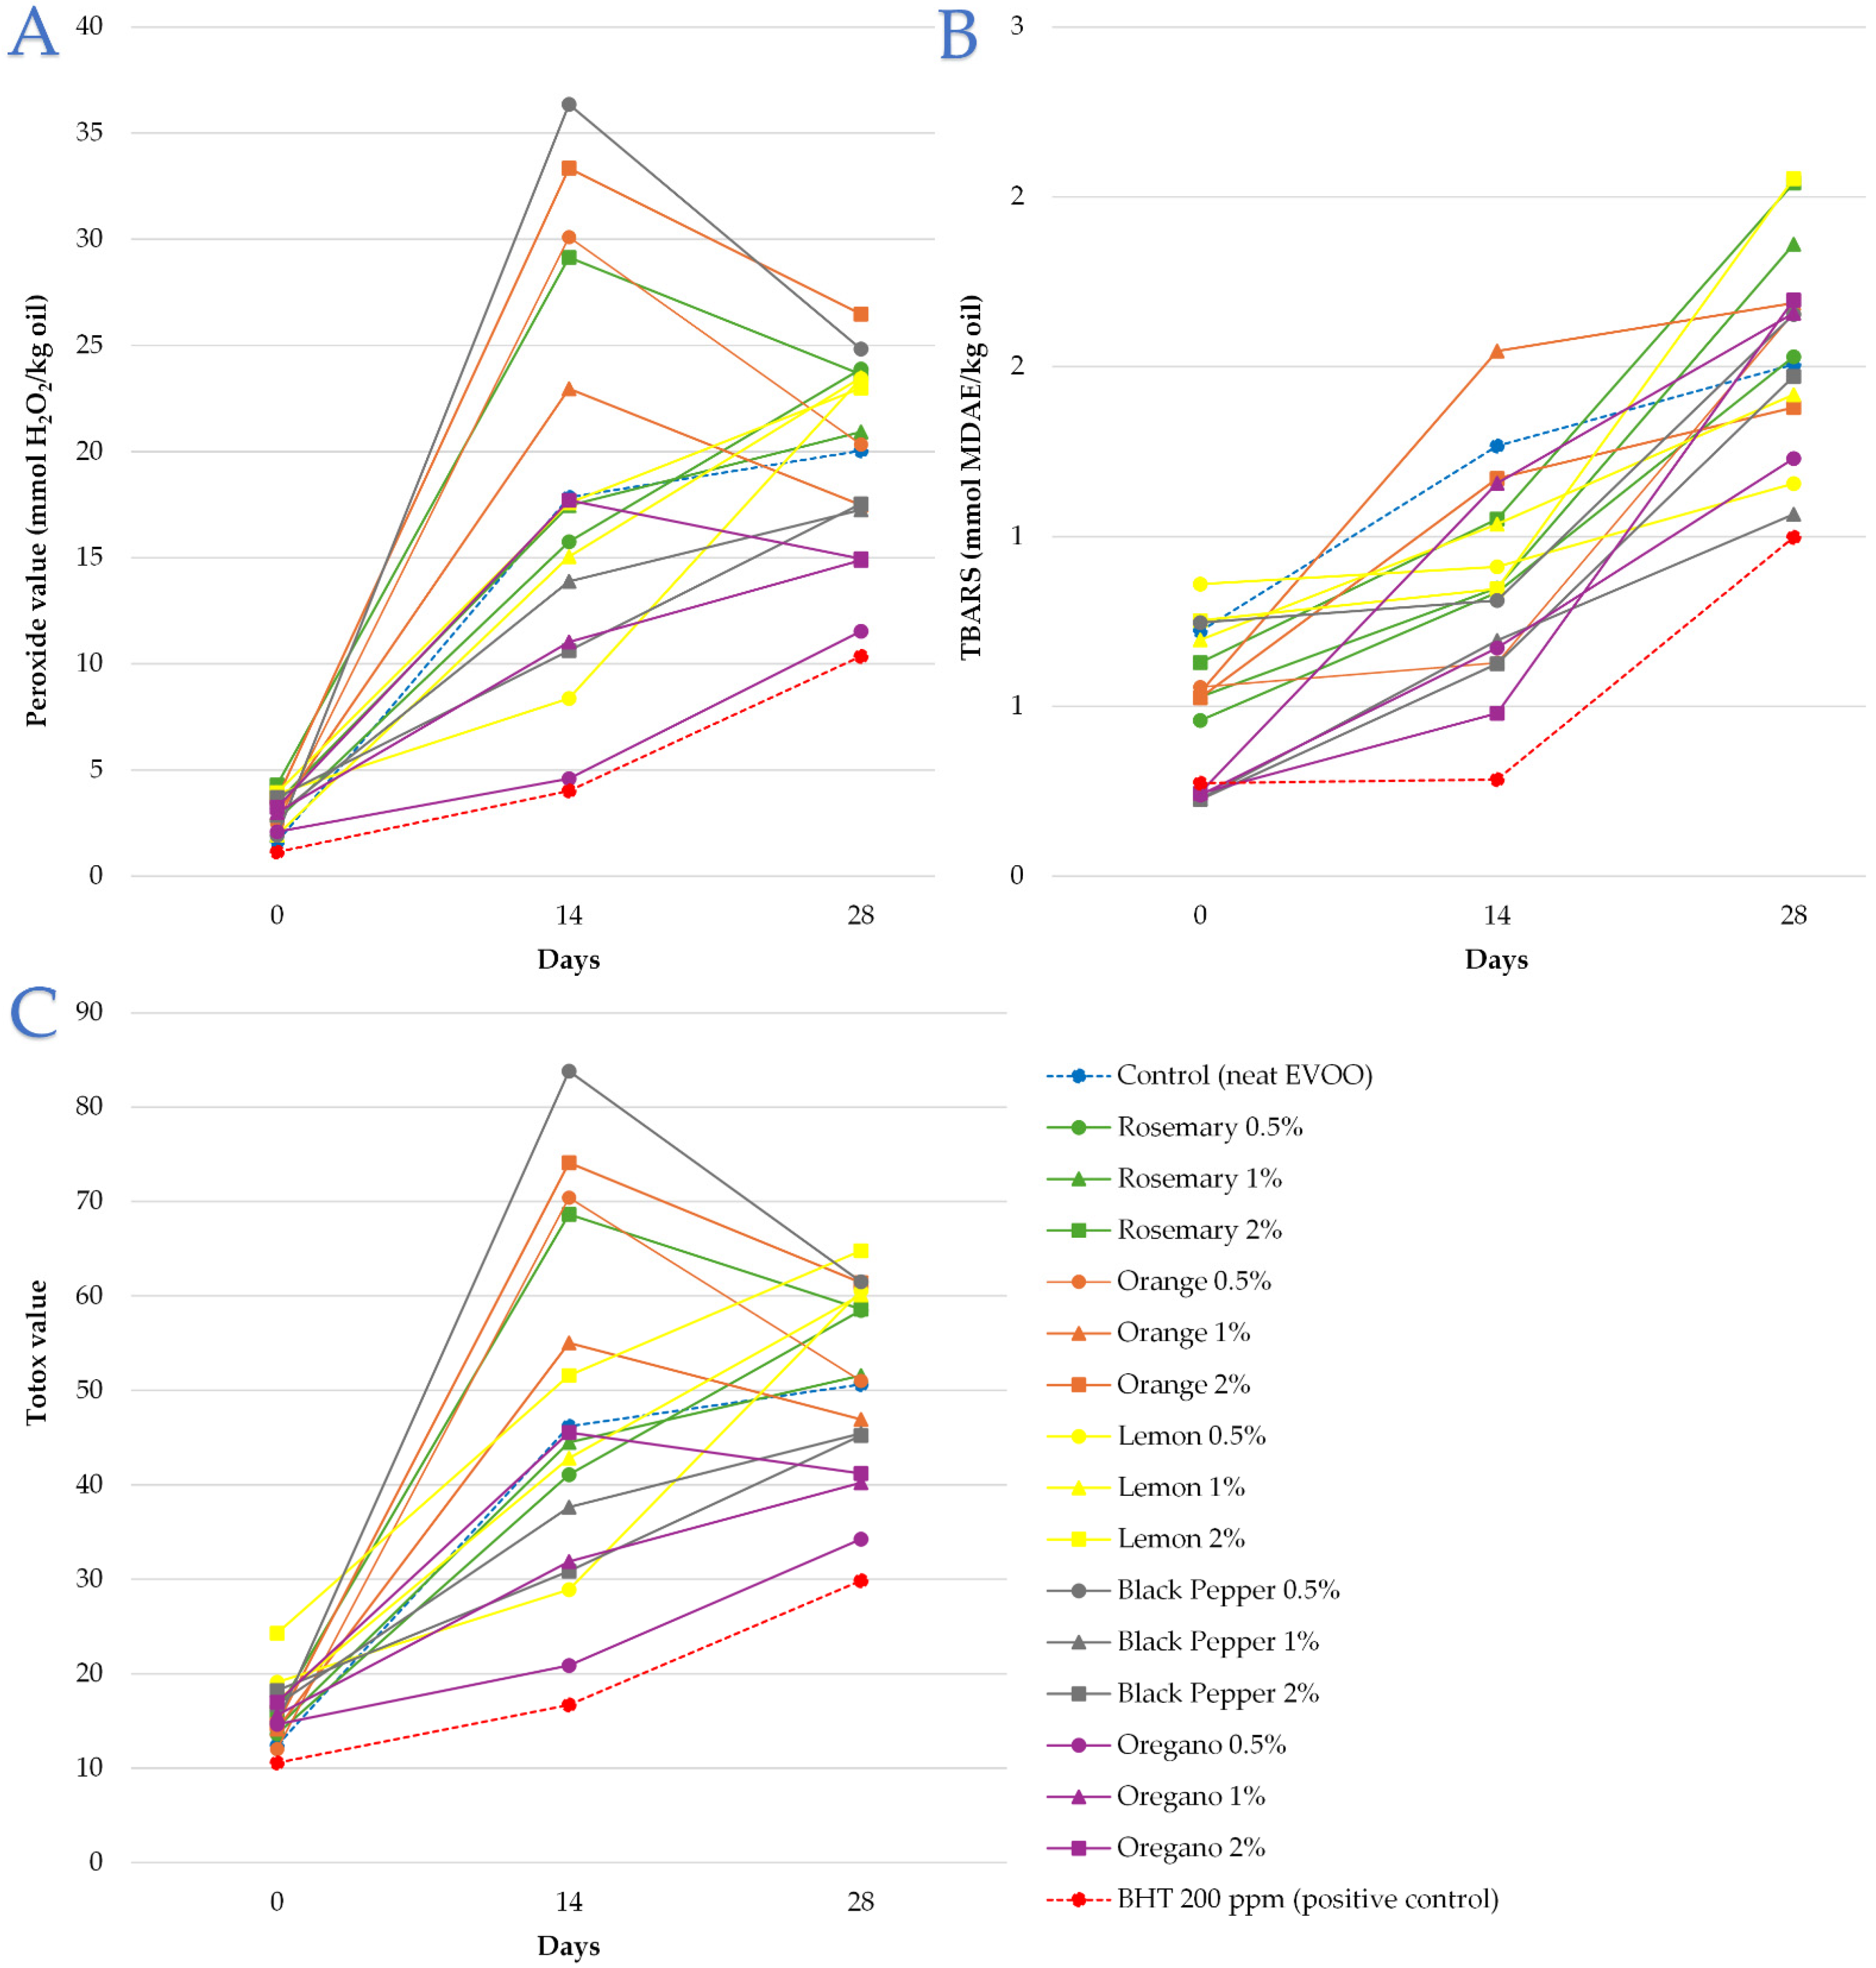
Table 1 provides detailed information about primary and secondary oxidation by-products. It was revealed that PV had a range of 1.14–36.35 mmol H
2O
2/kg oil, where the highest value was observed on day 14 of incubation of 0.5% black pepper EO. The consequent decrease in PV from the specific sample (24.84 mmol H
2O
2/kg oil) could be a matter of peroxide degradation, a very familiar pattern for these thermolabile compounds [
7]. Orange 2% showed much higher PV at Day 14 (33.35 mmol/kg), suggesting possible pro-oxidant effects at high citrus EO load. This behavior may be attributed to limonene, the major component of citrus EOs, which is prone to autoxidation and can generate reactive intermediates that promote peroxide formation under thermal stress [
43]. Regarding secondary oxidation by-products, rosemary 0.5% and oregano 2% keep values relatively low at Day 14, but most treatments increase by Day 28. Also, utilizing 2% lemon EOs was enough to reach statistically significant figures (
p < 0.05) among other EOs in both TBARS (2.05 mmol MDAE/kg oil) and
p-AV (18.82) at the end of incubation. This finding could be a matter of the composition of the specific EO, as continuous exposure reached higher levels of secondary oxidation by-products from the control sample (neat oil). The observed changes in peroxide value reflect the classical autoxidation mechanism, where hydroperoxides form during initiation and propagation but subsequently decompose into secondary oxidation products. Essential oils may influence these steps by donating hydrogen atoms, scavenging peroxyl radicals, or modulating propagation kinetics. To facilitate comparison among treatments and to better visualize oxidative trends, the most important parameters (PV, TBARS, and Totox) were additionally presented in graphical form (
Figure 1). The line plots clearly illustrate the progression of oxidation during storage and emphasize the differences in antioxidant performance among natural extracts and the BHT control. These visualizations complement the tabulated data and enhance the interpretability of treatment effects over time.
Similar results were obtained in a study by Benkhoud et al. [
44]. The authors employed EOs from rosemary, thyme, orange, fennel, and two types of pepper (black Brazilian and black Brazilian tree) to flavor EVOO samples. The evaluation of PV after 12-month storage revealed that the latter EO reached significantly lower figures (
p < 0.05) among others. Indeed, the Brazilian pepper tree EO reached 17.0 meq O
2/kg oil (8.5 mmol O
2/kg oil) compared to 22.5 meq O
2/kg oil (11.12 mmol O
2/kg oil) that the control sample had after 12 months of storage at room temperature.
3.2. Conjugated Dienes and Trienes
The quick and established spectrophotometric methodology was applied to determine the conjugated dienes (CD) and trienes (CT) of our samples, the results of which are shown in
Table 2. The observed range for CD value was 5.63–26.60 mmol/kg oil. A general increase was observed over time in all samples; Day 28 values in BHT and black pepper. Such an outcome could not be attributed to the efficacy of the specific EO, but rather to the degradation of primary by-products; a pattern that has been previously discussed. The highest CD value was observed in 2% rosemary EO.
Regarding CTs, the highest value was observed in 2% oregano EO (7.97 mmol/kg oil). Oregano treatments have the highest CTs at all time points. A possible explanation could be linked to EO phenolics absorbing in this region. The lowest value after 28 d incubation was observed in BHT (1.21 mmol/kg oil), a figure that is unmatched by other EOs. However, 0.5% black pepper EO was also found preferable as it was measured to achieve 1.33 mmol/kg oil. Similar results were obtained as per the previously discussed study by Benkhoud et al. [
44]. The authors found that Brazilian black pepper tree EO was the most preferable by reaching the lowest values on both CD (K232) and CT (K270). Indeed, K
232 of this flavored sample was measured at 1.99 against 2.67 (control), whereas K
270 value reached 0.15
versus 0.37 (control).
3.3. Antioxidant Markers
The antiradical capacity of EVOO-flavored samples was evaluated through Trolox equivalent activity at the initiation and end of treatment in order to correlate oil oxidation status and radical-scavenging capacity [
45]. This capacity could well explain the integrated effect of complex antioxidant compounds against oxidation of these oils. Indeed, the inherent scavenging activity of oils could be attributed to naturally occurring compounds such as tocopherols and also to lipophilic polyphenols [
46]. To that end, EO-flavored EVOO would be anticipated to scavenge free radicals since they are abundant in terpenoid compounds with health-promoting activities. Compounds such as thymol and carvacrol, which were identified (
vide infra), are known for such bioactivities [
47]. However, the incubation in controlled thermal conditions could highly affect the scavenging activity of EO-flavored EVOOs due to the depletion of antioxidant compounds, leading to stripped antioxidant protection [
48]. Given that both primary and secondary oxidation by-products were accumulated, as observed by oxidative stability assays, gave evidence to such phenomena.
The antiradical activity of EVOO samples in our study was determined as Trolox equivalents. The observed range 109.77–1057.24 μmol TEAC/kg before and after thermal incubation revealed significant differences (
p < 0.05), as shown in
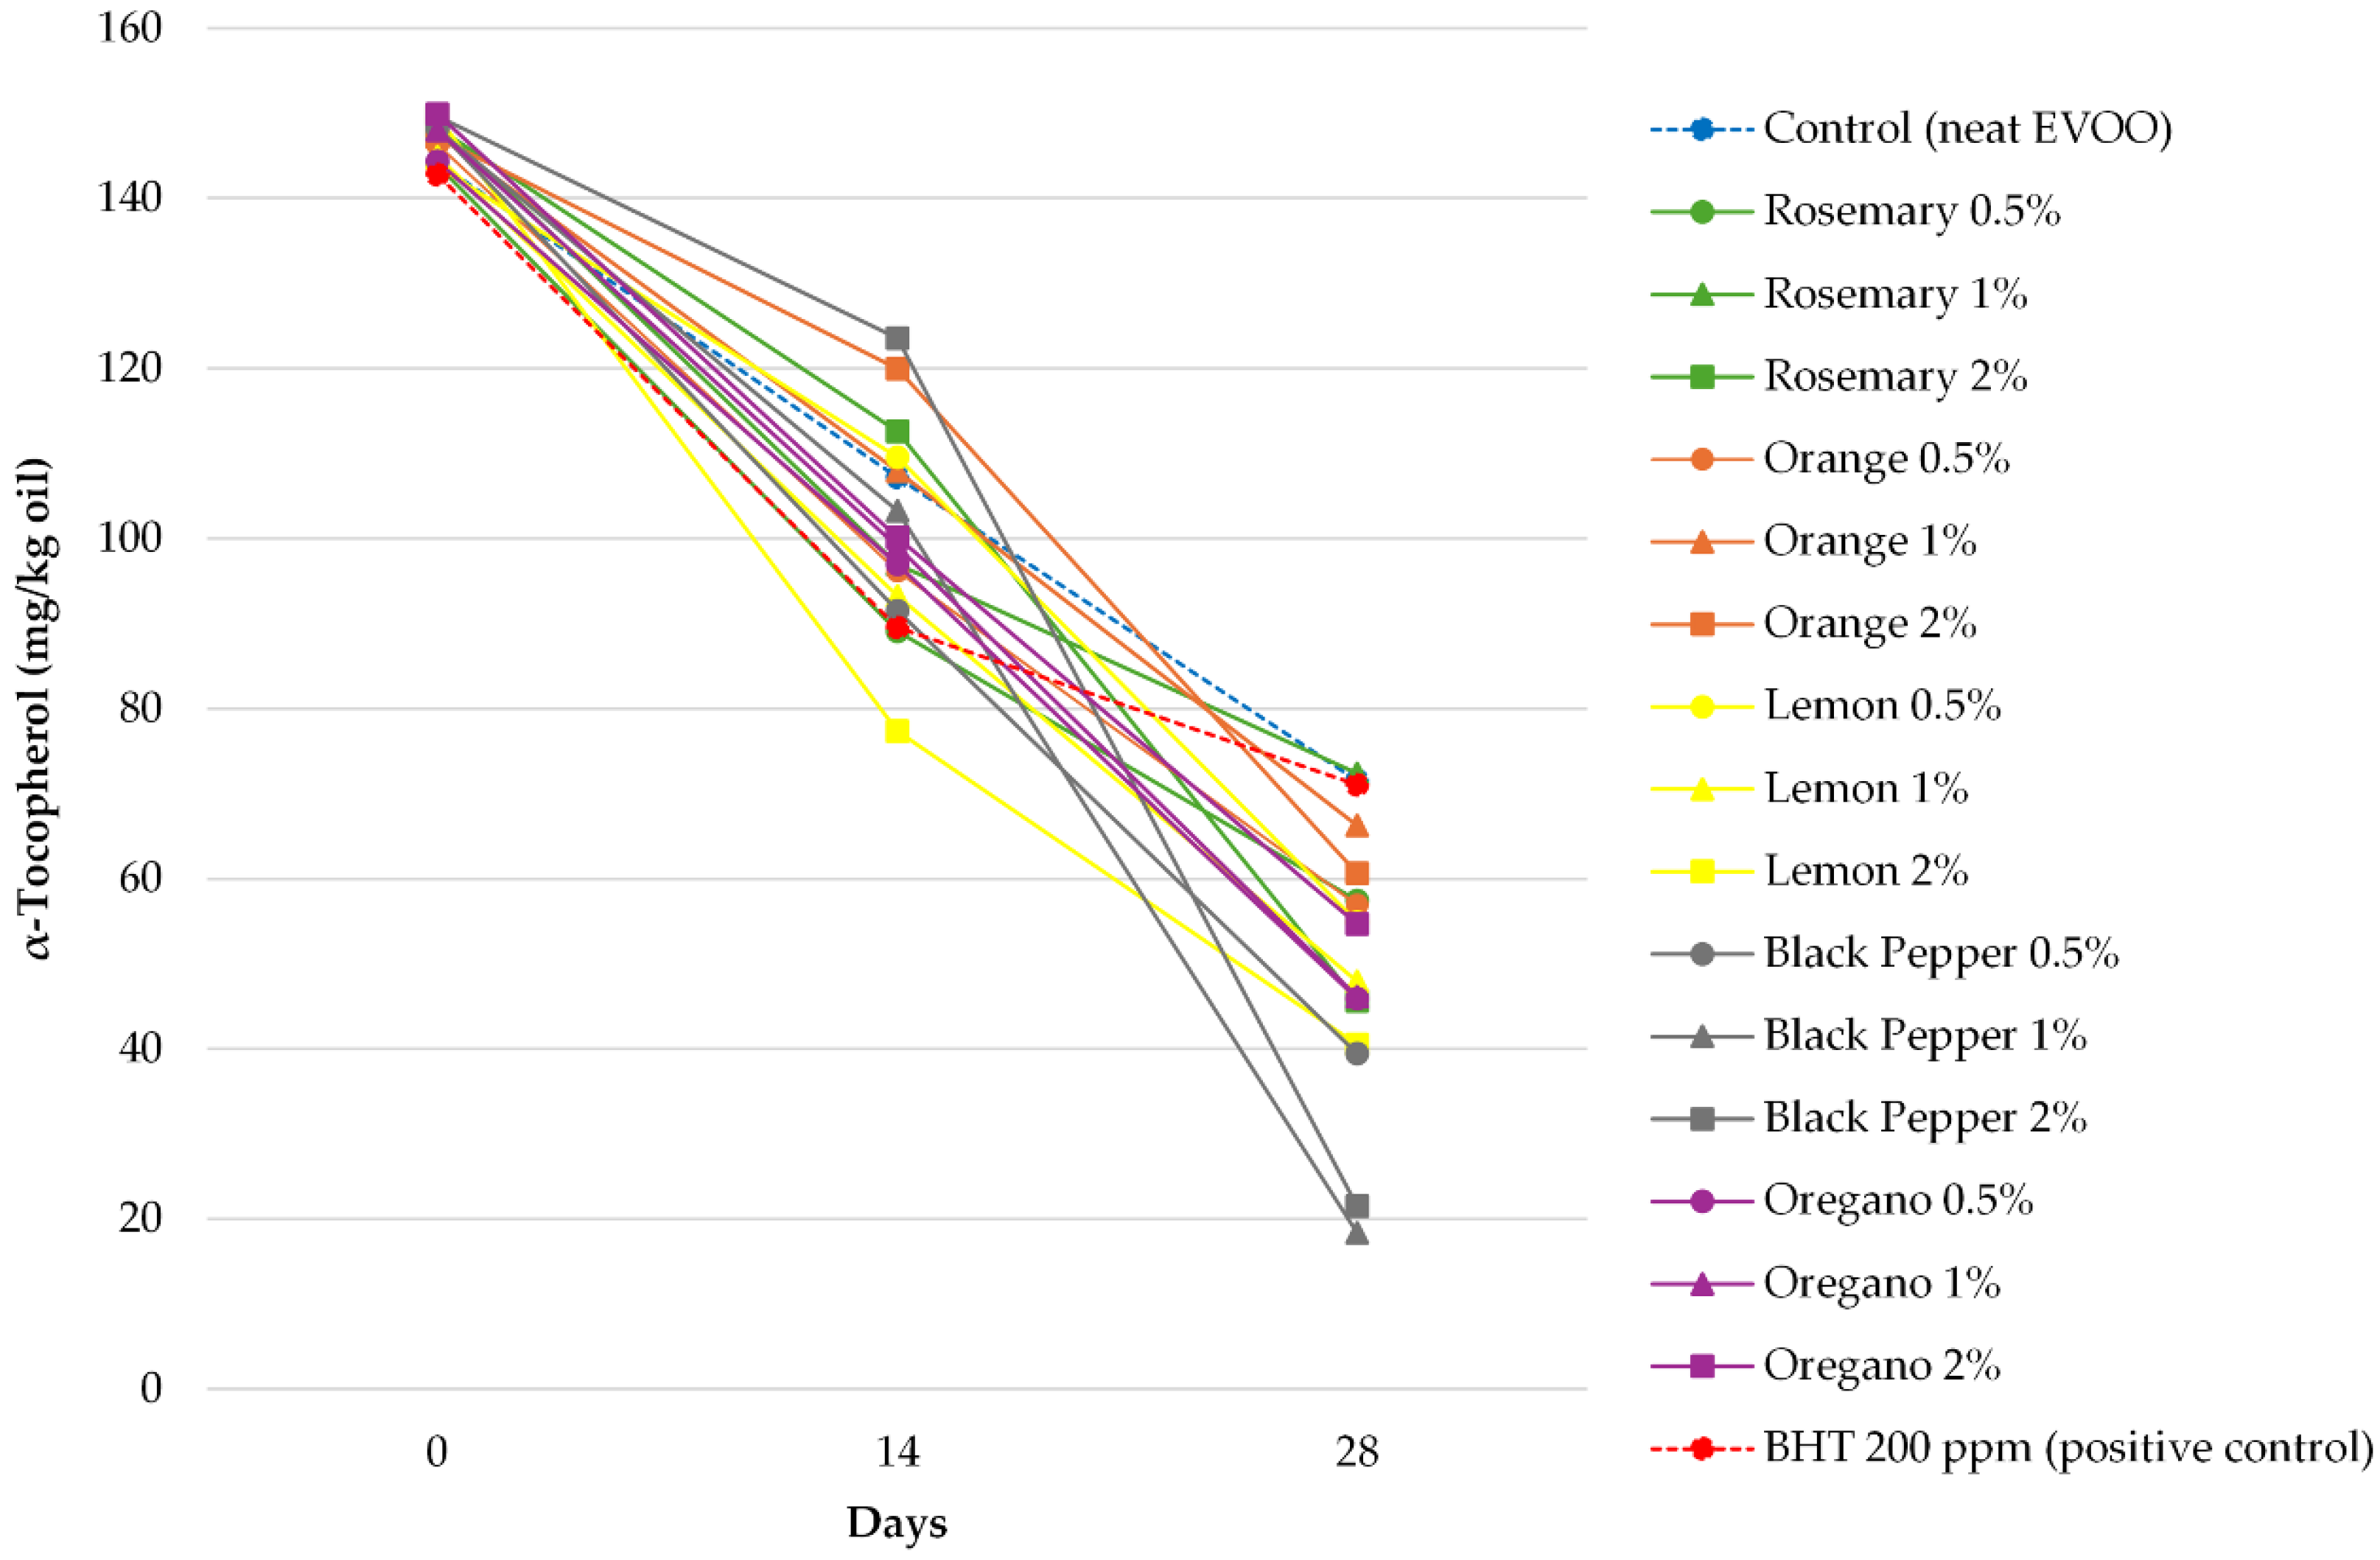
Table 3. The obtained low value is contingent on the thermal incubation, as previously discussed. A similar pattern was observed in α-tocopherol content, wherein a range of 18.39–149.94 mg/kg was observed. A graphical illustration of α-tocopherol depletion over time for each EVOO sample is depicted in
Figure 2. It could be deduced that black pepper EO was not preferable for tocopherol protection compared to orange EO, regardless of its content in oil samples.
The degradation of α-tocopherol was also examined in the study from Caipo et al. [
49]. The authors evaluated the impact of darkness/light and temperature on oil oxidation in an annual span. From an initial 180.2 mg/kg of measured α-tocopherol in EVOO (Arbequina variety), a ~12% decrease was observed after a month of storage at 45 °C in darkness. After a year of incubation, the specific sample also recorded a ~33% loss in antioxidant activity from the initial 5.5 μmol TE/g using the hydrophilic ORAC assay. Degradation of α-tocopherol and other bioactive compounds was also the case in the study of Mancebo-Campos et al. [
50]. The authors evaluated five VOO from Toledo and Ciudad Real (Castilla-La Mancha, Spain) and noted a 10–17% decrease of this compound after 4 weeks of incubation at 60 °C.
3.4. Correlation Analyses
3.4.1. Principal Component Analysis (PCA)
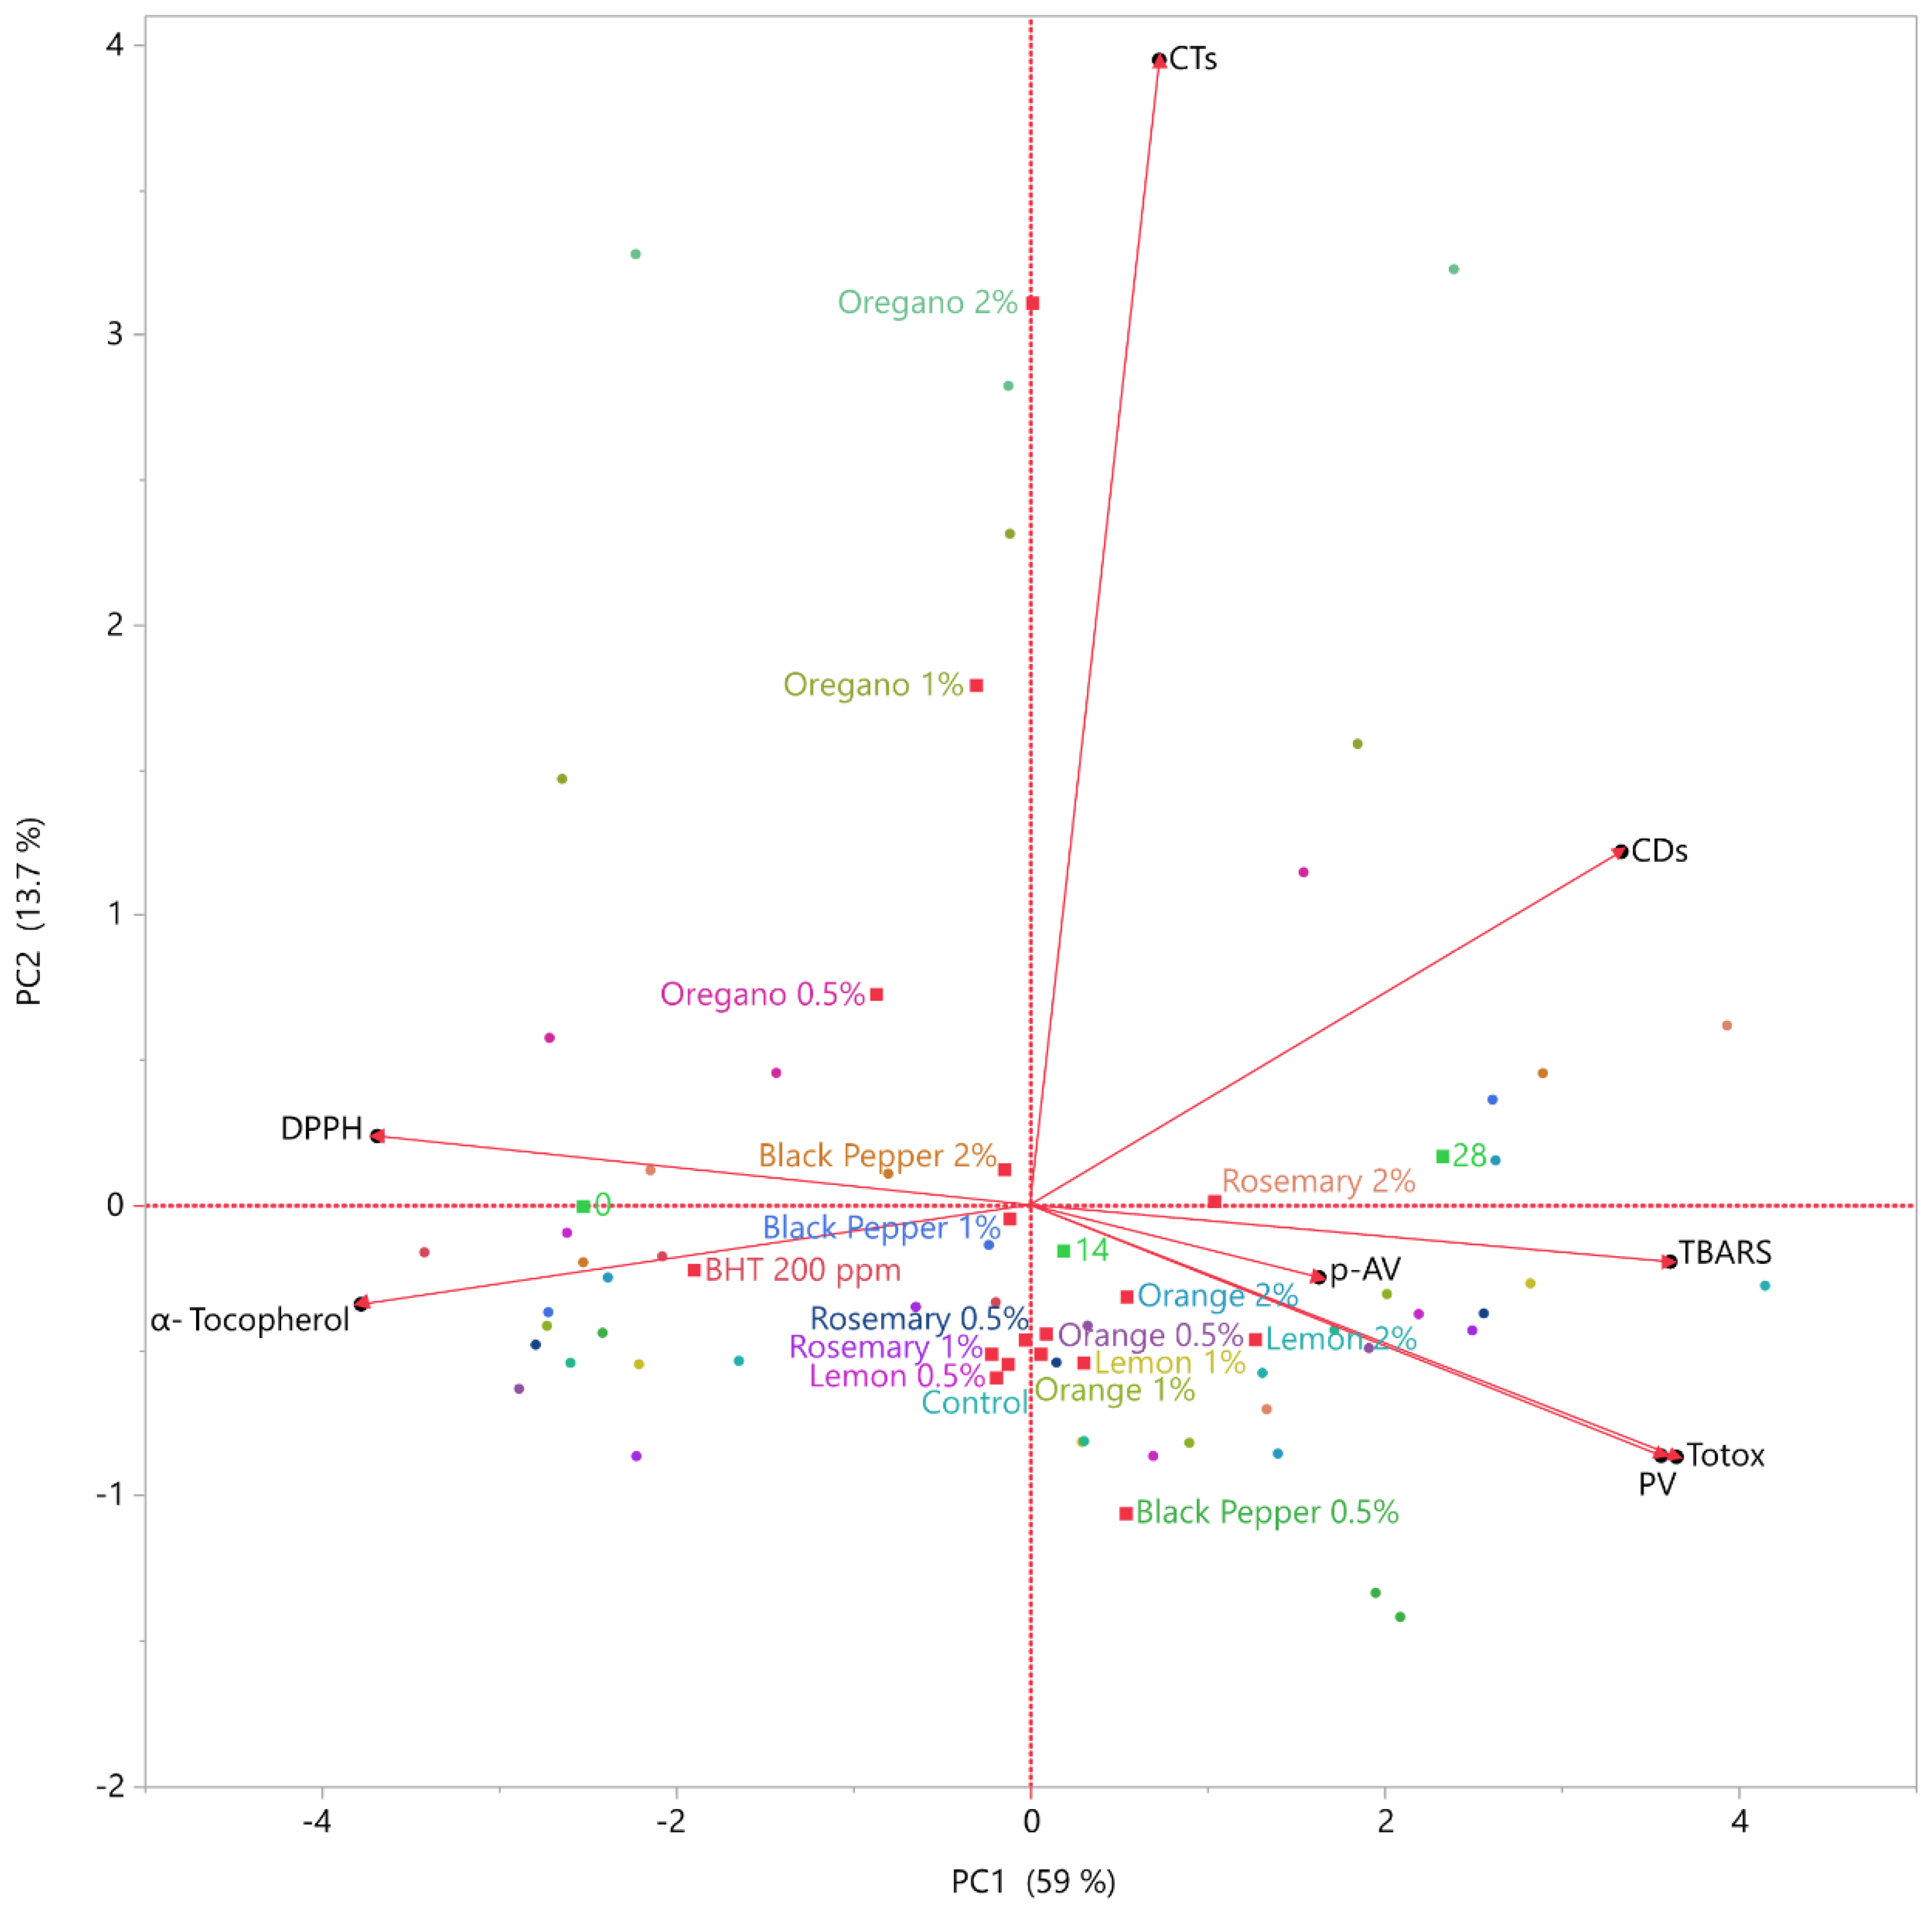
Principal component analysis (PCA) was performed using all oxidation and antioxidant indices. The first two components explained 72.64% of the total variance (PC1 = 58.98%, PC2 = 13.66%). PC1 was positively associated with PV, TBARS, CDs, and Totox, and negatively with DPPH and α-tocopherol, representing the overall oxidation–antioxidant balance. PC2 was dominated by CTs, reflecting differences in conjugated triene formation among treatments. The observed differences that both canonicals revealed were based on the different composition of EOs and their effect on flavored EVOO.
Table 4 and
Table 5 provide a clearer picture of the principal components and their correlation. The score plot showed a clear temporal separation along PC1, with Day 0 samples clustering at negative values and Day 28 samples at positive values.
The main variables that allowed characterization and discrimination of samples are shown in
Figure 3, where the PCA biplot revealed a clear separation of samples along PC1, which represents the oxidation–antioxidant gradient. Several colors were used to discriminate different samples. For instance, Day 0 samples clustered at negative PC1 values due to their higher α-tocopherol and DPPH levels, whereas Day 28 samples shifted to positive PC1 values, driven by increased PV, TBARS, CDs and Totox, as depicted in
Figure 3. PC2 was mainly associated with CTs, distinguishing oregano treatments from the rest. Overall, the PCA confirmed that storage time was the dominant factor affecting sample distribution, while specific essential oils (particularly oregano) introduced additional variability along PC2. To provide a clearer picture of the obtained results, it is observed that the proximity of four oxidation indicators (PV, TBARS, CDs, Totox) on the biplot indicated the high correlation and response to the 4-week storage period, ultimately representing the propagation of lipid oxidation. On the other hand, the antioxidant markers (α-tocopherol and DPPH) were clustered on the opposite side of PC1, confirming their antagonistic relationship with the oxidation products.
3.4.2. Discriminant Analysis (DA)
Discriminant analysis (DA) was applied to evaluate the ability of the measured oxidation and antioxidant indices to differentiate the treatments.
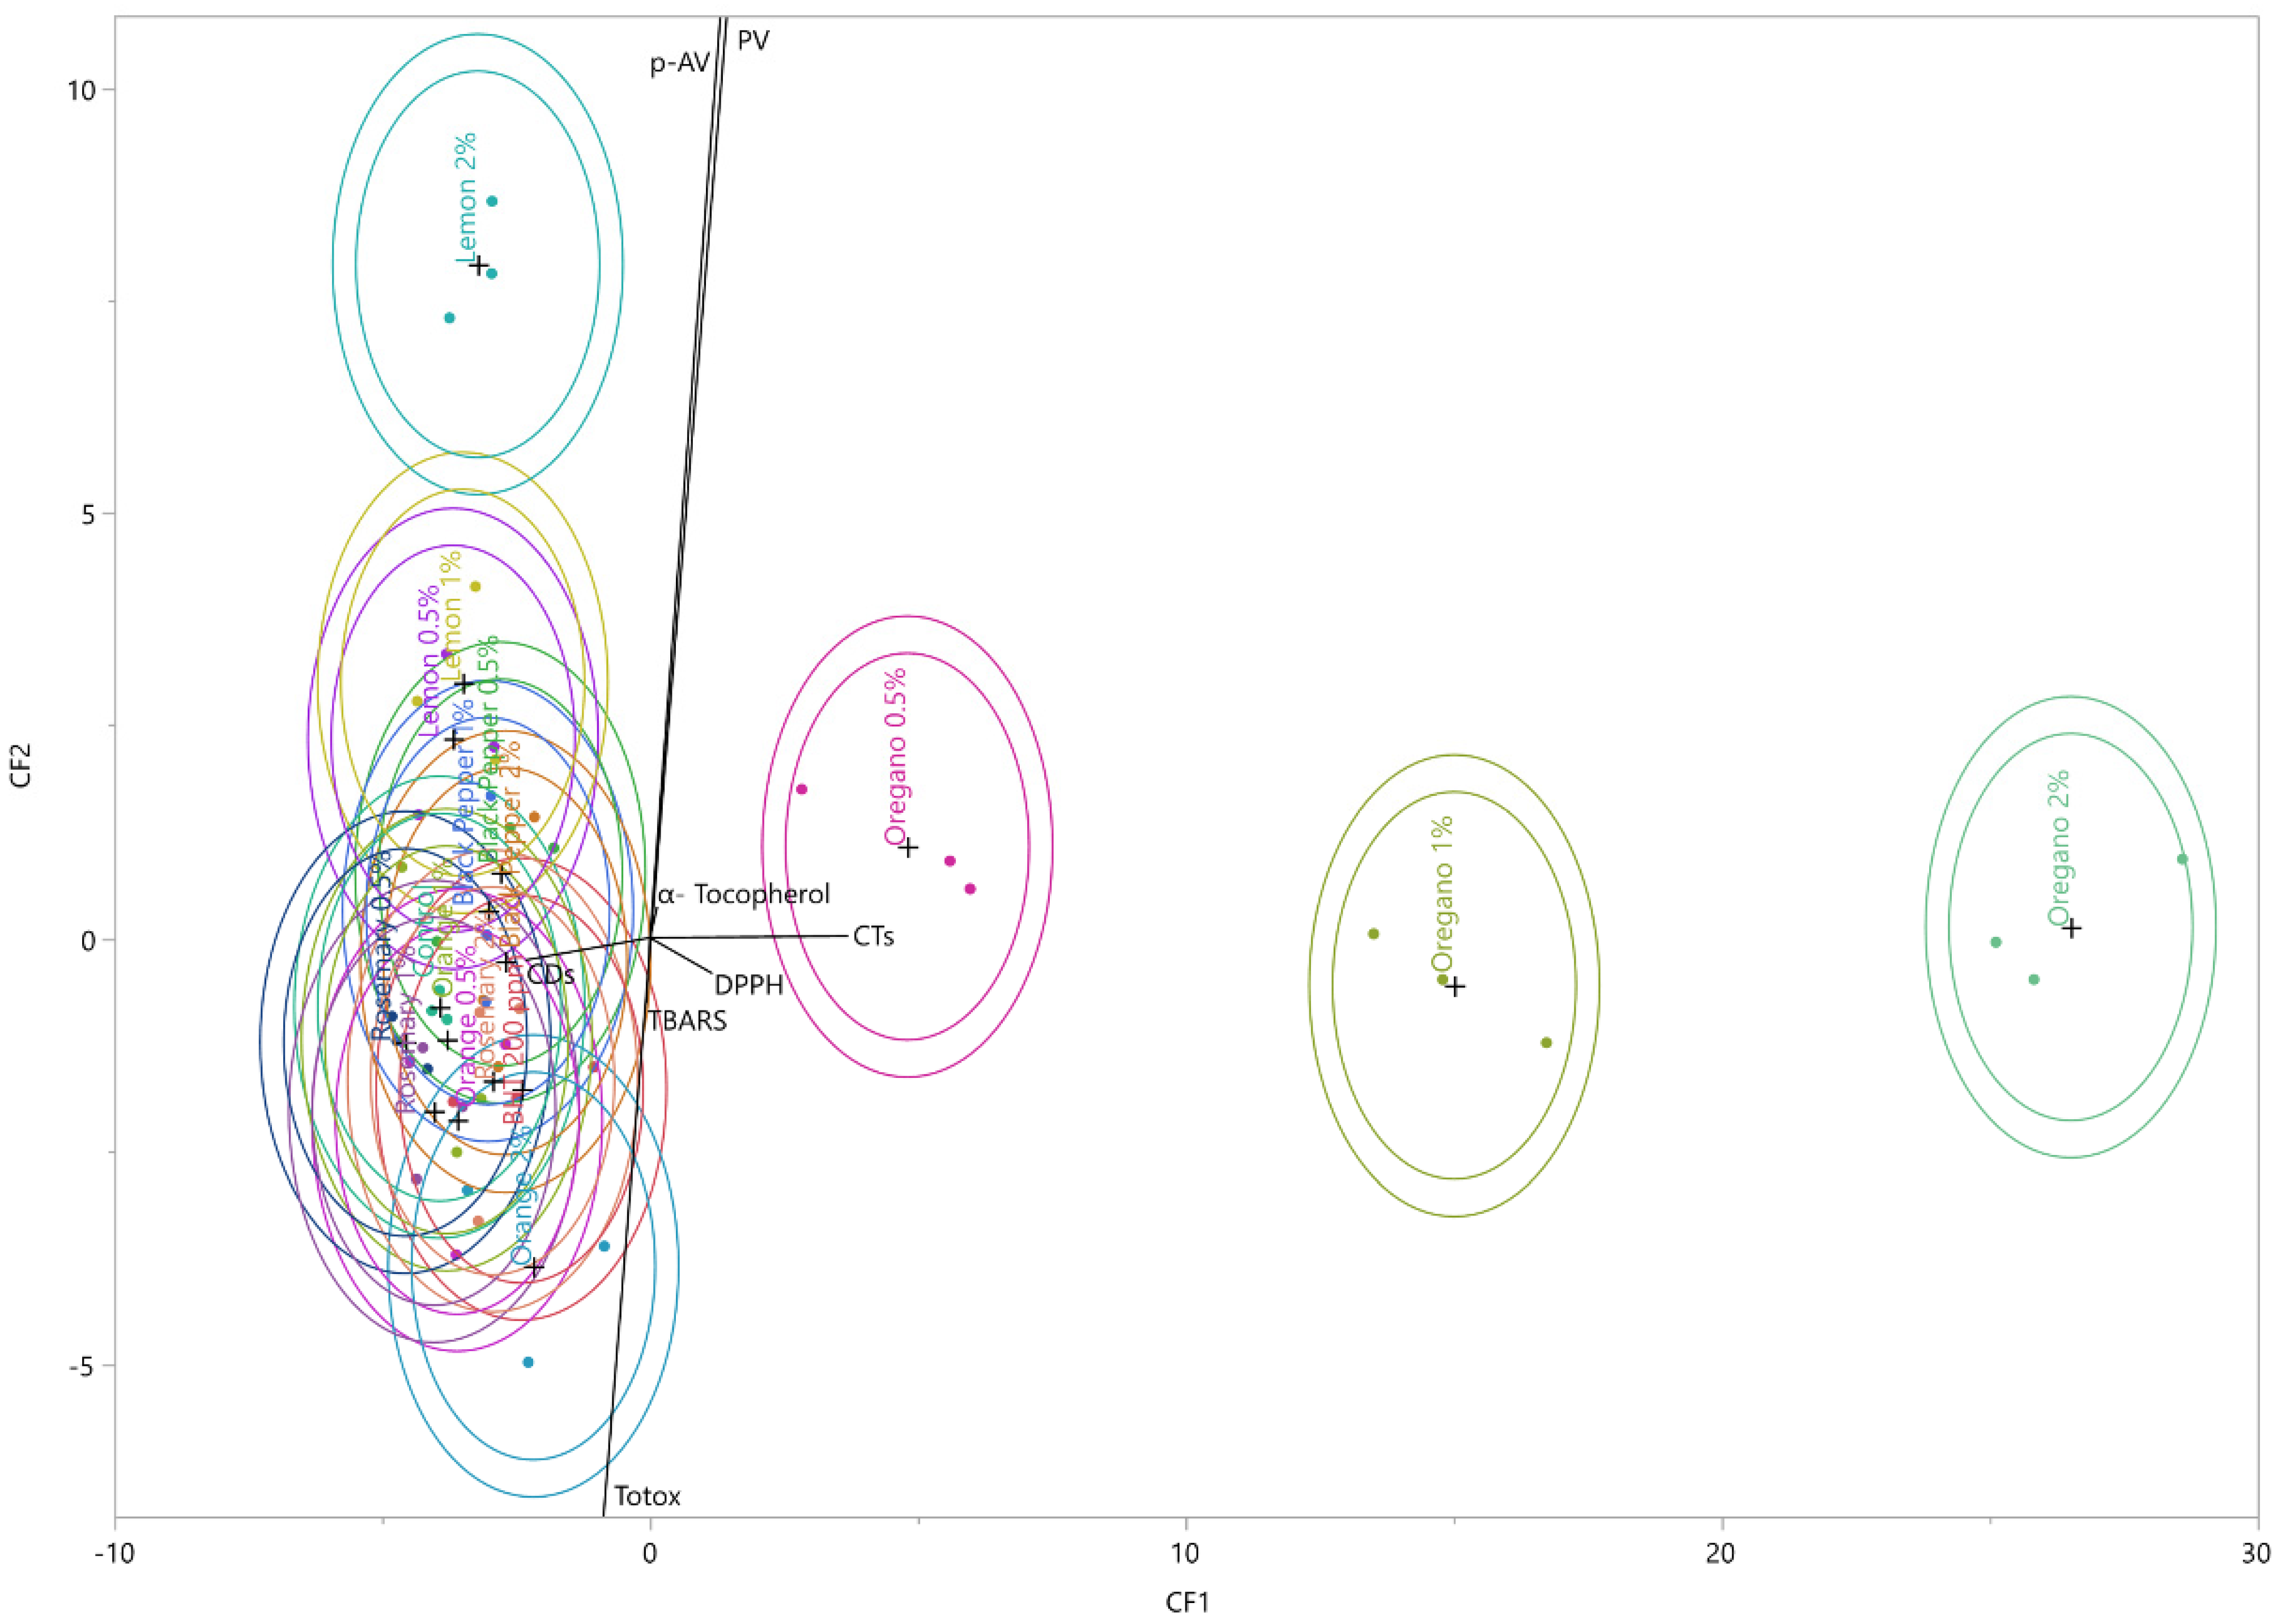
Table 6 provides further details about canonical DA. The first two canonical functions explained 95.0% of the total variation (Canonical 1 = 86.27%, Canonical 2 = 8.74%). Canonical 1 was strongly associated with CTs, clearly separating oregano treatments from all other samples. Canonical 2 was mainly driven by
p-anisidine value, distinguishing particularly the Lemon 2% samples. The obtained results are presented in
Table 7. The overall Wilks’ Lambda was highly significant (
p < 0.0001), confirming that the multivariate profiles differed markedly among treatments.
Clear multivariate separation was revealed through DA among treatments (Wilks’ Lambda < 0.0001). CF1, dominated by CTs, separated oregano samples, whereas CF2, driven by
p-anisidine value, distinguished Lemon 2%. The canonical plot confirmed distinct clustering patterns, indicating strong differences in oxidation profiles among treatments. The high
p-AV in the specific sample (Lemon 2%) leads to close proximity of the two variables. On the other hand, the correlation between high CT values in oregano-induced EVOO samples was also depicted in
Figure 4.
3.4.3. Hierarchical Cluster Analysis (HCA)
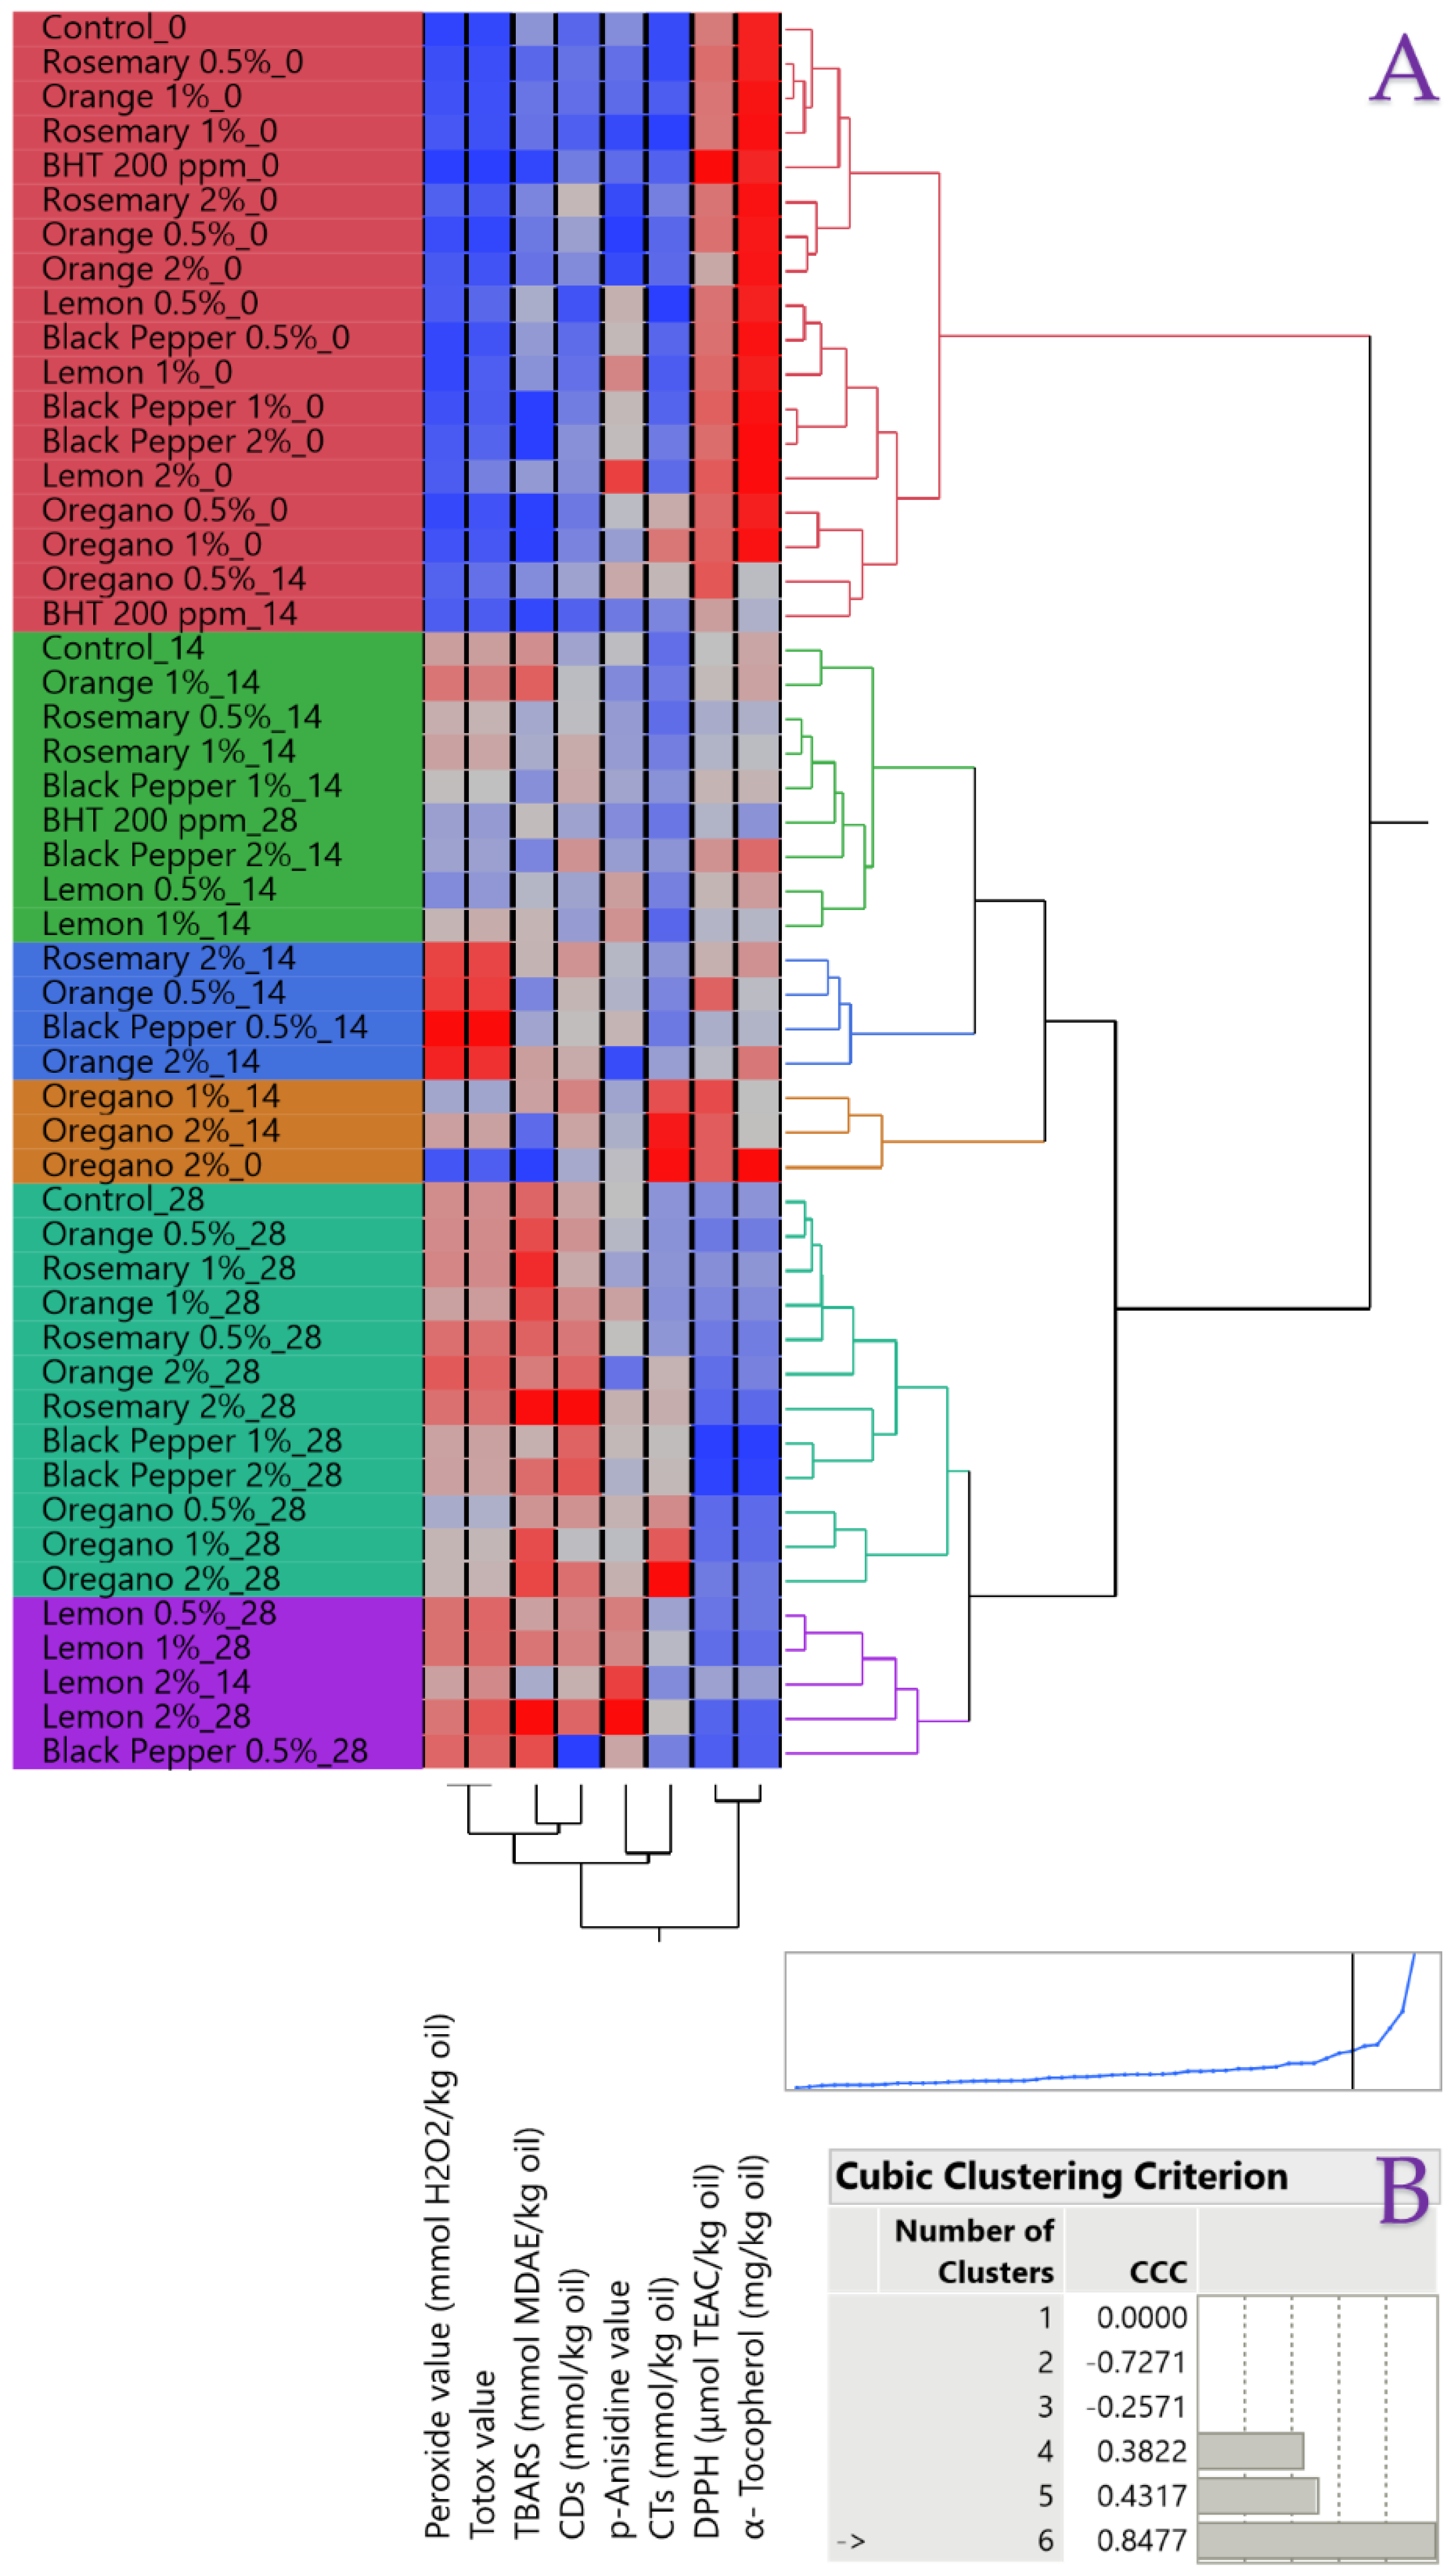
HCA revealed six distinct clusters among eight variables (including oxidation indices and antioxidant markers), confirming the multivariate patterns observed in PCA and DA. The color differentiation supports the interpretation of HCA (
Figure 5A) by means of high values (red color) and low values (blue color). For instance, the early-stage control sample had high values of α-tocopherol, medium-high radical-scavenging activity, but low values of PV and Totox. To that end, it can also be observed that oregano samples formed a separate cluster due to their high CTs, while citrus samples at advanced storage times grouped together because of elevated PV, CDs and Totox. Early-stage samples (Day 0) clustered separately, reflecting low oxidation and high antioxidant capacity. A distinct cluster characterized by high
p-anisidine values corresponded mainly to Lemon 2% samples. The Cubic Clustering Criterion (CCC) supported a six-cluster solution (
Figure 5B).
These multivariate patterns indicate that oregano and rosemary treatments consistently cluster closer to the BHT control, confirming their superior antioxidant performance. Citrus EOs cluster separately, reflecting their weaker or partially pro-oxidant behavior.
3.5. Chemical Fingerprint Examination Through FT-IR
FT-IR spectroscopy is a potent analytical technique in edible oils and fats that is currently employed in food research, given its simplicity, non-destructive nature, and straightforward operation [
51]. The molecular structure of a sample can be interpreted by relating absorbance bands to specific functional groups; therefore, FT-IR serves as a useful tool for monitoring and controlling the quality of flavored EVOOs. The spectra depicted in
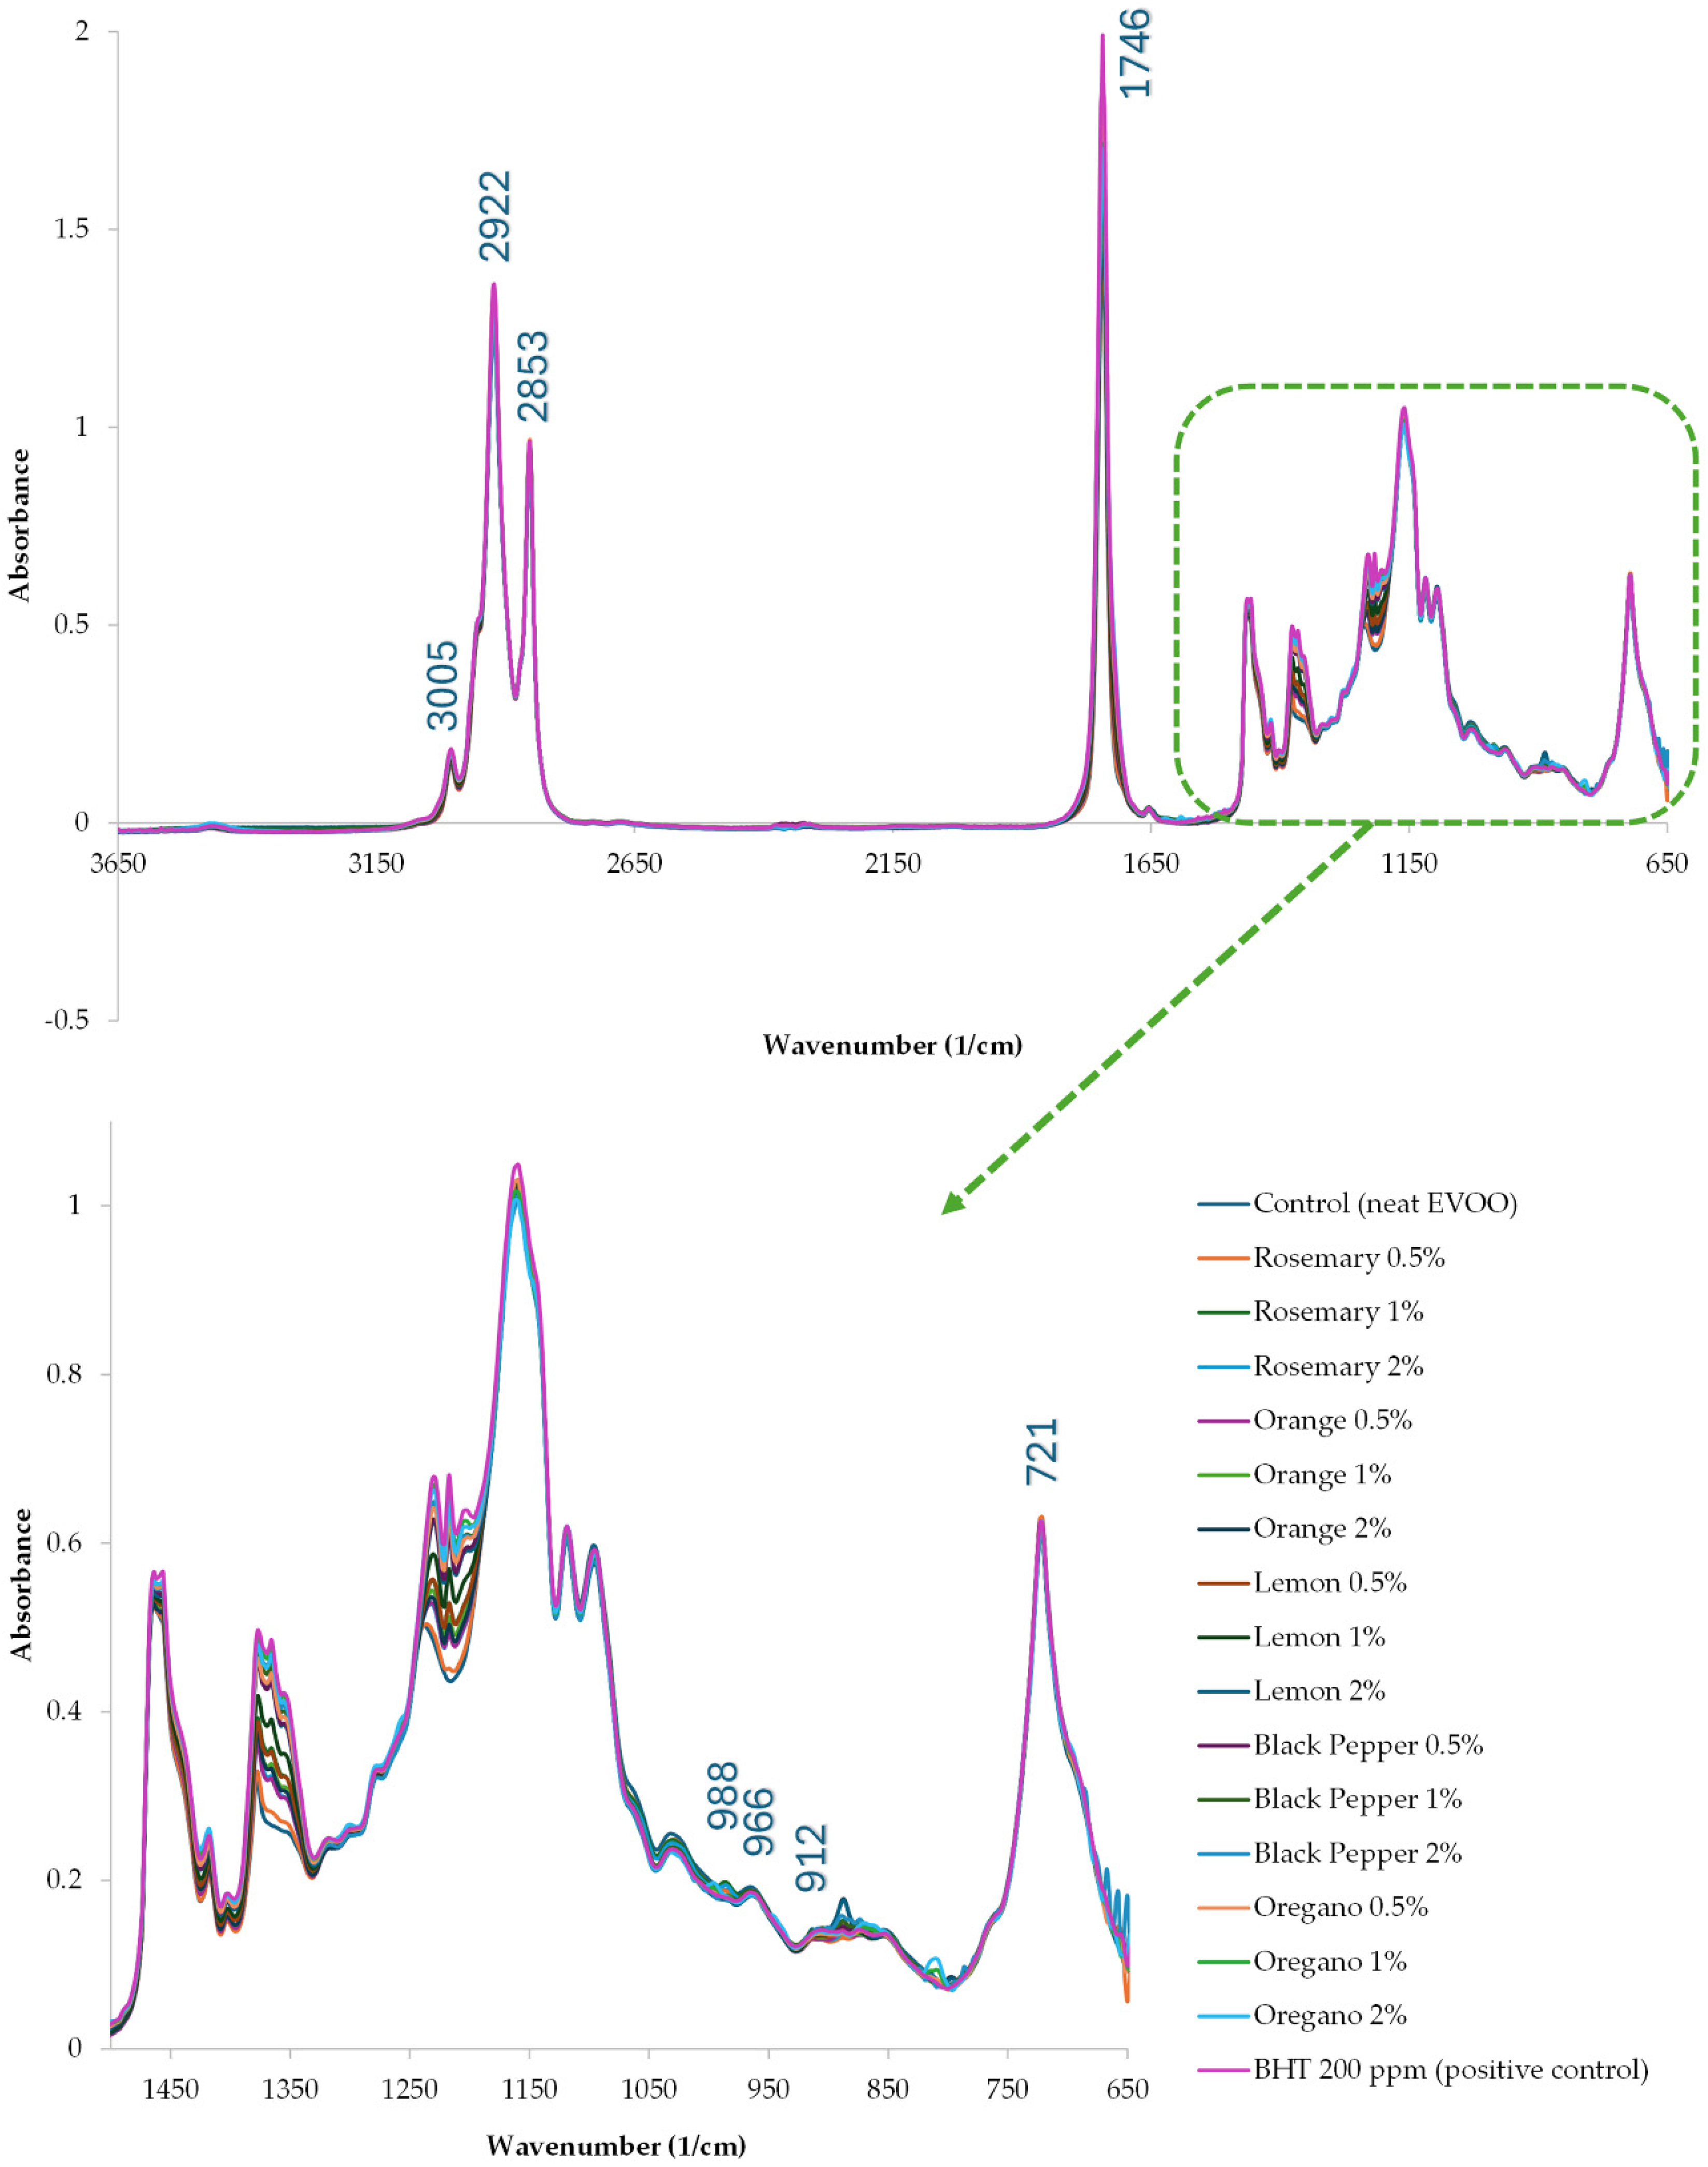
Figure 6 illustrate the characteristic peaks of fatty acids at pre-oxidation stages, while
Table 8 describes the exact absorbance of each band. Previous studies [
52,
53] have reported these major bands in detail.
Regarding the stretching of =C–H and C–H bonds in the aliphatic region (~3005, ~2922, and 2853 cm
−1), no significant changes were observed among treatments. A similar pattern was recorded for the ester carbonyl stretch at ~1746 cm
−1, indicating that EO addition at 0.5–2%
w/
w does not alter the fundamental triacylglycerol structure of EVOO. This finding clearly indicated that IR spectroscopy does not allow adequate discrimination between different flavored EVOOs, as also reported by Chahdoura et al. [
54] in a similar study.
However, subtle differences were observed in the fingerprint region of the FT-IR spectrum (1450–500 cm
−1). Higher absorbance was recorded in BHT-enriched EVOO compared to 0.5% oregano-enriched EVOO at ~1200 cm
−1, whereas 2% orange EO exhibited higher absorbance than the BHT positive control at ~900 cm
−1. It has been previously discussed [
55] that out-of-plane deformation vibration (=CH
2) and wagging vibration (C–H) assignments of pinene and limonene are depicted at ~880 cm
−1. In addition, in-plane deformation vibration (C–H) of 1,8-cineole could be identified at ~980 cm
−1, which may explain minor shifts in rosemary-treated samples.
The FT-IR bands observed at ~3400 cm−1 correspond to O–H stretching vibrations consistent with phenolic compounds such as carvacrol, identified by GC–MS in oregano EO. Similarly, the C–H stretching region (2920–2850 cm−1) reflects the presence of monoterpenes such as limonene, while the C–O stretching region (1050–1150 cm−1) aligns with ether-containing compounds such as 1,8-cineole from rosemary EO. These associations strengthen the link between FT-IR spectral features and the volatile profiles obtained by GC–MS.
Overall, FT-IR confirmed that EO addition does not induce structural modifications in EVOO lipids, while minor variations in the fingerprint region reflect the presence of specific EO constituents. Future studies employing chemometric tools may further resolve these subtle differences and enhance the discriminative capacity of FT-IR for flavored oils.
3.6. Essential Oils Aromatic Profile
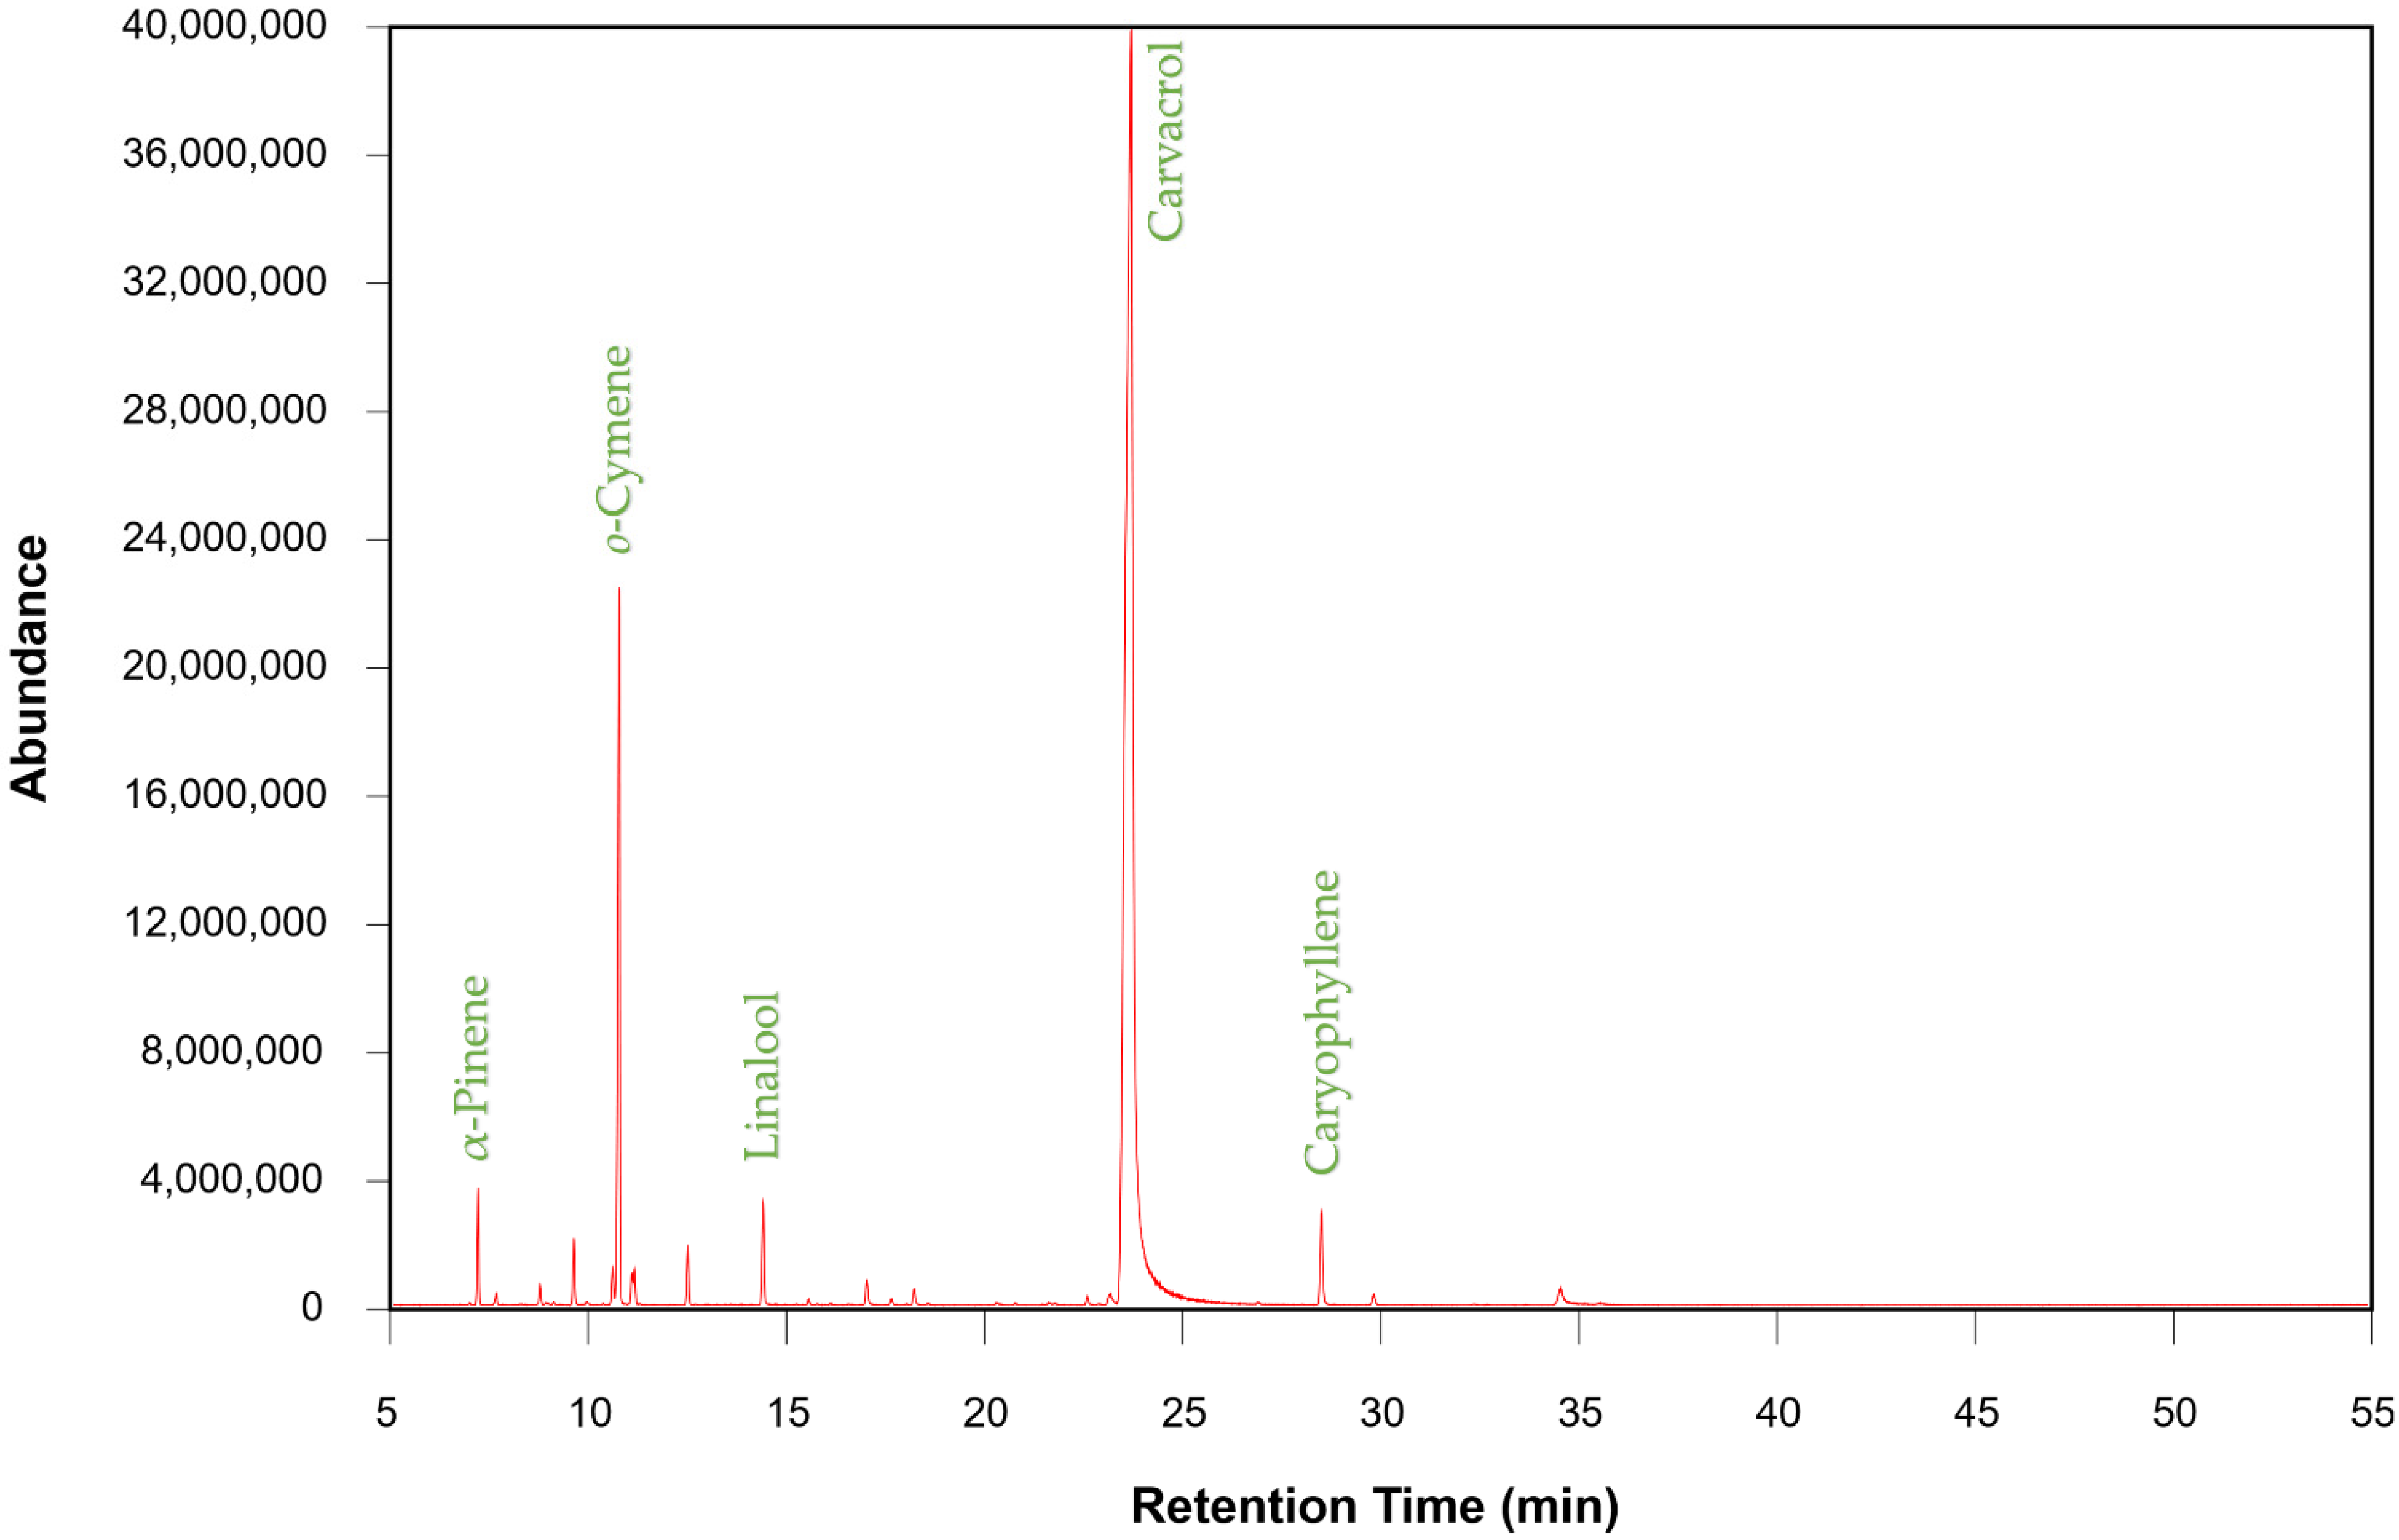
A representative GC–MS chromatogram of oregano EO is shown in
Figure 7 to illustrate the analytical profile and the identification of major volatile constituents. All five essential oils were analyzed using the same method, and their major volatile constituents are summarized in
Table 9. It was revealed that caryophyllene, limonene, carvacrol, and 1,8-cineole were the most abundant compounds found in the respective EOS, as also summarized in
Table 10. The composition among all EOs ranged from 0.08 to 87.8%. Our results were in line with previous investigations [
44,
56,
57] exploring the respective EO aromatic profile. Sesquiterpenes, especially caryophyllene, found in black pepper, may have a modest antioxidant activity; nevertheless, their effectiveness is not as strong as that of oregano phenolics [
58]. Furthermore, the high carvacrol content of oregano is consistent with previous results, with its high DPPH activity and low PV/Totox at days 14 and 28, which is an indication that the phenolic structure is extremely effective in lipid systems. Regarding rosemary’s cineole, camphor, and verbenone, these compounds explained their long-term preservation of FT-IR unsaturation markers and moderate PV suppression. Citrus oils were indeed dominated by limonene, a compound that is preferable for its unique aroma and antioxidant effects [
59]. However, our findings revealed possible pro-oxidant spikes (e.g., Orange 2% PV at Day 14), likely due to limonene’s susceptibility to oxidation under oxidative stress. To ensure maximum oxidative stability, oregano and rosemary EOs were found to be the most promising, especially at concentrations of 1–2%. Regarding sensory enhancement with moderate stability, lemon at 1% offered good pigment retention and acceptable oxidation control, along with its unique sensory attributes.
4. Conclusions
The present study evaluated the impact of five plant-derived essential oils on the oxidative stability and antioxidant capacity of EVOO under accelerated storage conditions. Our findings demonstrate that selected EOs can effectively enhance the oxidative stability of EVOO, with certain treatments approaching the performance of the synthetic antioxidant BHT. Among the tested EOs, oregano and rosemary—particularly at higher concentrations—emerged as the most promising natural fortification agents, offering substantial protection against both primary and secondary oxidation products.
Treatments enriched with phenolic-rich EOs also contributed to improved preservation of α-tocopherol, delaying the point at which oxidative reactions surpass the oil’s intrinsic antioxidant capacity. Across all treatments, α-tocopherol declines progressively during storage, confirming its active role in quenching lipid radicals throughout the oxidation process.
These results support the potential use of oregano and rosemary EOs as natural alternatives to synthetic antioxidants in EVOO, especially for products targeting mid-term shelf life. Future studies should investigate the full phenolic profile of EO-enriched oils and explore potential synergistic interactions between EO constituents and endogenous antioxidants such as α-tocopherol.
It is also important to acknowledge that accelerated oxidation at 60 °C does not fully replicate real-time storage conditions, and that no sensory evaluation was performed in the present study. Therefore, future work should include real-time shelf-life validation and sensory analysis to ensure both oxidative stability and consumer acceptability of EO-enriched EVOO.




 ,
,