
Bridging the Gap: A Scoping Review of Pre-Analytical Variability in Biofluid Metabolomics

 , , , , and
Abstract
1. Introduction
2. Materials and Methods
2.1. Inclusion and Exclusion Criteria
2.2. Data Extraction and Analysis
3. Results
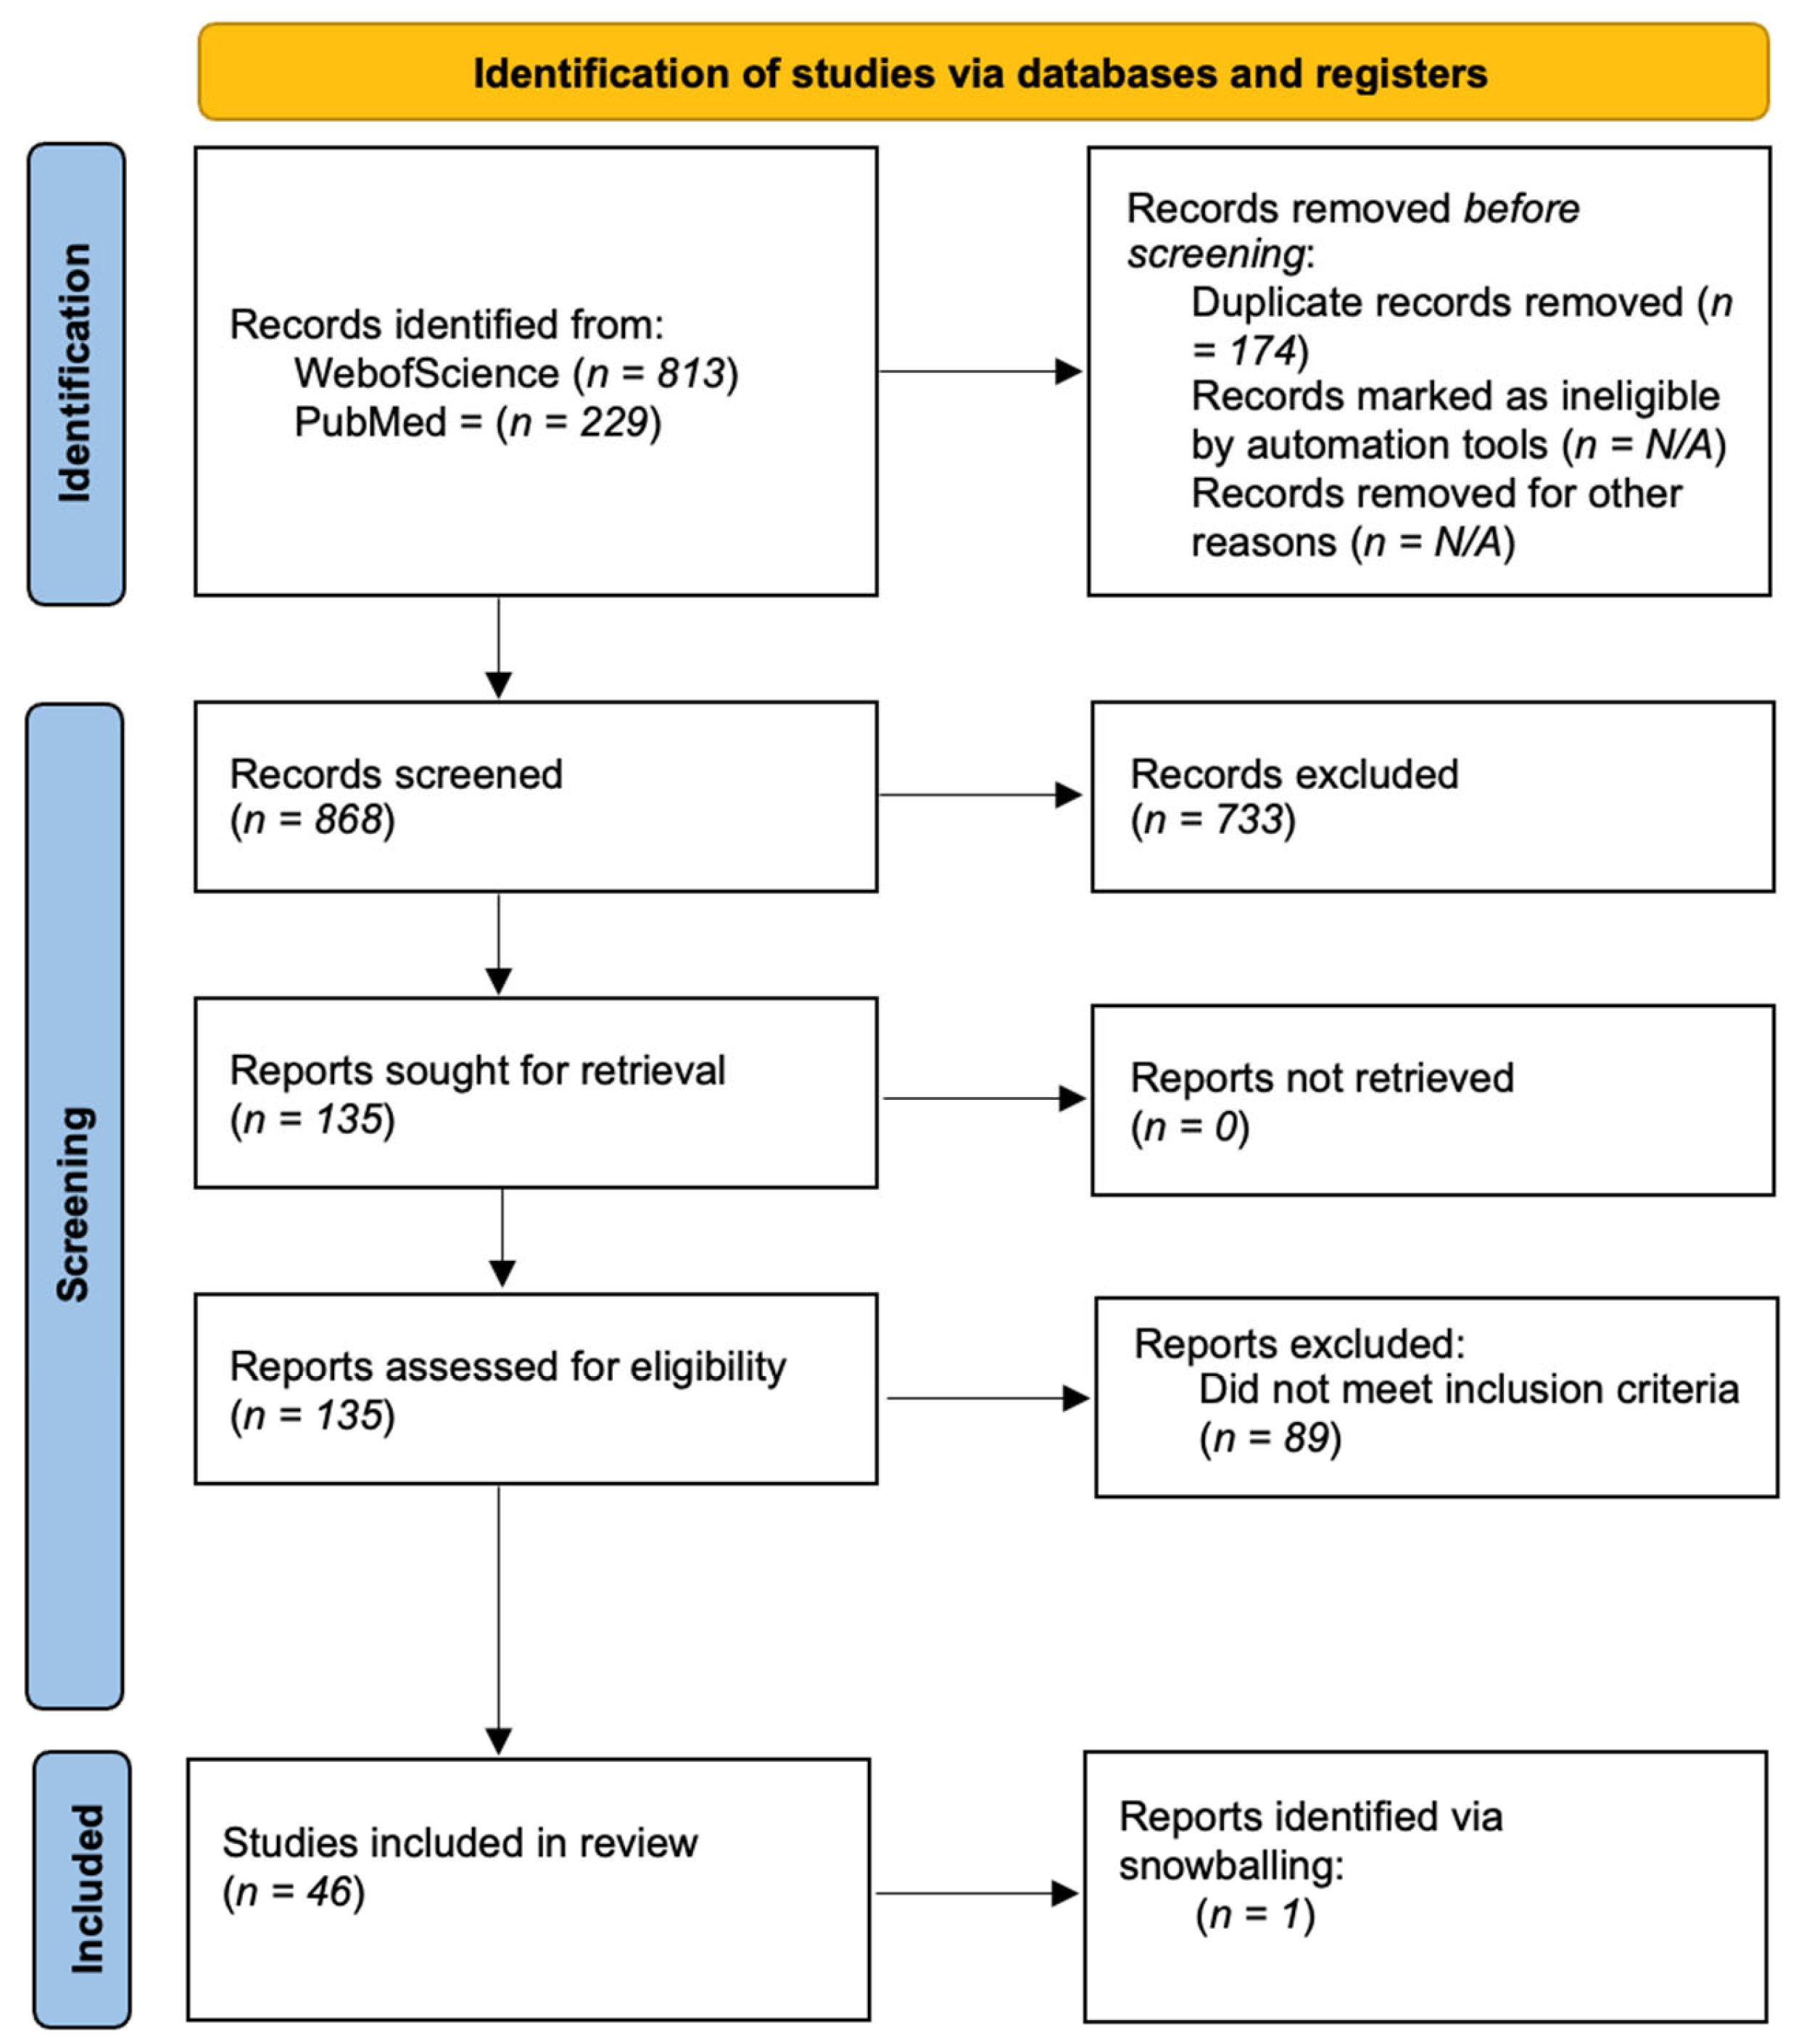
3.1. Study Characteristics
3.2. Sample Collection Variables

| Study | Sample Type | Variable/s Tested | Sample Size (n) | Analytical Method Used | Conclusions |
|---|---|---|---|---|---|
| Yin et al. 2013 [56] | Plasma and Serum | Blood collection tube types/Anticoagulants, Haemolysis, Storage temperature and time | 3 samples per anticoagulant type | Mass Spec (LC-MS) | Anticoagulants tested include lithium–heparinate, sodium fluoride, sodium citrate, potassium EDTA, and serum tubes. Lithium heparin and serum blood collection tubes interfere with metabolomic profiling. Hypoxanthine, sphingosine-1-phosphate, and linolenyl carnitine are identified as pre-analytical biomarkers of prolonged exposure of blood to room temperature. They can allow for the identification of systematic inaccuracies that arise during processing of whole blood that affect the quality of many samples and introduce random errors leading to outliers. Use of haemolysed samples should be avoided for metabolomic studies. Blood should be stored immediately in ice water after collection until further processing (for a fixed time; ideally not longer than 2 h). |
| Khadka et al. 2019 [58] | Plasma | Blood collection tube types/Anticoagulants | 70 (split between anticoagulants not specified) | Mass Spec (LC-MS) | Anticoagulants tested include EDTA-K2 and sodium citrate. EDTA-K2 and citrate anticoagulants influence both lipidomic and metabolomic profiles. Lipids and amino acids are more abundant in EDTA tubes compared to citrate tubes. Samples are recommended to be collected in EDTA tubes. |
| Hebels et al. 2013 [53] | Plasma | Blood collection tube types/Anticoagulants | 4 samples per anticoagulant type | Mass Spec (LC-MS) | Anticoagulants tested include citrate, EDTA, or heparin tubes. Anticoagulants strongly influence metabolite concentrations. Irrespective of the anticoagulant used, however, the main source of variation is from the donors and delayed processing time (up to 24 h, samples kept at room temperature). Overall heparin tubes are recommended over EDTA or citrate. |
| Zhou et al. 2017 [52] | Plasma and Serum (animal) | Blood collection tube types/Anticoagulants | 12 samples per anticoagulant type | Mass Spec (LC-MS) | Anticoagulants tested include EDTA-K2, heparin lithium, heparin sodium, sodium citrate, and potassium oxalate for plasma samples and serum tube containing separation gel. Anticoagulants influence the MS detection of metabolites by introducing exogenous metabolites such as citric acid and edetic acid from serum collection tubes that can mask the detection of endogenous metabolite peaks. The use of separation gels can introduce intra-group variation, which can sway biomarker identification. The use of heparin plasma tubes is recommended, as they demonstrate wider metabolite coverage with the least influence from exogenous metabolite peaks. |
| Barri et al. 2013 [54] | Plasma and Serum | Blood collection tube types/Anticoagulants | 21 samples per anticoagulant | Mass Spec (LC-MS) | Anticoagulants tested include EDTA-K2, lithium heparin, and serum tubes. Anticoagulants act as a source of exogenous contamination and impact the composition of both serum and plasma samples. Increased concentrations of hypoxanthine and xanthine can act as markers of coagulation in serum samples. Heparin plasma tubes are recommended for LC-MS analysis, as they demonstrated the least amount of contamination and matrix effect compared to citrate and EDTA plasma tubes. Serum samples are also recommended over plasma so long as all samples are collected and analysed following the same procedure. |
| Bando et al. 2010 [55] | Plasma (animal) | Blood collection tube types/Anticoagulants | 8 samples per anticoagulant type | Mass Spec (GC-MS) | Anticoagulants tested include EDTA-K2 and sodium heparin. EDTA tubes are recommended over sodium heparin tubes for plasma collection, as the EDTA peak can easily be identified and excluded from analysis, whereas the sodium heparin-associated peaks are harder to identify, due to their overlap with endogenous metabolites. |
| López-Bascón et al. 2016 [57] | Plasma and Serum | Blood collection tube types/Anticoagulants | 13 samples per anticoagulant type | Mass Spec (GC-MS) | Anticoagulants tested include plastic serum tubes with spray-coated silica (serum), spray-coated silica and a polymer gel (serum–gel), spray-coated silica tubes with heparin (plasma), and heparin tubes with polymer gel (plasma–gel). The use of polymeric gels impacts amino acid and glycerolipid metabolism. |
| Ghini et al. 2022 [45] | Plasma and Serum | Blood collection tube types/Anticoagulants | 210 EDTA-plasma samples 24 citrate-plasma samples 30 serum samples | NMR | Both serum and plasma collection tubes and their anticoagulants introduce intense signals in NMR spectra. |
| Loo et al. 2020 [46] | Plasma and Serum | Blood collection tube types/Anticoagulants | 5 samples per anticoagulant | NMR | Anticoagulants tested include SST II Advance gel and Plain clot (serum), Plasma lithium heparin (LH and LH PST II gel), and EDTA-K2 and K3. Type of blood collection tube used introduces intense signals associated with each tube including higher lactate (heparin and serum tubes), pyruvate (K3-EDTA tube), and acetate (K2-EDTA tube) levels. |
| Sotelo-Orozco et al. 2021 [48] | Plasma and Serum | Blood collection tube types/Anticoagulants | 8 samples per anticoagulant | NMR | Anticoagulants tested include serum, ACD, sodium citrate, EDTA, sodium fluoride, and sodium heparin tubes. Heparin and EDTA tubes are comparable to serum tubes for NMR-based metabolomics. ACD and citrate plasma tubes introduce interfering peaks from citrate and glucose. Differences between subjects are preserved regardless of tube type used. |
| Xiong et al. 2024 [59] | Plasma and Serum | Blood collection tube types/Anticoagulants | 12 samples per anticoagulant type | NMR | Anticoagulants tested include lithium heparin plasma, fluoride/oxalate plasma, or serum tubes. Metabolite profiles of serum and lithium heparin plasma are comparable and behave similarly in response to delayed erythrocyte separation. |
| Pinto et al. 2014 [47] | Plasma | Blood collection tube types/Anticoagulants | 5 samples per anticoagulant | NMR | Anticoagulants tested include sodium heparin and EDTA tubes. Both heparin and EDTA tubes introduce interfering peaks that can overlap with sample peaks. Though EDTA tubes present more interfering peaks compared to heparin tubes, both anticoagulants are recommended for NMR analysis of the plasma metabolome, as the level of interfering peaks is lower than the peaks of interest. |
3.3. Pre-Centrifugation Conditions
| Study | Sample Type | Variable/s Tested | Sample Size (n) | Analytical Method Used | Conclusions |
|---|---|---|---|---|---|
| Niemuth et al. 2015 [60] | Plasma and Whole Blood (animal) | Delayed processing time | 5 whole blood samples 20 plasma samples | NMR | Clear differences between whole blood and plasma observed, but changes associated with plasma processing delays would only affect the interpretation of a few metabolites at the level of clinical relevance including glutathione and taurine. |
| Ghini et al. 2022 [45] | Plasma and Serum | Delayed processing time and storage temperature | 234 plasma and 150 serum samples | NMR | Delayed blood processing significantly alters lactate and glucose levels in plasma, suggesting delayed blood processing negatively affects plasma quality. |
| Malmodin et al. 2024 [61] | Plasma | Pre-centrifugation storage temperature, delayed processing time, and exposure to light | 951 | NMR | SCFA, pyruvate, glucose, lactate, and ornithine demonstrate distinct incubation temperature-dependent characteristics. Decrease in SCFA at 4 °C was found to be reversible through the increase in temperature to 22 °C prior to centrifugation. Light exposure has minimal effect. Plasma sampling should be conducted immediately at room temperature or stored at 4 °C followed by warming to room temperature prior to centrifugation. |
| Bernini et al. 2011 [62] | Plasma and Serum | Delayed processing time and temperature | 10 plasma and 10 serum samples | NMR | The metabolite degradation processes are time-dependent and temperature-dependent for both plasma and serum: incubation at 25 °C causes more profound changes in the NMR profile. Notably, a decrease in glucose concentrations was observed in both sample types and an increase in lactate. Time between sample collection and processing should not exceed 2 h with samples being stored at 4 °C. |
| Brunius et al. 2017 [63] | Plasma | Delayed processing time and temperature | 111 | NMR | Pre-centrifugation delays and storage temperature significantly impacted metabolite profiles with most metabolite drift patterns being highly reproducible between individuals. Alterations were more pronounced at 22 °C compared to 4 °C with associations to specific groups of metabolites; therefore, pre-centrifugation storage at 22 °C should be avoided. Pyruvate, lactate, and ornithine were identified as markers for discriminating between pre-centrifugation temperatures. Pre-centrifugation delays of up to 36 h at 4 °C have minimal effects on overall metabolite changes. |
| Debik et al. 2022 [64] | Plasma and Serum | Delayed processing time | 20 plasma and 20 serum samples | NMR | Centrifugation delay significantly impacts metabolite profiles, especially those associated with anaerobic glycolysis. Plasma samples were more robust against centrifugation delays compared to serum samples. |
| Santos Ferreira et al. 2019 [65] | Plasma and Serum | Delayed processing time, pre-centrifugation storage temperature | 37 plasma and 37 serum samples | NMR | Overall, delays of up to 48 h and storage at either 4 °C or 21 °C prior to centrifugation had minimal effects on metabolite concentrations. Individual metabolites identified to be sensitive to processing delays and storage temperature included pyruvate, with mean concentrations decreasing when stored for 24 h at 4 °C but increasing when stored for 24 h at 21 °C compared to control. |
| Jobard et al. 2016 [66] | Plasma and Serum | Delayed processing time, pre-centrifugation storage temperature | 189 plasma and 192 serum samples | NMR | Storage of samples at 4 °C following collection slowed down the metabolome degradation process in both plasma and serum samples compared to room temperature storage for up to 6 h prior to centrifugation. Increased serum clot contact time at room temperature significantly altered the metabolome of serum samples. |
| Loo et al. 2020 [46] | Plasma and Serum | Pre-centrifugation storage temperature (serum) and sample heating (plasma) | 15 serum and 15 plasma samples | NMR | Storage of serum samples at 20 °C for up to 48 h prior to processing impacted individual metabolite levels (glucose decreased and lactate increased). Heating of plasma samples at 56 °C for 30 min prior to processing caused major systematic changes in metabolite profiles increasing levels of triglycerides, lactate, alanine, and glycerol post heating and decreased relative concentrations of α-1-acid-glycoprotein; therefore, it should be avoided. |
| Xiong et al. 2024 [59] | Plasma and Serum | Delayed processing time | 168 plasma and 84 serum samples | NMR | The storage of samples at 4 °C for 24 h with a fluoride/oxalate additive resulted in the least impact on metabolite profiles; however, the overall impact of processing delays was influenced by the blood tube/anticoagulant used. |
| Altmann et al. 2025 [67] | Plasma and Serum | Delayed processing time | 60 plasma and 30 serum samples | NMR | The storage of samples at room temperature for <8 h prior to centrifugation affects plasma and serum samples differently, with metabolites demonstrating differences in stability depending on the blood collection tube type used. Lactic acid and the ratio between lactic acid and glucose were found to be the least stable with a stability time of 24–45 min and 21–32 min, respectively; therefore, they can be potentially used as markers of sample quality. |
| Fliniaux et al. 2011 [68] | Serum | Delayed processing time and storage temperature | 42 | NMR | Prolonged storage (>4 h) of blood at room temperature can be characterised by increased concentrations of lactate and decreased concentrations of glucose in serum samples. |
| Trezzi et al. 2016 [73] | Plasma | Pre-centrifugation storage temperature and delayed processing time | 18 | Mass Spec (GC-MS) | Pre-centrifugation delays had a minor impact on metabolite concentration. Temperature at which samples are stored between time of collection and centrifugation is a key factor that can influence metabolite concentrations—recommend storing samples on ice following collection. Lactic acid and ascorbic acid identified to be temperature-sensitive metabolites. Samples of high pre-centrifugation quality identified as those that were stored either on ice for ≥3 h or at room temp for <3 h. |
| Dunn et al. 2008 [74] | Serum | Pre-centrifugation storage time | 40 | Mass Spec (GC-MS) | Changes to the serum metabolome caused by storage at 4 °C for up to 24 h were minimal with no detectable variability in comparison to samples frozen immediately at −80 °C post collection. |
| Khadka et al. 2019 [58] | Plasma | Delayed processing time and temperature | 70 | Mass Spec (LC-MS) | Storage for up to 24 h at room temperature or at 4 °C did not significantly impact the metabolome in both plasma and serum samples; however, more lipids (e.g., lysophosphatidylcholines, phosphatidylethanolamines) were elevated in EDTA tubes when stored at room temperature compared to 4 °C. Sample processing recommended to be completed within 24 h post collection at 4 °C. |
| Wang et al. 2023 [69] | Plasma | Delayed processing time, pre-centrifugation storage temperature | 829 | Mass Spec (LC-MS) | Three lipid classes (phosphatidylinositol, hexosylceramide and SM) identified to be stable against delayed processing time (≤4 h) and storage temperature (4 °C, 21 °C or 30 °C). The metabolome in samples cooled immediately to 4 °C following collection and storage for up to 24 h demonstrated the most stability in lipid profiles. |
| Wang et al. 2018 [70] | Plasma | Delayed processing time | 72 | Mass Spec (LC-MS) | Glucose, lactate, pyruvate, and 5-oxoproline concentrations were significantly altered because of processing delays (up to 48 h, stored at 4 °C). Prolonged processing delays resulted in poor reproducibility and impacted concentrations of metabolites involved in glycolysis, TCA cycle, glutathione metabolism, γ-glutamyl amino acid, and several fatty acid subtypes. |
| Zheng et al. 2021 [71] | Plasma | Pre-centrifugation storage temperature and delayed processing time | 471 | Mass Spec (LC-MS) | Delays in plasma centrifugation (up to 3.5 h) significantly impacted the metabolome regardless of the storage temperature (4 °C, 25 °C, 37 °C); therefore, pre-centrifugation delay should be as short as possible. |
| Jain et al. 2017 [72] | Plasma | Delayed processing time and storage temperature | 9 | Mass Spec (LC-MS) | Centrifugation delays of up to 20 h (storage at room temperature) significantly impacted metabolites from select pathways including glycolysis/gluconeogenesis/and pyruvate metabolism, TCA cycle, and gamma-glutamyl amino acid; however, the extent of the impact is influenced by inter-individual variation. Metabolites identified as potential markers of processing delays include 5-oxoproline, lactate, pyruvate, and fumarate, as well as the ratio between arginine and ornithine |
| Nishiumi et al. 2018 [75] | Plasma | Delayed processing time and storage temperature | 6 | Mass Spec (GC and LC-MS) | Storage time and temperature significantly influenced individual metabolite concentrations in plasma samples with increased levels of sucrose and pyruvic acid identified as potential markers of storage at room temperature and decreased pyruvic acid as a marker for cold temperature storage. Hypoxanthine has been identified as a potential marker for storage time with concentrations increasing with increased time. Immediate cooling and centrifugation of blood samples is recommended for the metabolomic analysis of plasma using both GC and LC-MS platforms. |
| McClain et al. 2021 [40] | Serum | Pre-centrifugation clotting time | 26 | Mass Spec (GC-MS and LC-MS) | Increased clotting time (up to 2 h) significantly impacts metabolite levels. |
3.4. Centrifugation Parameters
| Study | Sample Type | Variable/s Tested | Sample Size (n) | Analytical Method Used | Conclusions |
|---|---|---|---|---|---|
| Jobard et al. 2016 [66] | Plasma and Serum | Impact of centrifugation parameters | 189 plasma and 192 serum samples | NMR | Centrifugation temperature (20 °C vs. 4 °C), rotational speed (2000 vs. 3000× g), and time (10 vs. 20 min) did not significantly impact plasma and serum metabolome profiles. |
| Anderson et al. 2020 [78] | Synovial Fluid (animal) | Centrifuging vs. not centrifuging samples | 18 | NMR | Centrifuging synovial fluid samples prior to freezing aided in the removal of contaminants in the supernatant associated with intracellular material and is, therefore, recommended. |
| Lesche et al. 2016 [77] | Plasma | Impact of centrifugation parameters | 20 | NMR and Mass Spec (LC-MS) | Centrifugation of samples at 1500× g for 10 min or at 3000× g for 5 min at 20 °C significantly impacted plasma metabolomic profiles when analysed using NMR and LC-MS. |
3.5. Post-Centrifugation Handling and Freezing Delays
| Study | Sample Type | Variable/s Tested | Sample Size (n) | Analytical Method Used | Conclusions |
|---|---|---|---|---|---|
| Ghini et al. 2022 [45] | Plasma and Serum | Post-centrifugation processing delay | 234 plasma and 150 serum samples | NMR | Delayed time between centrifugation and freezing resulted in oxidative and redox-related degradation. This degradation caused a decrease in citrate and proline levels, which can act as indicators of delayed freezing. |
| Bernini et al. 2011 [62] | Plasma and Serum | Post-centrifugation freezing delay | 4 plasma and 5 serum samples | NMR | Freezing delays of up to 24 h resulted in a progressive decreased concentration of triglycerides, proline, choline, citrate, and histidine. Citrate showed chemical shift changes, while proline and choline were more stable in plasma EDTA than fluoride/oxalate-treated samples. Plasma was more stable when kept at room temperature than serum. To minimise metabolome degradation, samples should be immediately frozen at −80 °C after centrifugation. |
| Jobard et al. 2016 [66] | Plasma and Serum | Post-centrifugation freezing delay | 189 plasma and 192 serum samples | NMR | Post-centrifugation delays in freezing (15 min vs. 1 h) did not significantly impact plasma and serum metabolomes. |
| Altmann et al. 2025 [67] | Plasma and Serum | Post-centrifugation freezing delay | 27 plasma and 27 serum samples | NMR | Post-centrifugation delays in freezing (up to 8 h) significantly impacted lipid concentrations in serum samples observed at the 2 h delay time point. Lactic acid, the least stable metabolite in plasma samples, was found to be stable for up to 4.3 h in serum. Samples collected in lithium–heparin tubes demonstrated higher metabolite stability to post-centrifugation delay compared to EDTA tubes. |
| Volani et al. 2017 [80] | Plasma | Post-centrifugation processing delay (sample drying) | 69 | Mass Spec (LC-MS) | Time of drying of samples prior to storage influences the final metabolome, with some metabolites demonstrating rapid degradation or generation over the first 48 h at room temperature. Therefore, having a longer drying step should be avoided, as it would significantly change the concentrations of these metabolites e.g., methionine sulfoxide, glutamic acid, and histidine. |
| McClain et al. 2021 [40] | Serum | Post-centrifugation storage time | 52 | Mass Spec (GC-MS and LC-MS) | Storage in the fridge for up to 24 h caused moderate changes to the overall metabolome; however, the degree of impact changed depending on individual metabolites. |
| La Frano et al. 2018 [79] | Serum | Post-centrifugation freezing delay | 20 | Mass Spec (GC and LC-MS) | Delayed freezing (three days at room temperature followed by nine days at 4 °C) following centrifugation caused significant changes on metabolite concentrations, which varied depending on the metabolite class. The serum metabolome, however, demonstrates stability despite delays in freezing. |
| Kamlage et al. 2014 [81] | Plasma | Post-centrifugation short term storage (wet ice, room temperature or at 12 °C for up to 16 h) | 23 | Mass Spec (GC and LC-MS) | The short-term storage of plasma at 4 °C or 12 °C resulted in the less variation in the metabolome compared to storage at room temperature. However, all storage temperatures caused distinct changes to the metabolome compared to immediate processing. |
3.6. Storage Conditions
| Study | Sample Type | Variable/s Tested | Sample Size (n) | Analytical Method Used | Conclusions |
|---|---|---|---|---|---|
| Jaggard et al. 2021 [88] | Synovial Fluid | Impact of short- and long-term storage | 75 | NMR | The majority of metabolites affected by short term storage (up to 12 h either at room temperature or at 4 °C) were associated with energy synthesis (2-ketoisovalerate, valine, dimethylamine, succinate, 2-hydroxybutyrate, and acetaminophen glucuronide). Long term storage (10–12 months at −80 °C) significantly impacted the concentrations of 3-hydroxybutyrate, acetate, succinate, creatine, dimethyl sulfone, and N-N dimethylglycine, which were observed to decrease, whilst an increase in acetoacetate was observed. |
| Damyanovich et al. 2000 [89] | Synovial Fluid | Impact of short- and long-term storage | 12 | NMR | Prolonged storage (>1 year at −75 °C) caused significant signal reductions for several metabolites including glucose, N-acetyl glycoproteins, CH2-chain, and CH3-terminal and resonances of lipoproteins, valine, leucine, and isoleucine. Short-term storage (<24 h) did not significantly impact the metabolome. |
| Trabi et al. 2013 [82] | Plasma (animal) | Impact of long-term storage | 22 | NMR | Metabolome was stable for up to 15 years in storage at −20 °C with only a few metabolites identified as sensitive to long-term storage including Betaine CH3 group, Betaine CH2 group, acetoacetate, imidazole compounds (negative correlation to storage time), and glycerol and glucose (positive correlation to storage time). |
| Jobard et al. 2016 [66] | Plasma and Serum | Impact of storage time | 189 plasma and 192 serum samples | NMR | Storage of plasma or serum samples at −80 °C for up to 3 months did not significantly impact their metabolomes. |
| Pinto et al. 2014 [47] | Plasma | Impact of storage temperature and time | 52 | NMR | The short-term storage of plasma samples at room temperature caused significant changes to the lipidomic profile of the plasma following >2.5 h of storage. Storage of plasma samples at −20 °C for up to 7 days did not cause any significant changes to the metabolome; however, following storage for 1 month, significant increases in levels of proline and glucose are observed. Storage of plasma samples at −80 °C demonstrate more stability and is, therefore, recommended over storage at −20 °C for the long-term storage of plasma. |
| An et al. 2021 [87] | Serum | Impact of storage time and temperature | 165 | Mass Spec (LC-MS) | Storage of serum samples at either 4 °C or 22 °C for up to 24 h caused significant changes to amino acid concentrations. |
| Volani et al. 2017 [80] | Plasma | Impact of storage temperature and time | 69 | Mass Spec (LC-MS) | While storage at room temperature caused significant changes to the metabolome, storage at −80 °C demonstrated metabolome stability for up to 6 months. Metabolite stability is both chemical class- and metabolite-dependent. |
| Moran-Garrido et al. 2025 [85] | Plasma | Impact of short- and long-term storage | 9 | Mass Spec (LC-MS) | Plasma oxylipins remained stable when stored at 4 °C for up to 120 h and at −80 °C for 98 days, and the addition of butylated hydroxytoluene helped preserve oxylipins when stored at −20 °C for 98 days. |
| Hebels et al. 2013 [53] | Plasma | Storage temperature | 6 | Mass Spec (LC-MS) | Storage of samples at −80 °C vs. liquid nitrogen did not cause substantial changes to plasma metabolite profiles. |
| Wagner-Golbs et al. 2019 [84] | Plasma | Impact of long-term storage at −80 °C | 2398 | Mass Spec (GC and LC-MS) | The plasma metabolome demonstrated stability when stored at −80 °C for up to 7 years; however, further prolonged storage resulted in significant changes to the metabolome; therefore, the metabolomic profiling of plasma samples stored for longer than 7 years should be avoided where possible. |
| Petrick et al. 2024 [86] | Plasma | Impact of storage temperature and time | 12 | Mass Spec (LC-MS) | The plasma metabolome demonstrated more stability when stored at −80 °C compared to storage at −20 °C or 4 °C for up to 168 days; therefore, the long-term storage of plasma samples at −80 °C is recommended over storage at −20 °C or 4 °C. |
| Nagana Gowda et al. 2023 [83] | Plasma | Impact of sample quenching, incubation temperature and time | 84 | NMR | The use of a mixture of methanol and chloroform enhanced coenzyme extraction compared to the use of methanol or ethanol; therefore, rapid quenching using an organic solvent is recommended for the analysis of labile metabolites. The incubation of samples on ice increased the rate of NAD+ to NADH conversion and the rate at which coenzyme levels changed irrespective of the extraction solvent used. Incubation on ice also decreased levels of ATP in the samples. |
| Anderson et al. 2020 [78] | Synovial Fluid (animal) | Post-centrifugation freezing method | 32 | NMR | Synovial fluid samples immediately frozen using liquid nitrogen followed by storage at −80° demonstrated the least variability compared to freezing at −20 °C, −80 °C, or using dry ice. |
3.7. Freeze/Thaw Cycling
| Study | Sample Type | Variable/s Tested | Sample Size (n) | Analytical Method Used | Conclusions |
|---|---|---|---|---|---|
| Jaggard et al. 2021 [88] | Synovial Fluid | Impact of up to five F/T cycles | 15 | NMR | Up to five F/T cycles had minor effects on the synovial fluid metabolome; however, the concentrations of eight metabolites were significantly impacted including 2-ketoisovalerate, glycosaminoglycan, acetaminophen glucuronide, formate, arginine, glutamate, phenylalanine, and acetaminophen glucuronide. |
| Damyanovich et al. 2000 [89] | Synovial Fluid | Impact of up to ten F/T cycles | 12 | NMR | Up to 10 freeze/thaw cycles had no significant impact on overall endogenous metabolite concentrations. |
| Fliniaux et al. 2011 [68] | Serum | Impact of up to ten F/T cycles | 20 | NMR | F/T cycling of >5 cycles significantly impacted the stability of the serum metabolome with changes in choline, glycerol, methanol, and ethanol identified as potential markers of F/T cycling. |
| Pinto et al. 2014 [47] | Plasma | Impact of up to five F/T cycles | 15 | NMR | Plasma metabolome stability to F/T cycling was sample-dependent; however, generally, the highest variation in the plasma metabolome occurred following four or more F/T cycles; therefore, the analysis of samples that have undergone no more than three F/T cycles is recommended. |
| Yin et al. 2013 [56] | Plasma and Serum | Impact of up to four F/T cycles | 10 | Mass Spec (LC-MS) | No significant changes observed in the metabolome up to four F/T cycles. Samples that have undergone the same number of F/T cycles should be used and avoid the use of samples from different F/T cycles. |
| An et al. 2021 [87] | Serum | Impact of up to three F/T cycles | 8 | Mass Spec (LC-MS) | Up to three F/T cycles significantly increased the concentrations of 11 amino acids including histidine, leucine, isoleucine, methionine, phenylalanine, glutamate, tryptophan, valine, taurine, tyrosine, and ornithine. |
| Chen et al. 2020 [94] | Serum | Impact of up to five F/T cycles | 99 | Mass Spec (LC-MS) | F/T cycling impacted the serum metabolome with the most change occurring in cycles one to three. Following the third F/T, changes to the metabolome were less prominent. Changes to the metabolome can be influenced by donor gender. |
| Goodman et al. 2021 [90] | Plasma | Impact of up to three F/T cycles | 20 | Mass Spec (LC-MS) | Up to three F/T cycles did not significantly impact overall plasma metabolite concentrations; however, five metabolites (bilirubin (E, E), dihydroorotate, maltose, glycerol 3-phosphate, and sphingosine) were consistently impacted across all three F/T cycles. |
| Moran-Garrido et al. 2025 [85] | Plasma | Impact of up to five F/T cycles | 40 | Mass Spec (LC-MS) | Esterified oxylipins in plasma were more stable for up to five F/T cycles compared to free oxylipins. |
| Torell et al. 2017 [92] | Plasma (animal) | Impact of F/T during transport | 45 | Mass Spec (GC-MS) | Metabolomic profiles of plasma were significantly altered as a result of unplanned thawing during transportation, with samples typically presenting increased concentrations of amino acids, fatty acids, glycerol metabolites, and purine and pyrimidine metabolites. Metabolites identified to remain stable included glutamine, glycine, isoleucine, leucine, taurine, and valine, as well as TCA cycle intermediates. |
| Saito et al. 2014 [91] | Plasma and Serum | Impact of up to 10 F/T cycles | 30 | Mass Spec (GC and LC-MS) | The plasma metabolome was more sensitive to F/T cycling compared to the serum metabolome. Metabolic pathways impacted in plasma samples were associate with peptides, low molecular weight lipids, and glycerolipid metabolites. Pathways affected in both plasma and serum samples included pathways of cofactors and vitamins such as biliverdin. |
| Zivkovic et al. 2009 [93] | Serum | Impact of up to three F/T cycles | 27 | Mass Spec (GC and LC-MS) | Up to three F/T cycles did not significantly impact the stability of lipids. The immediate storage of samples in small aliquots at −80 °C helped reduce variability in the quantitative measurement of lipids caused by the freezing of the sample. Density-based lipoprotein fractionation on serum samples should be carried out prior to freezing, as it can significantly impact lipid concentrations when carried out following sample freezing. |
| McClain et al. 2021 [40] | Serum | Impact of up to four F/T cycles and thawing temperature | 416 | Mass Spec (GC-MS and LC-MS) | Short (<20 min) thawing of samples at room temperature had minimal effects compared to longer thawing in the refrigerator or on ice. |
3.8. Post Storage Handling
4. Discussion
- (1)
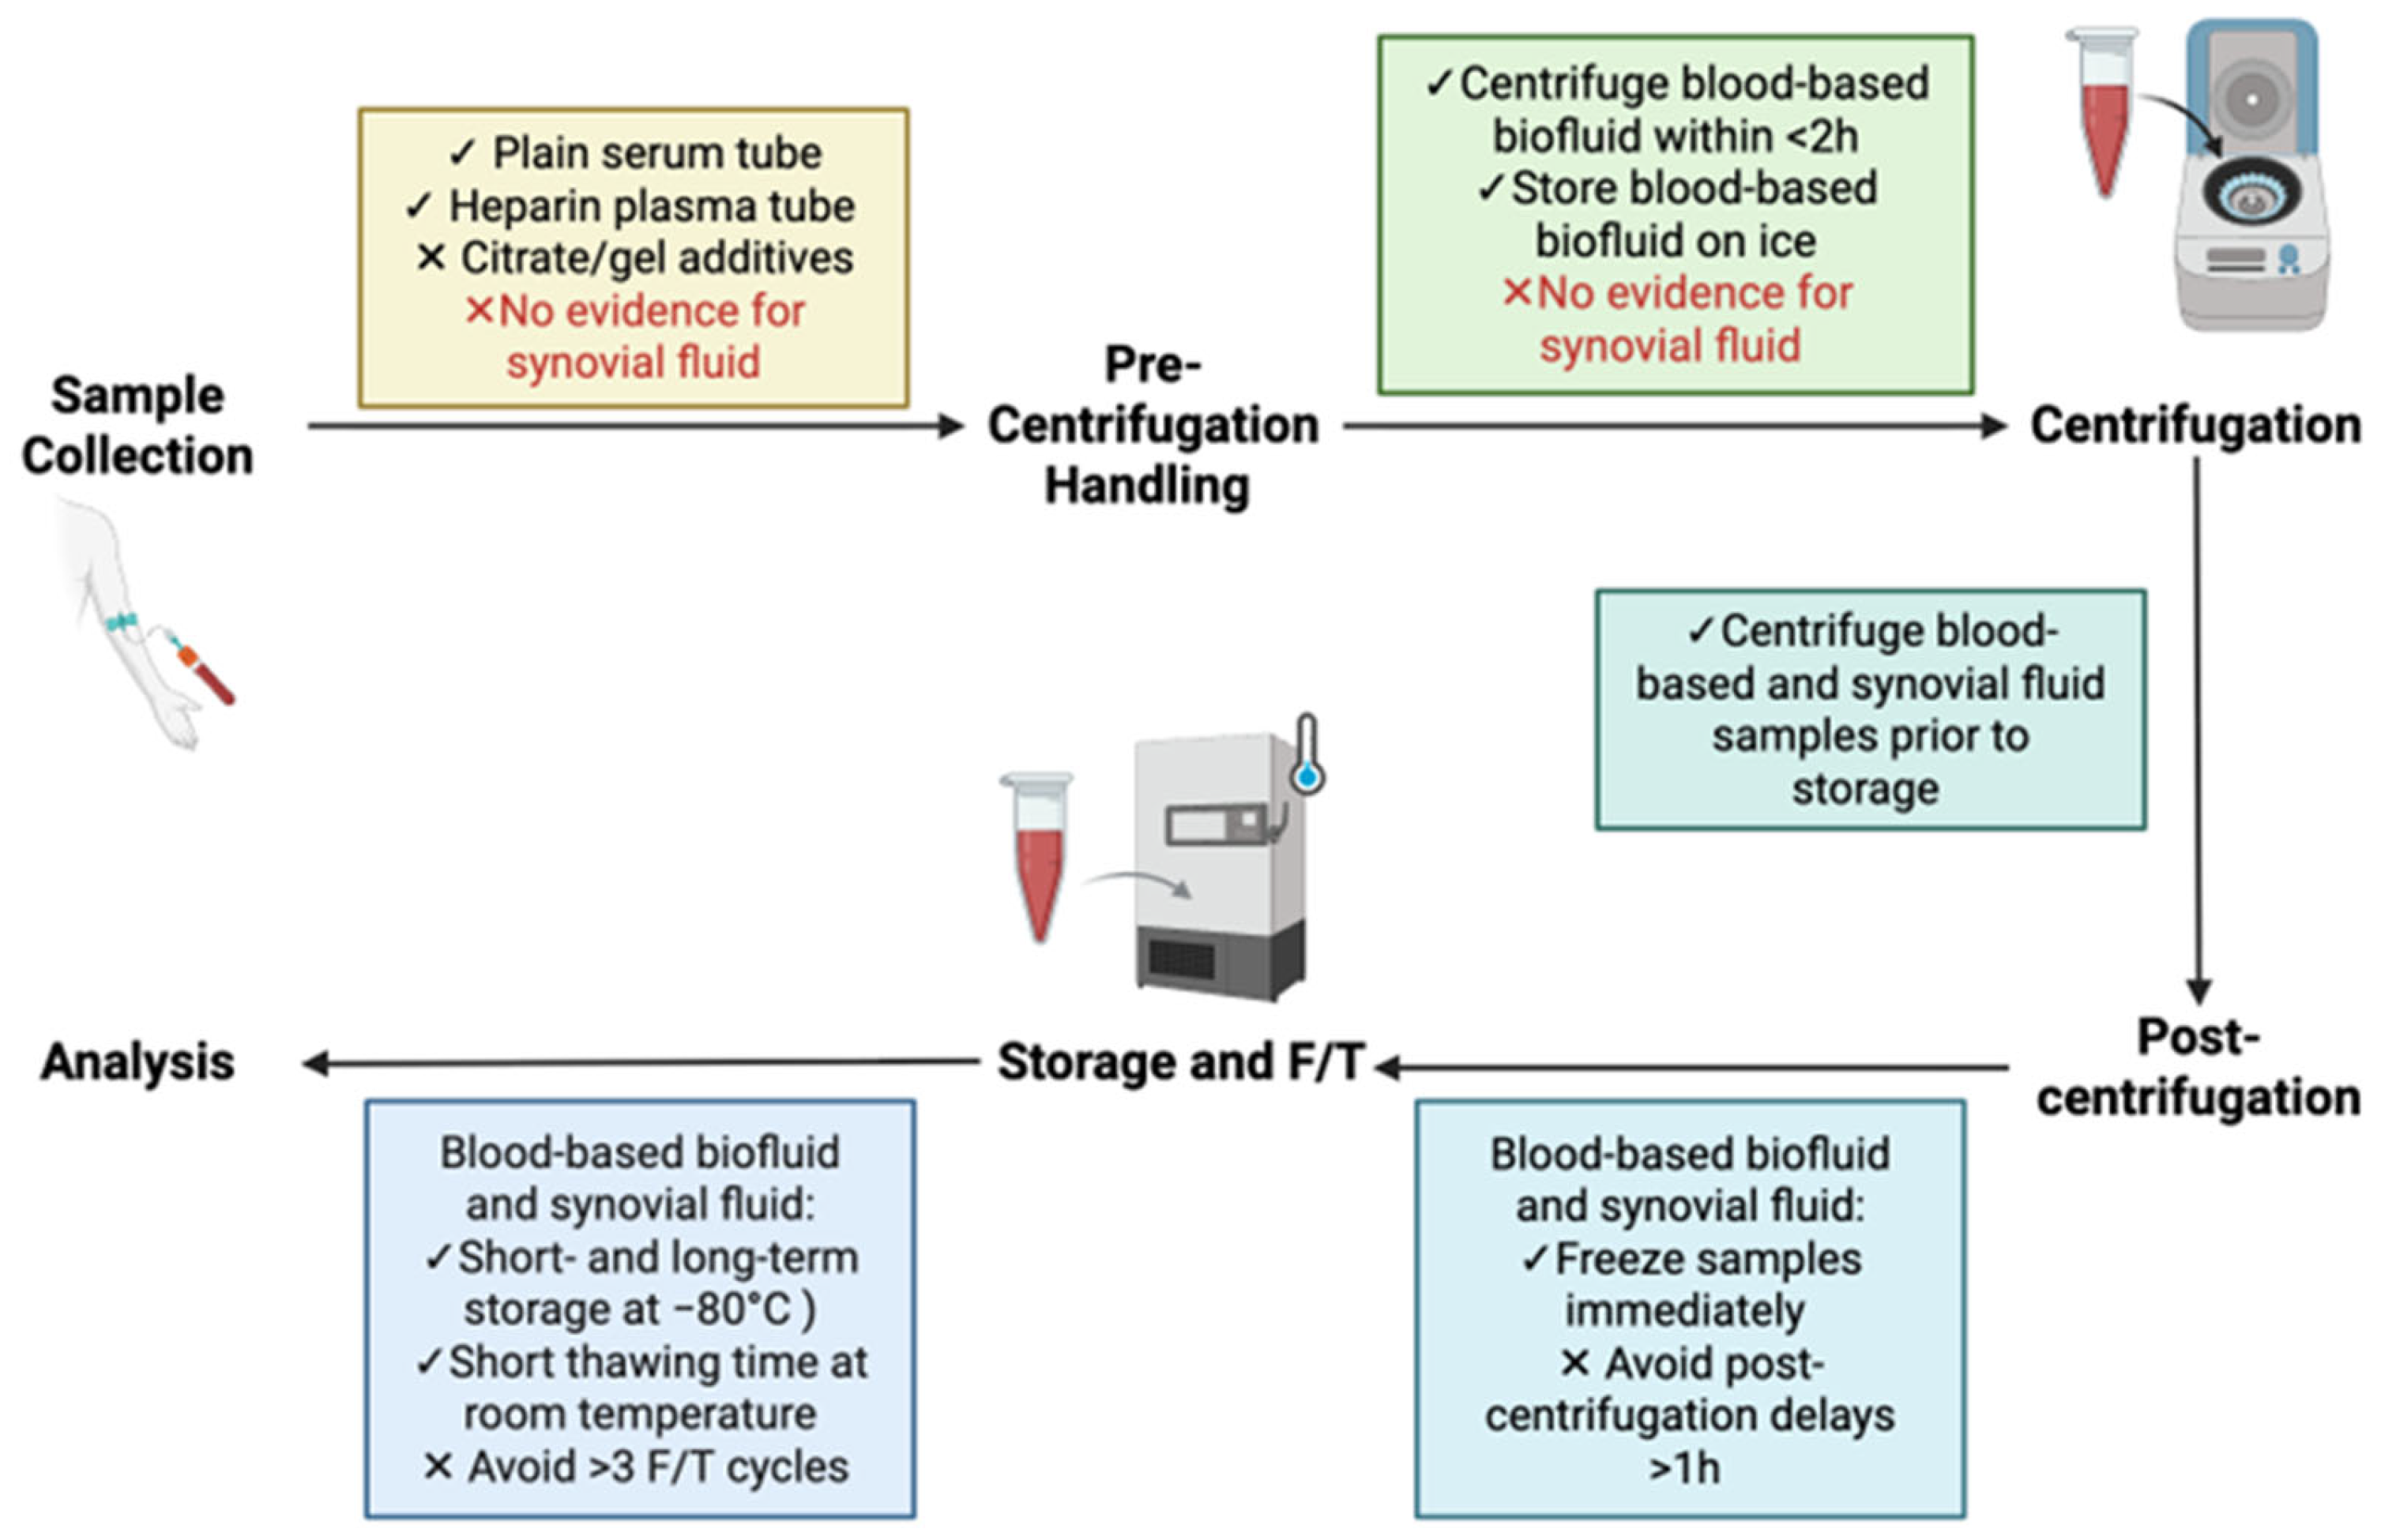
- Plain serum collection tubes and heparin plasma tubes free of gels and citrate additives should be used for the collection of blood.
- (2)
- Blood samples are recommended to be centrifuged within 2 h of collection and stored on ice during this period.
- (3)
- Following centrifugation, samples should be frozen immediately at −80 °C and aliquoted to avoid multiple F/T cycles. Where F/T cycling is unavoidable, samples having undergone more than three cycles should be avoided for metabolomic analysis.
- (4)
- Metabolomic workflows should be standardised across study sites, with adequate documentation of pre-analytical handling conditions to support reproducibility and aid in cross-study comparisons.

5. Conclusions
Supplementary Materials
Author Contributions
Funding
Institutional Review Board Statement
Informed Consent Statement
Data Availability Statement
Acknowledgments
Conflicts of Interest
Abbreviations
| PRISMA-Scr | Preferred Reporting Items for Systematic Reviews and Meta-Analyses extension for Scoping Reviews |
| LC-MS | Liquid chromatography coupled with mass spectrometry |
| GC-MS | Gas chromatography coupled with mass spectrometry |
| NMR | Nuclear magnetic resonance |
| OA | Osteoarthritis |
| RA | Rheumatoid arthritis |
| EDTA | Ethylenediaminetetraacetic acid |
| ACD | Acid citrate dextrose |
| SCFA | Short-chain fatty acids |
| SM | Sphingomyelin |
| RBCs | Red blood cells |
References
- Clish, C.B. Metabolomics: An Emerging but Powerful Tool for Precision Medicine. Mol. Case Stud. 2015, 1, a000588. [Google Scholar] [CrossRef] [Scilit]
- Qiu, S.; Cai, Y.; Yao, H.; Lin, C.; Xie, Y.; Tang, S.; Zhang, A. Small Molecule Metabolites: Discovery of Biomarkers and Therapeutic Targets. Signal Transduct. Target. Ther. 2023, 8, 132. [Google Scholar] [CrossRef] [Scilit]
- van Vugt, M.; Finan, C.; Chopade, S.; Providencia, R.; Bezzina, C.R.; Asselbergs, F.W.; van Setten, J.; Schmidt, A.F. Integrating Metabolomics and Proteomics to Identify Novel Drug Targets for Heart Failure and Atrial Fibrillation. Genome Med. 2024, 16, 120. [Google Scholar] [CrossRef] [Scilit] [PubMed]
- Bermingham, K.M.; Brennan, L.; Segurado, R.; Barron, R.E.; Gibney, E.R.; Ryan, M.F.; Gibney, M.J.; O’Sullivan, A.M. Genetic and Environmental Contributions to Variation in the Stable Urinary NMR Metabolome over Time: A Classic Twin Study. J. Proteome Res. 2021, 20, 3992–4000. [Google Scholar] [CrossRef] [Scilit] [PubMed]
- Goodacre, R. Metabolomics of a Superorganism. J. Nutr. 2007, 137, 259S–266S. [Google Scholar] [CrossRef] [Scilit] [PubMed]
- Holmes, E.; Loo, R.L.; Stamler, J.; Bictash, M.; Yap, I.K.S.; Chan, Q.; Ebbels, T.; De Iorio, M.; Brown, I.J.; Veselkov, K.A.; et al. Human Metabolic Phenotype Diversity and Its Association with Diet and Blood Pressure. Nature 2008, 453, 396–400. [Google Scholar] [CrossRef] [Scilit]
- Vitale, G.A.; Geibel, C.; Minda, V.; Wang, M.; Aron, A.T.; Petras, D. Connecting Metabolome and Phenotype: Recent Advances in Functional Metabolomics Tools for the Identification of Bioactive Natural Products. Nat. Prod. Rep. 2024, 41, 885–904. [Google Scholar] [CrossRef] [Scilit]
- Guijas, C.; Montenegro-Burke, J.R.; Warth, B.; Spilker, M.E.; Siuzdak, G. Metabolomics Activity Screening for Identifying Metabolites That Modulate Phenotype. Nat. Biotechnol. 2018, 36, 316–320. [Google Scholar] [CrossRef] [Scilit]
- Auwerx, C.; Sadler, M.C.; Woh, T.; Reymond, A.; Kutalik, Z.; Porcu, E. Exploiting the Mediating Role of the Metabolome to Unravel Transcript-to-Phenotype Associations. Elife 2023, 12, 81097. [Google Scholar] [CrossRef] [Scilit]
- Letertre, M.P.M.; Dervilly, G.; Giraudeau, P. Combined Nuclear Magnetic Resonance Spectroscopy and Mass Spectrometry Approaches for Metabolomics. Anal. Chem. 2021, 93, 500–518. [Google Scholar] [CrossRef] [Scilit]
- Dunn, W.B.; Broadhurst, D.I.; Atherton, H.J.; Goodacre, R.; Griffin, J.L. Systems Level Studies of Mammalian Metabolomes: The Roles of Mass Spectrometry and Nuclear Magnetic Resonance Spectroscopy. Chem. Soc. Rev. 2011, 40, 387–426. [Google Scholar] [CrossRef] [Scilit]
- Fiehn, O. Metabolomics by Gas Chromatography–Mass Spectrometry: Combined Targeted and Untargeted Profiling. Curr. Protoc. Mol. Biol. 2016, 114, 30.4.1–30.4.32. [Google Scholar] [CrossRef] [Scilit]
- Marshall, D.D.; Powers, R. Beyond the Paradigm: Combining Mass Spectrometry and Nuclear Magnetic Resonance for Metabolomics. Prog. Nucl. Magn. Reson. Spectrosc. 2017, 100, 1–16. [Google Scholar] [CrossRef] [Scilit]
- Homobono Brito de Moura, P.; Leleu, G.; Da Costa, G.; Marti, G.; Pétriacq, P.; Valls Fonayet, J.; Richard, T. Integrating NMR and MS for Improved Metabolomic Analysis: From Methodologies to Applications. Molecules 2025, 30, 2624. [Google Scholar] [CrossRef] [Scilit] [PubMed]
- Krone, N.; Hughes, B.A.; Lavery, G.G.; Stewart, P.M.; Arlt, W.; Shackleton, C.H.L. Gas Chromatography/Mass Spectrometry (GC/MS) Remains a Pre-Eminent Discovery Tool in Clinical Steroid Investigations Even in the Era of Fast Liquid Chromatography Tandem Mass Spectrometry (LC/MS/MS). J. Steroid Biochem. Mol. Biol. 2010, 121, 496–504. [Google Scholar] [CrossRef] [Scilit] [PubMed]
- Zeki, Ö.C.; Eylem, C.C.; Reçber, T.; Kır, S.; Nemutlu, E. Integration of GC–MS and LC–MS for Untargeted Metabolomics Profiling. J. Pharm. Biomed. Anal. 2020, 190, 113509. [Google Scholar] [CrossRef] [Scilit] [PubMed]
- Rakusanova, S.; Cajka, T. Tips and Tricks for LC–MS-Based Metabolomics and Lipidomics Analysis. TrAC Trends Anal. Chem. 2024, 180, 117940. [Google Scholar] [CrossRef] [Scilit]
- Zhang, A.; Sun, H.; Wang, P.; Han, Y.; Wang, X. Recent and Potential Developments of Biofluid Analyses in Metabolomics. J. Proteom. 2012, 75, 1079–1088. [Google Scholar] [CrossRef] [Scilit]
- Zhang, S.; Nagana Gowda, G.A.; Ye, T.; Raftery, D. Advances in NMR-Based Biofluid Analysis and Metabolite Profiling. Analyst 2010, 135, 1490. [Google Scholar] [CrossRef] [Scilit]
- Dunn, W.B.; Lin, W.; Broadhurst, D.; Begley, P.; Brown, M.; Zelena, E.; Vaughan, A.A.; Halsall, A.; Harding, N.; Knowles, J.D.; et al. Molecular Phenotyping of a UK Population: Defining the Human Serum Metabolome. Metabolomics 2015, 11, 9–26. [Google Scholar] [CrossRef] [Scilit]
- Rattray, N.J.W.; Trivedi, D.K.; Xu, Y.; Chandola, T.; Johnson, C.H.; Marshall, A.D.; Mekli, K.; Rattray, Z.; Tampubolon, G.; Vanhoutte, B.; et al. Metabolic Dysregulation in Vitamin E and Carnitine Shuttle Energy Mechanisms Associate with Human Frailty. Nat. Commun. 2019, 10, 5027. [Google Scholar] [CrossRef] [Scilit]
- Trifonova, O.; Lokhov, P.; Archakov, A. Postgenomics Diagnostics: Metabolomics Approaches to Human Blood Profiling. Omics A J. Integr. Biol. 2013, 17, 550–559. [Google Scholar] [CrossRef] [Scilit]
- Astarita, G.; Kelly, R.S.; Lasky-Su, J. Metabolomics and Lipidomics Strategies in Modern Drug Discovery and Development. Drug Discov. Today 2023, 28, 103751. [Google Scholar] [CrossRef] [Scilit] [PubMed]
- Bennett, M.R.; Devarajan, P. Characteristics of an Ideal Biomarker of Kidney Diseases. In Biomarkers of Kidney Disease; Elsevier: Amsterdam, The Netherlands, 2011; pp. 1–24. [Google Scholar] [CrossRef] [Scilit]
- Larkin, J.R.; Anthony, S.; Johanssen, V.A.; Yeo, T.; Sealey, M.; Yates, A.G.; Smith, C.F.; Claridge, T.D.W.; Nicholson, B.D.; Moreland, J.-A.; et al. Metabolomic Biomarkers in Blood Samples Identify Cancers in a Mixed Population of Patients with Nonspecific Symptoms. Clin. Cancer Res. 2022, 28, 1651–1661. [Google Scholar] [CrossRef] [Scilit] [PubMed]
- Bodaghi, A.; Fattahi, N.; Ramazani, A. Biomarkers: Promising and Valuable Tools towards Diagnosis, Prognosis and Treatment of COVID-19 and Other Diseases. Heliyon 2023, 9, e13323. [Google Scholar] [CrossRef] [Scilit] [PubMed]
- Carlson, A.K.; Rawle, R.A.; Wallace, C.W.; Brooks, E.G.; Adams, E.; Greenwood, M.C.; Olmer, M.; Lotz, M.K.; Bothner, B.; June, R.K. Characterization of Synovial Fluid Metabolomic Phenotypes of Cartilage Morphological Changes Associated with Osteoarthritis. Osteoarthr. Cartil. 2019, 27, 1174–1184. [Google Scholar] [CrossRef] [Scilit]
- Wang, H.; Fang, K.; Wang, J.; Chang, X. Metabolomic Analysis of Synovial Fluids from Rheumatoid Arthritis Patients Using Quasi-Targeted Liquid Chromatography-Mass Spectrometry/Mass Spectrometry. Clin. Exp. Rheumatol. 2021, 39, 1307–1315. [Google Scholar] [CrossRef] [Scilit]
- Ge, M.; Sun, W.; Xu, T.; Yang, R.; Zhang, K.; Li, J.; Zhao, Z.; Gong, M.; Fu, W. Multi-Omics Analysis of Synovial Tissue and Fluid Reveals Differentially Expressed Proteins and Metabolites in Osteoarthritis. J. Transl. Med. 2025, 23, 285. [Google Scholar] [CrossRef] [Scilit]
- Zheng, K.; Shen, N.; Chen, H.; Ni, S.; Zhang, T.; Hu, M.; Wang, J.; Sun, L.; Yang, X. Global and Targeted Metabolomics of Synovial Fluid Discovers Special Osteoarthritis Metabolites. J. Orthop. Res. 2017, 35, 1973–1981. [Google Scholar] [CrossRef] [Scilit]
- Adams, S.B.; Nettles, D.L.; Jones, L.C.; Miller, S.D.; Guyton, G.P.; Schon, L.C. Inflammatory Cytokines and Cellular Metabolites as Synovial Fluid Biomarkers of Posttraumatic Ankle Arthritis. Foot Ankle Int. 2014, 35, 1241–1249. [Google Scholar] [CrossRef] [Scilit]
- Klim, S.; Madl, T.; Habisch, H.; Amerstorfer, F.; Stradner, M.; Hauer, G.; Leithner, A.; Glehr, M. Periprosthetic Joint Infection Diagnosis Using Nuclear Magnetic Resonance-Based Metabolom Analysis. Orthop. Proc. 2022, 104-B, 9. [Google Scholar]
- de Paula Mozella, A.; de Araujo Barros Cobra, H.A.; da Palma, I.M.; Salim, R.; Antonio Matheus Guimarães, J.; Costa, G.; Leal, A.C. Synovial Fluid NMR-based Metabolomics in Septic and Aseptic Revision Total Knee Arthroplasty: Implications on Diagnosis and Treatment. J. Orthop. Res. 2024, 42, 2336–2344. [Google Scholar] [CrossRef] [Scilit] [PubMed]
- Bay-Jensen, A.C.; Sand, J.M.B.; Genovese, F.; Siebuhr, A.S.; Nielsen, M.J.; Leeming, D.J.; Manon-Jensen, T.; Karsdal, M.A. Structural Biomarkers. In Biochemistry of Collagens, Laminins and Elastin; Elsevier: Amsterdam, The Netherlands, 2016; pp. 203–233. [Google Scholar] [CrossRef] [Scilit]
- Feeney, E.; Peal, B.T.; Inglis, J.E.; Su, J.; Nixon, A.J.; Bonassar, L.J.; Reesink, H.L. Temporal Changes in Synovial Fluid Composition and Elastoviscous Lubrication in the Equine Carpal Fracture Model. J. Orthop. Res. 2019, 37, 1071–1079. [Google Scholar] [CrossRef] [Scilit] [PubMed]
- Luria, A.; Chu, C.R. Articular Cartilage Changes in Maturing Athletes. Sports Health 2014, 6, 18–30. [Google Scholar] [CrossRef] [Scilit] [PubMed]
- House, R.J.; Soper-Hopper, M.T.; Vincent, M.P.; Ellis, A.E.; Capan, C.D.; Madaj, Z.B.; Wolfrum, E.; Isaguirre, C.N.; Castello, C.D.; Johnson, A.B.; et al. A Diverse Proteome Is Present and Enzymatically Active in Metabolite Extracts. Nat. Commun. 2024, 15, 5796. [Google Scholar] [CrossRef] [Scilit]
- Muhamadali, H.; Winder, C.L.; Dunn, W.B.; Goodacre, R. Unlocking the Secrets of the Microbiome: Exploring the Dynamic Microbial Interplay with Humans through Metabolomics and Their Manipulation for Synthetic Biology Applications. Biochem. J. 2023, 480, 891–908. [Google Scholar] [CrossRef] [Scilit]
- Braisted, J.; Henderson, T.; Newman, J.W.; Moore, S.C.; Sampson, J.; McClain, K.; Ross, S.; Baer, D.J.; Mathé, E.A.; Zanetti, K.A. Effects of Preanalytical Sample Collection and Handling on Comprehensive Metabolite Measurements in Human Urine Biospecimens. medRxiv 2024. medRxiv:24301735. [Google Scholar] [CrossRef] [Scilit]
- McClain, K.M.; Moore, S.C.; Sampson, J.N.; Henderson, T.R.; Gebauer, S.K.; Newman, J.W.; Ross, S.; Pedersen, T.L.; Baer, D.J.; Zanetti, K.A. Preanalytical Sample Handling Conditions and Their Effects on the Human Serum Metabolome in Epidemiologic Studies. Am. J. Epidemiol. 2021, 190, 459–467. [Google Scholar] [CrossRef] [Scilit]
- Saari, H.; Konttinen, Y.T.; Friman, C.; Sorsa, T. Differential Effects of Reactive Oxygen Species on Native Synovial Fluid and Purified Human Umbilical Cord Hyaluronate. Inflammation 1993, 17, 403–415. [Google Scholar] [CrossRef] [Scilit]
- Kraus, V.B.; Stabler, T.V.; Kong, S.Y.; Varju, G.; McDaniel, G. Measurement of Synovial Fluid Volume Using Urea. Osteoarthr. Cartil. 2007, 15, 1217–1220. [Google Scholar] [CrossRef] [Scilit]
- Roberts, S.; Evans, H.; Wright, K.; van Niekerk, L.; Caterson, B.; Richardson, J.B.; Kumar, K.H.S.; Kuiper, J.H. ADAMTS-4 Activity in Synovial Fluid as a Biomarker of Inflammation and Effusion. Osteoarthr. Cartil. 2015, 23, 1622–1626. [Google Scholar] [CrossRef] [Scilit]
- Tricco, A.C.; Lillie, E.; Zarin, W.; O’Brien, K.K.; Colquhoun, H.; Levac, D.; Moher, D.; Peters, M.D.J.; Horsley, T.; Weeks, L.; et al. PRISMA Extension for Scoping Reviews (PRISMA-ScR): Checklist and Explanation. Ann. Intern. Med. 2018, 169, 467–473. [Google Scholar] [CrossRef] [Scilit] [PubMed]
- Ghini, V.; Abuja, P.M.; Polasek, O.; Kozera, L.; Laiho, P.; Anton, G.; Zins, M.; Klovins, J.; Metspalu, A.; Wichmann, H.-E.; et al. Impact of the Pre-Examination Phase on Multicenter Metabolomic Studies. New Biotechnol. 2022, 68, 37–47. [Google Scholar] [CrossRef] [Scilit] [PubMed]
- Loo, R.L.; Lodge, S.; Kimhofer, T.; Bong, S.-H.; Begum, S.; Whiley, L.; Gray, N.; Lindon, J.C.; Nitschke, P.; Lawler, N.G.; et al. Quantitative In-Vitro Diagnostic NMR Spectroscopy for Lipoprotein and Metabolite Measurements in Plasma and Serum: Recommendations for Analytical Artifact Minimization with Special Reference to COVID-19/SARS-CoV-2 Samples. J. Proteome Res. 2020, 19, 4428–4441. [Google Scholar] [CrossRef] [Scilit] [PubMed]
- Pinto, J.; Domingues, M.R.M.; Galhano, E.; Pita, C.; Almeida, M.D.C.; Carreira, I.M.; Gil, A.M. Human Plasma Stability during Handling and Storage: Impact on NMR Metabolomics. Analyst 2014, 139, 1168–1177. [Google Scholar] [CrossRef] [Scilit]
- Sotelo-Orozco, J.; Chen, S.-Y.; Hertz-Picciotto, I.; Slupsky, C.M. A Comparison of Serum and Plasma Blood Collection Tubes for the Integration of Epidemiological and Metabolomics Data. Front. Mol. Biosci. 2021, 8, 682134. [Google Scholar] [CrossRef] [Scilit]
- Chen, D.; Han, W.; Su, X.; Li, L.; Li, L. Overcoming Sample Matrix Effect in Quantitative Blood Metabolomics Using Chemical Isotope Labeling Liquid Chromatography Mass Spectrometry. Anal. Chem. 2017, 89, 9424–9431. [Google Scholar] [CrossRef] [Scilit]
- Beck, S. Fragmentation Behavior of EDTA Complexes under Different Activation Conditions. J. Mass Spectrom. 2021, 56, e4775. [Google Scholar] [CrossRef] [Scilit]
- Giudicessi, S.L.; Fatema, M.K.; Nonami, H.; Erra-Balsells, R. Ethylenediaminetetraacetic Acid (EDTA) as an Auxiliary Tool in the Electrospray Ionization Mass Spectrometry Analysis of Native and Derivatized β-Cyclodextrins, Maltoses, and Fructans Contaminated with Ca and/or Mg. J. Am. Soc. Mass Spectrom. 2010, 21, 1526–1529. [Google Scholar] [CrossRef] [Scilit]
- Zhou, Z.; Chen, Y.; He, J.; Xu, J.; Zhang, R.; Mao, Y.; Abliz, Z. Systematic Evaluation of Serum and Plasma Collection on The Endogenous Metabolome. Bioanalysis 2017, 9, 239–250. [Google Scholar] [CrossRef] [Scilit]
- Hebels, D.G.A.J.; Georgiadis, P.; Keun, H.C.; Athersuch, T.J.; Vineis, P.; Vermeulen, R.; Portengen, L.; Bergdahl, I.A.; Hallmans, G.; Palli, D.; et al. Performance in Omics Analyses of Blood Samples in Long-Term Storage: Opportunities for the Exploitation of Existing Biobanks in Environmental Health Research. Env. Health Perspect. 2013, 121, 480–487. [Google Scholar] [CrossRef] [Scilit]
- Barri, T.; Dragsted, L.O. UPLC-ESI-QTOF/MS and Multivariate Data Analysis for Blood Plasma and Serum Metabolomics: Effect of Experimental Artefacts and Anticoagulant. Anal. Chim. Acta 2013, 768, 118–128. [Google Scholar] [CrossRef] [Scilit] [PubMed]
- Bando, K.; Kawahara, R.; Kunimatsu, T.; Sakai, J.; Kimura, J.; Funabashi, H.; Seki, T.; Bamba, T.; Fukusaki, E. Influences of Biofluid Sample Collection and Handling Procedures on GC–MS Based Metabolomic Studies. J. Biosci. Bioeng. 2010, 110, 491–499. [Google Scholar] [CrossRef] [Scilit] [PubMed]
- Yin, P.; Peter, A.; Franken, H.; Zhao, X.; Neukamm, S.S.; Rosenbaum, L.; Lucio, M.; Zell, A.; Häring, H.-U.; Xu, G.; et al. Preanalytical Aspects and Sample Quality Assessment in Metabolomics Studies of Human Blood. Clin. Chem. 2013, 59, 833–845. [Google Scholar] [CrossRef] [Scilit] [PubMed]
- López-Bascón, M.A.; Priego-Capote, F.; Peralbo-Molina, A.; Calderón-Santiago, M.; Luque de Castro, M.D. Influence of the Collection Tube on Metabolomic Changes in Serum and Plasma. Talanta 2016, 150, 681–689. [Google Scholar] [CrossRef] [Scilit]
- Khadka, M.; Todor, A.; Maner-Smith, K.M.; Colucci, J.K.; Tran, V.; Gaul, D.A.; Anderson, E.J.; Natrajan, M.S.; Rouphael, N.; Mulligan, M.J.; et al. The Effect of Anticoagulants, Temperature, and Time on the Human Plasma Metabolome and Lipidome from Healthy Donors as Determined by Liquid Chromatography-Mass Spectrometry. Biomolecules 2019, 9, 200. [Google Scholar] [CrossRef] [Scilit]
- Xiong, W.; Anthony, D.C.; Anthony, S.; Ho, T.B.T.; Louis, E.; Satsangi, J.; Radford-Smith, D.E. Sodium Fluoride Preserves Blood Metabolite Integrity for Biomarker Discovery in Large-Scale, Multi-Site Metabolomics Investigations. Analyst 2024, 149, 1238–1249. [Google Scholar] [CrossRef] [Scilit]
- Niemuth Jennifer, N.; Harms Craig, A.; Stoskopf Michael, K. Effects of Processing Time on Whole Blood and Plasma Samples from Loggerhead Sea Turtles (Caretta Caretta) for 1H-NMR-Based Metabolomics. Herpetol. Conserv. Biol. 2015, 10, 149–160. [Google Scholar]
- Malmodin, D.; Bay Nord, A.; Zafar, H.; Paulson, L.; Karlsson, B.G.; Naluai, Å.T. Preanalytical (Mis)Handling of Plasma Investigated by 1 H NMR Metabolomics. ACS Omega 2024, 9, 48727–48737. [Google Scholar] [CrossRef] [Scilit]
- Bernini, P.; Bertini, I.; Luchinat, C.; Nincheri, P.; Staderini, S.; Turano, P. Standard Operating Procedures for Pre-Analytical Handling of Blood and Urine for Metabolomic Studies and Biobanks. J. Biomol. NMR 2011, 49, 231–243. [Google Scholar] [CrossRef] [Scilit]
- Brunius, C.; Pedersen, A.; Malmodin, D.; Karlsson, B.G.; Andersson, L.I.; Tybring, G.; Landberg, R. Prediction and Modeling of Pre-Analytical Sampling Errors as a Strategy to Improve Plasma NMR Metabolomics Data. Bioinformatics 2017, 33, 3567–3574. [Google Scholar] [CrossRef] [Scilit] [PubMed]
- Debik, J.; Isaksen, S.H.; Strømmen, M.; Spraul, M.; Schäfer, H.; Bathen, T.F.; Giskeødegård, G.F. Effect of Delayed Centrifugation on the Levels of NMR-Measured Lipoproteins and Metabolites in Plasma and Serum Samples. Anal. Chem. 2022, 94, 17003–17010. [Google Scholar] [CrossRef] [Scilit] [PubMed]
- Santos Ferreira, D.L.; Maple, H.J.; Goodwin, M.; Brand, J.S.; Yip, V.; Min, J.L.; Groom, A.; Lawlor, D.A.; Ring, S. The Effect of Pre-Analytical Conditions on Blood Metabolomics in Epidemiological Studies. Metabolites 2019, 9, 64. [Google Scholar] [CrossRef] [Scilit] [PubMed]
- Jobard, E.; Trédan, O.; Postoly, D.; André, F.; Martin, A.-L.; Elena-Herrmann, B.; Boyault, S. A Systematic Evaluation of Blood Serum and Plasma Pre-Analytics for Metabolomics Cohort Studies. Int. J. Mol. Sci. 2016, 17, 2035. [Google Scholar] [CrossRef] [Scilit]
- Altmann, H.; Barovic, M.; Straßburger, K.; Tschäpel, M.; Jonas, S.; Poitz, D.M.; Belavgeni, A.; Chavakis, T.; Mirtschink, P.; Funk, A.M. Validating Centralized Biobanking Workflows for NMR Metabolomics Using the PRIMA Panel. Anal. Chem. 2025, 97, 2762–2769. [Google Scholar] [CrossRef] [Scilit]
- Fliniaux, O.; Gaillard, G.; Lion, A.; Cailleu, D.; Mesnard, F.; Betsou, F. Influence of Common Preanalytical Variations on the Metabolic Profile of Serum Samples in Biobanks. J. Biomol. NMR 2011, 51, 457–465. [Google Scholar] [CrossRef] [Scilit]
- Wang, Q.; Hoene, M.; Hu, C.; Fritsche, L.; Ahrends, R.; Liebisch, G.; Ekroos, K.; Fritsche, A.; Birkenfeld, A.L.; Liu, X.; et al. Ex Vivo Instability of Lipids in Whole Blood: Preanalytical Recommendations for Clinical Lipidomics Studies. J. Lipid Res. 2023, 64, 100378. [Google Scholar] [CrossRef] [Scilit]
- Wang, Y.; Carter, B.D.; Gapstur, S.M.; McCullough, M.L.; Gaudet, M.M.; Stevens, V.L. Reproducibility of Non-Fasting Plasma Metabolomics Measurements across Processing Delays. Metabolomics 2018, 14, 129. [Google Scholar] [CrossRef] [Scilit]
- Zheng, R.; Brunius, C.; Shi, L.; Zafar, H.; Paulson, L.; Landberg, R.; Naluai, Å.T. Prediction and Evaluation of the Effect of Pre-Centrifugation Sample Management on the Measurable Untargeted LC-MS Plasma Metabolome. Anal. Chim. Acta 2021, 1182, 338968. [Google Scholar] [CrossRef] [Scilit]
- Jain, M.; Kennedy, A.D.; Elsea, S.H.; Miller, M.J. Analytes Related to Erythrocyte Metabolism Are Reliable Biomarkers for Preanalytical Error Due to Delayed Plasma Processing in Metabolomics Studies. Clin. Chim. Acta 2017, 466, 105–111. [Google Scholar] [CrossRef] [Scilit]
- Trezzi, J.-P.; Bulla, A.; Bellora, C.; Rose, M.; Lescuyer, P.; Kiehntopf, M.; Hiller, K.; Betsou, F. LacaScore: A Novel Plasma Sample Quality Control Tool Based on Ascorbic Acid and Lactic Acid Levels. Metabolomics 2016, 12, 96. [Google Scholar] [CrossRef] [Scilit]
- Dunn, W.B.; Broadhurst, D.; Ellis, D.I.; Brown, M.; Halsall, A.; O’Hagan, S.; Spasic, I.; Tseng, A.; Kell, D.B. A GC-TOF-MS Study of the Stability of Serum and Urine Metabolomes during the UK Biobank Sample Collection and Preparation Protocols. Int. J. Epidemiol. 2008, 37, i23–i30. [Google Scholar] [CrossRef] [Scilit] [PubMed]
- Nishiumi, S.; Suzuki, M.; Kobayashi, T.; Yoshida, M. Differences in Metabolite Profiles Caused by Pre-Analytical Blood Processing Procedures. J. Biosci. Bioeng. 2018, 125, 613–618. [Google Scholar] [CrossRef] [Scilit] [PubMed]
- González-Domínguez, R.; González-Domínguez, Á.; Sayago, A.; Fernández-Recamales, Á. Recommendations and Best Practices for Standardizing the Pre-Analytical Processing of Blood and Urine Samples in Metabolomics. Metabolites 2020, 10, 229. [Google Scholar] [CrossRef] [Scilit] [PubMed]
- Lesche, D.; Geyer, R.; Lienhard, D.; Nakas, C.T.; Diserens, G.; Vermathen, P.; Leichtle, A.B. Does Centrifugation Matter? Centrifugal Force and Spinning Time Alter the Plasma Metabolome. Metabolomics 2016, 12, 159. [Google Scholar] [CrossRef] [Scilit]
- Anderson, J.R.; Phelan, M.M.; Rubio-Martinez, L.M.; Fitzgerald, M.M.; Jones, S.W.; Clegg, P.D.; Peffers, M.J. Optimization of Synovial Fluid Collection and Processing for NMR Metabolomics and LC-MS/MS Proteomics. J. Proteome Res. 2020, 19, 2585–2597. [Google Scholar] [CrossRef] [Scilit]
- La Frano, M.R.; Carmichael, S.L.; Ma, C.; Hardley, M.; Shen, T.; Wong, R.; Rosales, L.; Borkowski, K.; Pedersen, T.L.; Shaw, G.M.; et al. Impact of Post-Collection Freezing Delay on the Reliability of Serum Metabolomics in Samples Reflecting the California Mid-Term Pregnancy Biobank. Metabolomics 2018, 14, 151. [Google Scholar] [CrossRef] [Scilit]
- Volani, C.; Caprioli, G.; Calderisi, G.; Sigurdsson, B.B.; Rainer, J.; Gentilini, I.; Hicks, A.A.; Pramstaller, P.P.; Weiss, G.; Smarason, S.V.; et al. Pre-Analytic Evaluation of Volumetric Absorptive Microsampling and Integration in a Mass Spectrometry-Based Metabolomics Workflow. Anal. Bioanal. Chem. 2017, 409, 6263–6276. [Google Scholar] [CrossRef] [Scilit]
- Kamlage, B.; Maldonado, S.G.; Bethan, B.; Peter, E.; Schmitz, O.; Liebenberg, V.; Schatz, P. Quality Markers Addressing Preanalytical Variations of Blood and Plasma Processing Identified by Broad and Targeted Metabolite Profiling. Clin. Chem. 2014, 60, 399–412. [Google Scholar] [CrossRef] [Scilit]
- Trabi, M.; Keller, M.D.; Jonsson, N.N. NMR-Based Metabonomics of Bovine Blood: An Investigation into the Effects of Long Term Storage on Plasma Samples. Metabolomics 2013, 9, 1041–1047. [Google Scholar] [CrossRef] [Scilit]
- Nagana Gowda, G.A.; Pascua, V.; Raftery, D. Anomalous Dynamics of Labile Metabolites in Cold Human Blood Detected Using 1 H NMR Spectroscopy. Anal. Chem. 2023, 95, 12923–12930. [Google Scholar] [CrossRef] [Scilit] [PubMed]
- Wagner-Golbs, A.; Neuber, S.; Kamlage, B.; Christiansen, N.; Bethan, B.; Rennefahrt, U.; Schatz, P.; Lind, L. Effects of Long-Term Storage at −80 °C on the Human Plasma Metabolome. Metabolites 2019, 9, 99. [Google Scholar] [CrossRef] [Scilit] [PubMed]
- Moran-Garrido, M.; Camunas-Alberca, S.M.; Sáiz, J.; Gradillas, A.; Taha, A.Y.; Barbas, C. Deeper Insights into the Stability of Oxylipins in Human Plasma across Multiple Freeze-Thaw Cycles and Storage Conditions. J. Pharm. Biomed. Anal. 2025, 255, 116587. [Google Scholar] [CrossRef] [Scilit] [PubMed]
- Petrick, L.M.; Niedzwiecki, M.M.; Dolios, G.; Guan, H.; Tu, P.; Wright, R.O.; Wright, R.J. Effects of Storage Temperature and Time on Metabolite Profiles Measured in Dried Blood Spots, Dried Blood Microsamplers, and Plasma. Sci. Total Environ. 2024, 912, 169383. [Google Scholar] [CrossRef] [Scilit]
- An, Z.; Shi, C.; Li, P.; Liu, L. Stability of Amino Acids and Related Amines in Human Serum under Different Preprocessing and Pre-Storage Conditions Based on ITRAQ®-LC-MS/MS. Biol. Open 2021, 10, bio055020. [Google Scholar] [CrossRef] [Scilit]
- Jaggard, M.K.J.; Boulangé, C.L.; Graça, G.; Akhbari, P.; Vaghela, U.; Bhattacharya, R.; Williams, H.R.T.; Lindon, J.C.; Gupte, C.M. The Influence of Sample Collection, Handling and Low Temperature Storage upon NMR Metabolic Profiling Analysis in Human Synovial Fluid. J. Pharm. Biomed. Anal. 2021, 197, 113942. [Google Scholar] [CrossRef] [Scilit]
- Damyanovich, A.Z.; Staples, J.R.; Marshall, K.W. The Effects of Freeze/Thawing on Human Synovial Fluid Observed by 500 MHz 1H Magnetic Resonance Spectroscopy. J. Rheumatol. 2000, 27, 746–752. [Google Scholar]
- Goodman, K.; Mitchell, M.; Evans, A.M.; Miller, L.A.D.; Ford, L.; Wittmann, B.; Kennedy, A.D.; Toal, D. Assessment of the Effects of Repeated Freeze Thawing and Extended Bench Top Processing of Plasma Samples Using Untargeted Metabolomics. Metabolomics 2021, 17, 31. [Google Scholar] [CrossRef] [Scilit]
- Saito, K.; Maekawa, K.; Pappan, K.L.; Urata, M.; Ishikawa, M.; Kumagai, Y.; Saito, Y. Differences in Metabolite Profiles between Blood Matrices, Ages, and Sexes among Caucasian Individuals and Their Inter-Individual Variations. Metabolomics 2014, 10, 402–413. [Google Scholar] [CrossRef] [Scilit]
- Torell, F.; Bennett, K.; Rännar, S.; Lundstedt-Enkel, K.; Lundstedt, T.; Trygg, J. The Effects of Thawing on the Plasma Metabolome: Evaluating Differences between Thawed Plasma and Multi-Organ Samples. Metabolomics 2017, 13, 66. [Google Scholar] [CrossRef] [Scilit]
- Zivkovic, A.M.; Wiest, M.M.; Nguyen, U.T.; Davis, R.; Watkins, S.M.; German, J.B. Effects of Sample Handling and Storage on Quantitative Lipid Analysis in Human Serum. Metabolomics 2009, 5, 507–516. [Google Scholar] [CrossRef] [Scilit] [PubMed]
- Chen, D.; Han, W.; Huan, T.; Li, L.; Li, L. Effects of Freeze–Thaw Cycles of Blood Samples on High-Coverage Quantitative Metabolomics. Anal. Chem. 2020, 92, 9265–9272. [Google Scholar] [CrossRef] [Scilit] [PubMed]
- Krishnan, N.; Dickman, M.B.; Becker, D.F. Proline Modulates the Intracellular Redox Environment and Protects Mammalian Cells against Oxidative Stress. Free Radic. Biol. Med. 2008, 44, 671–681. [Google Scholar] [CrossRef] [Scilit] [PubMed]
- Vera-Aviles, M.; Vantana, E.; Kardinasari, E.; Koh, N.L.; Latunde-Dada, G.O. Protective Role of Histidine Supplementation Against Oxidative Stress Damage in the Management of Anemia of Chronic Kidney Disease. Pharmaceuticals 2018, 11, 111. [Google Scholar] [CrossRef] [Scilit]
- Michel, V.; Yuan, Z.; Ramsubir, S.; Bakovic, M. Choline Transport for Phospholipid Synthesis. Exp. Biol. Med. 2006, 231, 490–504. [Google Scholar] [CrossRef] [Scilit]
- Patriarca, E.J.; Cermola, F.; D’Aniello, C.; Fico, A.; Guardiola, O.; De Cesare, D.; Minchiotti, G. The Multifaceted Roles of Proline in Cell Behavior. Front. Cell Dev. Biol. 2021, 9, 728576. [Google Scholar] [CrossRef] [Scilit]
- Fan, M.; Gao, X.; Li, L.; Ren, Z.; Lui, L.M.W.; McIntyre, R.S.; Teopiz, K.M.; Deng, P.; Cao, B. The Association Between Concentrations of Arginine, Ornithine, Citrulline and Major Depressive Disorder: A Meta-Analysis. Front. Psychiatry 2021, 12, 686973. [Google Scholar] [CrossRef] [Scilit]
- Niittynen, L.; Nurminen, M.-L.; Korpela, R.; Vapaatalo, H. Role of Arginine, Taurine 4 and Homocysteine in Cardiovascular Diseases. Ann. Med. 1999, 31, 318–326. [Google Scholar] [CrossRef] [Scilit]
- Broadhurst, D.; Goodacre, R.; Reinke, S.N.; Kuligowski, J.; Wilson, I.D.; Lewis, M.R.; Dunn, W.B. Guidelines and Considerations for the Use of System Suitability and Quality Control Samples in Mass Spectrometry Assays Applied in Untargeted Clinical Metabolomic Studies. Metabolomics 2018, 14, 72. [Google Scholar] [CrossRef] [Scilit]

| Study | Sample Type | Variable/s Tested | Sample Number (n) | Analytical Method Used | Conclusions |
|---|---|---|---|---|---|
| Santos Ferreira et al. 2019 [65] | Plasma and Serum | Buffer addition and NMR analysis delay | 74 | NMR | Delays in buffer addition and NMR analysis post storage impacted histidine and phenylalanine concentrations. |
| Goodman et al. 2021 [90] | Plasma | Delay in analysis following thawing of sample (up to 6 h) | 15 | Mass Spec (LC-MS) | Storage of plasma samples for up to 6 h in an ice bath following thawing did not significantly impact overall metabolite concentrations, suggesting metabolome stability for up to 6 h. |
Disclaimer/Publisher’s Note: The statements, opinions and data contained in all publications are solely those of the individual author(s) and contributor(s) and not of MDPI and/or the editor(s). MDPI and/or the editor(s) disclaim responsibility for any injury to people or property resulting from any ideas, methods, instructions or products referred to in the content. |
© 2026 by the authors. Licensee MDPI, Basel, Switzerland. This article is an open access article distributed under the terms and conditions of the Creative Commons Attribution (CC BY) license.
Share and Cite
Ladha, Y.; Sanaka, S.; Burke, A.; Goodacre, R.; Wright, K.T.; Perry, J.; Hulme, C.H. Bridging the Gap: A Scoping Review of Pre-Analytical Variability in Biofluid Metabolomics. Appl. Biosci. 2026, 5, 10. https://doi.org/10.3390/applbiosci5010010
Ladha Y, Sanaka S, Burke A, Goodacre R, Wright KT, Perry J, Hulme CH. Bridging the Gap: A Scoping Review of Pre-Analytical Variability in Biofluid Metabolomics. Applied Biosciences. 2026; 5(1):10. https://doi.org/10.3390/applbiosci5010010
Chicago/Turabian StyleLadha, Yumna, Sushmita Sanaka, Adam Burke, Royston Goodacre, Karina T. Wright, Jade Perry, and Charlotte H. Hulme. 2026. "Bridging the Gap: A Scoping Review of Pre-Analytical Variability in Biofluid Metabolomics" Applied Biosciences 5, no. 1: 10. https://doi.org/10.3390/applbiosci5010010
APA StyleLadha, Y., Sanaka, S., Burke, A., Goodacre, R., Wright, K. T., Perry, J., & Hulme, C. H. (2026). Bridging the Gap: A Scoping Review of Pre-Analytical Variability in Biofluid Metabolomics. Applied Biosciences, 5(1), 10. https://doi.org/10.3390/applbiosci5010010